Visual Analytics

Predictive Analytics In Powerpoint And Google Slides Cpb
Introducing our well designed Predictive Analytics In Powerpoint And Google Slides Cpb. This PowerPoint design presents information on topics like Predictive Analytics. As it is predesigned it helps boost your confidence level. It also makes you a better presenter because of its high quality content and graphics. This PPT layout can be downloaded and used in different formats like PDF, PNG, and JPG. Not only this, it is available in both Standard Screen and Widescreen aspect ratios for your convenience. Therefore, click on the download button now to persuade and impress your audience. Our Predictive Analytics In Powerpoint And Google Slides Cpb are topically designed to provide an attractive backdrop to any subject. Use them to look like a presentation pro.
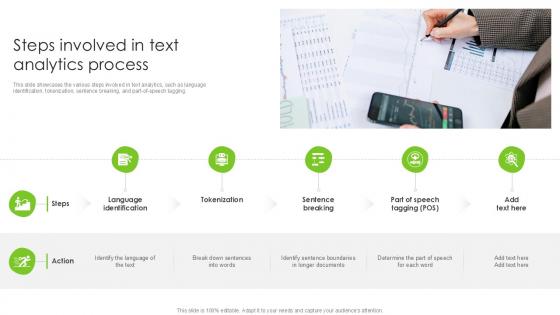
Steps Involved In Text Analytics Process PPT Presentation SS
This slide showcases the various steps involved in text analytics, such as language identification, tokenization, sentence breaking, and part-of-speech tagging. This Steps Involved In Text Analytics Process PPT Presentation SS from Slidegeeks makes it easy to present information on your topic with precision. It provides customization options, so you can make changes to the colors, design, graphics, or any other component to create a unique layout. It is also available for immediate download, so you can begin using it right away. Slidegeeks has done good research to ensure that you have everything you need to make your presentation stand out. Make a name out there for a brilliant performance. This slide showcases the various steps involved in text analytics, such as language identification, tokenization, sentence breaking, and part-of-speech tagging.

Text Analytics Integration Best Practices PPT Slide SS
This slide describes the guidelines for integrating text analytics with existing systems, covering defining goals and scope, preprocessing the text, and so on. This Text Analytics Integration Best Practices PPT Slide SS from Slidegeeks makes it easy to present information on your topic with precision. It provides customization options, so you can make changes to the colors, design, graphics, or any other component to create a unique layout. It is also available for immediate download, so you can begin using it right away. Slidegeeks has done good research to ensure that you have everything you need to make your presentation stand out. Make a name out there for a brilliant performance. This slide describes the guidelines for integrating text analytics with existing systems, covering defining goals and scope, preprocessing the text, and so on.
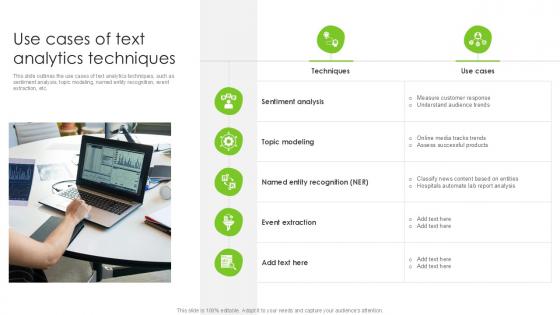
Use Cases Of Text Analytics Techniques PPT Slide SS
This slide outlines the use cases of text analytics techniques, such as sentiment analysis, topic modeling, named entity recognition, event extraction, etc. This Use Cases Of Text Analytics Techniques PPT Slide SS from Slidegeeks makes it easy to present information on your topic with precision. It provides customization options, so you can make changes to the colors, design, graphics, or any other component to create a unique layout. It is also available for immediate download, so you can begin using it right away. Slidegeeks has done good research to ensure that you have everything you need to make your presentation stand out. Make a name out there for a brilliant performance. This slide outlines the use cases of text analytics techniques, such as sentiment analysis, topic modeling, named entity recognition, event extraction, etc.
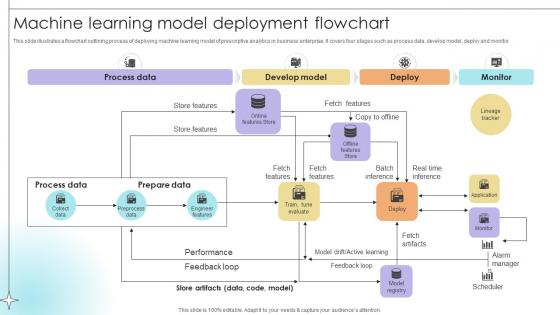
Machine Learning Model Deployment Flowchart Data Analytics SS V
This slide illustrates a flowchart outlining process of deploying machine learning model of prescriptive analytics in business enterprise. It covers four stages such as process data, develop model, deploy and monitor.If your project calls for a presentation, then Slidegeeks is your go-to partner because we have professionally designed, easy-to-edit templates that are perfect for any presentation. After downloading, you can easily edit Machine Learning Model Deployment Flowchart Data Analytics SS V and make the changes accordingly. You can rearrange slides or fill them with different images. Check out all the handy templates This slide illustrates a flowchart outlining process of deploying machine learning model of prescriptive analytics in business enterprise. It covers four stages such as process data, develop model, deploy and monitor.

Adobe Analytics Reports In Powerpoint And Google Slides Cpb
Introducing our well designed Adobe Analytics Reports In Powerpoint And Google Slides Cpb. This PowerPoint design presents information on topics like Adobe Analytics Reports. As it is predesigned it helps boost your confidence level. It also makes you a better presenter because of its high quality content and graphics. This PPT layout can be downloaded and used in different formats like PDF, PNG, and JPG. Not only this, it is available in both Standard Screen and Widescreen aspect ratios for your convenience. Therefore, click on the download button now to persuade and impress your audience. Our Adobe Analytics Reports In Powerpoint And Google Slides Cpb are topically designed to provide an attractive backdrop to any subject. Use them to look like a presentation pro.
Technica Data Analytics In Powerpoint And Google Slides Cpb
Presenting our innovatively designed set of slides titled Technica Data Analytics In Powerpoint And Google Slides Cpb. This completely editable PowerPoint graphic exhibits Technica Data Analytics that will help you convey the message impactfully. It can be accessed with Google Slides and is available in both standard screen and widescreen aspect ratios. Apart from this, you can download this well structured PowerPoint template design in different formats like PDF, JPG, and PNG. So, click the download button now to gain full access to this PPT design. Our Technica Data Analytics In Powerpoint And Google Slides Cpb are topically designed to provide an attractive backdrop to any subject. Use them to look like a presentation pro.
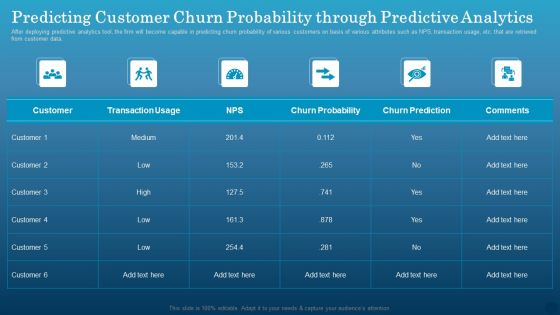
Predicting Customer Churn Probability Through Predictive Analytics Inspiration PDF
After deploying predictive analytics tool, the firm will become capable in predicting churn probability of various customers on basis of various attributes such as NPS, transaction usage, etc. that are retrieved from customer data. Coming up with a presentation necessitates that the majority of the effort goes into the content and the message you intend to convey. The visuals of a PowerPoint presentation can only be effective if it supplements and supports the story that is being told. Keeping this in mind our experts created Predicting Customer Churn Probability Through Predictive Analytics Inspiration PDF to reduce the time that goes into designing the presentation. This way, you can concentrate on the message while our designers take care of providing you with the right template for the situation.
Business Analytics Application Employee Engagement Key Performance Metrics Icons PDF
This slide represents key metrics dashboard to analyze the engagement of employees in the organization. It includes details related to KPIs such as engagement score, response rate, net promoter score etc. Formulating a presentation can take up a lot of effort and time, so the content and message should always be the primary focus. The visuals of the PowerPoint can enhance the presenters message, so our Business Analytics Application Employee Engagement Key Performance Metrics Icons PDF was created to help save time. Instead of worrying about the design, the presenter can concentrate on the message while our designers work on creating the ideal templates for whatever situation is needed. Slidegeeks has experts for everything from amazing designs to valuable content, we have put everything into Business Analytics Application Employee Engagement Key Performance Metrics Icons PDF.
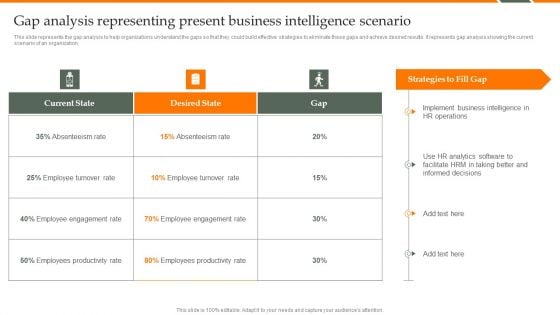
Human Resource Analytics Gap Analysis Representing Present Business Microsoft PDF
This slide represents the gap analysis to help organizations understand the gaps so that they could build effective strategies to eliminate these gaps and achieve desired results. It represents gap analysis showing the current scenario of an organization. Formulating a presentation can take up a lot of effort and time, so the content and message should always be the primary focus. The visuals of the PowerPoint can enhance the presenters message, so our Human Resource Analytics Gap Analysis Representing Present Business Microsoft PDF was created to help save time. Instead of worrying about the design, the presenter can concentrate on the message while our designers work on creating the ideal templates for whatever situation is needed. Slidegeeks has experts for everything from amazing designs to valuable content, we have put everything into Human Resource Analytics Gap Analysis Representing Present Business Microsoft PDF.
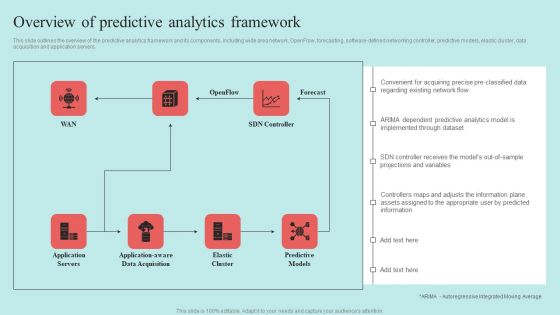
Predictive Data Model Overview Of Predictive Analytics Framework Summary PDF
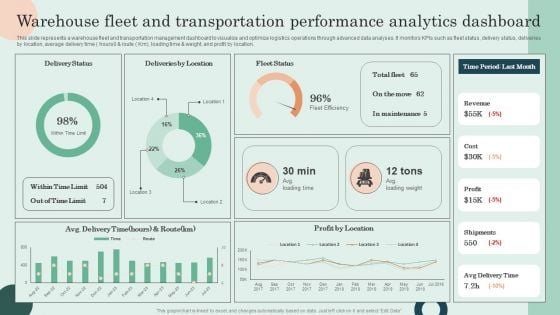
Warehouse Fleet And Transportation Performance Analytics Dashboard Pictures PDF
This slide represents a warehouse fleet and transportation management dashboard to visualize and optimize logistics operations through advanced data analyses. It monitors KPIs such as fleet status, delivery status, deliveries by location, average delivery time hours0 and route Km, loading time and weight, and profit by location. Do you have to make sure that everyone on your team knows about any specific topic I yes, then you should give Warehouse Fleet And Transportation Performance Analytics Dashboard Pictures PDF a try. Our experts have put a lot of knowledge and effort into creating this impeccable Warehouse Fleet And Transportation Performance Analytics Dashboard Pictures PDF. You can use this template for your upcoming presentations, as the slides are perfect to represent even the tiniest detail. You can download these templates from the Slidegeeks website and these are easy to edit. So grab these today
Analytics Company Investor Funding Elevator Pitch Deck Ppt Template
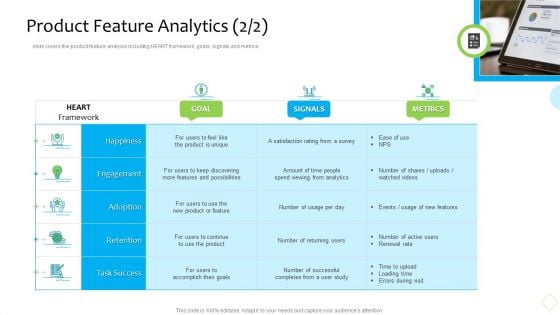
Product Demand Administration Product Feature Analytics Goal Structure PDF
slide covers the product feature analysis including heart framework, goals, signals and metrics. This is a product demand administration objectives of requirement document portrait pdf template with various stages. Focus and dispense information on one stages using this creative set, that comes with editable features. It contains large content boxes to add your information on topics like analytics, survey, goal, metrics. You can also showcase facts, figures, and other relevant content using this PPT layout. Grab it now.
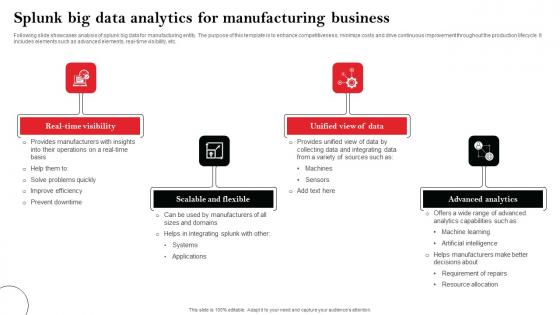
Splunk Big Data Analytics For Manufacturing Business Ideas Pdf
Following slide showcases analysis of splunk big data for manufacturing entity. The purpose of this template is to enhance competitiveness, minimize costs and drive continuous improvement throughout the production lifecycle. It includes elements such as advanced elements, real-time visibility, etc. Pitch your topic with ease and precision using this Splunk Big Data Analytics For Manufacturing Business Ideas Pdf This layout presents information on Real-Time Visibility, Scalable And Flexible, Advanced Analytics It is also available for immediate download and adjustment. So, changes can be made in the color, design, graphics or any other component to create a unique layout. Following slide showcases analysis of splunk big data for manufacturing entity. The purpose of this template is to enhance competitiveness, minimize costs and drive continuous improvement throughout the production lifecycle. It includes elements such as advanced elements, real-time visibility, etc.
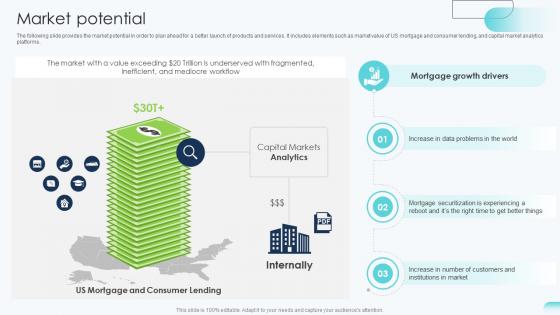
Market Potential Big Data Analytics Investor Funding Elevator Pitch Deck
The following slide provides the market potential in order to plan ahead for a better launch of products and services. It includes elements such as market value of US mortgage and consumer lending, and capital market analytics platforms. Are you in need of a template that can accommodate all of your creative concepts This one is crafted professionally and can be altered to fit any style. Use it with Google Slides or PowerPoint. Include striking photographs, symbols, depictions, and other visuals. Fill, move around, or remove text boxes as desired. Test out color palettes and font mixtures. Edit and save your work, or work with colleagues. Download Market Potential Big Data Analytics Investor Funding Elevator Pitch Deck and observe how to make your presentation outstanding. Give an impeccable presentation to your group and make your presentation unforgettable. The following slide provides the market potential in order to plan ahead for a better launch of products and services. It includes elements such as market value of US mortgage and consumer lending, and capital market analytics platforms.
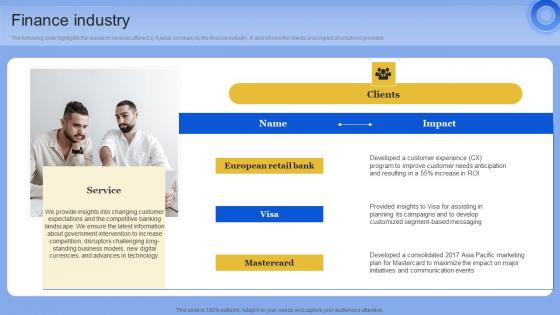
Finance Industry Data Analytics Company Outline Summary PDF
The following slide highlights the research services offered by Kantar company to the finance industry. It also shows the clients and impact of solutions provided. If your project calls for a presentation, then Slidegeeks is your go-to partner because we have professionally designed, easy-to-edit templates that are perfect for any presentation. After downloading, you can easily edit Finance Industry Data Analytics Company Outline Summary PDF and make the changes accordingly. You can rearrange slides or fill them with different images. Check out all the handy templates The following slide highlights the research services offered by Kantar company to the finance industry. It also shows the clients and impact of solutions provided
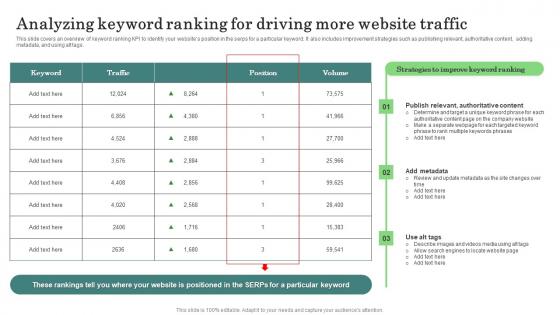
Analyzing Keyword Ranking Major Promotional Analytics Future Trends Graphics Pdf
This slide covers an overview of keyword ranking KPI to identify your websites position in the serps for a particular keyword. It also includes improvement strategies such as publishing relevant, authoritative content, adding metadata, and using alt tags. Want to ace your presentation in front of a live audience Our Analyzing Keyword Ranking Major Promotional Analytics Future Trends Graphics Pdf can help you do that by engaging all the users towards you. Slidegeeks experts have put their efforts and expertise into creating these impeccable powerpoint presentations so that you can communicate your ideas clearly. Moreover, all the templates are customizable, and easy to edit and downloadable. Use these for both personal and commercial use. This slide covers an overview of keyword ranking KPI to identify your websites position in the serps for a particular keyword. It also includes improvement strategies such as publishing relevant, authoritative content, adding metadata, and using alt tags.
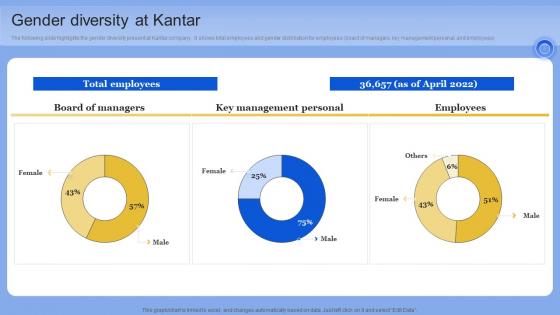
Gender Diversity At Kantar Data Analytics Company Outline Portrait PDF
The following slide highlights the gender diversity present at Kantar company. It shows total employees and gender distribution for employees board of managers, key management personal, and employees. If you are looking for a format to display your unique thoughts, then the professionally designed Gender Diversity At Kantar Data Analytics Company Outline Portrait PDF is the one for you. You can use it as a Google Slides template or a PowerPoint template. Incorporate impressive visuals, symbols, images, and other charts. Modify or reorganize the text boxes as you desire. Experiment with shade schemes and font pairings. Alter, share or cooperate with other people on your work. Download Gender Diversity At Kantar Data Analytics Company Outline Portrait PDF and find out how to give a successful presentation. Present a perfect display to your team and make your presentation unforgettable. The following slide highlights the gender diversity present at Kantar company. It shows total employees and gender distribution for employees board of managers, key management personal, and employees
Dashboard Tracking Business Major Promotional Analytics Future Trends Clipart Pdf
This slide covers the dashboard for analyzing blogging KPIs such as performance, published posts, views, new blog subscribers, top blog posts by pageviews, top blog posts by CTR, etc. If you are looking for a format to display your unique thoughts, then the professionally designed Dashboard Tracking Business Major Promotional Analytics Future Trends Clipart Pdf is the one for you. You can use it as a Google Slides template or a PowerPoint template. Incorporate impressive visuals, symbols, images, and other charts. Modify or reorganize the text boxes as you desire. Experiment with shade schemes and font pairings. Alter, share or cooperate with other people on your work. Download Dashboard Tracking Business Major Promotional Analytics Future Trends Clipart Pdf and find out how to give a successful presentation. Present a perfect display to your team and make your presentation unforgettable. This slide covers the dashboard for analyzing blogging KPIs such as performance, published posts, views, new blog subscribers, top blog posts by pageviews, top blog posts by CTR, etc.
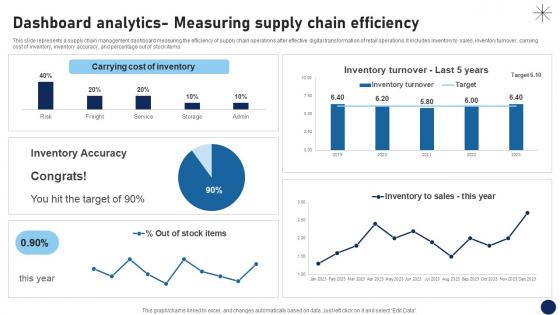
Dashboard Analytics Measuring Supply Chain Efficiency DT SS V
This slide represents a supply chain management dashboard measuring the efficiency of supply chain operations after effective digital transformation of retail operations. It includes inventory to sales, inventory turnover, carrying cost of inventory, inventory accuracy, and percentage out of stock items.If you are looking for a format to display your unique thoughts, then the professionally designed Dashboard Analytics Measuring Supply Chain Efficiency DT SS V is the one for you. You can use it as a Google Slides template or a PowerPoint template. Incorporate impressive visuals, symbols, images, and other charts. Modify or reorganize the text boxes as you desire. Experiment with shade schemes and font pairings. Alter, share or cooperate with other people on your work. Download Dashboard Analytics Measuring Supply Chain Efficiency DT SS V and find out how to give a successful presentation. Present a perfect display to your team and make your presentation unforgettable. This slide represents a supply chain management dashboard measuring the efficiency of supply chain operations after effective digital transformation of retail operations. It includes inventory to sales, inventory turnover, carrying cost of inventory, inventory accuracy, and percentage out of stock items.
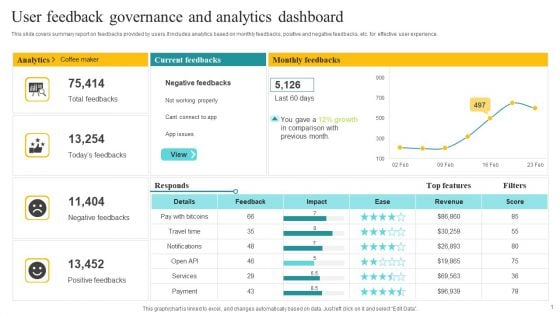
User Feedback Governance And Analytics Dashboard Ppt Professional Rules PDF
This slide covers summary report on feedbacks provided by users.It includes analytics based on monthly feedbacks, positive and negative feedbacks, etc. for effective user experience. Pitch your topic with ease and precision using this User Feedback Governance And Analytics Dashboard Ppt Professional Rules PDF. This layout presents information on Current Feedbacks, Monthly Feedbacks, Analytics. It is also available for immediate download and adjustment. So, changes can be made in the color, design, graphics or any other component to create a unique layout.
Data Requirements For Analytics Dashboard Icon Graphics PDF
Showcasing this set of slides titled data requirements for analytics dashboard icon graphics pdf. The topics addressed in these templates are data requirements for analytics dashboard icon. All the content presented in this PPT design is completely editable. Download it and make adjustments in color, background, font etc. as per your unique business setting.

Analytics Based Marketing Ppt Powerpoint Presentation Complete Deck With Slides
Improve your presentation delivery using this Analytics Based Marketing Ppt Powerpoint Presentation Complete Deck With Slides Support your business vision and objectives using this well-structured PPT deck. This template offers a great starting point for delivering beautifully designed presentations on the topic of your choice. Comprising twenty this professionally designed template is all you need to host discussion and meetings with collaborators. Each slide is self-explanatory and equipped with high-quality graphics that can be adjusted to your needs. Therefore, you will face no difficulty in portraying your desired content using this PPT slideshow. This PowerPoint slideshow contains every important element that you need for a great pitch. It is not only editable but also available for immediate download and utilization. The color, font size, background, shapes everything can be modified to create your unique presentation layout. Therefore, download it now. Our Analytics Based Marketing Ppt Powerpoint Presentation Complete Deck With Slides are topically designed to provide an attractive backdrop to any subject. Use them to look like a presentation pro.
HR Analytics Metrics Ppt Powerpoint Presentation Complete Deck With Slides
Improve your presentation delivery using this HR Analytics Metrics Ppt Powerpoint Presentation Complete Deck With Slides Support your business vision and objectives using this well-structured PPT deck. This template offers a great starting point for delivering beautifully designed presentations on the topic of your choice. Comprising twelve this professionally designed template is all you need to host discussion and meetings with collaborators. Each slide is self-explanatory and equipped with high-quality graphics that can be adjusted to your needs. Therefore, you will face no difficulty in portraying your desired content using this PPT slideshow. This PowerPoint slideshow contains every important element that you need for a great pitch. It is not only editable but also available for immediate download and utilization. The color, font size, background, shapes everything can be modified to create your unique presentation layout. Therefore, download it now. Our HR Analytics Metrics Ppt Powerpoint Presentation Complete Deck With Slides are topically designed to provide an attractive backdrop to any subject. Use them to look like a presentation pro.
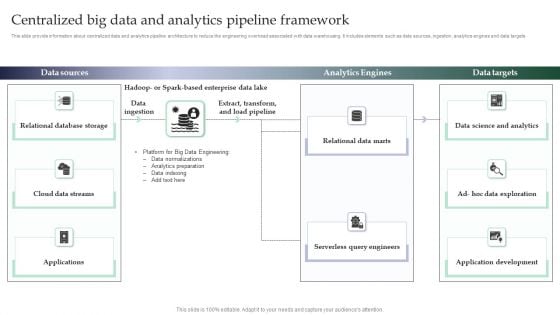
Centralized Big Data And Analytics Pipeline Framework Brochure PDF
This slide provide information about centralized data and analytics pipeline architecture to reduce the engineering overhead associated with data warehousing. It includes elements such as data sources, ingestion, analytics engines and data targets Pitch your topic with ease and precision using this Centralized Big Data And Analytics Pipeline Framework Brochure PDF. This layout presents information on Data Sources, Analytics Engines, Data Targets . It is also available for immediate download and adjustment. So, changes can be made in the color, design, graphics or any other component to create a unique layout.
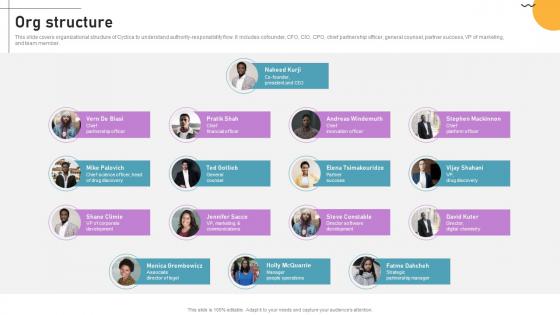
Org Structure Cloud Based Predictive Analytics Software Pitch Deck
This slide covers organizational structure of Cyclica to understand authority-responsibility flow. It includes cofounder, CFO, CIO, CPO, chief partnership officer, general counsel, partner success, VP of marketing, and team member. Are you in need of a template that can accommodate all of your creative concepts This one is crafted professionally and can be altered to fit any style. Use it with Google Slides or PowerPoint. Include striking photographs, symbols, depictions, and other visuals. Fill, move around, or remove text boxes as desired. Test out color palettes and font mixtures. Edit and save your work, or work with colleagues. Download Org Structure Cloud Based Predictive Analytics Software Pitch Deck and observe how to make your presentation outstanding. Give an impeccable presentation to your group and make your presentation unforgettable. This slide covers organizational structure of Cyclica to understand authority-responsibility flow. It includes cofounder, CFO, CIO, CPO, chief partnership officer, general counsel, partner success, VP of marketing, and team member.
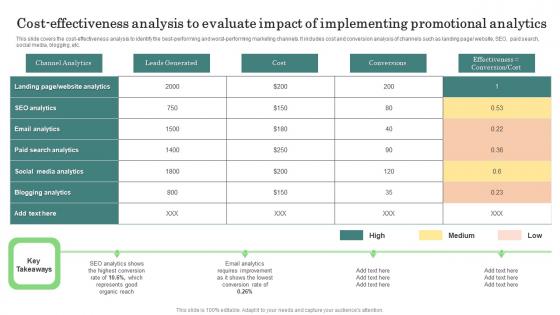
Cost Effectiveness Analysis Major Promotional Analytics Future Trends Download Pdf
This slide covers the cost effectiveness analysis to identify the best performing and worst performing marketing channels. It includes cost and conversion analysis of channels such as landing page website, SEO, paid search, social media, blogging, etc. If your project calls for a presentation, then Slidegeeks is your go to partner because we have professionally designed, easy to edit templates that are perfect for any presentation. After downloading, you can easily edit Cost Effectiveness Analysis Major Promotional Analytics Future Trends Download Pdf and make the changes accordingly. You can rearrange slides or fill them with different images. Check out all the handy templates This slide covers the cost effectiveness analysis to identify the best performing and worst performing marketing channels. It includes cost and conversion analysis of channels such as landing page website, SEO, paid search, social media, blogging, etc.
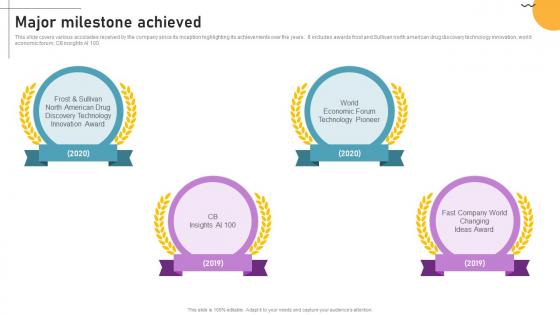
Major Milestone Achieved Cloud Based Predictive Analytics Software Pitch Deck
This slide covers various accolades received by the company since its inception highlighting its achievements over the years. It includes awards frost and Sullivan north american drug discovery technology innovation, world economic forum, CB insights AI 100. If your project calls for a presentation, then Slidegeeks is your go-to partner because we have professionally designed, easy-to-edit templates that are perfect for any presentation. After downloading, you can easily edit Major Milestone Achieved Cloud Based Predictive Analytics Software Pitch Deck and make the changes accordingly. You can rearrange slides or fill them with different images. Check out all the handy templates This slide covers various accolades received by the company since its inception highlighting its achievements over the years. It includes awards frost and Sullivan north american drug discovery technology innovation, world economic forum, CB insights AI 100.

Key Facts Big Data Analytics Investor Funding Elevator Pitch Deck
This slide includes key facts about the company to monitor and assess the companys performance. It covers data related to securitization, unique page views, platforms and services added, and unique mortgage data points analyzed. If your project calls for a presentation, then Slidegeeks is your go-to partner because we have professionally designed, easy-to-edit templates that are perfect for any presentation. After downloading, you can easily edit Key Facts Big Data Analytics Investor Funding Elevator Pitch Deck and make the changes accordingly. You can rearrange slides or fill them with different images. Check out all the handy templates This slide includes key facts about the company to monitor and assess the companys performance. It covers data related to securitization, unique page views, platforms and services added, and unique mortgage data points analyzed.

Analytics Based Metrics For Measurable Marketing Guidelines Pdf
This slide shows data driven metrics that can be used to measure productivity and results of implemented marketing strategy. It include metrics such as website traffic, return on investment and customer churn rate etc.Pitch your topic with ease and precision using this Analytics Based Metrics For Measurable Marketing Guidelines Pdf This layout presents information on Website Traffic, Return Investment, Customer Churn Rate It is also available for immediate download and adjustment. So, changes can be made in the color, design, graphics or any other component to create a unique layout. This slide shows data driven metrics that can be used to measure productivity and results of implemented marketing strategy. It include metrics such as website traffic, return on investment and customer churn rate etc.
Comparing Future Analytics Based Marketing With Other Trends Icons Pdf
This slide shows comparison of future data driven marketing size with other trends such as digital marketing and influencer marketing. It include key insights, future market size of various marketing trends etc.Pitch your topic with ease and precision using this Comparing Future Analytics Based Marketing With Other Trends Icons Pdf This layout presents information on Influencer Marketing, Digital Marketing, Data Driven Marketing It is also available for immediate download and adjustment. So, changes can be made in the color, design, graphics or any other component to create a unique layout. This slide shows comparison of future data driven marketing size with other trends such as digital marketing and influencer marketing. It include key insights, future market size of various marketing trends etc.
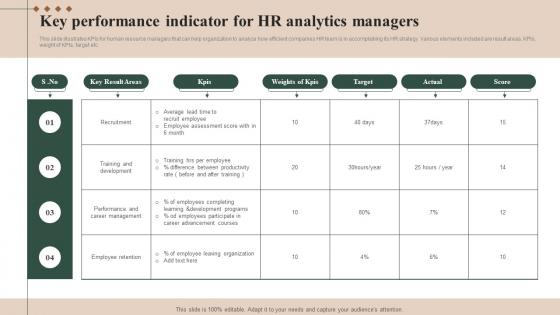
Key Performance Indicator For HR Analytics Managers Brochure Pdf
This slide illustrates KPIs for human resource managers that can help organization to analyze how efficient companies HR team is in accomplishing its HR strategy. Various elements included are result areas, KPIs, weight of KPIs, target etc.Pitch your topic with ease and precision using this Key Performance Indicator For HR Analytics Managers Brochure Pdf This layout presents information on Training Development, Career Management, Employee Retention It is also available for immediate download and adjustment. So, changes can be made in the color, design, graphics or any other component to create a unique layout. This slide illustrates KPIs for human resource managers that can help organization to analyze how efficient companies HR team is in accomplishing its HR strategy. Various elements included are result areas, KPIs, weight of KPIs, target etc.
Social Media Engagement Strategy KPI Analytics Ppt Icon Examples Pdf
This slide outlines the specific KPIs and improvement measurement that based on social media strategy and objectives. It includes various KPIs such as followers, engagement rate, reach, impressions and conversion rate. Pitch your topic with ease and precision using this Social Media Engagement Strategy KPI Analytics Ppt Icon Examples Pdf. This layout presents information on Engagement Rate, Reach, Impressions, Conversion Rate. It is also available for immediate download and adjustment. So, changes can be made in the color, design, graphics or any other component to create a unique layout. This slide outlines the specific KPIs and improvement measurement that based on social media strategy and objectives. It includes various KPIs such as followers, engagement rate, reach, impressions and conversion rate.

Core Team Financial Analytics Platform Investor Elevator Pitch Deck
This slide provides information regarding key leaders involved in investment decisions. Some of the designations include founder and chief executive officer, chief operating officer, vice president of sales, and vice president of operations. This Core Team Financial Analytics Platform Investor Elevator Pitch Deck from Slidegeeks makes it easy to present information on your topic with precision. It provides customization options, so you can make changes to the colors, design, graphics, or any other component to create a unique layout. It is also available for immediate download, so you can begin using it right away. Slidegeeks has done good research to ensure that you have everything you need to make your presentation stand out. Make a name out there for a brilliant performance. This slide provides information regarding key leaders involved in investment decisions. Some of the designations include founder and chief executive officer, chief operating officer, vice president of sales, and vice president of operations.
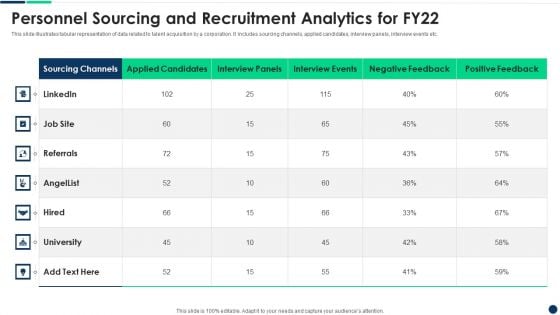
Personnel Sourcing And Recruitment Analytics For FY22 Diagrams PDF
Pitch your topic with ease and precision using this Personnel Sourcing And Recruitment Analytics For FY22 Diagrams PDF This layout presents information on Personnel Sourcing And Recruitment Analytics For Fy22 It is also available for immediate download and adjustment. So, changes can be made in the color, design, graphics or any other component to create a unique layout.
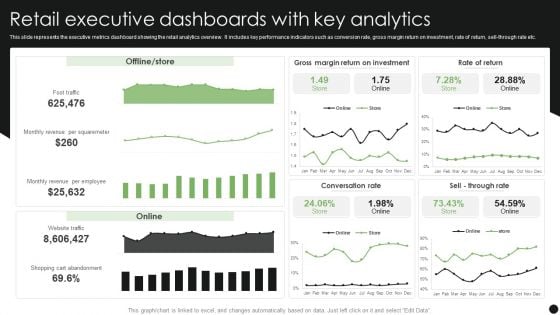
Retail Executive Dashboards With Key Analytics Guidelines PDF
Pitch your topic with ease and precision using this Retail Executive Dashboards With Key Analytics Guidelines PDF. This layout presents information on Retail Executive Dashboards, Key Analytics. It is also available for immediate download and adjustment. So, changes can be made in the color, design, graphics or any other component to create a unique layout.
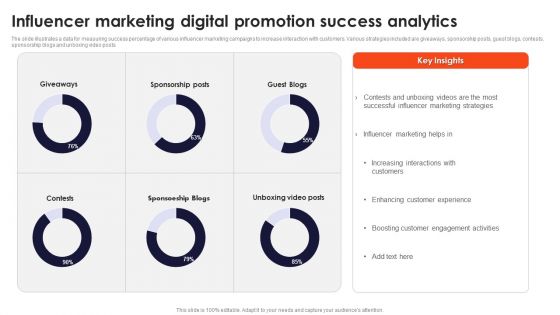
Influencer Marketing Digital Promotion Success Analytics Structure PDF
Pitch your topic with ease and precision using this Influencer Marketing Digital Promotion Success Analytics Structure PDF. This layout presents information on Digital Promotion, Success Analytics. It is also available for immediate download and adjustment. So, changes can be made in the color, design, graphics or any other component to create a unique layout.
Project Personnel Planning Analytics Dashboard Icon Infographics PDF
Pitch your topic with ease and precision using this Project Personnel Planning Analytics Dashboard Icon Infographics PDF. This layout presents information on Project Personnel Planning, Analytics Dashboard Icon. It is also available for immediate download and adjustment. So, changes can be made in the color, design, graphics or any other component to create a unique layout.
Big Data Security Analytics Icon With Shield Symbol Background PDF
Pitch your topic with ease and precision using this Big Data Security Analytics Icon With Shield Symbol Background PDF. This layout presents information on Big Data Security Analytics, Icon With Shield Symbol. It is also available for immediate download and adjustment. So, changes can be made in the color, design, graphics or any other component to create a unique layout.

Market Potential Cloud Based Predictive Analytics Software Pitch Deck
This slide showcases market share and growth driver of biotechnology market in which Cyclica operates. It showcases the market potential of Alfred camera through SOM, SAM and TAM value of global biotechnology market. If you are looking for a format to display your unique thoughts, then the professionally designed Market Potential Cloud Based Predictive Analytics Software Pitch Deck is the one for you. You can use it as a Google Slides template or a PowerPoint template. Incorporate impressive visuals, symbols, images, and other charts. Modify or reorganize the text boxes as you desire. Experiment with shade schemes and font pairings. Alter, share or cooperate with other people on your work. Download Market Potential Cloud Based Predictive Analytics Software Pitch Deck and find out how to give a successful presentation. Present a perfect display to your team and make your presentation unforgettable. This slide showcases market share and growth driver of biotechnology market in which Cyclica operates. It showcases the market potential of Alfred camera through SOM, SAM and TAM value of global biotechnology market.
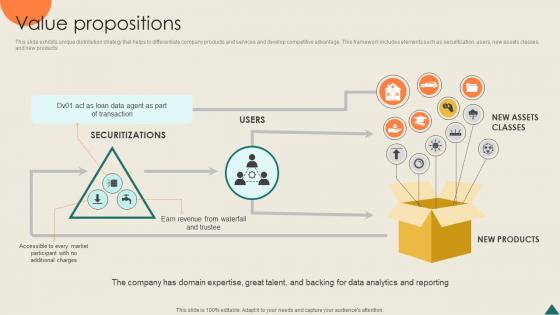
Value Propositions Financial Analytics Platform Investor Elevator Pitch Deck
This slide exhibits unique distribution strategy that helps to differentiate company products and services and develop competitive advantage. This framework includes elements such as securitization, users, new assets classes, and new products. If you are looking for a format to display your unique thoughts, then the professionally designed Value Propositions Financial Analytics Platform Investor Elevator Pitch Deck is the one for you. You can use it as a Google Slides template or a PowerPoint template. Incorporate impressive visuals, symbols, images, and other charts. Modify or reorganize the text boxes as you desire. Experiment with shade schemes and font pairings. Alter, share or cooperate with other people on your work. Download Value Propositions Financial Analytics Platform Investor Elevator Pitch Deck and find out how to give a successful presentation. Present a perfect display to your team and make your presentation unforgettable. This slide exhibits unique distribution strategy that helps to differentiate company products and services and develop competitive advantage. This framework includes elements such as securitization, users, new assets classes, and new products.
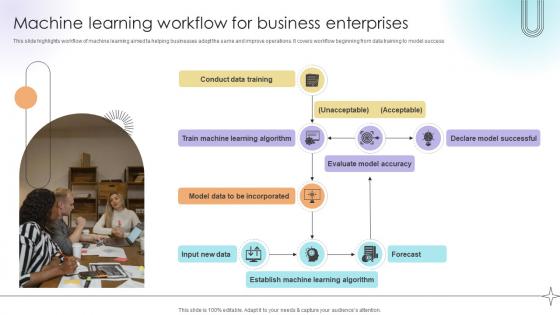
Machine Learning Workflow For Business Enterprises Data Analytics SS V
This slide highlights workflow of machine learning aimed ta helping businesses adopt the same and improve operations. It covers workflow beginning from data training to model success.If you are looking for a format to display your unique thoughts, then the professionally designed Machine Learning Workflow For Business Enterprises Data Analytics SS V is the one for you. You can use it as a Google Slides template or a PowerPoint template. Incorporate impressive visuals, symbols, images, and other charts. Modify or reorganize the text boxes as you desire. Experiment with shade schemes and font pairings. Alter, share or cooperate with other people on your work. Download Machine Learning Workflow For Business Enterprises Data Analytics SS V and find out how to give a successful presentation. Present a perfect display to your team and make your presentation unforgettable. This slide highlights workflow of machine learning aimed ta helping businesses adopt the same and improve operations. It covers workflow beginning from data training to model success.
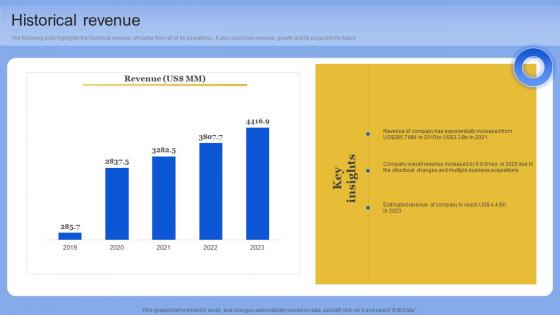
Historical Revenue Data Analytics Company Outline Information PDF
The following slide highlights the historical revenue of Kantar from all of its operations. It also describes revenue growth and its projection for future. This modern and well-arranged Historical Revenue Data Analytics Company Outline Information PDF provides lots of creative possibilities. It is very simple to customize and edit with the Powerpoint Software. Just drag and drop your pictures into the shapes. All facets of this template can be edited with Powerpoint, no extra software is necessary. Add your own material, put your images in the places assigned for them, adjust the colors, and then you can show your slides to the world, with an animated slide included. The following slide highlights the historical revenue of Kantar from all of its operations. It also describes revenue growth and its projection for future
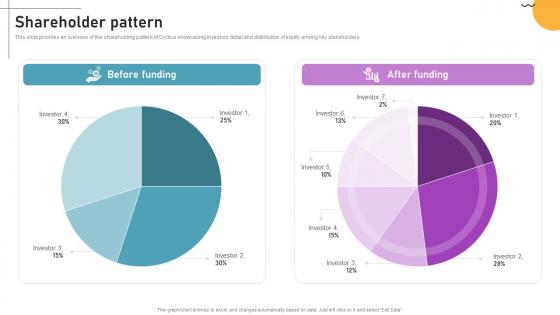
Shareholder Pattern Cloud Based Predictive Analytics Software Pitch Deck
This slide provides an overview of the shareholding pattern of Cyclica showcasing investors detail and distribution of equity among key stakeholders. This modern and well-arranged Shareholder Pattern Cloud Based Predictive Analytics Software Pitch Deck provides lots of creative possibilities. It is very simple to customize and edit with the Powerpoint Software. Just drag and drop your pictures into the shapes. All facets of this template can be edited with Powerpoint, no extra software is necessary. Add your own material, put your images in the places assigned for them, adjust the colors, and then you can show your slides to the world, with an animated slide included. This slide provides an overview of the shareholding pattern of Cyclica showcasing investors detail and distribution of equity among key stakeholders.
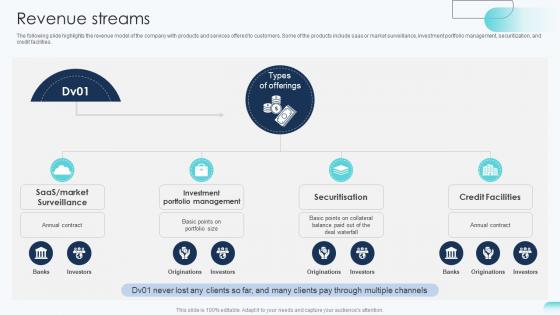
Revenue Streams Big Data Analytics Investor Funding Elevator Pitch Deck
The following slide highlights the revenue model of the company with products and services offered to customers. Some of the products include saas or market surveillance, investment portfolio management, securitization, and credit facilities. This modern and well-arranged Revenue Streams Big Data Analytics Investor Funding Elevator Pitch Deck provides lots of creative possibilities. It is very simple to customize and edit with the Powerpoint Software. Just drag and drop your pictures into the shapes. All facets of this template can be edited with Powerpoint, no extra software is necessary. Add your own material, put your images in the places assigned for them, adjust the colors, and then you can show your slides to the world, with an animated slide included. The following slide highlights the revenue model of the company with products and services offered to customers. Some of the products include saas or market surveillance, investment portfolio management, securitization, and credit facilities.
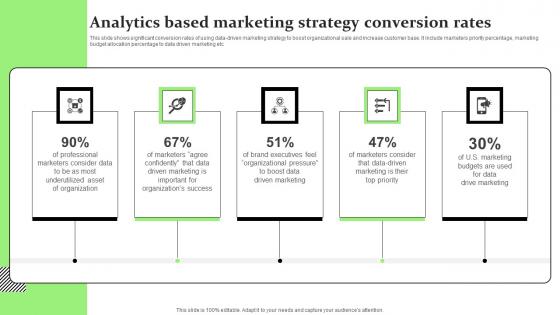
Analytics Based Marketing Strategy Conversion Rates Ideas Pdf
This slide shows significant conversion rates of using data driven marketing strategy to boost organizational sale and increase customer base. It include marketers priority percentage, marketing budget allocation percentage to data driven marketing etc.Pitch your topic with ease and precision using this Analytics Based Marketing Strategy Conversion Rates Ideas Pdf This layout presents information on Organizations Success, Driven Marketing, Organizational Pressure It is also available for immediate download and adjustment. So, changes can be made in the color, design, graphics or any other component to create a unique layout. This slide shows significant conversion rates of using data driven marketing strategy to boost organizational sale and increase customer base. It include marketers priority percentage, marketing budget allocation percentage to data driven marketing etc.
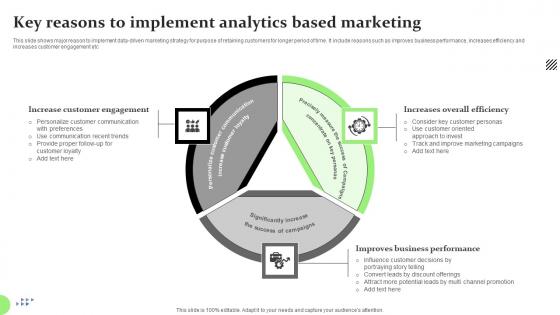
Key Reasons To Implement Analytics Based Marketing Diagrams Pdf
This slide shows major reason to implement data driven marketing strategy for purpose of retaining customers for longer period of time. It include reasons such as improves business performance, increases efficiency and increases customer engagement etc.Pitch your topic with ease and precision using this Key Reasons To Implement Analytics Based Marketing Diagrams Pdf This layout presents information on Increase Customer Engagement, Increases Overall Efficiency, Improves Business Performance It is also available for immediate download and adjustment. So, changes can be made in the color, design, graphics or any other component to create a unique layout. This slide shows major reason to implement data driven marketing strategy for purpose of retaining customers for longer period of time. It include reasons such as improves business performance, increases efficiency and increases customer engagement etc.
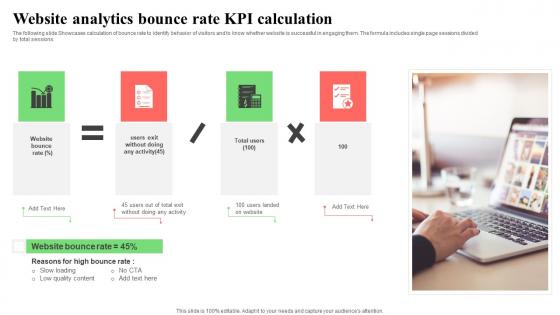
Website Analytics Bounce Rate KPI Calculation Topics Pdf
The following slide Showcases calculation of bounce rate to identify behavior of visitors and to know whether website is successful in engaging them. The formula includes single page sessions divided by total sessions. Pitch your topic with ease and precision using this Website Analytics Bounce Rate KPI Calculation Topics Pdf. This layout presents information on Website Bounce Rate, Slow Loading, Low Quality Content. It is also available for immediate download and adjustment. So, changes can be made in the color, design, graphics or any other component to create a unique layout. The following slide Showcases calculation of bounce rate to identify behavior of visitors and to know whether website is successful in engaging them. The formula includes single page sessions divided by total sessions.

HR Analytics Metrics For Data Driven Decision Summary Pdf
This slide illustrates human resource key performance indicators that help organization to analyze actionable insights for taking effective and date driven decision. It includes KPIs such as recruitment, employee engagement, retention and diversity and inclusion.Pitch your topic with ease and precision using this HR Analytics Metrics For Data Driven Decision Summary Pdf This layout presents information on Estimate Accumulated, Involved Recruitment, Provide Actionable Insight It is also available for immediate download and adjustment. So, changes can be made in the color, design, graphics or any other component to create a unique layout. This slide illustrates human resource key performance indicators that help organization to analyze actionable insights for taking effective and date driven decision. It includes KPIs such as recruitment, employee engagement, retention and diversity and inclusion.
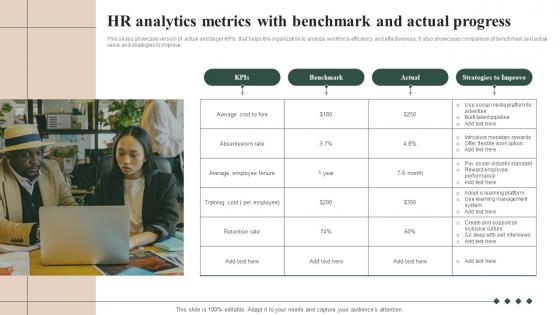
HR Analytics Metrics With Benchmark And Actual Progress Topics Pdf
This slides showcase version of actual and target KPIs that helps the organization to analyze workforce efficiency and effectiveness. It also showcases comparison of benchmark and actual value and strategies to improve,Pitch your topic with ease and precision using this HR Analytics Metrics With Benchmark And Actual Progress Topics Pdf This layout presents information on Average Employee Tenure, Absenteeism Rate, Average Cost It is also available for immediate download and adjustment. So, changes can be made in the color, design, graphics or any other component to create a unique layout. This slides showcase version of actual and target KPIs that helps the organization to analyze workforce efficiency and effectiveness. It also showcases comparison of benchmark and actual value and strategies to improve.
Human Resource Analytics Metrics For Business Startups Icons Pdf
This slide illustrates KPI for human resource department that help organization to analyze current workforce performance efficiency. It include key performance indicators such as turnover ratio, talent rating, training cost etc.Pitch your topic with ease and precision using this Human Resource Analytics Metrics For Business Startups Icons Pdf This layout presents information on Hiring Cost, Turnover Ratio, Talent Rating It is also available for immediate download and adjustment. So, changes can be made in the color, design, graphics or any other component to create a unique layout. This slide illustrates KPI for human resource department that help organization to analyze current workforce performance efficiency. It include key performance indicators such as turnover ratio, talent rating, training cost etc.
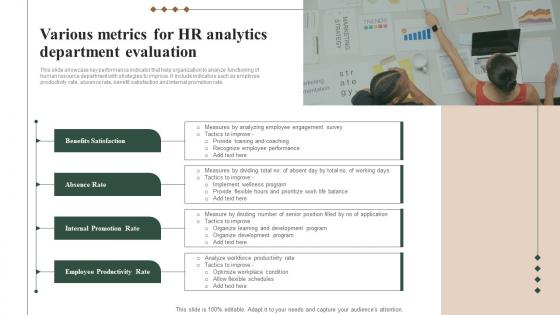
Various Metrics For HR Analytics Department Evaluation Background Pdf
This slide showcase key performance indicator that help organization to analyze functioning of human resource department with strategies to improve. It include indicators such as employee productivity rate, absence rate, benefit satisfaction and internal promotion rate.Pitch your topic with ease and precision using this Various Metrics For HR Analytics Department Evaluation Background Pdf This layout presents information on Benefits Satisfaction, Internal Promotion Rate, Employee Productivity Rate It is also available for immediate download and adjustment. So, changes can be made in the color, design, graphics or any other component to create a unique layout. This slide showcase key performance indicator that help organization to analyze functioning of human resource department with strategies to improve. It include indicators such as employee productivity rate, absence rate, benefit satisfaction and internal promotion rate.
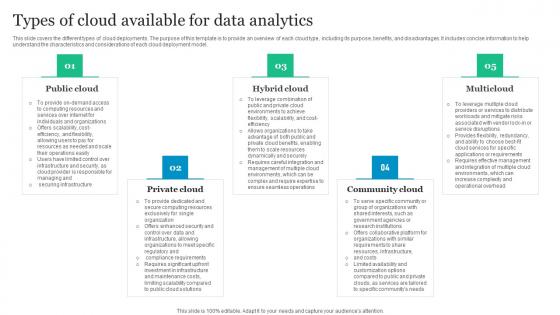
Types Of Cloud Available For Data Analytics Brochure Pdf
This slide covers the different types of cloud deployments. The purpose of this template is to provide an overview of each cloud type, including its purpose, benefits, and disadvantages. It includes concise information to help understand the characteristics and considerations of each cloud deployment model. Pitch your topic with ease and precision using this Types Of Cloud Available For Data Analytics Brochure Pdf. This layout presents information on Public Cloud, Hybrid Cloud, Community Cloud. It is also available for immediate download and adjustment. So, changes can be made in the color, design, graphics or any other component to create a unique layout. This slide covers the different types of cloud deployments. The purpose of this template is to provide an overview of each cloud type, including its purpose, benefits, and disadvantages. It includes concise information to help understand the characteristics and considerations of each cloud deployment model.
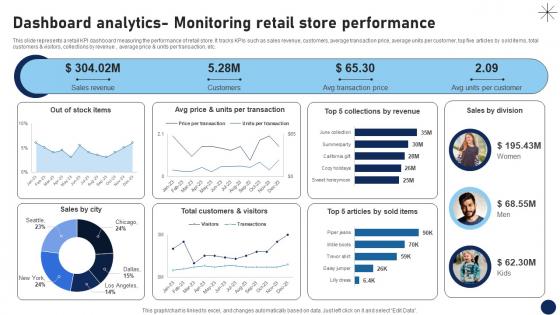
Dashboard Analytics Monitoring Retail Store Performance DT SS V
This slide represents a retail KPI dashboard measuring the performance of retail store. It tracks KPIs such as sales revenue, customers, average transaction price, average units per customer, top five articles by sold items, total customers and visitors, collections by revenue , average price and units per transaction, etc.Are you in need of a template that can accommodate all of your creative concepts This one is crafted professionally and can be altered to fit any style. Use it with Google Slides or PowerPoint. Include striking photographs, symbols, depictions, and other visuals. Fill, move around, or remove text boxes as desired. Test out color palettes and font mixtures. Edit and save your work, or work with colleagues. Download Dashboard Analytics Monitoring Retail Store Performance DT SS V and observe how to make your presentation outstanding. Give an impeccable presentation to your group and make your presentation unforgettable. This slide represents a retail KPI dashboard measuring the performance of retail store. It tracks KPIs such as sales revenue, customers, average transaction price, average units per customer, top five articles by sold items, total customers and visitors, collections by revenue , average price and units per transaction, etc.
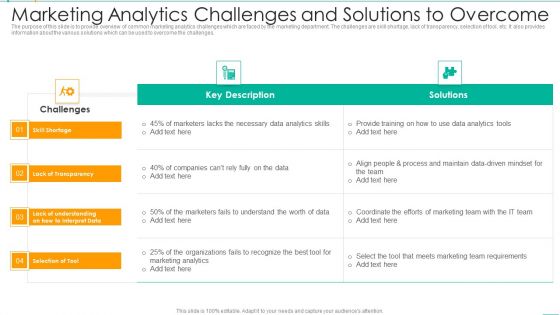
Marketing Analytics Challenges And Solutions To Overcome Template PDF
The purpose of this slide is to provide overview of common marketing analytics challenges which are faced by the marketing department. The challenges are skill shortage, lack of transparency, selection of tool, etc. It also provides information about the various solutions which can be used to overcome the challenges. Pitch your topic with ease and precision using this Marketing Analytics Challenges And Solutions To Overcome Template PDF. This layout presents information on Marketers, Data Analytics, Team. It is also available for immediate download and adjustment. So, changes can be made in the color, design, graphics or any other component to create a unique layout.
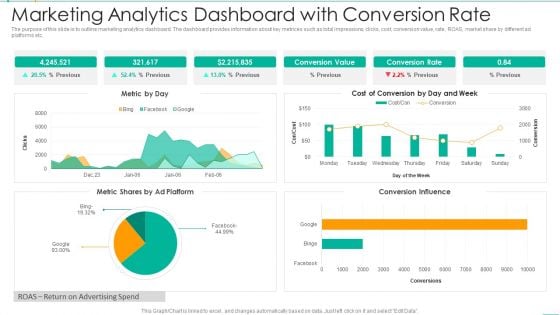
Marketing Analytics Dashboard With Conversion Rate Summary PDF
The purpose of this slide is to outline marketing analytics dashboard. The dashboard provides information about key metrices such as total impressions, clicks, cost, conversion value, rate, ROAS, market share by different ad platforms etc. Pitch your topic with ease and precision using this Marketing Analytics Dashboard With Conversion Rate Summary PDF. This layout presents information on Marketing Analytics Dashboard With Conversion Rate. It is also available for immediate download and adjustment. So, changes can be made in the color, design, graphics or any other component to create a unique layout.
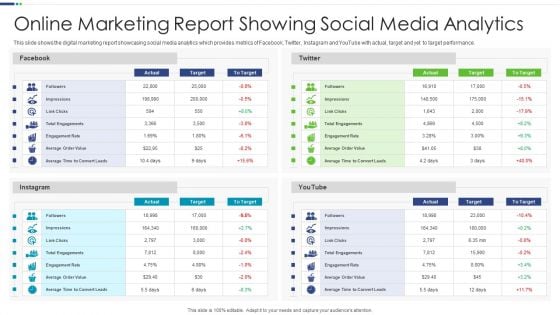
Online Marketing Report Showing Social Media Analytics Mockup PDF
This slide shows the digital marketing report showcasing social media analytics which provides metrics of Facebook, Twitter, Instagram and YouTube with actual, target and yet to target performance.Pitch your topic with ease and precision using this Online Marketing Report Showing Social Media Analytics Mockup PDF This layout presents information on Total Engagements, Marketing Report, Showing Analytics It is also available for immediate download and adjustment. So, changes can be made in the color, design, graphics or any other component to create a unique layout.
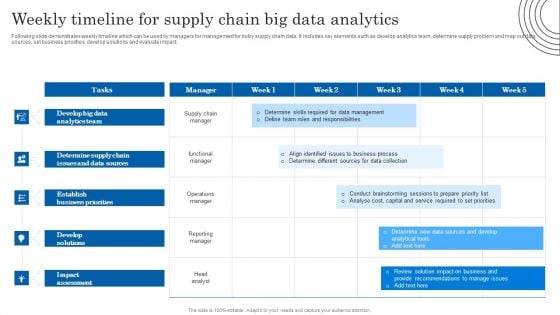
Weekly Timeline For Supply Chain Big Data Analytics Introduction PDF
Following slide demonstrates weekly timeline which can be used by managers for management for bulky supply chain data. It includes key elements such as develop analytics team, determine supply problem and map out data sources, set business priorities, develop solutions and evaluate impact. Pitch your topic with ease and precision using this Weekly Timeline For Supply Chain Big Data Analytics Introduction PDF. This layout presents information on Determine Supply Chain, Data Sources, Analytics Team. It is also available for immediate download and adjustment. So, changes can be made in the color, design, graphics or any other component to create a unique layout.
E Mail Performance Analytics Metrics Tracking Report Analysis Demonstration PDF
The purpose of this slide is to showcase an e-mail analytics mechanism in order to track the performance of certain e-mail marketing based on various metrics. Certain KPIs include open rate, click rate, unsubscribe rate etc. Pitch your topic with ease and precision using this E Mail Performance Analytics Metrics Tracking Report Analysis Demonstration PDF. This layout presents information on E Mail Performance Analytics, Metrics Tracking Report Analysis. It is also available for immediate download and adjustment. So, changes can be made in the color, design, graphics or any other component to create a unique layout.


 Continue with Email

 Home
Home


