Year Over Year Growth
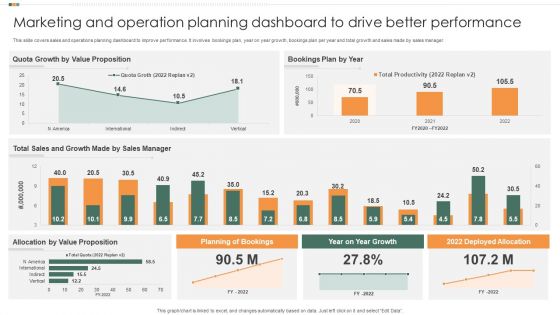
Marketing And Operation Planning Dashboard To Drive Better Performance Graphics PDF
This slide covers sales and operations planning dashboard to improve performance. It involves bookings plan, year on year growth, bookings plan per year and total growth and sales made by sales manager. Showcasing this set of slides titled Marketing And Operation Planning Dashboard To Drive Better Performance Graphics PDF. The topics addressed in these templates are Sales Manager, Growth Made, Bookings Plan By Year. All the content presented in this PPT design is completely editable. Download it and make adjustments in color, background, font etc. as per your unique business setting.
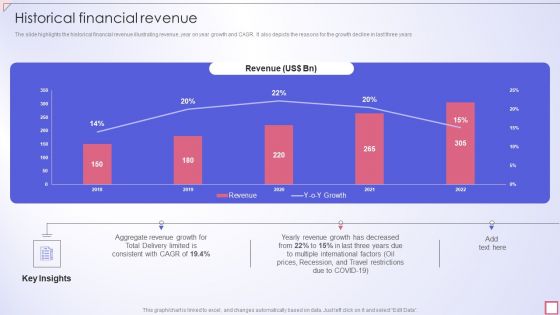
Freight Shipping Company Profile Historical Financial Revenue Guidelines PDF
The slide highlights the historical financial revenue illustrating revenue, year on year growth and CAGR. It also depicts the reasons for the growth decline in last three years.Deliver and pitch your topic in the best possible manner with this Freight Shipping Company Profile Historical Financial Revenue Guidelines PDF. Use them to share invaluable insights on Global Offices, Employees, Offices and impress your audience. This template can be altered and modified as per your expectations. So, grab it now.
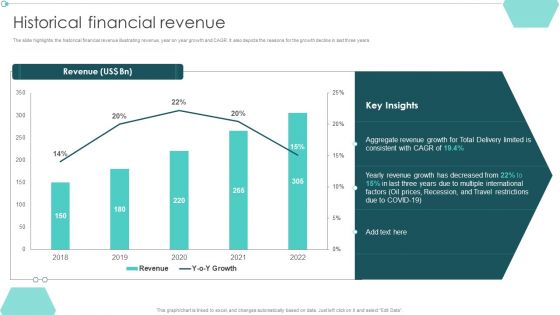
Transportation Company Profile Historical Financial Revenue Ppt PowerPoint Presentation File Layout PDF
The slide highlights the historical financial revenue illustrating revenue, year on year growth and CAGR. It also depicts the reasons for the growth decline in last three years.Deliver and pitch your topic in the best possible manner with this Transportation Company Profile Historical Financial Revenue Ppt PowerPoint Presentation File Layout PDF. Use them to share invaluable insights on Aggregate Revenue, Multiple International, Prices Recession and impress your audience. This template can be altered and modified as per your expectations. So, grab it now.
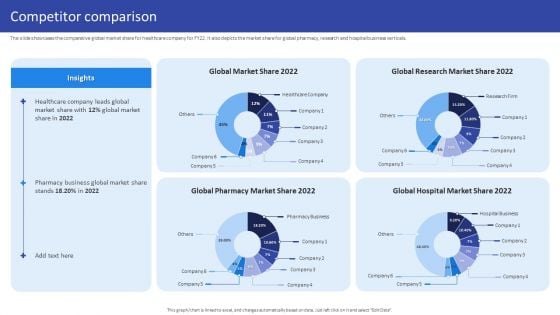
Hospital Medical Research Company Profile Competitor Comparison Inspiration PDF
The slide showcases the healthcare company historical yearly growth for profit and revenue. It also showcases comparative revenue and profit year on year growth for pharmacy, hospital and research business verticals. Deliver an awe inspiring pitch with this creative Hospital Medical Research Company Profile Competitor Comparison Inspiration PDF bundle. Topics like Global Market, Share 2022, Global Research, Market Share 2022 can be discussed with this completely editable template. It is available for immediate download depending on the needs and requirements of the user.
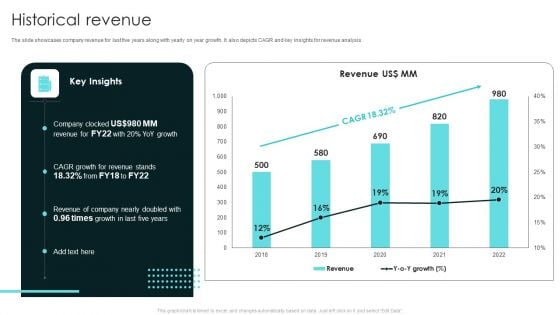
Term Life And General Insurance Company Profile Historical Revenue Designs PDF
The slide showcases company revenue for last five years along with yearly on year growth. It also depicts CAGR and key insights for revenue analysis. Deliver and pitch your topic in the best possible manner with this Term Life And General Insurance Company Profile Historical Revenue Designs PDF. Use them to share invaluable insights on Revenue, Growth and impress your audience. This template can be altered and modified as per your expectations. So, grab it now.
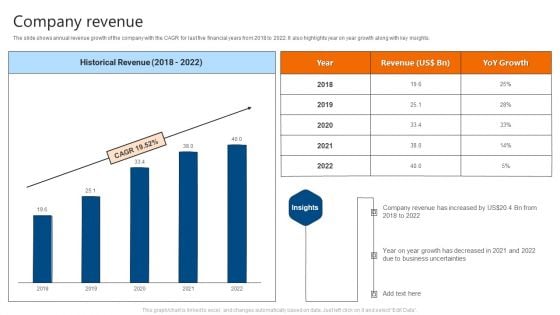
Company Revenue IT Software Development Company Profile Demonstration PDF
The slide shows annual revenue growth of the company with the CAGR for last five financial years from 2018 to 2022. It also highlights year on year growth along with key insights. Deliver an awe inspiring pitch with this creative Company Revenue IT Software Development Company Profile Demonstration PDF bundle. Topics like Company Revenue, Historical Revenue can be discussed with this completely editable template. It is available for immediate download depending on the needs and requirements of the user.
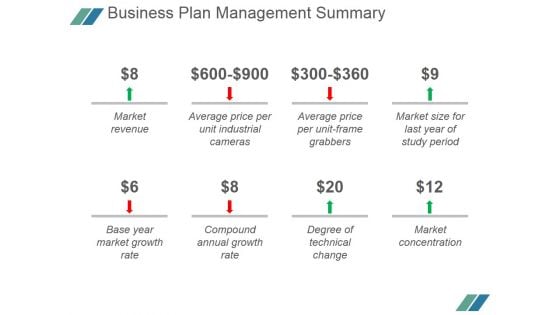
Business Plan Management Summary Ppt PowerPoint Presentation Rules
This is a business plan management summary ppt powerpoint presentation rules. This is a eight stage process. The stages in this process are market revenue, average price per unit industrial cameras, average price per unit frame grabbers, market size for last year of study period, base year market growth rate, compound annual growth rate, degree of technical change, market concentration.
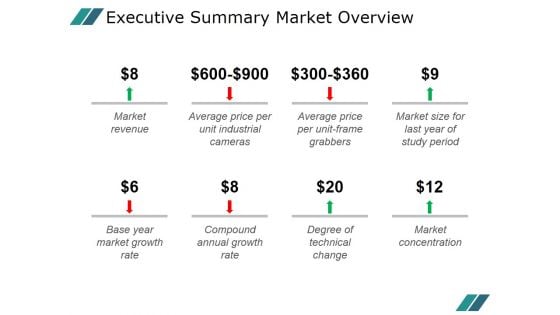
Executive Summary Market Overview Ppt PowerPoint Presentation Templates
This is a executive summary market overview ppt powerpoint presentation templates. This is a eight stage process. The stages in this process are market revenue, average price per unit industrial cameras, average price per unit frame grabbers, market size for last year of study period, base year market growth rate, compound annual growth rate, degree of technical change.
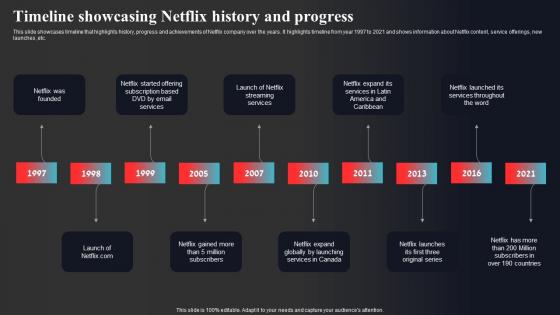
Timeline Showcasing Netflix History And Progress Enhancing Online Visibility Download Pdf
This slide showcases timeline that highlights history, progress and achievements of Netflix company over the years. It highlights timeline from year 1997 to 2021 and shows information about Netflix content, service offerings, new launches, etc. Explore a selection of the finest Timeline Showcasing Netflix History And Progress Enhancing Online Visibility Download Pdf here. With a plethora of professionally designed and pre-made slide templates, you can quickly and easily find the right one for your upcoming presentation. You can use our Timeline Showcasing Netflix History And Progress Enhancing Online Visibility Download Pdf to effectively convey your message to a wider audience. Slidegeeks has done a lot of research before preparing these presentation templates. The content can be personalized and the slides are highly editable. Grab templates today from Slidegeeks. This slide showcases timeline that highlights history, progress and achievements of Netflix company over the years. It highlights timeline from year 1997 to 2021 and shows information about Netflix content, service offerings, new launches, etc.
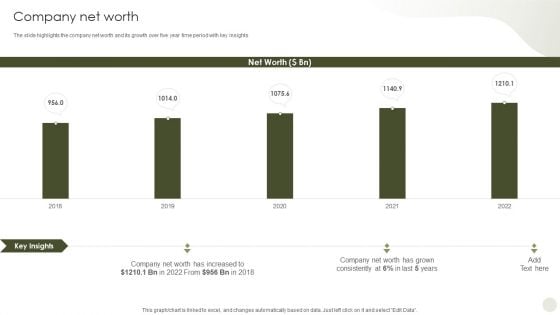
Commercial Bank Financial Services Company Profile Company Net Worth Template PDF
The slide highlights the company net worth and its growth over five year time period with key insights. Deliver an awe inspiring pitch with this creative Commercial Bank Financial Services Company Profile Company Net Worth Template PDF bundle. Topics like Company Net Worth can be discussed with this completely editable template. It is available for immediate download depending on the needs and requirements of the user.
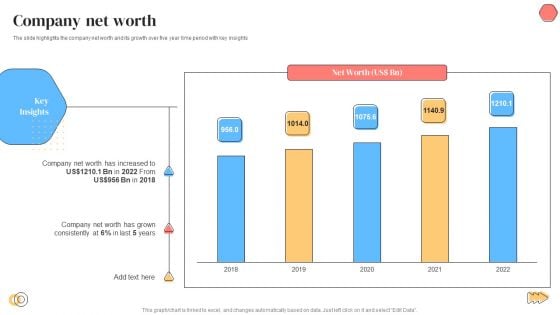
Banking Solutions Company Overview Company Net Worth Infographics PDF
The slide highlights the company net worth and its growth over five year time period with key insights. Deliver and pitch your topic in the best possible manner with this Banking Solutions Company Overview Company Net Worth Infographics PDF. Use them to share invaluable insights on Company Net Worth, Key Insights and impress your audience. This template can be altered and modified as per your expectations. So, grab it now.
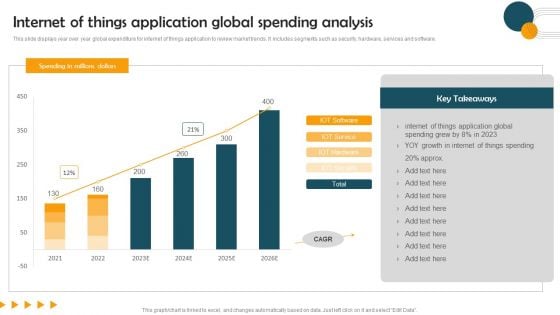
Internet Of Things Application Global Spending Analysis Guidelines PDF
This slide displays year over year global expenditure for internet of things application to review market trends. It includes segments such as security, hardware, services and software. Showcasing this set of slides titled Internet Of Things Application Global Spending Analysis Guidelines PDF. The topics addressed in these templates are Internet Of Things Application, Global Spending Analysis. All the content presented in this PPT design is completely editable. Download it and make adjustments in color, background, font etc. as per your unique business setting.
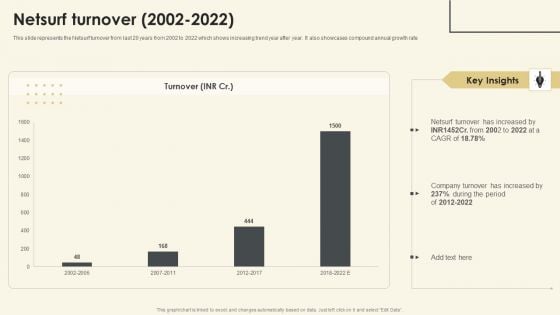
Netsurf Business Profile Netsurf Turnover 2002 To 2022 Ppt Gallery Rules PDF
This slide represents the Netsurf turnover from last 20 years from 2002 to 2022 which shows increasing trend year after year. It also showcases compound annual growth rate. Deliver an awe inspiring pitch with this creative Netsurf Business Profile Netsurf Turnover 2002 To 2022 Ppt Gallery Rules PDF bundle. Topics like Netsurf Turnover, 2002 To 2022, Company Turnover can be discussed with this completely editable template. It is available for immediate download depending on the needs and requirements of the user.
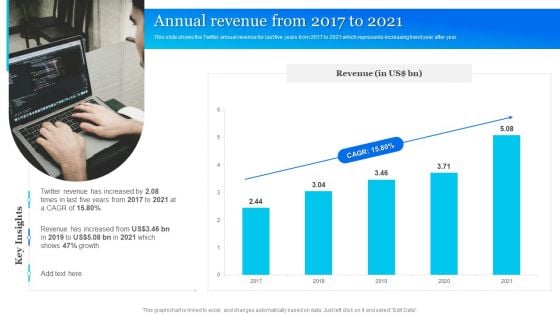
Twitter Company Summary Annual Revenue From 2017 To 2021 Inspiration PDF
This slide shows the Twitter annual revenue for last five years from 2017 to 2021 which represents increasing trend year after year. Deliver and pitch your topic in the best possible manner with this Twitter Company Summary Annual Revenue From 2017 To 2021 Inspiration PDF. Use them to share invaluable insights on Annual Revenue, Growth and impress your audience. This template can be altered and modified as per your expectations. So, grab it now.
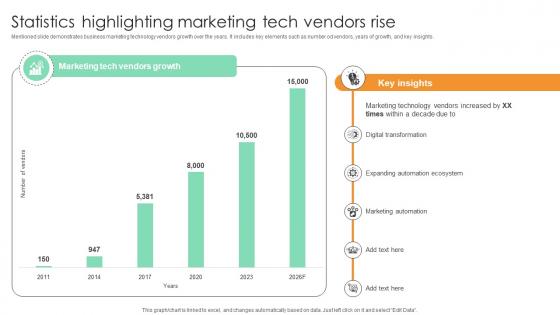
Statistics Highlighting Marketing Tech Vendors Rise Comprehensive Guide For Marketing Technology
Mentioned slide demonstrates business marketing technology vendors growth over the years. It includes key elements such as number od vendors, years of growth, and key insights. Want to ace your presentation in front of a live audience Our Statistics Highlighting Marketing Tech Vendors Rise Comprehensive Guide For Marketing Technology can help you do that by engaging all the users towards you. Slidegeeks experts have put their efforts and expertise into creating these impeccable powerpoint presentations so that you can communicate your ideas clearly. Moreover, all the templates are customizable, and easy-to-edit and downloadable. Use these for both personal and commercial use. Mentioned slide demonstrates business marketing technology vendors growth over the years. It includes key elements such as number od vendors, years of growth, and key insights.
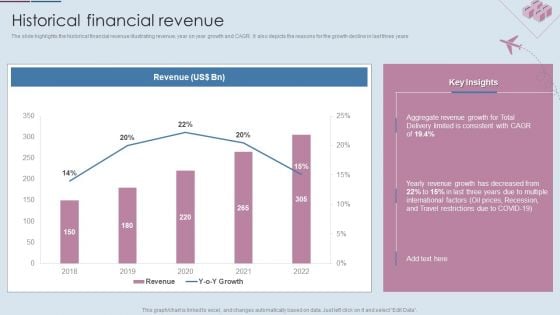
Logistics Shipment Company Profile Historical Financial Revenue Ppt Gallery Templates PDF
The slide highlights the historical financial revenue illustrating revenue, year on year growth and CAGR. It also depicts the reasons for the growth decline in last three years. Deliver and pitch your topic in the best possible manner with this Logistics Shipment Company Profile Historical Financial Revenue Ppt Gallery Templates PDF. Use them to share invaluable insights on Revenue, 2018 To 2022, Aggregate Revenue Growth and impress your audience. This template can be altered and modified as per your expectations. So, grab it now.
Infotech Solutions Research And Development Company Summary Company Revenue Icons PDF
The slide shows annual revenue growth of the company with the CAGR for last five financial years from 2018 to 2022. It also highlights year on year growth along with key insights. Deliver and pitch your topic in the best possible manner with this Infotech Solutions Research And Development Company Summary Company Revenue Icons PDF. Use them to share invaluable insights on Business Uncertainties, Growth, Company Revenue and impress your audience. This template can be altered and modified as per your expectations. So, grab it now.
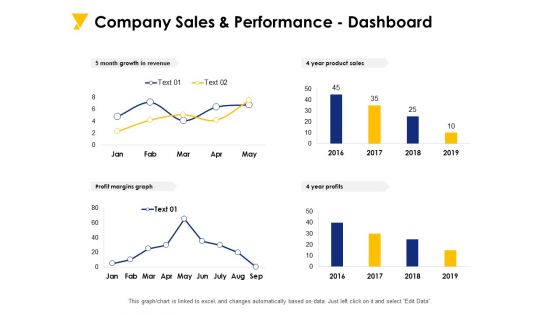
Company Sales And Performance Dashboard Ppt PowerPoint Presentation Model Ideas
Presenting this set of slides with name company sales and performance dashboard ppt powerpoint presentation model ideas. The topics discussed in these slides are 5 month growth in revenue, 4 year product sales, profit margins graph, 4 year profits . This is a completely editable PowerPoint presentation and is available for immediate download. Download now and impress your audience.
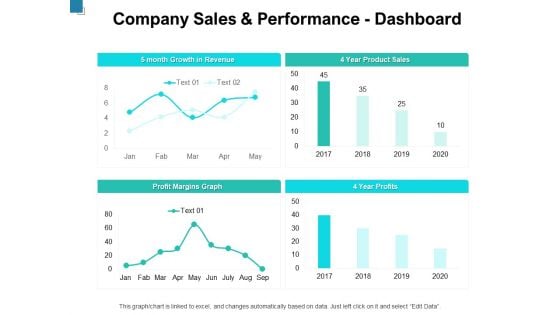
Company Sales And Performance Dashboard Ppt PowerPoint Presentation Slides Background
Presenting this set of slides with name company sales and performance dashboard ppt powerpoint presentation slides background. The topics discussed in these slides are 5 month growth in revenue, 4 year product sales, profit margins graph, 4 year profits. This is a completely editable PowerPoint presentation and is available for immediate download. Download now and impress your audience.
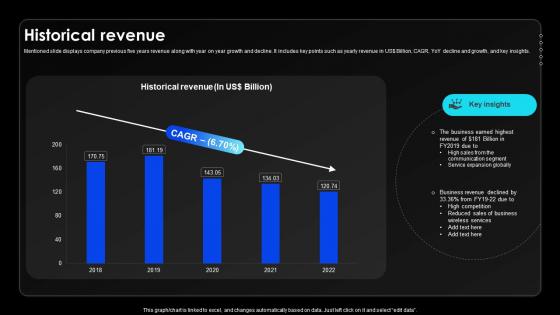
Historical Revenue Wireless Communication Services Provider Company Profile CP SS V
Mentioned slide displays company previous five years revenue along with year on year growth and decline. It includes key points such as yearly revenue in US dollar Billion, CAGR, YoY decline and growth, and key insights.Formulating a presentation can take up a lot of effort and time, so the content and message should always be the primary focus. The visuals of the PowerPoint can enhance the presenters message, so our Historical Revenue Wireless Communication Services Provider Company Profile CP SS V was created to help save time. Instead of worrying about the design, the presenter can concentrate on the message while our designers work on creating the ideal templates for whatever situation is needed. Slidegeeks has experts for everything from amazing designs to valuable content, we have put everything into Historical Revenue Wireless Communication Services Provider Company Profile CP SS V. Mentioned slide displays company previous five years revenue along with year on year growth and decline. It includes key points such as yearly revenue in US dollar Billion, CAGR, YoY decline and growth, and key insights.
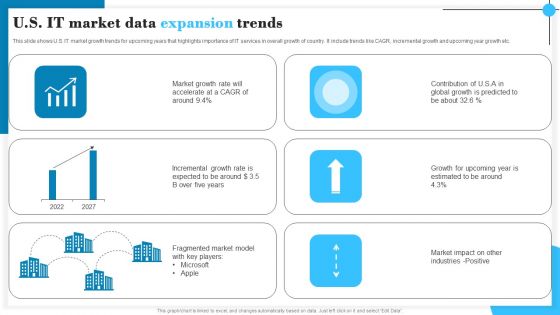
U S IT Market Data Expansion Trends Pictures PDF
This slide shows U.S. IT market growth trends for upcoming years that highlights importance of IT services in overall growth of country. It include trends like CAGR, incremental growth and upcoming year growth etc. Showcasing this set of slides titled U S IT Market Data Expansion Trends Pictures PDF. The topics addressed in these templates are Market Growth, Contribution, Incremental Growth. All the content presented in this PPT design is completely editable. Download it and make adjustments in color, background, font etc. as per your unique business setting.
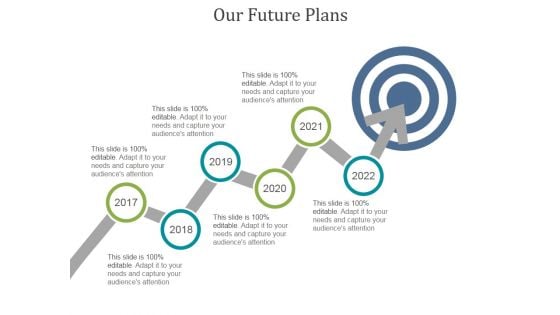
Our Future Plans Ppt PowerPoint Presentation Portfolio
This is a our future plans ppt powerpoint presentation portfolio. This is a six stage process. The stages in this process are business, years, growth, analysis, strategy, success.
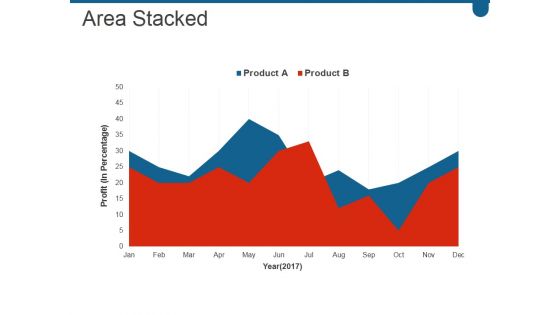
Area Stacked Ppt PowerPoint Presentation Infographics Designs Download
This is a area stacked ppt powerpoint presentation infographics designs download. This is a two stage process. The stages in this process are years, growth, success, business, marketing.
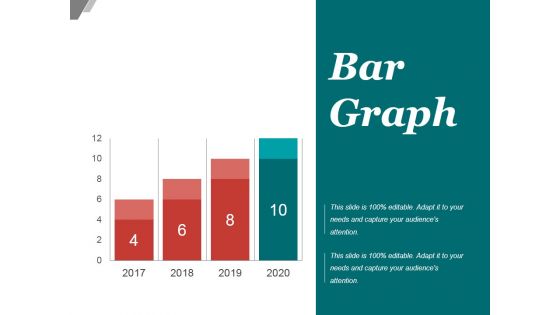
Bar Graph Ppt PowerPoint Presentation Design Templates
This is a bar graph ppt powerpoint presentation design templates. This is a four stage process. The stages in this process are business, marketing, success, growth, years.
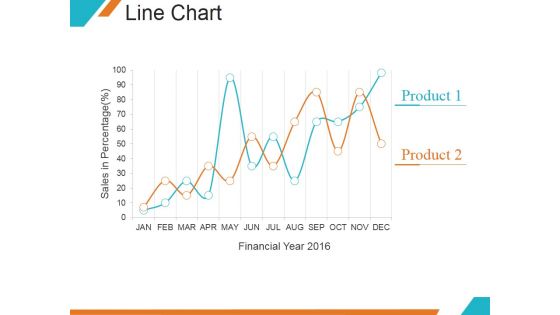
Line Chart Ppt PowerPoint Presentation Samples
This is a line chart ppt powerpoint presentation samples. This is a two stage process. The stages in this process are financial year, product, growth, marketing.
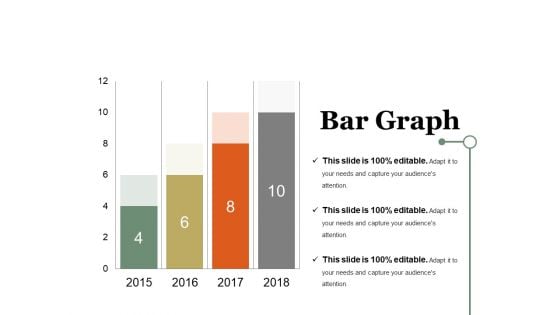
Bar Graph Ppt PowerPoint Presentation Summary Inspiration
This is a bar graph ppt powerpoint presentation summary inspiration. This is a four stage process. The stages in this process are graph, business, marketing, growth, years.
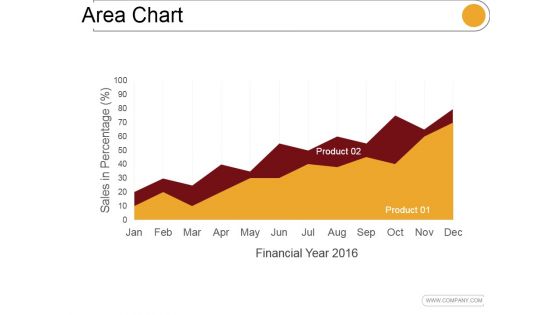
Area Chart Ppt PowerPoint Presentation Samples
This is a area chart ppt powerpoint presentation samples. This is a two stage process. The stages in this process are financial year, sales in percentage, jan, feb.
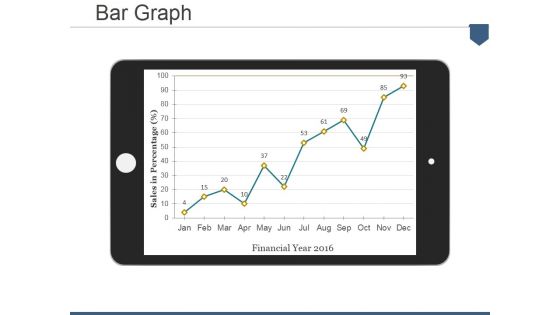
Bar Graph Ppt PowerPoint Presentation Pictures Display
This is a bar graph ppt powerpoint presentation pictures display. This is a one stage process. The stages in this process are sales in percentage, financial year.
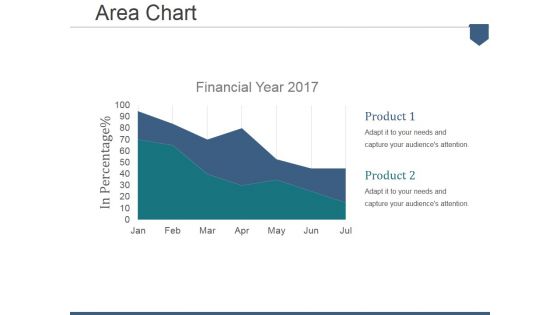
Area Chart Ppt PowerPoint Presentation Summary Example
This is a area chart ppt powerpoint presentation summary example. This is a two stage process. The stages in this process are financial year, in percentage, product.
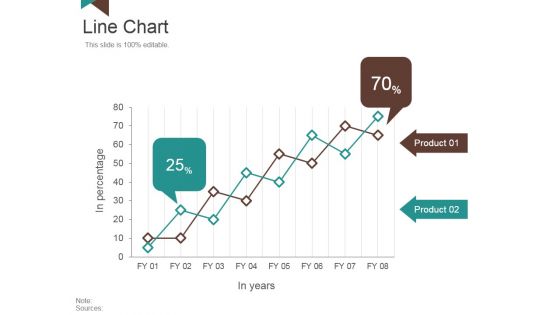
Line Chart Ppt PowerPoint Presentation Layouts Background Image
This is a line chart ppt powerpoint presentation layouts background image. This is a two stage process. The stages in this process are in percentage, in years, product.
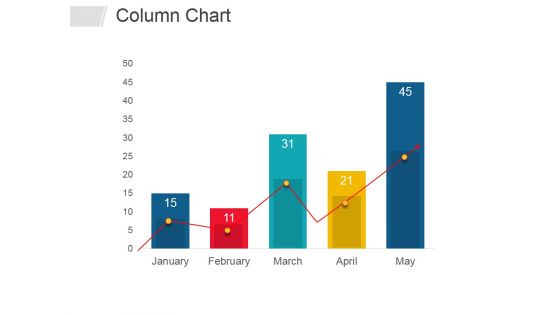
Column Chart Ppt PowerPoint Presentation Layouts Layout
This is a column chart ppt powerpoint presentation layouts layout. This is a five stage process. The stages in this process are column chart, years, business, management, marketing.
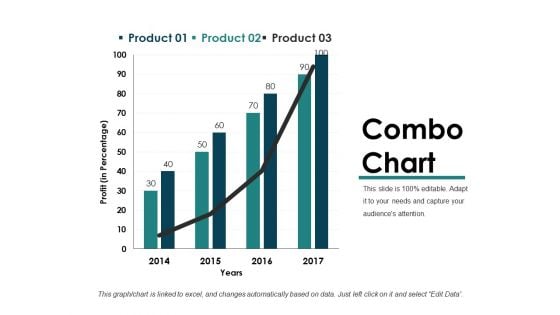
Combo Chart Ppt PowerPoint Presentation Slides Introduction
This is a combo chart ppt powerpoint presentation slides introduction. This is a four stage process. The stages in this process are profit, years, business, marketing, graph.
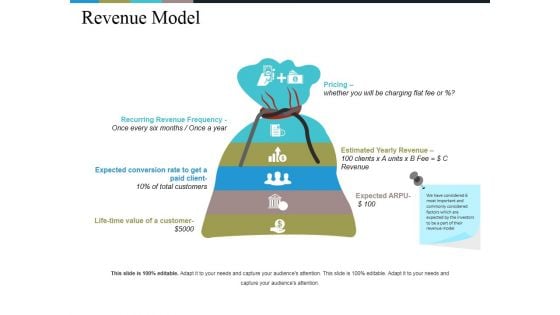
Revenue Model Ppt PowerPoint Presentation Professional Maker
This is a revenue model ppt powerpoint presentation professional maker. This is a six stage process. The stages in this process are recurring revenue frequency, life time value of a customer, pricing, estimated yearly revenue, expected arpu.
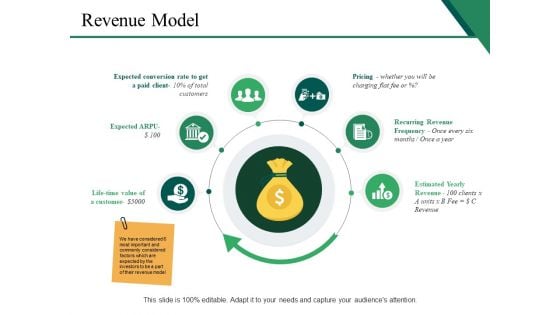
Revenue Model Ppt PowerPoint Presentation Ideas Objects
This is a revenue model ppt powerpoint presentation ideas objects. This is a six stage process. The stages in this process are expected arpu, expected conversion rate to get a paid client, pricing, recurring revenue frequency, estimated yearly revenue.
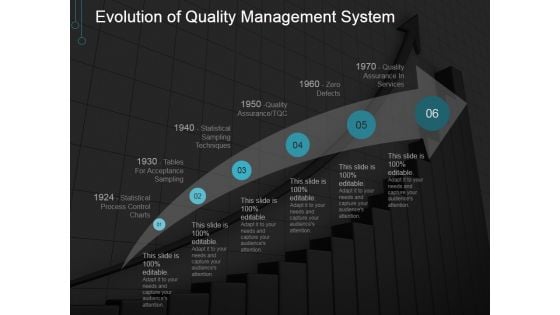
Evolution Of Quality Management System Ppt PowerPoint Presentation Visuals
This is a evolution of quality management system ppt powerpoint presentation visuals. This is a six stage process. The stages in this process are growth, year, business, marketing, success.

Scatter Bubble Chart Ppt PowerPoint Presentation Professional Model
This is a scatter bubble chart ppt powerpoint presentation professional model. This is a six stage process. The stages in this process are sales in profit, financial year, growth, business, marketing, strategy.
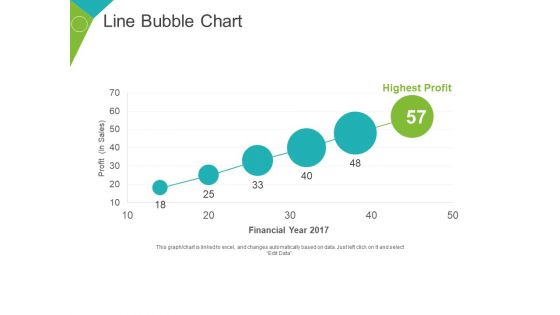
Line Bubble Chart Ppt PowerPoint Presentation Portfolio Slide Portrait
This is a line bubble chart ppt powerpoint presentation portfolio slide portrait. This is a six stage process. The stages in this process are highest profit, financial year, profit in sales, growth, business.
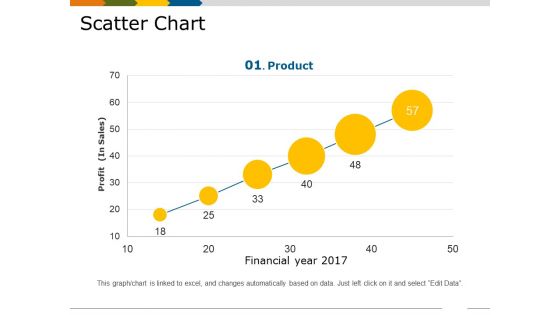
Scatter Chart Template 1 Ppt PowerPoint Presentation Show Slides
This is a scatter chart template 1 ppt powerpoint presentation show slides. This is a six stage process. The stages in this process are financial year, profit in sales, growth, business, marketing, product.
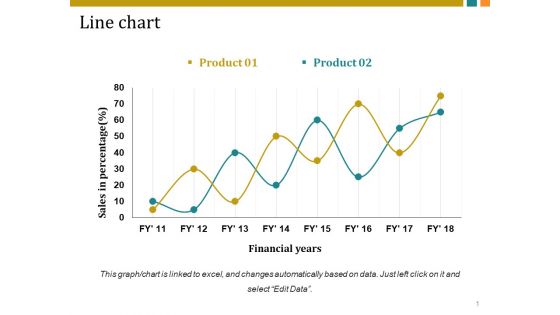
Line Chart Ppt PowerPoint Presentation Inspiration Vector
This is a line chart ppt powerpoint presentation inspiration vector. This is a two stage process. The stages in this process are sales in percentage, financial years, business, marketing, growth.

Line Chart Ppt PowerPoint Presentation Infographics Graphic Images
This is a line chart ppt powerpoint presentation infographics graphic images. This is a two stage process. The stages in this process are sales in percentage, financial years, growth, business, marketing.
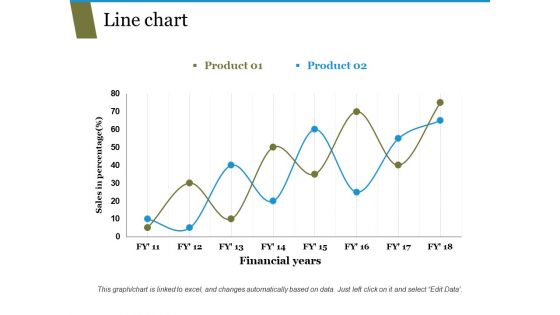
Line Chart Ppt PowerPoint Presentation Pictures Templates
This is a line chart ppt powerpoint presentation pictures templates. This is a two stage process. The stages in this process are sales in percentage, financial years, business, marketing, growth.
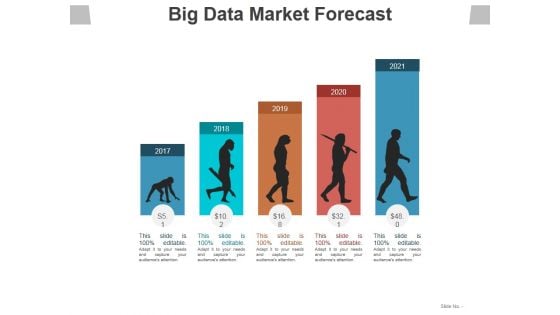
Big Data Market Forecast Ppt PowerPoint Presentation Ideas Information
This is a big data market forecast ppt powerpoint presentation ideas information. This is a five stage process. The stages in this process are years, planning, growth, business, marketing.
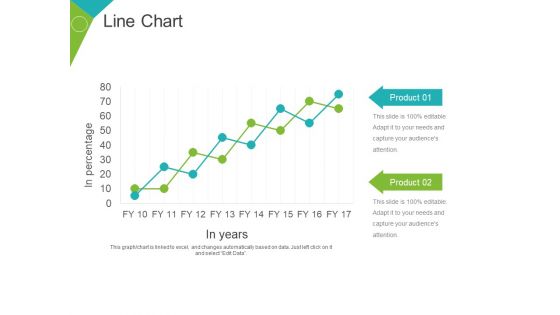
Line Chart Ppt PowerPoint Presentation Gallery Objects
This is a line chart ppt powerpoint presentation gallery objects. This is a two stage process. The stages in this process are product, business, marketing, growth, in years, in percentage.
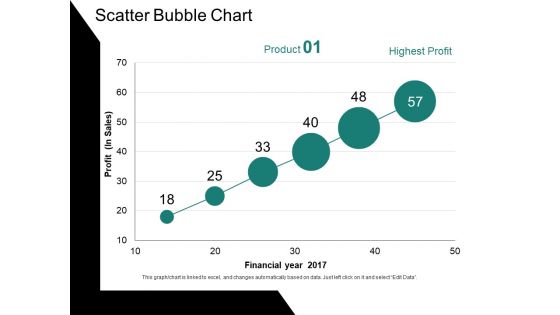
Scatter Bubble Chart Ppt PowerPoint Presentation Ideas Gallery
This is a scatter bubble chart ppt powerpoint presentation ideas gallery. This is a six stage process. The stages in this process are profit, financial year, chart, business, growth.
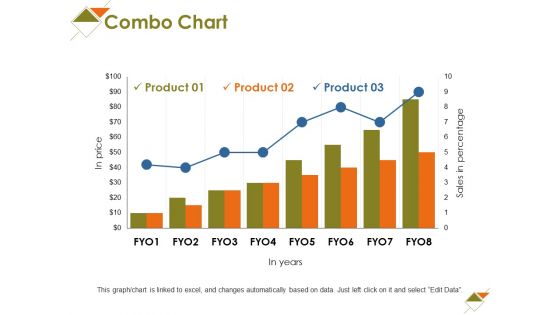
Combo Chart Ppt PowerPoint Presentation Show Elements
This is a combo chart ppt powerpoint presentation show elements. This is a three stage process. The stages in this process are in price, in years, business, marketing, growth.
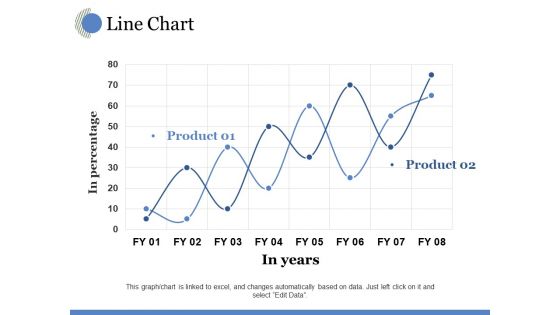
Line Chart Ppt PowerPoint Presentation Model Visual Aids
This is a line chart ppt powerpoint presentation model visual aids. This is a two stage process. The stages in this process are in years, in percentage, growth, business, marketing.
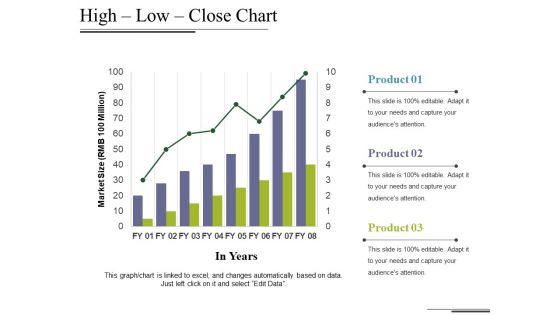
High Low Close Chart Ppt PowerPoint Presentation Styles Maker
This is a high low close chart ppt powerpoint presentation styles maker. This is a three stage process. The stages in this process are market size, in years, growth, business, marketing, graph.
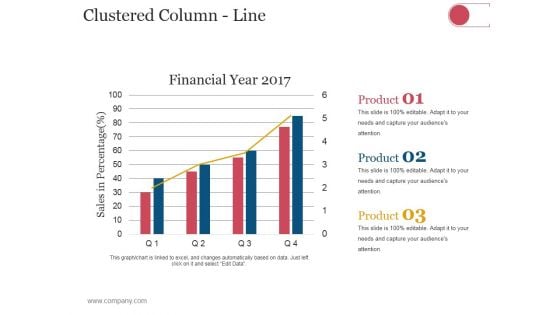
Clustered Column Line Ppt PowerPoint Presentation Infographic Template Deck
This is a clustered column line ppt powerpoint presentation infographic template deck. This is a three stage process. The stages in this process are business, strategy, analysis, planning, sales in percentage, financial year.
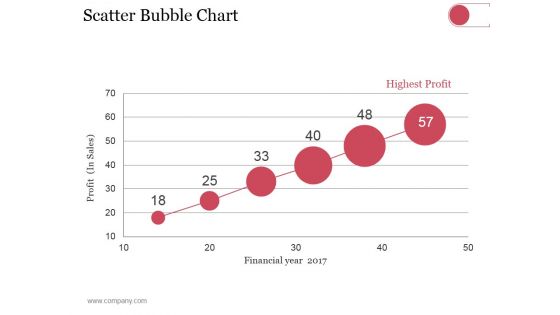
Scatter Bubble Chart Ppt PowerPoint Presentation Summary Pictures
This is a scatter bubble chart ppt powerpoint presentation summary pictures. This is a six stage process. The stages in this process are highest profit, financial year, profit in sales.
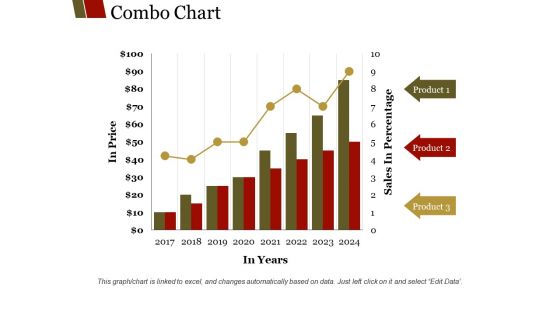
Combo Chart Ppt PowerPoint Presentation Summary Layouts
This is a combo chart ppt powerpoint presentation summary layouts. This is a eight stage process. The stages in this process are product, sales in percentage, in years, in price, graph.
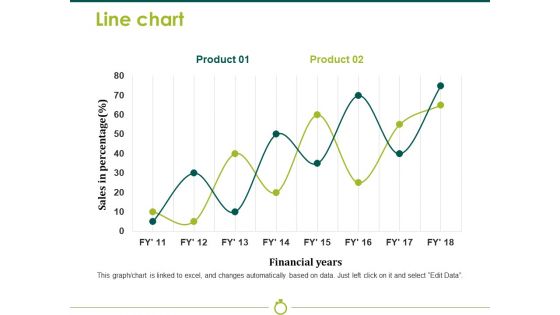
Line Chart Template 2 Ppt PowerPoint Presentation Model Background Image
This is a line chart template 2 ppt powerpoint presentation model background image. This is a two stage process. The stages in this process are sales in percentage, financial years, business, marketing, strategy, graph.
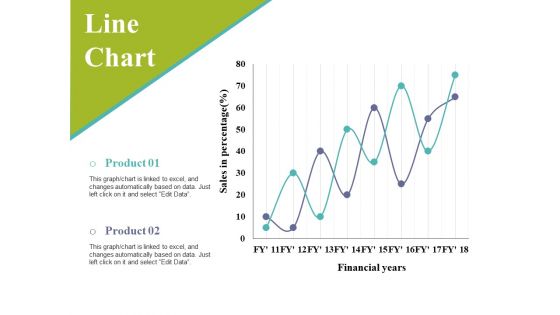
Line Chart Ppt PowerPoint Presentation Infographic Template Slides
This is a line chart ppt powerpoint presentation infographic template slides. This is a two stage process. The stages in this process are sales in percentage, financial years, business, marketing, graph.
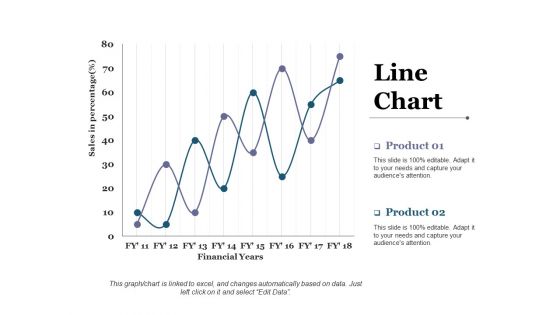
Line Chart Ppt PowerPoint Presentation Styles Themes
This is a line chart ppt powerpoint presentation styles themes. This is a two stage process. The stages in this process are business, marketing, financial years, sales in percentage.
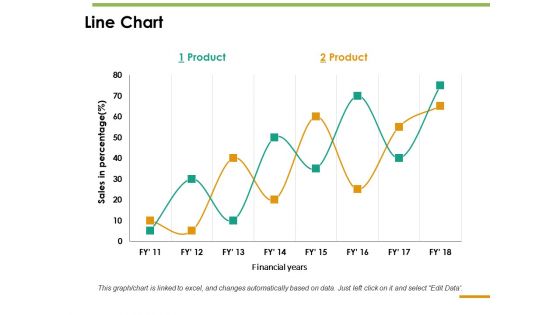
Line Chart Ppt PowerPoint Presentation Inspiration Guide
This is a line chart ppt powerpoint presentation inspiration guide. This is a two stage process. The stages in this process are line chart, sales in percentage, product, financial years.
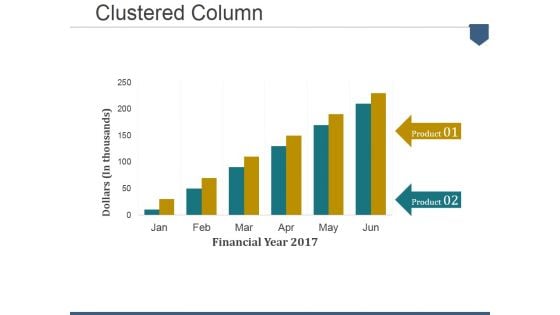
Clustered Column Ppt PowerPoint Presentation File Designs Download
This is a clustered column ppt powerpoint presentation file designs download. This is a six stage process. The stages in this process are dollars in thousands, financial year, product.
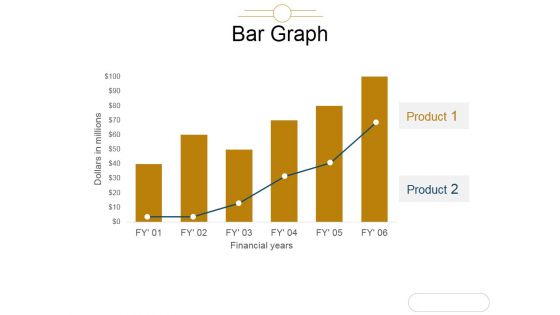
Bar Graph Ppt PowerPoint Presentation Model Graphic Tips
This is a bar graph ppt powerpoint presentation model graphic tips. This is a two stage process. The stages in this process are we are dollars in millions, financials years, bar graph, product, business.

Combo Chart Ppt PowerPoint Presentation Summary Design Templates
This is a combo chart ppt powerpoint presentation summary design templates. This is a four stage process. The stages in this process are units sold, product, combo chart, years, planning.
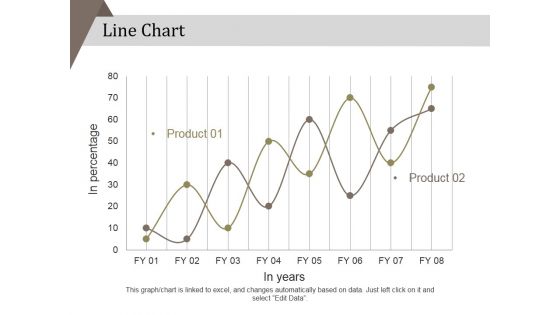
Line Chart Ppt PowerPoint Presentation Layouts Professional
This is a line chart ppt powerpoint presentation layouts professional. This is a two stage process. The stages in this process are in percentage, product, in years, strategy, marketing, business.
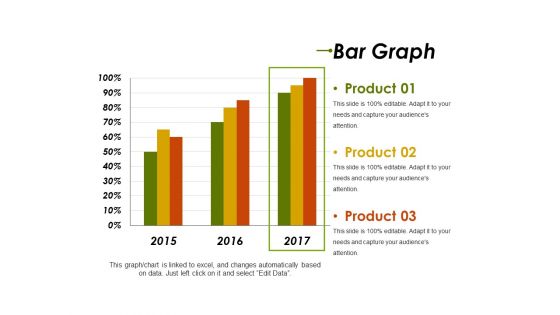
Bar Graph Template 1 Ppt PowerPoint Presentation Slides Format Ideas
This is a bar graph template 1 ppt powerpoint presentation slides format ideas. This is a three stage process. The stages in this process are product, years, bar graph, business, marketing.
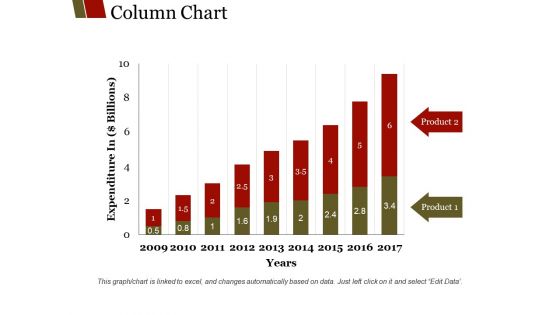
Column Chart Ppt PowerPoint Presentation Summary Graphics
This is a column chart ppt powerpoint presentation summary graphics. This is a nine stage process. The stages in this process are product, years, expenditure in billions, graph, business.


 Continue with Email

 Home
Home


