Year Over Year Growth
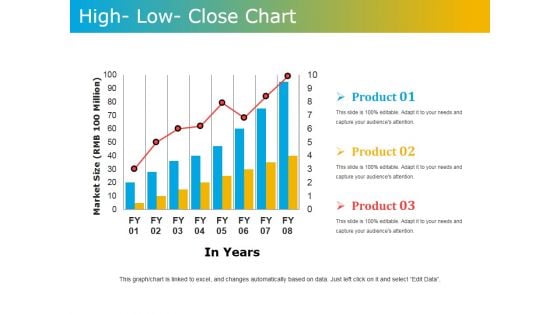
High Low Close Chart Ppt PowerPoint Presentation Model Graphics Tutorials
This is a high low close chart ppt powerpoint presentation model graphics tutorials. This is a three stage process. The stages in this process are market size, in years, product.
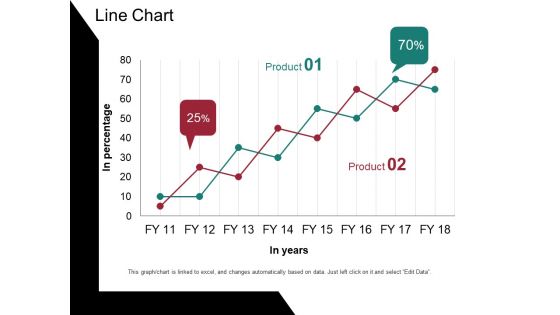
Line Chart Ppt PowerPoint Presentation Portfolio Design Templates
This is a line chart ppt powerpoint presentation portfolio design templates. This is a two stage process. The stages in this process are in percentage, in years, percentage, business, graph.
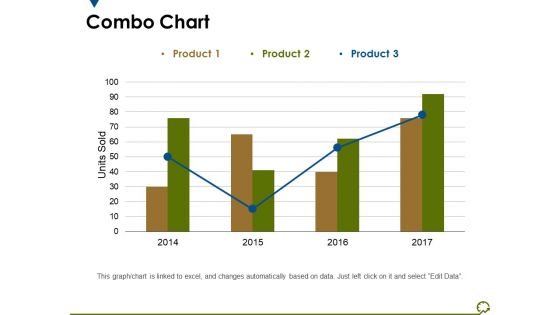
Combo Chart Ppt PowerPoint Presentation Outline Graphics Tutorials
This is a combo chart ppt powerpoint presentation outline graphics tutorials. This is a three stage process. The stages in this process are units sold, years, business, marketing, graph.
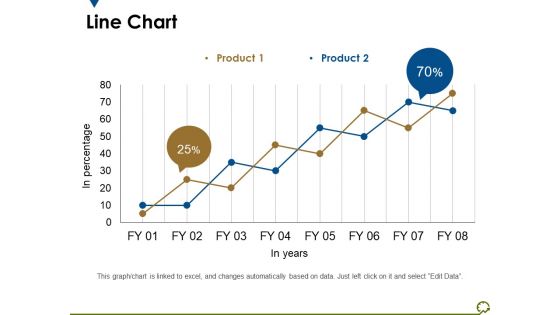
Line Chart Ppt PowerPoint Presentation Outline Diagrams
This is a line chart ppt powerpoint presentation outline diagrams. This is a two stage process. The stages in this process are in percentage, in years, percentage, business, marketing.
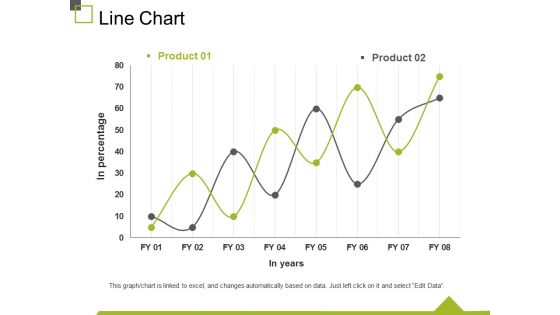
Line Chart Ppt PowerPoint Presentation Infographics Display
This is a line chart ppt powerpoint presentation infographics display. This is a two stage process. The stages in this process are in percentage, in years, chart, business, marketing.
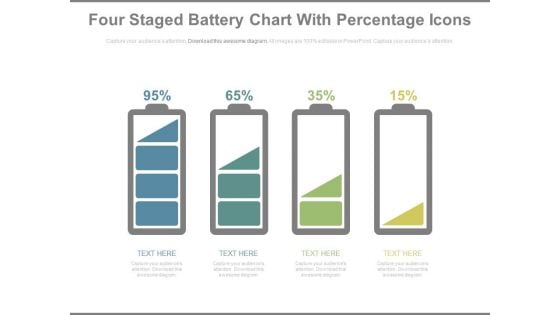
Battery Chart With Percentage Values For Comparison PowerPoint Slides
This year?s sales has matched up with your expectations. Now match this slide with your presentation to show the same. Show your company?s performance or business growth with this four staged battery chart PowerPoint template. With this slide, you can easily convince your colleagues how your company gave a tremendous growth over the years or months. Perfect illustration to show that the targets are achieved. This PPT template is easy to edit. You can choose the color of your choice. Your colleagues are already impressed with the sales growth. Now impress others and choose this PPT innovative designed template.

Graph In 2011 Business PowerPoint Backgrounds And Templates 1210
Microsoft PowerPoint Template and Background with An orange arrow moving upwards over the 3D rendering of the year 2011 business graph on a white reflective background Our Graph In 2011 Business PowerPoint Backgrounds And Templates 1210 are designed to excite. Your thoughts will cause much delight.

Future Success Concept Global Business PowerPoint Templates And PowerPoint Backgrounds 0911
Microsoft PowerPoint Template and Background with new year 2012 Our Future Success Concept Global Business PowerPoint Templates And PowerPoint Backgrounds 0911 are good fertilizers. They enhance the growth of ideas.

Tokenization Global Market Report Coverage PPT Example
This slide represents the market report coverage of tokenization across the globe. The purpose of this slide is to showcase the market growth for the year 2021 and the predicted growth for coming years. Find a pre-designed and impeccable Tokenization Global Market Report Coverage PPT Example. The templates can ace your presentation without additional effort. You can download these easy-to-edit presentation templates to make your presentation stand out from others. So, what are you waiting for Download the template from Slidegeeks today and give a unique touch to your presentation. This slide represents the market report coverage of tokenization across the globe. The purpose of this slide is to showcase the market growth for the year 2021 and the predicted growth for coming years.
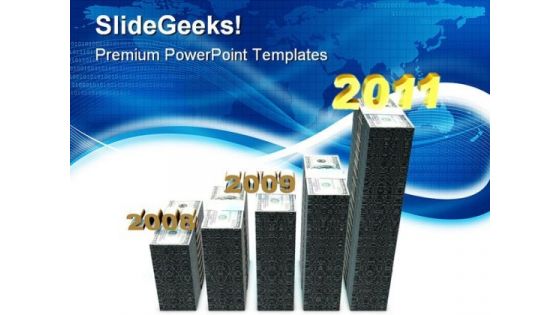
Bar Graph Business PowerPoint Templates And PowerPoint Backgrounds 0511
Microsoft PowerPoint Template and Background with bar graph showing the growth of profits in 2010 year Our Bar Graph Business PowerPoint Templates And PowerPoint Backgrounds 0511 are colorful compositions. Their array of colors will catch the eye.
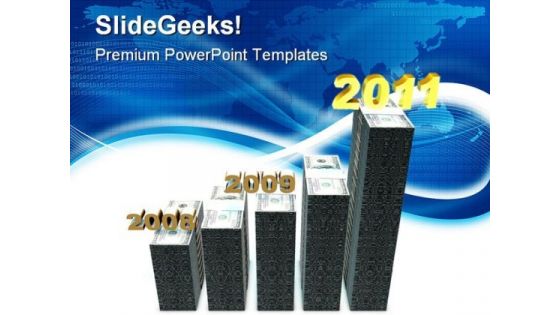
Bar Graph Business PowerPoint Themes And PowerPoint Slides 0511
Microsoft PowerPoint Theme and Slide with bar graph showing the growth of profits in 2010 year Be the expert you truly are. Use our Bar Graph Business PowerPoint Themes And PowerPoint Slides 0511 to affirm your erudition.
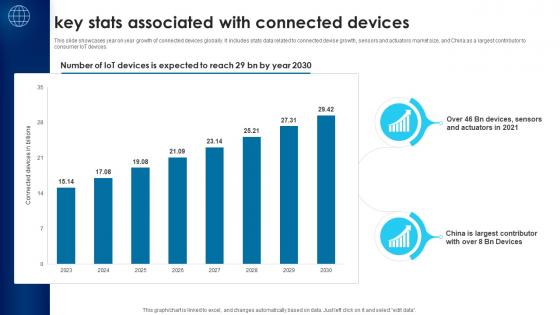
Building Trust With IoT Security Key Stats Associated With Connected Devices IoT SS V
This slide showcases year on year growth of connected devices globally. It includes stats data related to connected devise growth, sensors and actuators market size, and China as a largest contributor to consumer IoT devices. Find a pre-designed and impeccable Building Trust With IoT Security Key Stats Associated With Connected Devices IoT SS V. The templates can ace your presentation without additional effort. You can download these easy-to-edit presentation templates to make your presentation stand out from others. So, what are you waiting for Download the template from Slidegeeks today and give a unique touch to your presentation. This slide showcases year on year growth of connected devices globally. It includes stats data related to connected devise growth, sensors and actuators market size, and China as a largest contributor to consumer IoT devices.
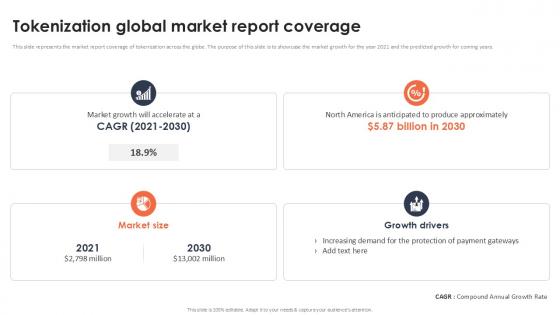
Tokenization Global Market Report Coverage Securing Your Data Ppt Slide
This slide represents the market report coverage of tokenization across the globe. The purpose of this slide is to showcase the market growth for the year 2021 and the predicted growth for coming years. Present like a pro with Tokenization Global Market Report Coverage Securing Your Data Ppt Slide Create beautiful presentations together with your team, using our easy-to-use presentation slides. Share your ideas in real-time and make changes on the fly by downloading our templates. So whether you are in the office, on the go, or in a remote location, you can stay in sync with your team and present your ideas with confidence. With Slidegeeks presentation got a whole lot easier. Grab these presentations today. This slide represents the market report coverage of tokenization across the globe. The purpose of this slide is to showcase the market growth for the year 2021 and the predicted growth for coming years.
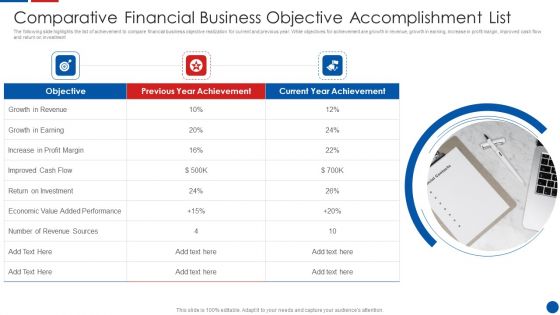
Comparative Financial Business Objective Accomplishment List Ppt PowerPoint Presentation Gallery Slides PDF
The following slide highlights the list of achievement to compare financial business objective realization for current and previous year. While objectives for achievement are growth in revenue, growth in earning, increase in profit margin, improved cash flow and return on investment. Presenting comparative financial business objective accomplishment list ppt powerpoint presentation gallery slides pdf to dispense important information. This template comprises three stages. It also presents valuable insights into the topics including objective, previous year achievement, current year achievement. This is a completely customizable PowerPoint theme that can be put to use immediately. So, download it and address the topic impactfully.
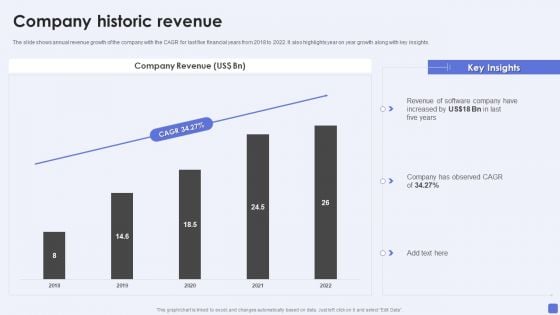
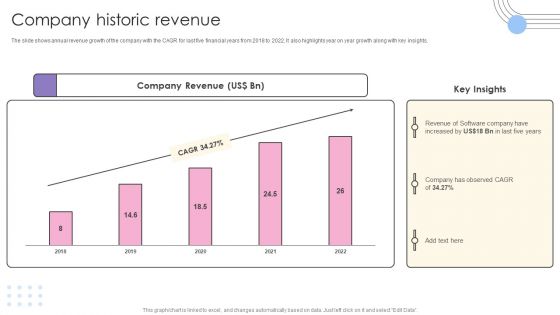
Software Services Business Profile Company Historic Revenue Ppt PowerPoint Presentation Gallery Graphics Download PDF
The slide shows annual revenue growth of the company with the CAGR for last five financial years from 2018 to 2022. It also highlights year on year growth along with key insights. Deliver and pitch your topic in the best possible manner with this Software Services Business Profile Company Historic Revenue Ppt PowerPoint Presentation Gallery Graphics Download PDF. Use them to share invaluable insights on Company Revenue, Observed CAGR, 2018 To 2022 and impress your audience. This template can be altered and modified as per your expectations. So, grab it now.
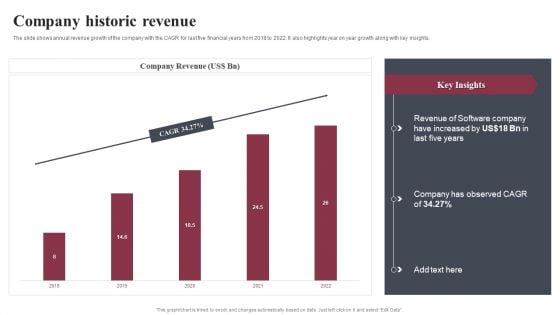
Software Products And Solutions Firm Details Company Historic Revenue Portrait PDF
The slide shows annual revenue growth of the company with the CAGR for last five financial years from 2018 to 2022. It also highlights year on year growth along with key insights. Deliver and pitch your topic in the best possible manner with this Software Products And Solutions Firm Details Company Historic Revenue Portrait PDF. Use them to share invaluable insights on Company Revenue, Observed CAGR, 2018 To 2022 and impress your audience. This template can be altered and modified as per your expectations. So, grab it now.
Business Software Development Company Profile Company Historic Revenue Graphics PDF
The slide shows annual revenue growth of the company with the CAGR for last five financial years from 2018 to 2022. It also highlights year on year growth along with key insights. Deliver and pitch your topic in the best possible manner with this Business Software Development Company Profile Company Historic Revenue Graphics PDF. Use them to share invaluable insights on Company Revenue, Observed CAGR, 2018 To 2022 and impress your audience. This template can be altered and modified as per your expectations. So, grab it now.
IT Application Services Company Outline Company Revenue Icons PDF
The slide shows annual revenue growth of the company with the CAGR for last five financial years from 2018 to 2022. It also highlights year on year growth along with key insights. Deliver and pitch your topic in the best possible manner with this IT Application Services Company Outline Company Revenue Icons PDF. Use them to share invaluable insights on Gross Profit Margin, Revenue, Business and impress your audience. This template can be altered and modified as per your expectations. So, grab it now.
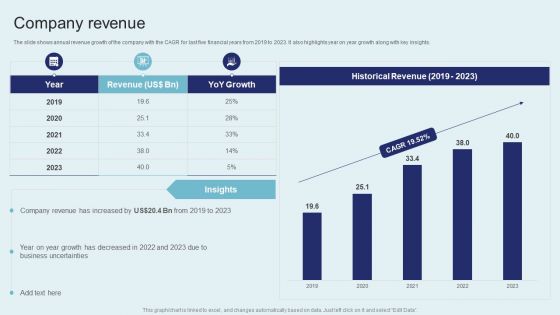
IT Firm Financial Statement Company Revenue Demonstration PDF
The slide shows annual revenue growth of the company with the CAGR for last five financial years from 2019 to 2023. It also highlights year on year growth along with key insights. Find a pre designed and impeccable IT Firm Financial Statement Company Revenue Demonstration PDF. The templates can ace your presentation without additional effort. You can download these easy to edit presentation templates to make your presentation stand out from others. So, what are you waiting for Download the template from Slidegeeks today and give a unique touch to your presentation.
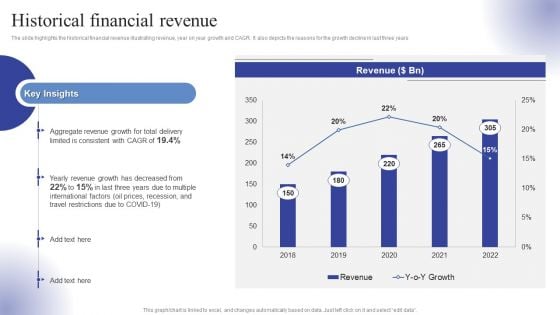
Logistics Transport Company Financial Report Historical Financial Revenue Ppt Outline Slides PDF
The slide highlights the historical financial revenue illustrating revenue, year on year growth and CAGR. It also depicts the reasons for the growth decline in last three years. Present like a pro with Logistics Transport Company Financial Report Historical Financial Revenue Ppt Outline Slides PDF Create beautiful presentations together with your team, using our easy-to-use presentation slides. Share your ideas in real-time and make changes on the fly by downloading our templates. So whether you are in the office, on the go, or in a remote location, you can stay in sync with your team and present your ideas with confidence. With Slidegeeks presentation got a whole lot easier. Grab these presentations today.
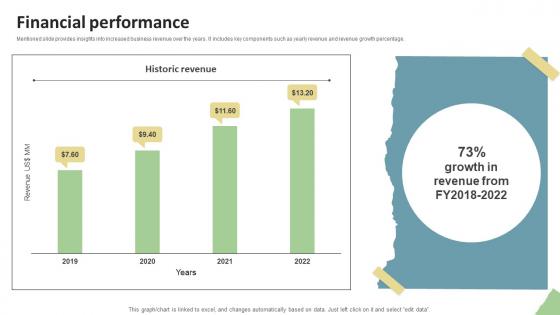
Financial Performance Education Platform Investor Funding Elevator Pitch Deck
Mentioned slide provides insights into increased business revenue over the years. It includes key components such as yearly revenue and revenue growth percentage. Present like a pro with Financial Performance Education Platform Investor Funding Elevator Pitch Deck. Create beautiful presentations together with your team, using our easy-to-use presentation slides. Share your ideas in real-time and make changes on the fly by downloading our templates. So whether you are in the office, on the go, or in a remote location, you can stay in sync with your team and present your ideas with confidence. With Slidegeeks presentation got a whole lot easier. Grab these presentations today. Mentioned slide provides insights into increased business revenue over the years. It includes key components such as yearly revenue and revenue growth percentage.
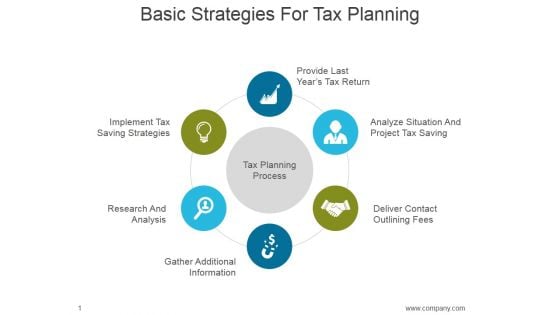
Basic Strategies For Tax Planning Ppt PowerPoint Presentation Deck
This is a basic strategies for tax planning ppt powerpoint presentation deck. This is a six stage process. The stages in this process are provide last years tax return, analyze situation and project tax saving, deliver contact outlining fees, gather additional information, research and analysis, implement tax saving strategies.
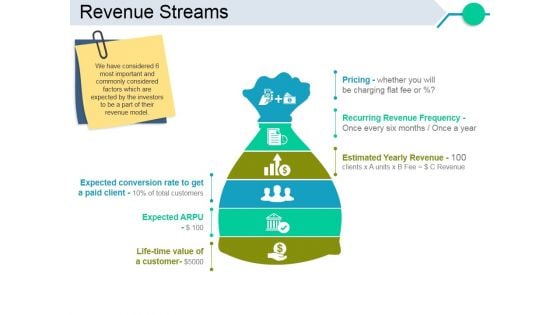
Revenue Streams Template 1 Ppt PowerPoint Presentation Inspiration Skills
This is a revenue streams template 1 ppt powerpoint presentation inspiration skills. This is a six stage process. The stages in this process are expected conversion rate to get a paid client, expected arpu, life time value of a customer, pricing, recurring revenue frequency, estimated yearly revenue.
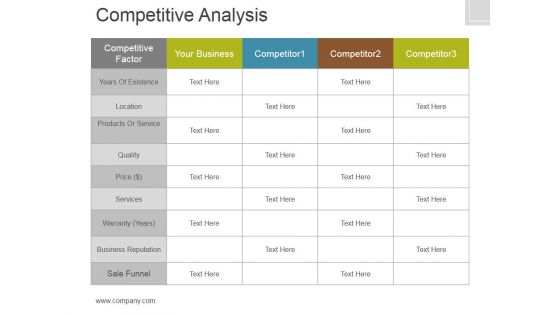
Competitive Analysis Template 1 Ppt PowerPoint Presentation Clipart
This is a competitive analysis template 1 ppt powerpoint presentation clipart. This is a five stage process. The stages in this process are competitive factor, years of existence, location, products or service, business reputation.
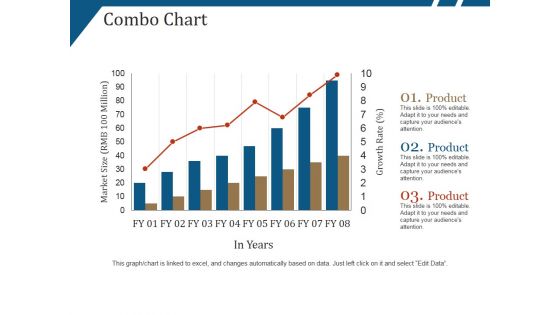
Combo Chart Ppt PowerPoint Presentation Summary Ideas
This is a combo chart ppt powerpoint presentation summary ideas. This is a eight stage process. The stages in this process are market size, growth rate, product, in years.
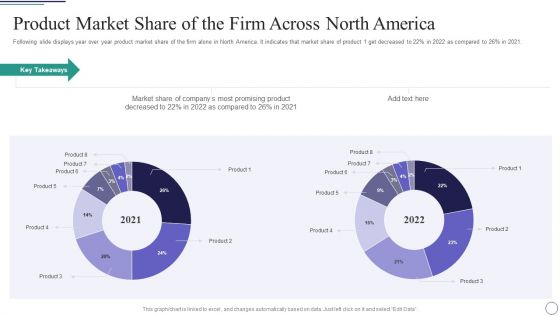
Successful Brand Development Plan Product Market Share Of The Firm Across North America Background PDF
Following slide displays year over year product market share of the firm alone in North America. It indicates that market share of product 1 get decreased to 22persent in 2022 as compared to 26persent in 2021.Deliver an awe inspiring pitch with this creative successful brand development plan product market share of the firm across north america background pdf bundle. Topics like product market share of the firm across north america can be discussed with this completely editable template. It is available for immediate download depending on the needs and requirements of the user.
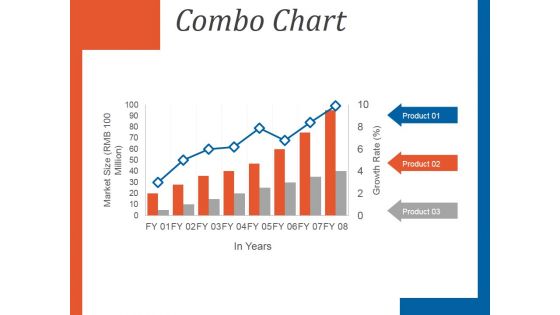
Combo Chart Ppt PowerPoint Presentation Design Ideas
This is a combo chart ppt powerpoint presentation design ideas. This is a eight stage process. The stages in this process are market size, combo chart, in years, product, growth rate.
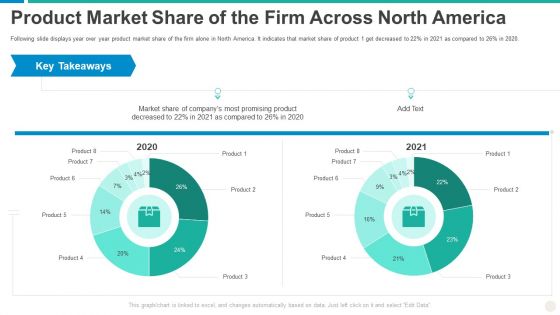
Establishing Successful Brand Strategy To Captivate Consumers Product Market Share Of The Firm Across North America Topics PDF
Following slide displays year over year product market share of the firm alone in North America. It indicates that market share of product 1 get decreased to 22 percent in 2021 as compared to 26 percent in 2020. Deliver an awe inspiring pitch with this creative establishing successful brand strategy to captivate consumers product market share of the firm across north america topics pdf bundle. Topics like product market share of the firm across north america can be discussed with this completely editable template. It is available for immediate download depending on the needs and requirements of the user.
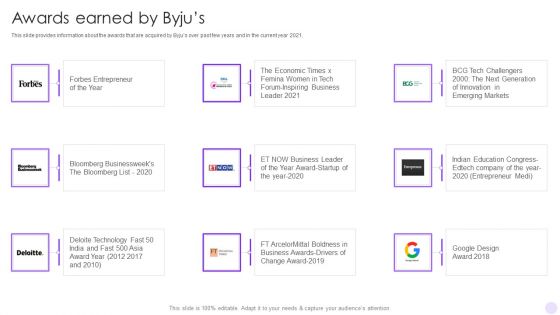
Byjus Investor Capital Financing Pitch Deck Awards Earned By Byjus Structure PDF
This slide provides information about the awards that are acquired by Byjus over past few years and in the current year 2021.This is a Byjus Investor Capital Financing Pitch Deck Awards Earned By Byjus Structure PDF template with various stages. Focus and dispense information on six stages using this creative set, that comes with editable features. It contains large content boxes to add your information on topics like Forbes Entrepreneur, Bloomberg Businessweeks, Emerging Markets You can also showcase facts, figures, and other relevant content using this PPT layout. Grab it now.
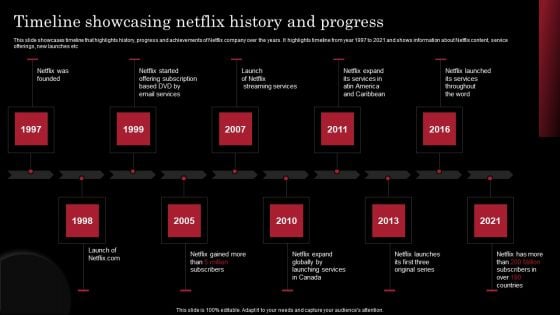
Decoding Netflix Strategies Drives OTT Market Dominance Timeline Showcasing Netflix History Themes PDF
This slide showcases timeline that highlights history, progress and achievements of Netflix company over the years. It highlights timeline from year 1997 to 2021 and shows information about Netflix content, service offerings, new launches etc. From laying roadmaps to briefing everything in detail, our templates are perfect for you. You can set the stage with your presentation slides. All you have to do is download these easy to edit and customizable templates. Decoding Netflix Strategies Drives OTT Market Dominance Timeline Showcasing Netflix History Themes PDF will help you deliver an outstanding performance that everyone would remember and praise you for. Do download this presentation today.
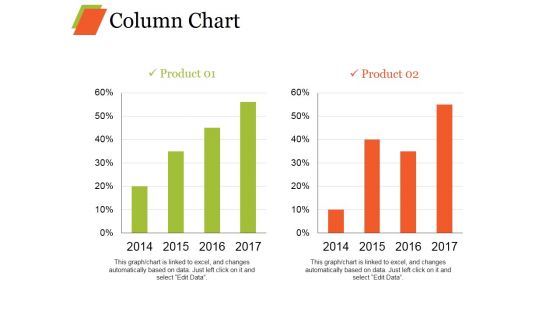
Column Chart Ppt PowerPoint Presentation Infographics Model
This is a column chart ppt powerpoint presentation infographics model. This is a two stage process. The stages in this process are bar graph, growth, product, percentage, year.
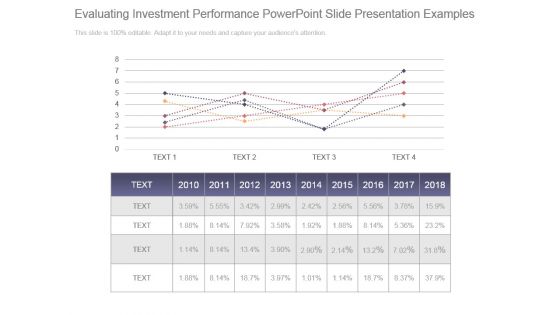
Evaluating Investment Performance Powerpoint Slide Presentation Examples
This is a evaluating investment performance powerpoint slide presentation examples. This is a five stage process. The stages in this process are graph, year, planning, growth, success.

Line Chart Ppt PowerPoint Presentation Pictures Maker
This is a line chart ppt powerpoint presentation pictures maker. This is a two stage process. The stages in this process are financial years, product, growth, success.
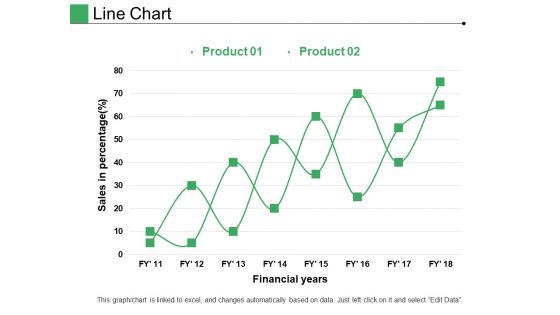
Line Chart Ppt PowerPoint Presentation Pictures Layout
This is a line chart ppt powerpoint presentation pictures layout. This is a two stage process. The stages in this process are product, financial years, sales in percentage.
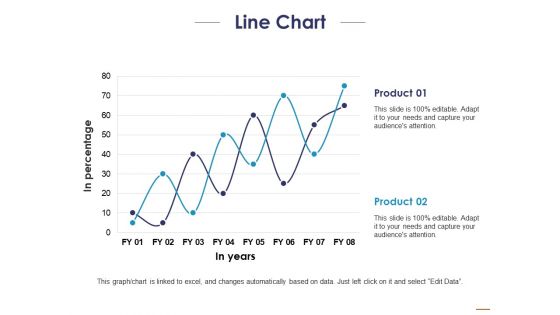
Line Chart Ppt PowerPoint Presentation Layouts Templates
This is a line chart ppt powerpoint presentation layouts templates. This is a two stage process. The stages in this process are product, in percentage, in years.
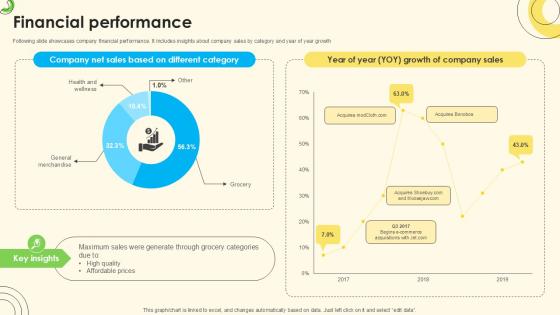
Financial Performance Sales Pitch Deck For Online Retail Ppt Slide
Following slide showcases company financial performance. It includes insights about company sales by category and year of year growth Formulating a presentation can take up a lot of effort and time, so the content and message should always be the primary focus. The visuals of the PowerPoint can enhance the presenters message, so our Financial Performance Sales Pitch Deck For Online Retail Ppt Slide was created to help save time. Instead of worrying about the design, the presenter can concentrate on the message while our designers work on creating the ideal templates for whatever situation is needed. Slidegeeks has experts for everything from amazing designs to valuable content, we have put everything into Financial Performance Sales Pitch Deck For Online Retail Ppt Slide Following slide showcases company financial performance. It includes insights about company sales by category and year of year growth
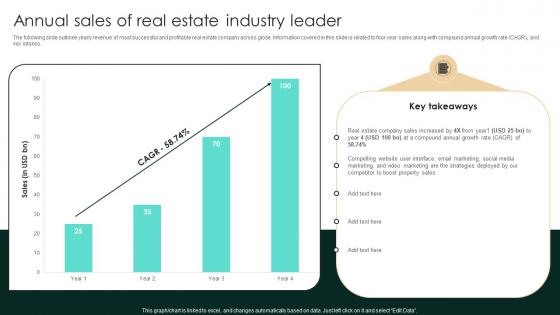
Annual Sales Of Real Estate Industry Leader Strategic Real Estate Structure Pdf
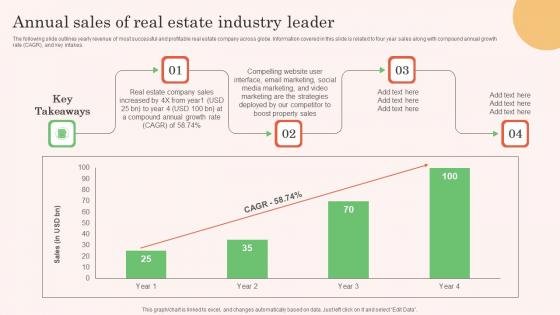
The following slide outlines yearly revenue of most successful and profitable real estate company across globe. Information covered in this slide is related to four year sales along with compound annual growth rate CAGR, and key intakes. Boost your pitch with our creative Annual Sales Of Real Estate Industry Leader Strategic Real Estate Structure Pdf Deliver an awe-inspiring pitch that will mesmerize everyone. Using these presentation templates you will surely catch everyones attention. You can browse the ppts collection on our website. We have researchers who are experts at creating the right content for the templates. So you do not have to invest time in any additional work. Just grab the template now and use them. The following slide outlines yearly revenue of most successful and profitable real estate company across globe. Information covered in this slide is related to four year sales along with compound annual growth rate CAGR, and key intakes.
Annual Sales Of Real Estate Industry Leader Real Estate Property Marketing Download Pdf
The following slide outlines yearly revenue of most successful and profitable real estate company across globe. Information covered in this slide is related to four year sales along with compound annual growth rate CAGR, and key intakes.Boost your pitch with our creative Annual Sales Of Real Estate Industry Leader Real Estate Property Marketing Download Pdf. Deliver an awe-inspiring pitch that will mesmerize everyone. Using these presentation templates you will surely catch everyones attention. You can browse the ppts collection on our website. We have researchers who are experts at creating the right content for the templates. So you do not have to invest time in any additional work. Just grab the template now and use them. The following slide outlines yearly revenue of most successful and profitable real estate company across globe. Information covered in this slide is related to four year sales along with compound annual growth rate CAGR, and key intakes.
Annual Sales Of Real Estate Industry Leader Out Of The Box Real Portrait Pdf
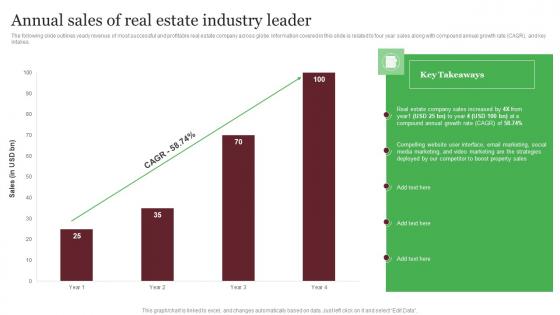
The following slide outlines yearly revenue of most successful and profitable real estate company across globe. Information covered in this slide is related to four year sales along with compound annual growth rate CAGR, and key intakes. Boost your pitch with our creative Annual Sales Of Real Estate Industry Leader Out Of The Box Real Portrait Pdf Deliver an awe-inspiring pitch that will mesmerize everyone. Using these presentation templates you will surely catch everyones attention. You can browse the ppts collection on our website. We have researchers who are experts at creating the right content for the templates. So you do not have to invest time in any additional work. Just grab the template now and use them. The following slide outlines yearly revenue of most successful and profitable real estate company across globe. Information covered in this slide is related to four year sales along with compound annual growth rate CAGR, and key intakes.
Future Goals And Revenue Insurance Agency Startup Business Plan Go To Market Strategy Diagrams Pdf
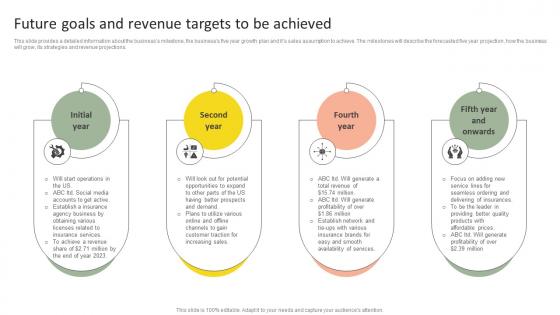
This slide provides a detailed information about the businesss milestone, the businesss five year growth plan and its sales assumption to achieve. The milestones will describe the forecasted five year projection, how the business will grow, its strategies and revenue projections. There are so many reasons you need a Future Goals And Revenue Insurance Agency Startup Business Plan Go To Market Strategy Diagrams Pdf. The first reason is you can not spend time making everything from scratch, Thus, Slidegeeks has made presentation templates for you too. You can easily download these templates from our website easily. This slide provides a detailed information about the businesss milestone, the businesss five year growth plan and its sales assumption to achieve. The milestones will describe the forecasted five year projection, how the business will grow, its strategies and revenue projections.
Global Market Size Of Digital Biomedical Data Science And Health Informatics Microsoft Pdf
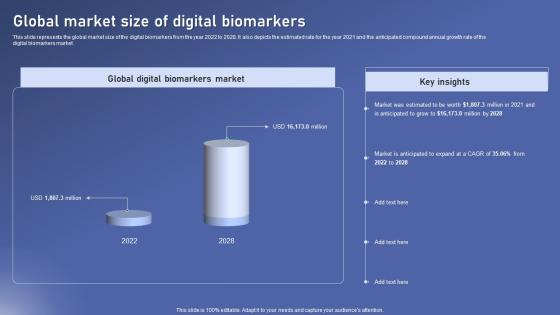
This slide represents the global market size of the digital biomarkers from the year 2022 to 2028. It also depicts the estimated rate for the year 2021 and the anticipated compound annual growth rate of the digital biomarkers market. The best PPT templates are a great way to save time, energy, and resources. Slidegeeks have 100 percent editable powerpoint slides making them incredibly versatile. With these quality presentation templates, you can create a captivating and memorable presentation by combining visually appealing slides and effectively communicating your message. Download Global Market Size Of Digital Biomedical Data Science And Health Informatics Microsoft Pdf from Slidegeeks and deliver a wonderful presentation. This slide represents the global market size of the digital biomarkers from the year 2022 to 2028. It also depicts the estimated rate for the year 2021 and the anticipated compound annual growth rate of the digital biomarkers market.
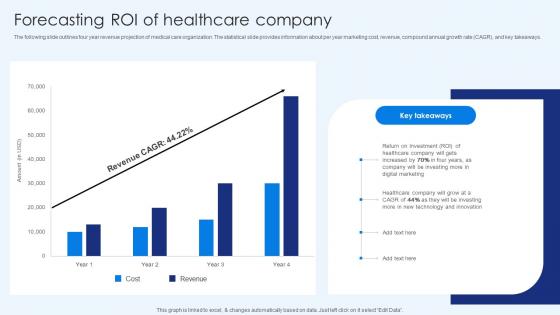
Forecasting Roi Of Healthcare Company Healthcare Promotion Themes Pdf
The following slide outlines four year revenue projection of medical care organization. The statistical slide provides information about per year marketing cost, revenue, compound annual growth rate CAGR, and key takeaways. Find highly impressive Forecasting Roi Of Healthcare Company Healthcare Promotion Themes Pdf on Slidegeeks to deliver a meaningful presentation. You can save an ample amount of time using these presentation templates. No need to worry to prepare everything from scratch because Slidegeeks experts have already done a huge research and work for you. You need to download Forecasting Roi Of Healthcare Company Healthcare Promotion Themes Pdf for your upcoming presentation. All the presentation templates are 100 percent editable and you can change the color and personalize the content accordingly. Download now The following slide outlines four year revenue projection of medical care organization. The statistical slide provides information about per year marketing cost, revenue, compound annual growth rate CAGR, and key takeaways.
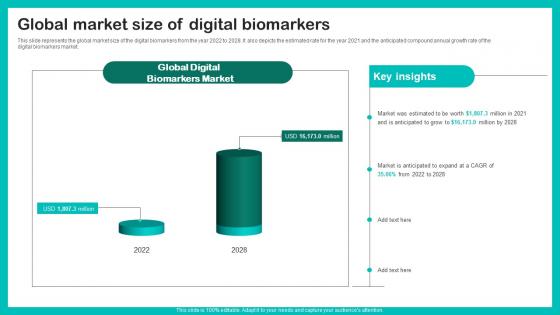
Global Market Size Of Digital Biomarkers For Personalized Health Insights Sample Pdf
This slide represents the global market size of the digital biomarkers from the year 2022 to 2028. It also depicts the estimated rate for the year 2021 and the anticipated compound annual growth rate of the digital biomarkers market. If your project calls for a presentation, then Slidegeeks is your go to partner because we have professionally designed, easy to edit templates that are perfect for any presentation. After downloading, you can easily edit Global Market Size Of Digital Biomarkers For Personalized Health Insights Sample Pdf and make the changes accordingly. You can rearrange slides or fill them with different images. Check out all the handy templates This slide represents the global market size of the digital biomarkers from the year 2022 to 2028. It also depicts the estimated rate for the year 2021 and the anticipated compound annual growth rate of the digital biomarkers market.
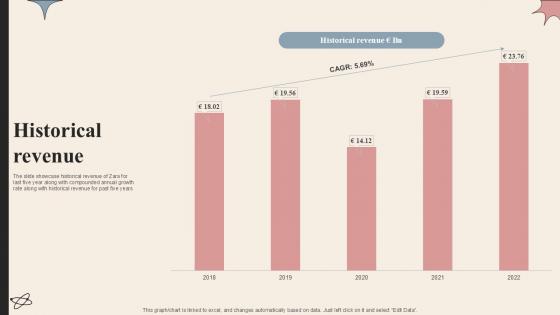
Historical Revenue Branded Clothing Company Profile PPT PowerPoint CP SS V
The slide showcase historical revenue of Zara for last five year along with compounded annual growth rate along with historical revenue for past five years. Crafting an eye-catching presentation has never been more straightforward. Let your presentation shine with this tasteful yet straightforward Historical Revenue Branded Clothing Company Profile PPT PowerPoint CP SS V template. It offers a minimalistic and classy look that is great for making a statement. The colors have been employed intelligently to add a bit of playfulness while still remaining professional. Construct the ideal Historical Revenue Branded Clothing Company Profile PPT PowerPoint CP SS V that effortlessly grabs the attention of your audience Begin now and be certain to wow your customers The slide showcase historical revenue of Zara for last five year along with compounded annual growth rate along with historical revenue for past five years.
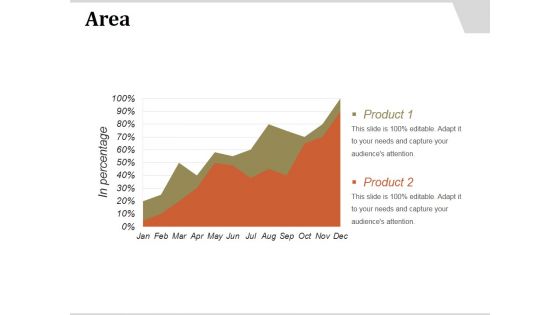
Area Ppt PowerPoint Presentation Show
This is a area ppt powerpoint presentation show. This is a two stage process. The stages in this process are area, bar graph, growth, years, business.
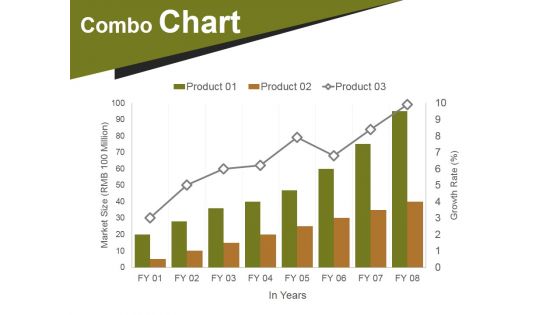
Combo Chart Ppt PowerPoint Presentation Portfolio Infographics
This is a combo chart ppt powerpoint presentation portfolio infographics. This is a eight stage process. The stages in this process are market size, growth, years, finance, business.
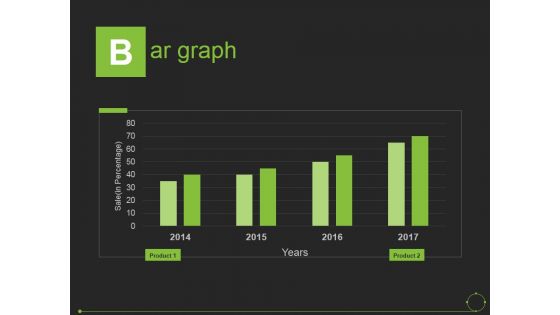
Bar Graph Ppt PowerPoint Presentation Portfolio Background
This is a bar graph ppt powerpoint presentation portfolio background. This is a four stage process. The stages in this process are sale, years, product.
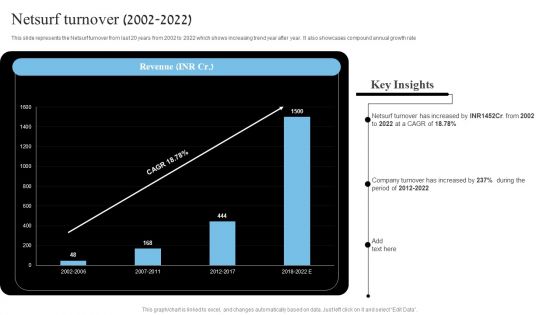
Network Marketing Company Profile Netsurf Turnover 2002 2022 Rules PDF
This slide represents the Netsurf turnover from last 20 years from 2002 to 2022 which shows increasing trend year after year. It also showcases compound annual growth rate From laying roadmaps to briefing everything in detail, our templates are perfect for you. You can set the stage with your presentation slides. All you have to do is download these easy to edit and customizable templates. Network Marketing Company Profile Netsurf Turnover 2002 2022 Rules PDF will help you deliver an outstanding performance that everyone would remember and praise you for. Do download this presentation today.
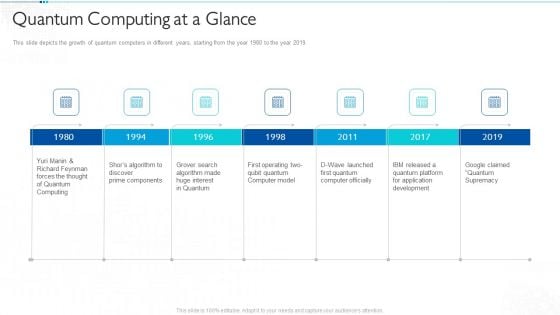
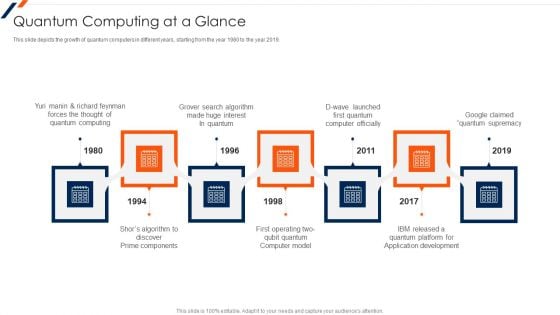
Quantum Computing For Everyone IT Quantum Computing At A Glance Pictures PDF
This slide depicts the growth of quantum computers in different years, starting from the year 1980 to the year 2019. Presenting quantum computing for everyone it quantum computing at a glance pictures pdf to provide visual cues and insights. Share and navigate important information on seven stages that need your due attention. This template can be used to pitch topics like quantum computing at a glance, 1980 to 2019. In addtion, this PPT design contains high resolution images, graphics, etc, that are easily editable and available for immediate download.
Quantum Computing At A Glance Ppt Infographic Template Graphics Example PDF
This slide depicts the growth of quantum computers in different years, starting from the year 1980 to the year 2019. Presenting Quantum Computing At A Glance Ppt Infographic Template Graphics Example PDF to provide visual cues and insights. Share and navigate important information on seven stages that need your due attention. This template can be used to pitch topics like Application Development, Computer Model. In addtion, this PPT design contains high resolution images, graphics, etc, that are easily editable and available for immediate download.
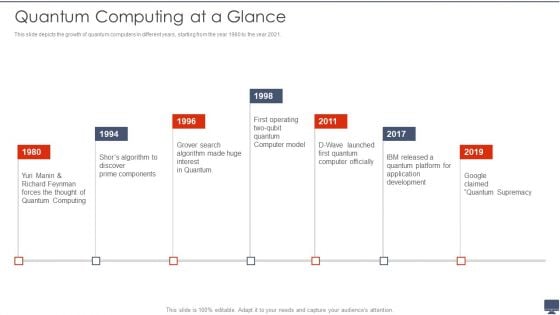
Quantum Computing At A Glance Ppt Show Example File PDF
This slide depicts the growth of quantum computers in different years, starting from the year 1980 to the year 2021.This is a Quantum Computing At A Glance Ppt Show Example File PDF template with various stages. Focus and dispense information on seven stages using this creative set, that comes with editable features. It contains large content boxes to add your information on topics like Quantum Computing, Application Development, Prime Components. You can also showcase facts, figures, and other relevant content using this PPT layout. Grab it now.
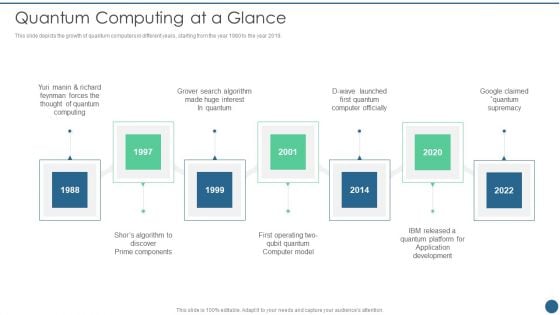
Quantum Key Distribution Quantum Computing At A Glance Background PDF
This slide depicts the growth of quantum computers in different years, starting from the year 1980 to the year 2019.Presenting Quantum Key Distribution Quantum Computing At A Glance Background PDF to provide visual cues and insights. Share and navigate important information on seven stages that need your due attention. This template can be used to pitch topics like Thought Of Quantum, Search Algorithm, Computer Officially In addtion, this PPT design contains high resolution images, graphics, etc, that are easily editable and available for immediate download.
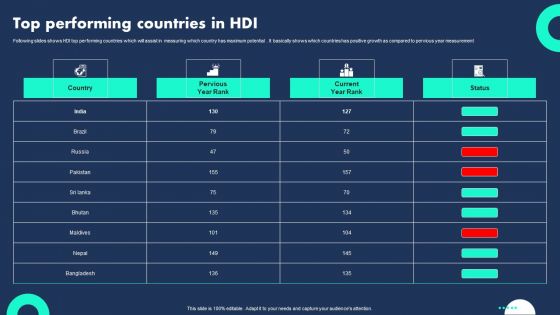
Top Performing Countries In HDI Guidelines PDF
Following slides shows HDI top performing countries which will assist in measuring which country has maximum potential . It basically shows which countries has positive growth as compared to pervious year measurement. Showcasing this set of slides titled Top Performing Countries In HDI Guidelines PDF. The topics addressed in these templates are Country, Pervious Year Rank, Current Year Rank . All the content presented in this PPT design is completely editable. Download it and make adjustments in color, background, font etc. as per your unique business setting.
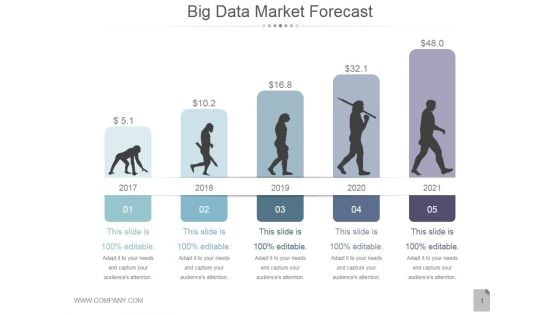
Big Data Market Forecast Ppt PowerPoint Presentation Clipart
This is a big data market forecast ppt powerpoint presentation clipart. This is a five stage process. The stages in this process are business, marketing, management, planning, years.
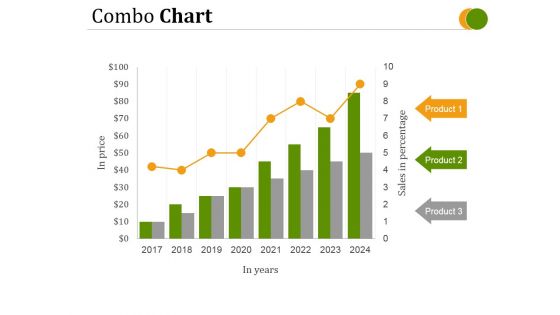
Combo Chart Ppt PowerPoint Presentation Deck
This is a combo chart ppt powerpoint presentation deck. This is a eight stage process. The stages in this process are in price, in years, product.
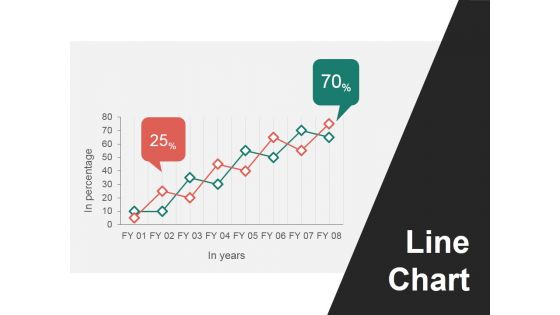
Line Chart Ppt PowerPoint Presentation Ideas Portfolio
This is a line chart ppt powerpoint presentation ideas portfolio. This is a two stage process. The stages in this process are line chart, in years, in percentage.
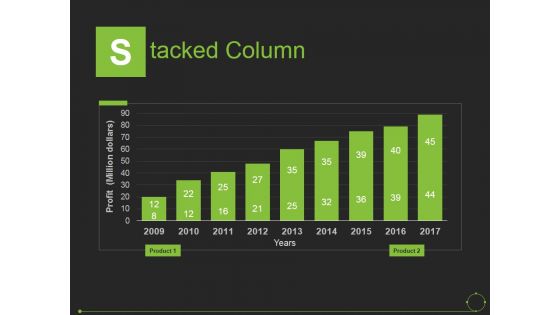
Stacked Column Ppt PowerPoint Presentation Slides Introduction
This is a stacked column ppt powerpoint presentation slides introduction. This is a nine stage process. The stages in this process are years, profit, product, business, marketing.
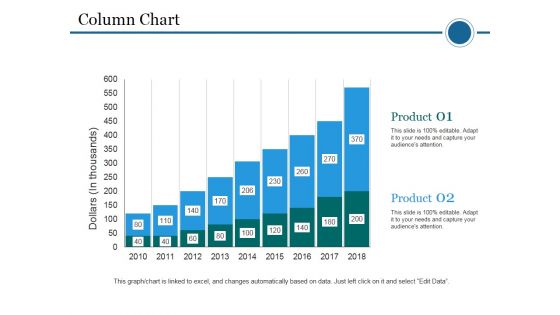
Column Chart Ppt PowerPoint Presentation Ideas Styles
This is a column chart ppt powerpoint presentation ideas styles. This is a two stage process. The stages in this process are dollars, product, planning, business, years.
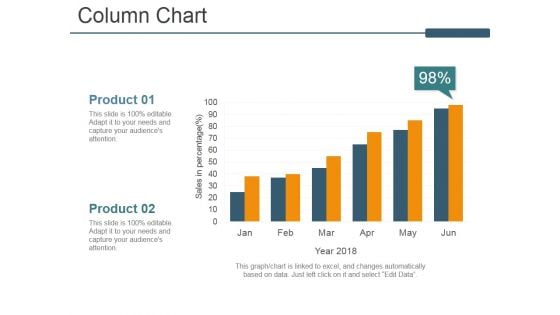
Column Chart Ppt PowerPoint Presentation Ideas Guidelines
This is a column chart ppt powerpoint presentation ideas guidelines. This is a two stage process. The stages in this process are column chart, product, year, business, marketing.
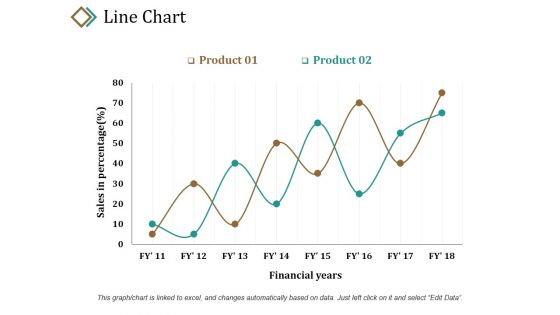
Line Chart Ppt PowerPoint Presentation Layouts Example
This is a line chart ppt powerpoint presentation layouts example. This is a two stage process. The stages in this process are sales in percentage, product, financial years, growth, success.


 Continue with Email

 Home
Home


