Year Over Year Growth

Expense Incurred On Digital And Offline Marketing Promotion Ppt Slides Infographics PDF
This slide showcases analysis of amount spent on online and offline marketing over the years. The following bar graph shows expense spent on advertising through online channels increased as it has proved more to be more effective. Showcasing this set of slides titled Expense Incurred On Digital And Offline Marketing Promotion Ppt Slides Infographics PDF. The topics addressed in these templates are Growth, Online Product Promotion, 2018 To 2023. All the content presented in this PPT design is completely editable. Download it and make adjustments in color, background, font etc. as per your unique business setting.
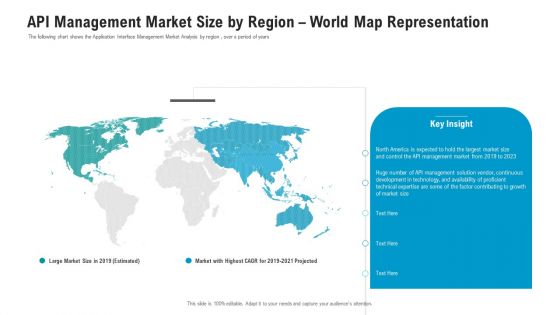
API Ecosystem API Management Market Size By Region World Map Representation Background PDF
The following chart shows the Application Interface Management Market Analysis by region , over a period of years. Presenting api ecosystem api management market size by region world map representation background pdf to provide visual cues and insights. Share and navigate important information on one stages that need your due attention. This template can be used to pitch topics like development, management, market, growth. In addtion, this PPT design contains high resolution images, graphics, etc, that are easily editable and available for immediate download.
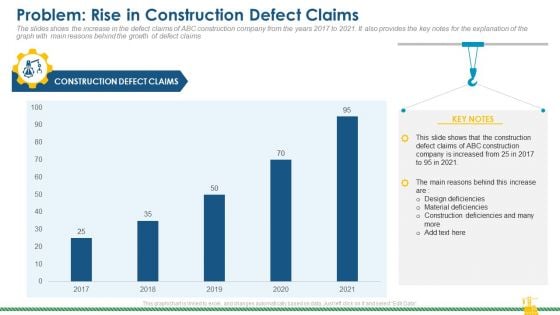
Rising Construction Defect Claims Against The Corporation Problem Rise In Construction Defect Claims Diagrams PDF
The slides shows the increase in the defect claims of ABC construction company from the years 2017 to 2021. It also provides the key notes for the explanation of the graph with main reasons behind the growth of defect claims. Deliver and pitch your topic in the best possible manner with this rising construction defect claims against the corporation problem rise in construction defect claims diagrams pdf. Use them to share invaluable insights on defect, claims, material deficiencies, design deficiencies and impress your audience. This template can be altered and modified as per your expectations. So, grab it now.
Problem Rise In Construction Defect Claims Ppt Icon Examples PDF
The slides shows the increase in the defect claims of ABC construction company from the years 2016 to 2020. It also provides the key notes for the explanation of the graph with main reasons behind the growth of defect claims. Deliver an awe inspiring pitch with this creative problem rise in construction defect claims ppt icon examples pdf bundle. Topics like material, design can be discussed with this completely editable template. It is available for immediate download depending on the needs and requirements of the user.
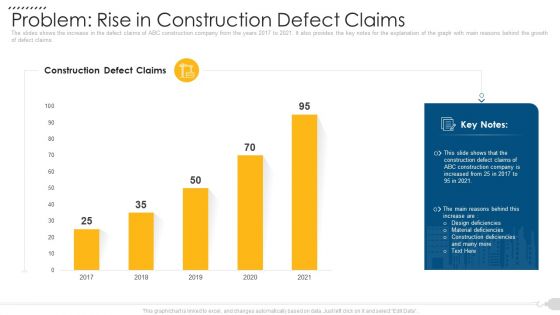
Problem Rise In Construction Defect Claims Demonstration PDF
The slides shows the increase in the defect claims of ABC construction company from the years 2017 to 2021. It also provides the key notes for the explanation of the graph with main reasons behind the growth of defect claims. Deliver and pitch your topic in the best possible manner with this problem rise in construction defect claims demonstration pdf. Use them to share invaluable insights on problem rise in construction defect claims and impress your audience. This template can be altered and modified as per your expectations. So, grab it now.
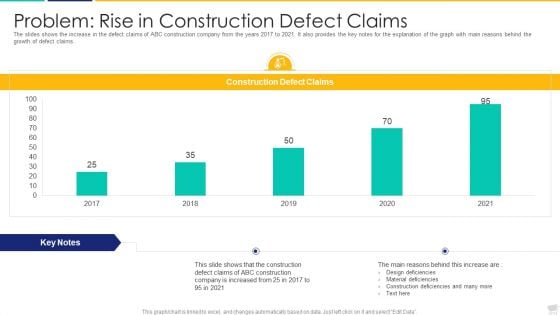
Problem Rise In Construction Defect Claims Topics PDF
The slides shows the increase in the defect claims of ABC construction company from the years 2017 to 2021. It also provides the key notes for the explanation of the graph with main reasons behind the growth of defect claims.Deliver and pitch your topic in the best possible manner with this problem rise in construction defect claims topics pdf. Use them to share invaluable insights on problem rise in construction defect claims and impress your audience. This template can be altered and modified as per your expectations. So, grab it now.
Surge In Construction Faults Lawsuits Case Competition Problem Rise In Construction Defect Claims Icons PDF
The slides shows the increase in the defect claims of ABC construction company from the years 2017 to 2021. It also provides the key notes for the explanation of the graph with main reasons behind the growth of defect claims. Deliver and pitch your topic in the best possible manner with this surge in construction faults lawsuits case competition problem rise in construction defect claims icons pdf. Use them to share invaluable insights on design deficiencies, material deficiencies, construction deficiencies and impress your audience. This template can be altered and modified as per your expectations. So, grab it now.
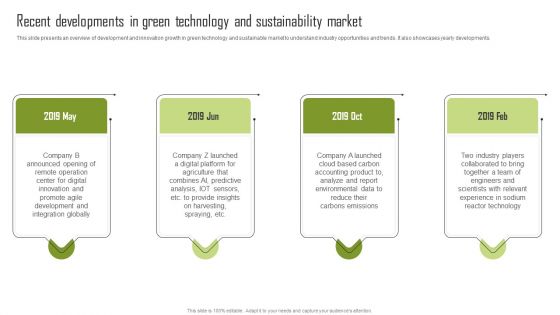
Recent Developments In Green Technology And Sustainability Market Infographics PDF
This slide presents an overview of development and innovation growth in green technology and sustainable market to understand industry opportunities and trends. It also showcases yearly developments. Present like a pro with Recent Developments In Green Technology And Sustainability Market Infographics PDF Create beautiful presentations together with your team, using our easy to use presentation slides. Share your ideas in real time and make changes on the fly by downloading our templates. So whether you are in the office, on the go, or in a remote location, you can stay in sync with your team and present your ideas with confidence. With Slidegeeks presentation got a whole lot easier. Grab these presentations today.
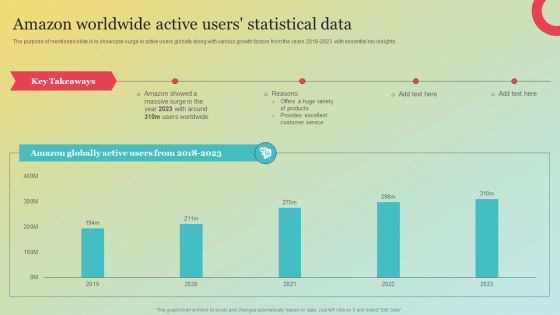
Amazons Marketing Plan To Improve Customer Engagement Amazon Worldwide Active Clipart PDF
The purpose of mentioned slide is to showcase surge in active users globally along with various growth factors from the years 2018-2023 with essential key insights. Create an editable Amazons Marketing Plan To Improve Customer Engagement Amazon Worldwide Active Clipart PDF that communicates your idea and engages your audience. Whether you are presenting a business or an educational presentation, pre designed presentation templates help save time. Amazons Marketing Plan To Improve Customer Engagement Amazon Worldwide Active Clipart PDF is highly customizable and very easy to edit, covering many different styles from creative to business presentations. Slidegeeks has creative team members who have crafted amazing templates. So, go and get them without any delay.
Ppt Linear Set Of Arrow Process 6 State Diagram PowerPoint Templates
PPT linear set of arrow process 6 state diagram PowerPoint Templates-Your growth in recent years has been rewarding. Your ideas and thoughts have contributed to this success. Use this diagram to list out the basic contributors to this rapid rise. Highlight the relevance of each step along the way.-PPT linear set of arrow process 6 state diagram PowerPoint Templates-Aim, Arrow, Arrowheads, Badge, Border, Click, Connection, Curve, Design, Direction, Download, Element, Fuchsia, Icon, Illustration, Indicator, Internet, Magenta, Mark, Object, Orientation, Pointer, Shadow, Shape, Sign Expound on your field of study with our Ppt Linear Set Of Arrow Process 6 State Diagram PowerPoint Templates. Familiarise them with what you have dug out.
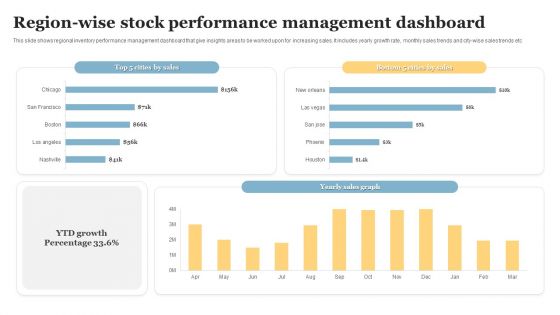
Region Wise Stock Performance Management Dashboard Introduction PDF
This slide shows regional inventory performance management dashboard that give insights areas to be worked upon for increasing sales. It includes yearly growth rate, monthly sales trends and city wise sales trends etc. Pitch your topic with ease and precision using this Region Wise Stock Performance Management Dashboard Introduction PDF. This layout presents information on Stock Performance, Management Dashboard. It is also available for immediate download and adjustment. So, changes can be made in the color, design, graphics or any other component to create a unique layout.
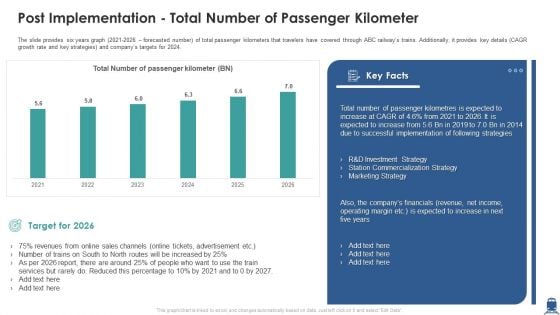
Post Implementation Total Number Of Passenger Kilometer Slides PDF
The slide provides six years graph 2021-2026 forecasted number of total passenger kilometers that travelers have covered through ABC railways trains. Additionally, it provides key details CAGR growth rate and key strategies and companys targets for 2024. Deliver an awe inspiring pitch with this creative post implementation total number of passenger kilometer slides pdf bundle. Topics like online sales channels, marketing strategy, investment strategy can be discussed with this completely editable template. It is available for immediate download depending on the needs and requirements of the user.
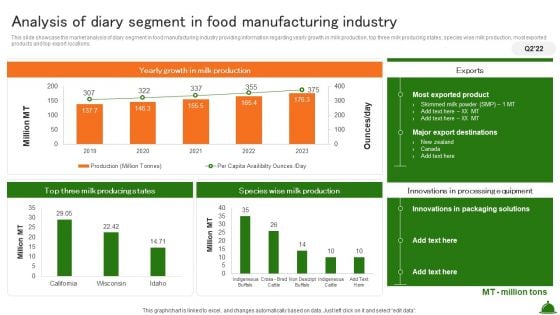
Analysis Of Diary Segment In Food Manufacturing Industry Industry Analysis Of Food Elements PDF
This slide showcase the market analysis of diary segment in food manufacturing industry providing information regarding yearly growth in milk production, top three milk producing states, species wise milk production, most exported products and top export locations.Make sure to capture your audiences attention in your business displays with our gratis customizable Analysis Of Diary Segment In Food Manufacturing Industry Industry Analysis Of Food Elements PDF. These are great for business strategies, office conferences, capital raising or task suggestions. If you desire to acquire more customers for your tech business and ensure they stay satisfied, create your own sales presentation with these plain slides.
Net Profit And Margin IT Software Development Company Profile Icons PDF
This slide illustrates a graph of net profit in US doller and net margin in percentage for IT company illustrating growth trend in last five years from 2018 to 2022. It also showcases net profit contribution by services and solutions. Deliver an awe inspiring pitch with this creative Net Profit And Margin IT Software Development Company Profile Icons PDF bundle. Topics like Net Profit, Net Profit Margin can be discussed with this completely editable template. It is available for immediate download depending on the needs and requirements of the user.
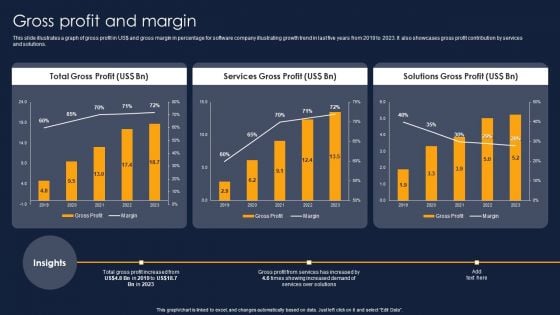
Gross Profit And Margin Financial Performance Report Of Software Firm Background PDF
This slide illustrates a graph of gross profit in US doller and gross margin in percentage for software company illustrating growth trend in last five years from 2019 to 2023. It also showcases gross profit contribution by services and solutions. From laying roadmaps to briefing everything in detail, our templates are perfect for you. You can set the stage with your presentation slides. All you have to do is download these easy-to-edit and customizable templates. Gross Profit And Margin Financial Performance Report Of Software Firm Background PDF will help you deliver an outstanding performance that everyone would remember and praise you for. Do download this presentation today.
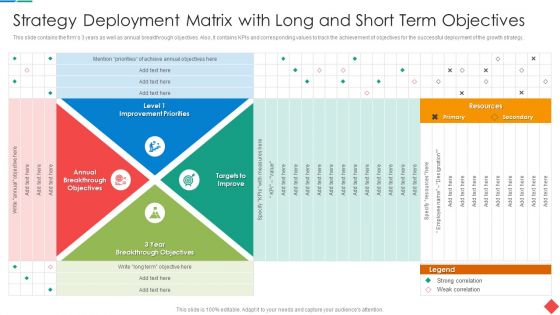
Strategy Deployment Matrix With Long And Short Term Objectives Portrait PDF
This slide contains the firms 3 years as well as annual breakthrough objectives. Also, it contains KPIs and corresponding values to track the achievement of objectives for the successful deployment of the growth strategy.Deliver and pitch your topic in the best possible manner with this Strategy Deployment Matrix With Long And Short Term Objectives Portrait PDF Use them to share invaluable insights on Annual Breakthrough Objectives, Breakthrough Objectives, Targets To Improve and impress your audience. This template can be altered and modified as per your expectations. So, grab it now.
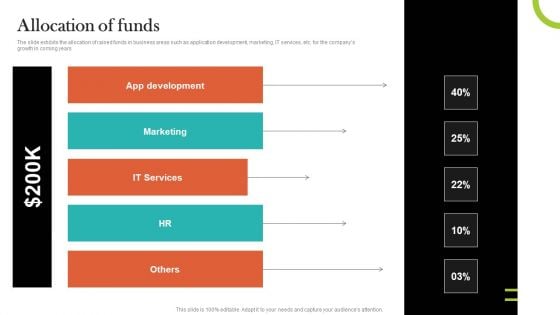
Video Promotion Service Investor Funding Elevator Pitch Deck Allocation Of Funds Elements PDF
The slide exhibits the allocation of raised funds in business areas such as application development, marketing, IT services, etc. for the companys growth in coming years Boost your pitch with our creative Video Promotion Service Investor Funding Elevator Pitch Deck Allocation Of Funds Elements PDF. Deliver an awe-inspiring pitch that will mesmerize everyone. Using these presentation templates you will surely catch everyones attention. You can browse the ppts collection on our website. We have researchers who are experts at creating the right content for the templates. So you do not have to invest time in any additional work. Just grab the template now and use them.
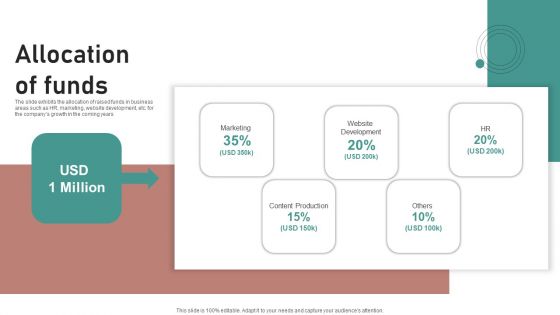
Crash Couse Platform Investor Funding Presentation Allocation Of Funds Professional PDF
The slide exhibits the allocation of raised funds in business areas such as HR, marketing, website development, etc. for the companys growth in the coming years Find a pre designed and impeccable Crash Couse Platform Investor Funding Presentation Allocation Of Funds Professional PDF. The templates can ace your presentation without additional effort. You can download these easy to edit presentation templates to make your presentation stand out from others. So, what are you waiting for Download the template from Slidegeeks today and give a unique touch to your presentation.

Recyle Symbol Environment PowerPoint Templates And PowerPoint Themes 1012
Recyle Symbol Environment PowerPoint Templates And PowerPoint Themes 1012-Develop competitive advantage with our above Template which contains a picture of page written Recycle on it. Your growth in recent years has been rewarding. Your ideas and thoughts have contributed to this success. List out the basic contributors to this rapid rise. Highlight the relevance of each step along the way.-Recyle Symbol Environment PowerPoint Templates And PowerPoint Themes 1012-This PowerPoint template can be used for presentations relating to-Recycling symbol, Symbol, Nature, Environment, Signs, Background Fill in the blanks with our Recyle Symbol Environment PowerPoint Templates And PowerPoint Themes 1012. Your thoughts will have a continuous flow.
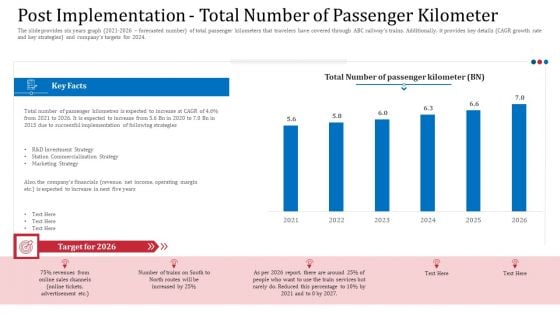
Post Implementation Total Number Of Passenger Kilometer Introduction PDF
The slide provides six years graph 2021 to 2026 forecasted number of total passenger kilometers that travelers have covered through ABC railways trains. Additionally, it provides key details CAGR growth rate and key strategies and companys targets for 2024.Deliver and pitch your topic in the best possible manner with this post implementation total number of passenger kilometer introduction pdf. Use them to share invaluable insights on successful implementation, expected to increase, successful implementation and impress your audience. This template can be altered and modified as per your expectations. So, grab it now.

Financial Banking PPT Revenue And Ebitda Forecast By Segments Ppt Styles Graphics PDF
The slide provides the Revenue and EBITDA Earning before, interest, tax, depreciation, and amortization forecast of the company by companys business segments. Its has provided the forecast for the years 2021 to 2025. Deliver and pitch your topic in the best possible manner with this financial banking ppt revenue and ebitda forecast by segments ppt styles graphics pdf. Use them to share invaluable insights on revenue, business segments, growth and impress your audience. This template can be altered and modified as per your expectations. So, grab it now.
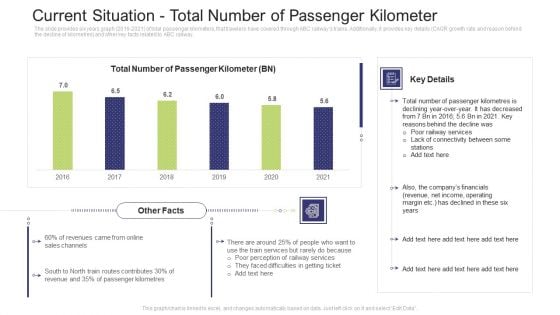
Current Situation Total Number Of Passenger Kilometer Demonstration PDF
The slide provides six years graph 2016 to 2021 of total passenger kilometers, that travelers have covered through ABC railways trains. Additionally, it provides key details CAGR growth rate and reason behind the decline of kilometres and other key facts related to ABC railway.Deliver and pitch your topic in the best possible manner with this current situation total number of passenger kilometer demonstration pdf. Use them to share invaluable insights on total number of passenger kilometer, 2016 to 20213 and impress your audience. This template can be altered and modified as per your expectations. So, grab it now.
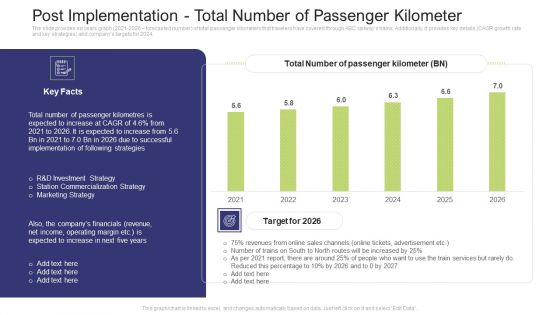
Post Implementation Total Number Of Passenger Kilometer Structure PDF
The slide provides six years graph 2021 to 2026 forecasted number of total passenger kilometers that travelers have covered through ABC railways trains. Additionally, it provides key details CAGR growth rate and key strategies and companys targets for 2024.Deliver an awe-inspiring pitch with this creative post implementation total number of passenger kilometer structure pdf. bundle. Topics like total number of passenger kilometer, 2021 to 2026 can be discussed with this completely editable template. It is available for immediate download depending on the needs and requirements of the user.
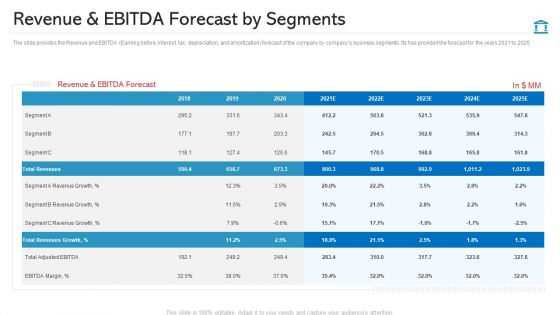
Revenue And EBITDA Forecast By Segments Graphics PDF
The slide provides the Revenue and EBITDA Earning before, interest, tax, depreciation, and amortization forecast of the company by companys business segments. Its has provided the forecast for the years 2021 to 2025 Deliver and pitch your topic in the best possible manner with this revenue and ebitda forecast by segments graphics pdf Use them to share invaluable insights on total revenues, total revenues growth present, revenue and ebitda forecast and impress your audience. This template can be altered and modified as per your expectations. So, grab it now.
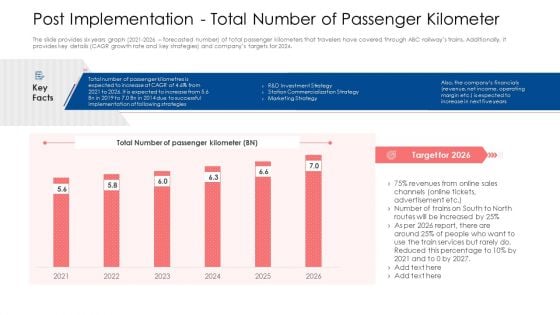
Post Implementation Total Number Of Passenger Kilometer Ppt Gallery Visual Aids PDF
The slide provides six years graph 2021-2026 forecasted number of total passenger kilometers that travelers have covered through ABC railways trains. Additionally, it provides key details CAGR growth rate and key strategies and companys targets for 2024. Deliver and pitch your topic in the best possible manner with this post implementation total number of passenger kilometer ppt gallery visual aids pdf. Use them to share invaluable insights on investment strategy, marketing strategy, commercialization strategy and impress your audience. This template can be altered and modified as per your expectations. So, grab it now.
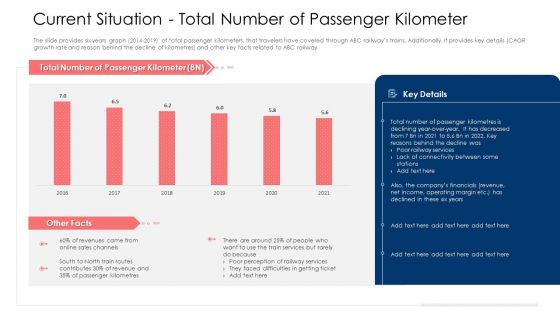
Current Situation Total Number Of Passenger Kilometer Ppt Model Designs Download PDF
The slide provides six years graph 2014-2019 of total passenger kilometers, that travelers have covered through ABC railways trains. Additionally, it provides key details CAGR growth rate and reason behind the decline of kilometres and other key facts related to ABC railway Deliver an awe inspiring pitch with this creative current situation total number of passenger kilometer ppt model designs download pdf bundle. Topics like current situation total number of passenger kilometer can be discussed with this completely editable template. It is available for immediate download depending on the needs and requirements of the user.
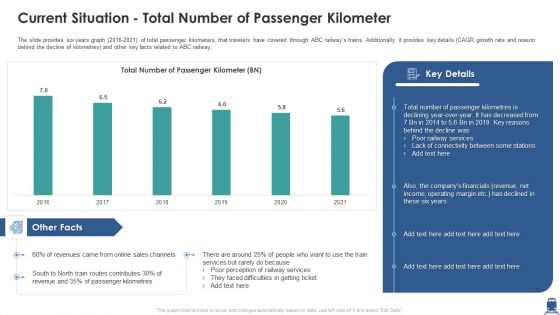
Current Situation Total Number Of Passenger Kilometer Mockup PDF
The slide provides six years graph 2016-2021 of total passenger kilometers, that travelers have covered through ABC railways trains. Additionally, it provides key details CAGR growth rate and reason behind the decline of kilometres and other key facts related to ABC railway. Deliver an awe inspiring pitch with this creative current situation total number of passenger kilometer mockup pdf bundle. Topics like current situation total number of passenger kilometer can be discussed with this completely editable template. It is available for immediate download depending on the needs and requirements of the user.
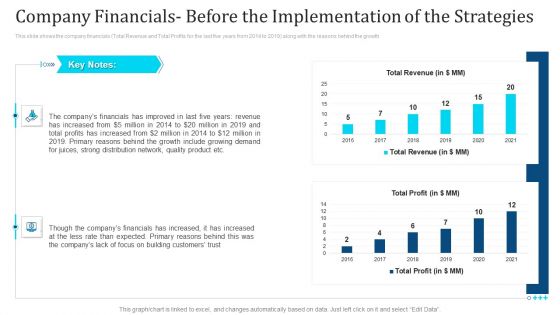
Company Financials Before The Implementation Of The Strategies Ppt Summary Visual Aids PDF
This slide shows the company financials Total Revenue and Total Profits for the last five years from 2014 to 2019 along with the reasons behind the growth Deliver and pitch your topic in the best possible manner with this company financials before the implementation of the strategies ppt summary visual aids pdf. Use them to share invaluable insights on company financials before the implementation of the strategies and impress your audience. This template can be altered and modified as per your expectations. So, grab it now.
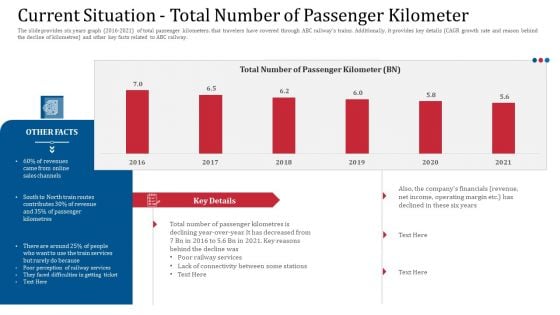
Current Situation Total Number Of Passenger Kilometer Introduction PDF
The slide provides six years graph 2016 to 2021 of total passenger kilometers, that travelers have covered through ABC railways trains. Additionally, it provides key details CAGR growth rate and reason behind the decline of kilometres and other key facts related to ABC railway.Deliver and pitch your topic in the best possible manner with this current situation total number of passenger kilometer introduction pdf. Use them to share invaluable insights on passenger trips, during peak times, current trains route and impress your audience. This template can be altered and modified as per your expectations. So, grab it now.
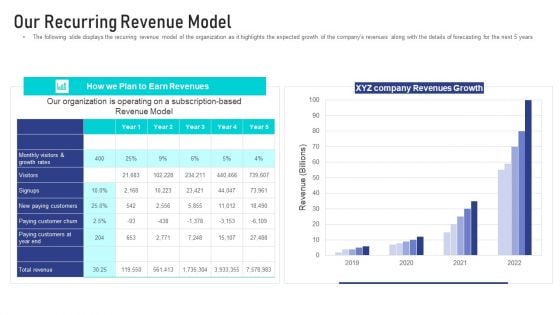
Online Broadcasting Services Sector Capital Raising Pitch Deck Our Recurring Revenue Model Sample PDF
The following slide displays the recurring revenue model of the organization as it highlights the expected growth of the companys revenues along with the details of forecasting for the next 5 years Deliver an awe inspiring pitch with this creative online broadcasting services sector capital raising pitch deck our mission and key focus points ideas pdf bundle. Topics like our recurring revenue model can be discussed with this completely editable template. It is available for immediate download depending on the needs and requirements of the user.
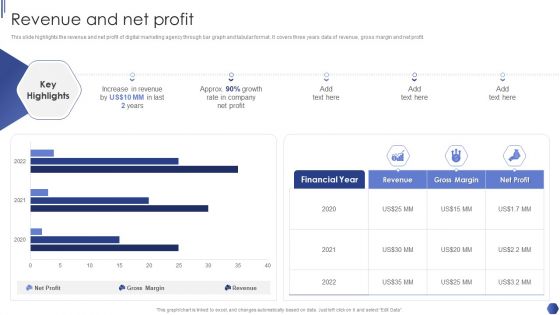
Digital Marketing Agency Business Profile Revenue And Net Profit Diagrams PDF
This slide highlights the revenue and net profit of digital marketing agency through bar graph and tabular format. It covers three years data of revenue, gross margin and net profit. Deliver and pitch your topic in the best possible manner with this Digital Marketing Agency Business Profile Revenue And Net Profit Diagrams PDF. Use them to share invaluable insights on Increase In Revenue, Growth Rate, Net Profit and impress your audience. This template can be altered and modified as per your expectations. So, grab it now.
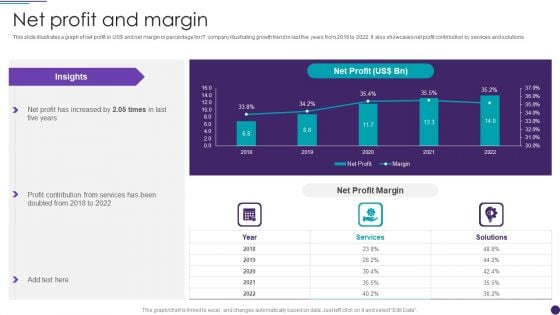
IT Services Business Profile Net Profit And Margin Sample PDF
This slide illustrates a graph of net profit in US doller and net margin in percentage for IT company illustrating growth trend in last five years from 2018 to 2022. It also showcases net profit contribution by services and solutions. Deliver and pitch your topic in the best possible manner with this IT Services Business Profile Net Profit And Margin Sample PDF. Use them to share invaluable insights on Services, Net Profit Margin and impress your audience. This template can be altered and modified as per your expectations. So, grab it now.
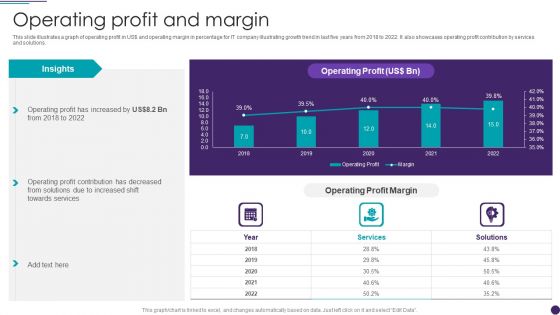
IT Services Business Profile Operating Profit And Margin Sample PDF
This slide illustrates a graph of operating profit in US doller and operating margin in percentage for IT company illustrating growth trend in last five years from 2018 to 2022. It also showcases operating profit contribution by services and solutions. Deliver an awe inspiring pitch with this creative IT Services Business Profile Operating Profit And Margin Sample PDF bundle. Topics like Operating Profit, Services can be discussed with this completely editable template. It is available for immediate download depending on the needs and requirements of the user.
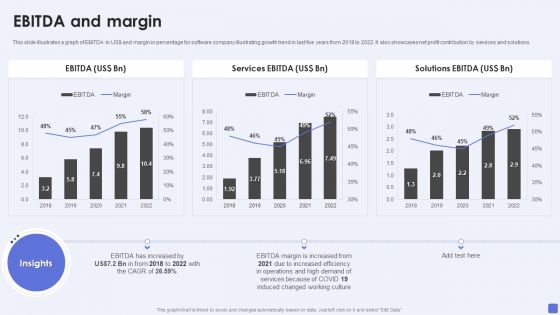
Software Services Business Profile EBITDA And Margin Ppt PowerPoint Presentation Gallery Slide Portrait PDF
This slide illustrates a graph of EBITDA in US dollar and margin in percentage for software company illustrating growth trend in last five years from 2018 to 2022. It also showcases net profit contribution by services and solutions. Deliver an awe inspiring pitch with this creative Software Services Business Profile EBITDA And Margin Ppt PowerPoint Presentation Gallery Slide Portrait PDF bundle. Topics like Services EB, Solutions EBITDA, EBITDA Margin can be discussed with this completely editable template. It is available for immediate download depending on the needs and requirements of the user.
Software Services Business Profile Gross Profit And Margin Ppt PowerPoint Presentation Gallery Templates PDF
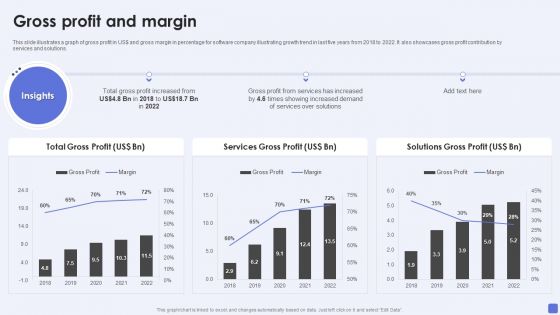
This slide illustrates a graph of gross profit in US dollar and gross margin in percentage for software company illustrating growth trend in last five years from 2018 to 2022. It also showcases gross profit contribution by services and solutions. Deliver an awe inspiring pitch with this creative Software Services Business Profile Gross Profit And Margin Ppt PowerPoint Presentation Gallery Templates PDF bundle. Topics like Total Gross Profit, Services Gross Profit, Solutions Gross Profit can be discussed with this completely editable template. It is available for immediate download depending on the needs and requirements of the user.
Software Services Business Profile Net Profit And Margin Ppt PowerPoint Presentation File Slides PDF
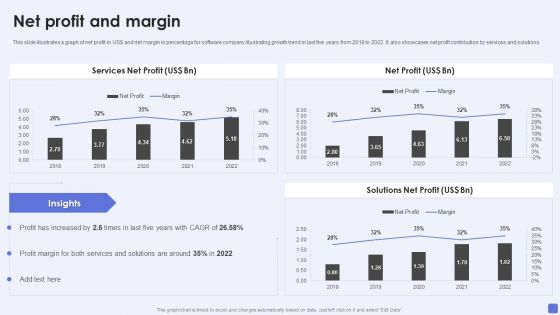
This slide illustrates a graph of net profit in US dollar and net margin in percentage for software company illustrating growth trend in last five years from 2018 to 2022. It also showcases net profit contribution by services and solutions. Deliver an awe inspiring pitch with this creative Software Services Business Profile Net Profit And Margin Ppt PowerPoint Presentation File Slides PDF bundle. Topics like Services Net Profit, Net Profit, Solutions Net Profit can be discussed with this completely editable template. It is available for immediate download depending on the needs and requirements of the user.
Software Services Business Profile Operating Profit And Margin Ppt PowerPoint Presentation Gallery Inspiration PDF
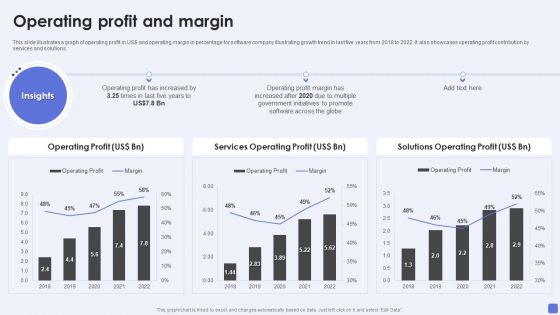
This slide illustrates a graph of operating profit in US dollar and operating margin in percentage for software company illustrating growth trend in last five years from 2018 to 2022. It also showcases operating profit contribution by services and solutions. Deliver and pitch your topic in the best possible manner with this Software Services Business Profile Operating Profit And Margin Ppt PowerPoint Presentation Gallery Inspiration PDF. Use them to share invaluable insights on Operating Profit, Services Operating Profit, Solutions Operating Profit and impress your audience. This template can be altered and modified as per your expectations. So, grab it now.
Roi Of Advertisement Income Generation Strategy For Social Networking Site Statistics Diagrams PDF
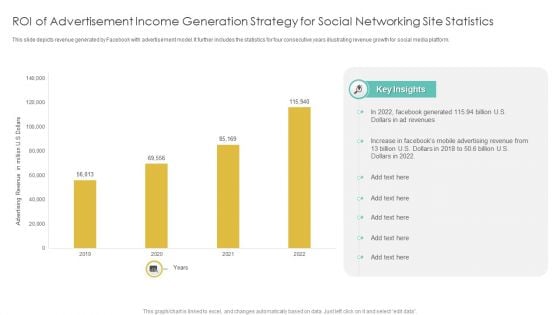
This slide depicts revenue generated by Facebook with advertisement model. It further includes the statistics for four consecutive years illustrating revenue growth for social media platform. Pitch your topic with ease and precision using this Roi Of Advertisement Income Generation Strategy For Social Networking Site Statistics Diagrams PDF. This layout presents information on Advertisement Income, Generation Strategy, Social Networking Site Statistics. It is also available for immediate download and adjustment. So, changes can be made in the color, design, graphics or any other component to create a unique layout.
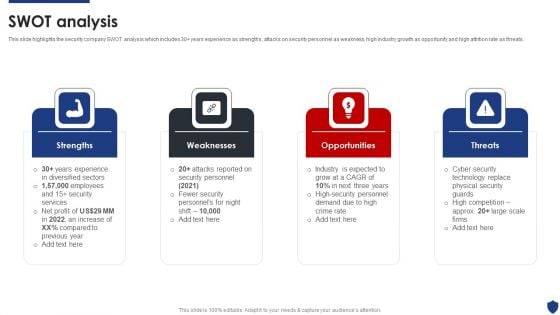
Security Officer Service Company Profile Swot Analysis Ppt PowerPoint Presentation Gallery Guide PDF
This slide highlights the security company SWOT analysis which includes 30 years experience as strengths, attacks on security personnel as weakness, high industry growth as opportunity and high attrition rate as threats. This is a Security Officer Service Company Profile Swot Analysis Ppt PowerPoint Presentation Gallery Guide PDF template with various stages. Focus and dispense information on four stages using this creative set, that comes with editable features. It contains large content boxes to add your information on topics like Strengths, Weaknesses, Opportunities, Threats. You can also showcase facts, figures, and other relevant content using this PPT layout. Grab it now.
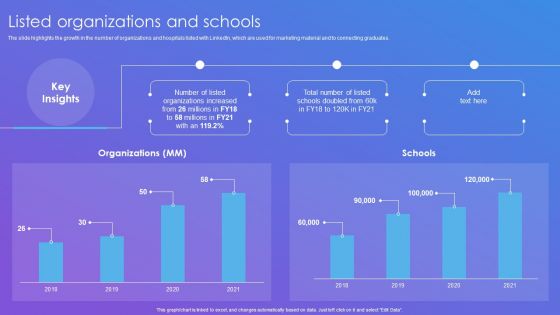
Linkedin Company Outline Listed Organizations And Schools Rules PDF
The slide showcases company revenue for last six years along with forecasted revenue for Q4F Y22. It also depicts CAGR and key insights for revenue analysis.The slide highlights the growth in the number of organizations and hospitals listed with LinkedIn, which are used for marketing material and to connecting graduates. Deliver an awe inspiring pitch with this creative Linkedin Company Outline Listed Organizations And Schools Rules PDF bundle. Topics like Organizations Increased, Schools Doubled, Organizations can be discussed with this completely editable template. It is available for immediate download depending on the needs and requirements of the user.
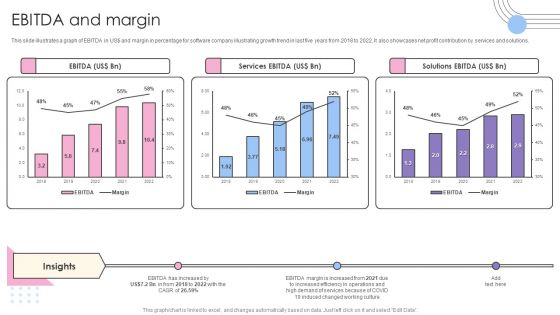
Software Products And Solutions Firm Details EBITDA And Margin Structure PDF
This slide illustrates a graph of EBITDA in US dollar and margin in percentage for software company illustrating growth trend in last five years from 2018 to 2022. It also showcases net profit contribution by services and solutions. Deliver an awe inspiring pitch with this creative Software Products And Solutions Firm Details EBITDA And Margin Structure PDF bundle. Topics like EBITDA, Services EBITDA, Solutions EBITDA, 2018 To 2022 can be discussed with this completely editable template. It is available for immediate download depending on the needs and requirements of the user.
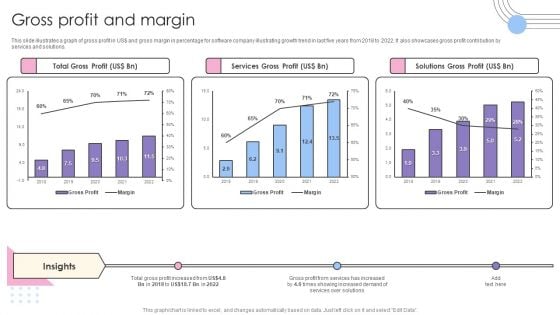
Software Products And Solutions Firm Details Gross Profit And Margin Pictures PDF
This slide illustrates a graph of gross profit in US dollar and gross margin in percentage for software company illustrating growth trend in last five years from 2018 to 2022. It also showcases gross profit contribution by services and solutions. Deliver and pitch your topic in the best possible manner with this Software Products And Solutions Firm Details Gross Profit And Margin Pictures PDF. Use them to share invaluable insights on Total Gross Profit, Services Gross Profit, Solutions Gross Profit and impress your audience. This template can be altered and modified as per your expectations. So, grab it now.
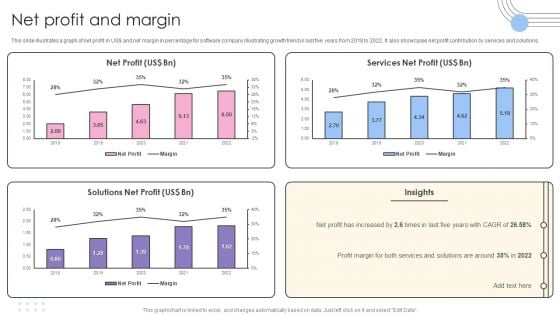
Software Products And Solutions Firm Details Net Profit And Margin Information PDF
This slide illustrates a graph of net profit in US dollar and net margin in percentage for software company illustrating growth trend in last five years from 2018 to 2022. It also showcases net profit contribution by services and solutions. Deliver and pitch your topic in the best possible manner with this Software Products And Solutions Firm Details Net Profit And Margin Information PDF. Use them to share invaluable insights on Net Profit, Services Net Profit, Solutions Net Profit and impress your audience. This template can be altered and modified as per your expectations. So, grab it now.

Software Products And Solutions Firm Details Operating Profit And Margin Mockup PDF
This slide illustrates a graph of operating profit in US dollar and operating margin in percentage for software company illustrating growth trend in last five years from 2018 to 2022. It also showcases operating profit contribution by services and solutions. Deliver an awe inspiring pitch with this creative Software Products And Solutions Firm Details Operating Profit And Margin Mockup PDF bundle. Topics like Operating Profit, Services Operating Profit, Solutions Operating Profit can be discussed with this completely editable template. It is available for immediate download depending on the needs and requirements of the user.
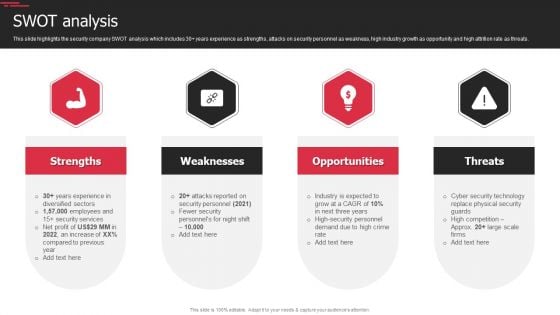
Security Agency Business Profile Swot Analysis Infographics PDF
This slide highlights the security company SWOT analysis which includes 30 years experience as strengths, attacks on security personnel as weakness, high industry growth as opportunity and high attrition rate as threats. This is a Security Agency Business Profile Swot Analysis Infographics PDF template with various stages. Focus and dispense information on four stages using this creative set, that comes with editable features. It contains large content boxes to add your information on topics like Strengths, Weaknesses, Opportunities, Threats. You can also showcase facts, figures, and other relevant content using this PPT layout. Grab it now.
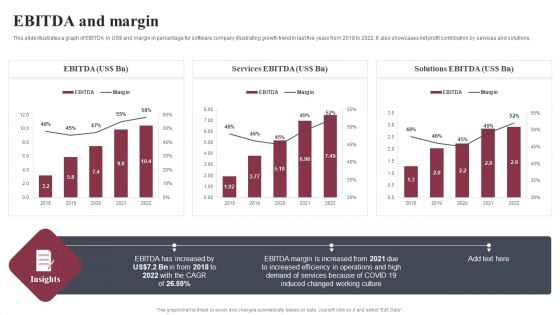
Business Software Development Company Profile EBITDA And Margin Summary PDF
This slide illustrates a graph of EBITDA in US dollar and margin in percentage for software company illustrating growth trend in last five years from 2018 to 2022. It also showcases net profit contribution by services and solutions. Deliver an awe inspiring pitch with this creative Business Software Development Company Profile EBITDA And Margin Summary PDF bundle. Topics like EBITDA, Services EBITDA, Solutions EBITDA can be discussed with this completely editable template. It is available for immediate download depending on the needs and requirements of the user.
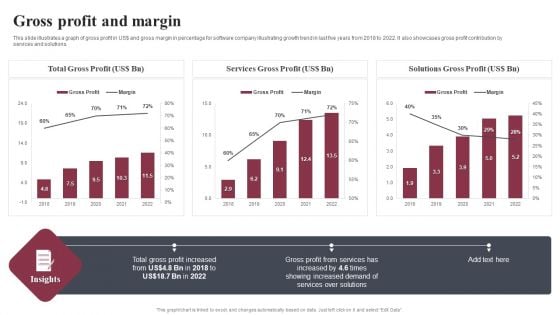
Business Software Development Company Profile Gross Profit And Margin Microsoft PDF
This slide illustrates a graph of gross profit in US dollar and gross margin in percentage for software company illustrating growth trend in last five years from 2018 to 2022. It also showcases gross profit contribution by services and solutions. Deliver and pitch your topic in the best possible manner with this Business Software Development Company Profile Gross Profit And Margin Microsoft PDF. Use them to share invaluable insights on Total Gross Profit, Services Gross Profit, Solutions Gross Profit and impress your audience. This template can be altered and modified as per your expectations. So, grab it now.
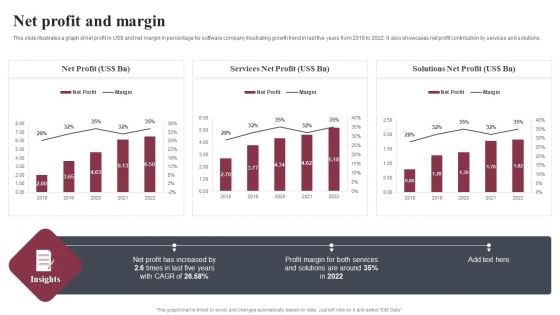
Business Software Development Company Profile Net Profit And Margin Mockup PDF
This slide illustrates a graph of net profit in US dollar and net margin in percentage for software company illustrating growth trend in last five years from 2018 to 2022. It also showcases net profit contribution by services and solutions. Deliver an awe inspiring pitch with this creative Business Software Development Company Profile Net Profit And Margin Mockup PDF bundle. Topics like Net Profit, Services Net Profit, Solutions Net Profit can be discussed with this completely editable template. It is available for immediate download depending on the needs and requirements of the user.
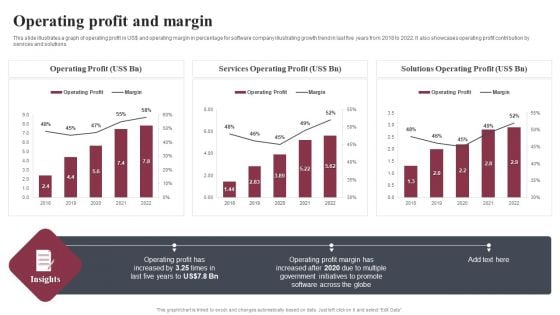
Business Software Development Company Profile Operating Profit And Margin Summary PDF
This slide illustrates a graph of operating profit in US dollar and operating margin in percentage for software company illustrating growth trend in last five years from 2018 to 2022. It also showcases operating profit contribution by services and solutions. Deliver and pitch your topic in the best possible manner with this Business Software Development Company Profile Operating Profit And Margin Summary PDF. Use them to share invaluable insights on Operating Profit, Services Operating Profit, Solutions Operating Profit and impress your audience. This template can be altered and modified as per your expectations. So, grab it now.
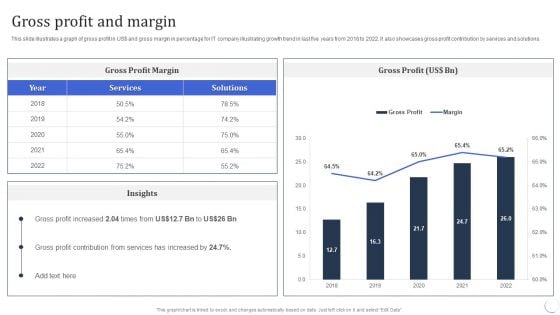
Infotech Solutions Research And Development Company Summary Gross Profit And Margin Ideas PDF
This slide illustrates a graph of gross profit in US dollar and gross margin in percentage for IT company illustrating growth trend in last five years from 2018 to 2022. It also showcases gross profit contribution by services and solutions. Deliver an awe inspiring pitch with this creative Infotech Solutions Research And Development Company Summary Gross Profit And Margin Ideas PDF bundle. Topics like Services, Gross Profit Margin can be discussed with this completely editable template. It is available for immediate download depending on the needs and requirements of the user.
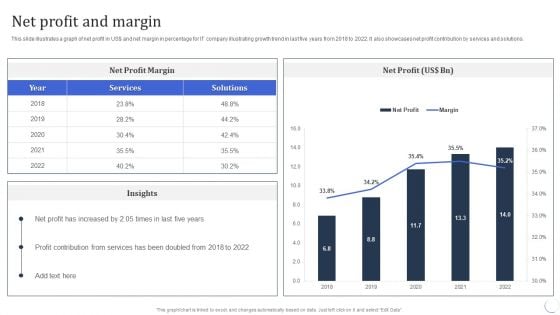
Infotech Solutions Research And Development Company Summary Net Profit And Margin Information PDF
This slide illustrates a graph of net profit in US dollar and net margin in percentage for IT company illustrating growth trend in last five years from 2018 to 2022. It also showcases net profit contribution by services and solutions. Deliver and pitch your topic in the best possible manner with this Infotech Solutions Research And Development Company Summary Net Profit And Margin Information PDF. Use them to share invaluable insights on Profit Contribution, Services, Net Profit and impress your audience. This template can be altered and modified as per your expectations. So, grab it now.
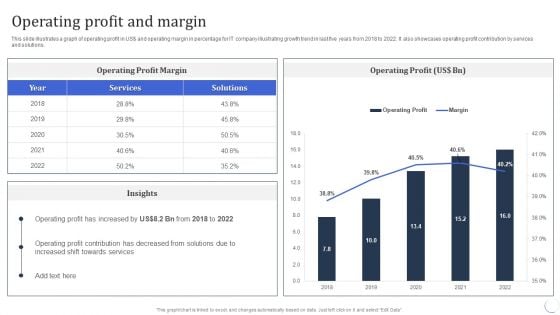
Infotech Solutions Research And Development Company Summary Operating Profit And Margin Download PDF
This slide illustrates a graph of operating profit in US dollar and operating margin in percentage for IT company illustrating growth trend in last five years from 2018 to 2022. It also showcases operating profit contribution by services and solutions. Deliver an awe inspiring pitch with this creative Infotech Solutions Research And Development Company Summary Operating Profit And Margin Download PDF bundle. Topics like Services, Operating Profit can be discussed with this completely editable template. It is available for immediate download depending on the needs and requirements of the user.
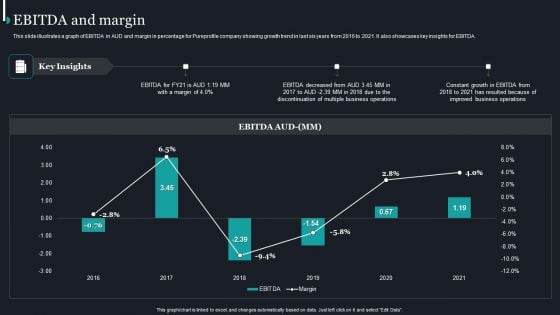
Pureprofile Business Overview EBITDA And Margin Ppt Gallery Sample PDF
This slide illustrates a graph of EBITDA in AUD and margin in percentage for Pureprofile company showing growth trend in last six years from 2016 to 2021. It also showcases key insights for EBITDA. Deliver and pitch your topic in the best possible manner with this Pureprofile Business Overview EBITDA And Margin Ppt Gallery Sample PDF. Use them to share invaluable insights on EBITDA Decreased, Business Operations, 2016 To 2021 and impress your audience. This template can be altered and modified as per your expectations. So, grab it now.
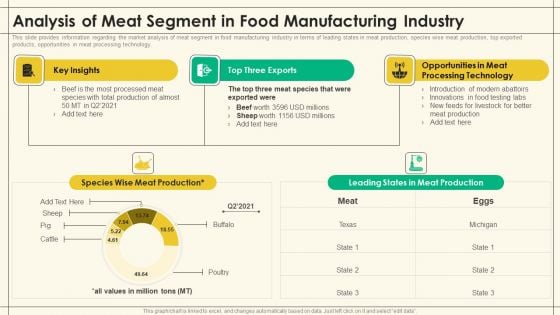
Precooked Food Industry Analysis Analysis Of Meat Segment In Food Manufacturing Industry Inspiration PDF
This slide showcase the market analysis of diary segment in food manufacturing industry providing information regarding yearly growth in milk production, top three milk producing states, species wise milk production, most exported products and top export locations.Deliver and pitch your topic in the best possible manner with this Precooked Food Industry Analysis Analysis Of Meat Segment In Food Manufacturing Industry Inspiration PDF. Use them to share invaluable insights on Production Establishments, Highest Employment, Food Manufacturing and impress your audience. This template can be altered and modified as per your expectations. So, grab it now.
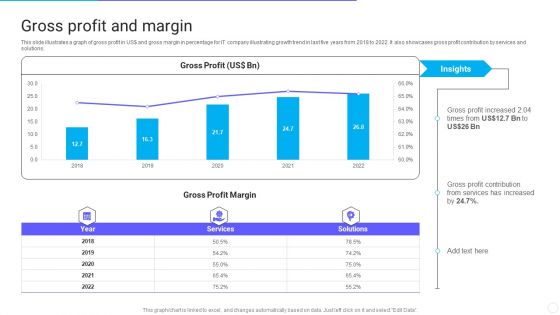
IT Application Services Company Outline Gross Profit And Margin Elements PDF
This slide illustrates a graph of gross profit in US dollar and gross margin in percentage for IT company illustrating growth trend in last five years from 2018 to 2022. It also showcases gross profit contribution by services and solutions. Deliver an awe inspiring pitch with this creative IT Application Services Company Outline Gross Profit And Margin Elements PDF bundle. Topics like Gross Profit Margin, Services can be discussed with this completely editable template. It is available for immediate download depending on the needs and requirements of the user.
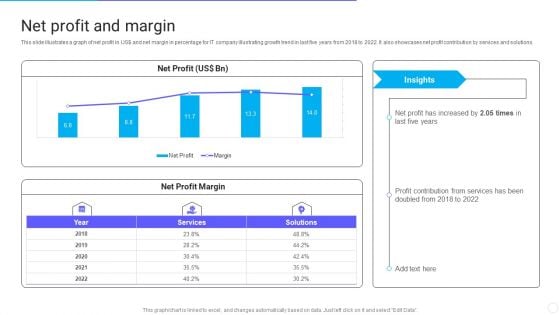
IT Application Services Company Outline Net Profit And Margin Structure PDF
This slide illustrates a graph of net profit in US dollar and net margin in percentage for IT company illustrating growth trend in last five years from 2018 to 2022. It also showcases net profit contribution by services and solutions. Deliver and pitch your topic in the best possible manner with this IT Application Services Company Outline Net Profit And Margin Structure PDF. Use them to share invaluable insights on Net Profit Margin, Services, Margin and impress your audience. This template can be altered and modified as per your expectations. So, grab it now.
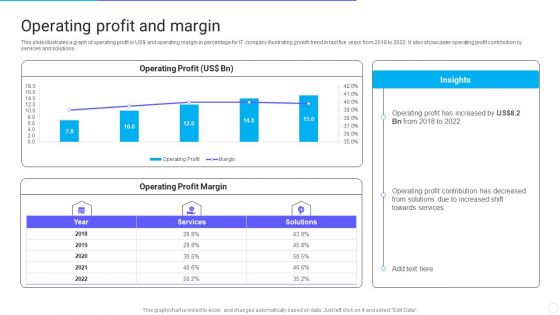
IT Application Services Company Outline Operating Profit And Margin Structure PDF
This slide illustrates a graph of operating profit in US dollar and operating margin in percentage for IT company illustrating growth trend in last five years from 2018 to 2022. It also showcases operating profit contribution by services and solutions. Deliver an awe inspiring pitch with this creative IT Application Services Company Outline Operating Profit And Margin Structure PDF bundle. Topics like Operating Profit And Margin can be discussed with this completely editable template. It is available for immediate download depending on the needs and requirements of the user.
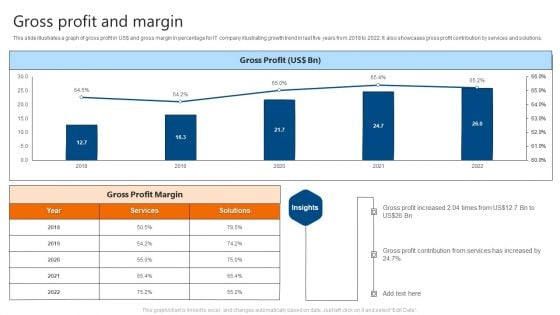
Gross Profit And Margin IT Software Development Company Profile Slides PDF
This slide illustrates a graph of gross profit in US doller and gross margin in percentage for IT company illustrating growth trend in last five years from 2018 to 2022. It also showcases gross profit contribution by services and solutions. Deliver and pitch your topic in the best possible manner with this Gross Profit And Margin IT Software Development Company Profile Slides PDF. Use them to share invaluable insights on Gross Profit, Margin and impress your audience. This template can be altered and modified as per your expectations. So, grab it now.
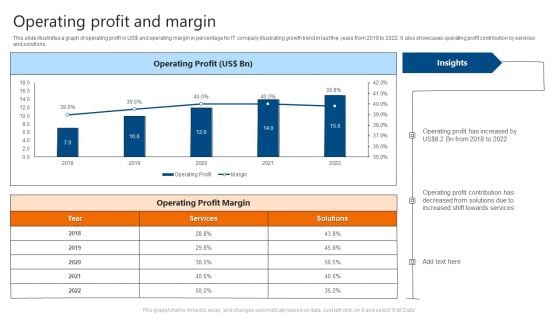
Operating Profit And Margin IT Software Development Company Profile Guidelines PDF
This slide illustrates a graph of operating profit in US doller and operating margin in percentage for IT company illustrating growth trend in last five years from 2018 to 2022. It also showcases operating profit contribution by services and solutions. Deliver and pitch your topic in the best possible manner with this Operating Profit And Margin IT Software Development Company Profile Guidelines PDF. Use them to share invaluable insights on Operating Profit, Operating Profit Margin and impress your audience. This template can be altered and modified as per your expectations. So, grab it now.
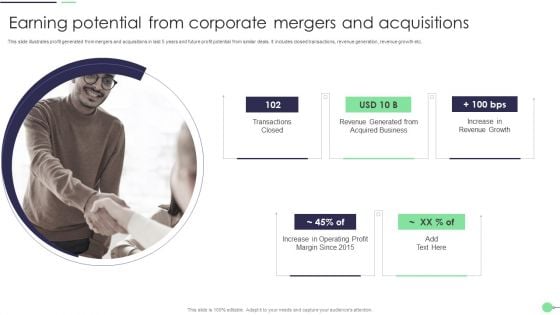
Earning Potential From Corporate Mergers And Acquisitions Clipart PDF
This slide illustrates profit generated from mergers and acquisitions in last 5 years and future profit potential from similar deals. It includes closed transactions, revenue generation, revenue growth etc. Presenting Earning Potential From Corporate Mergers And Acquisitions Clipart PDF to dispense important information. This template comprises five stages. It also presents valuable insights into the topics including Operating Profit, Acquired Business, Revenue Generated. This is a completely customizable PowerPoint theme that can be put to use immediately. So, download it and address the topic impactfully.


 Continue with Email

 Home
Home


