Year Over Year Growth
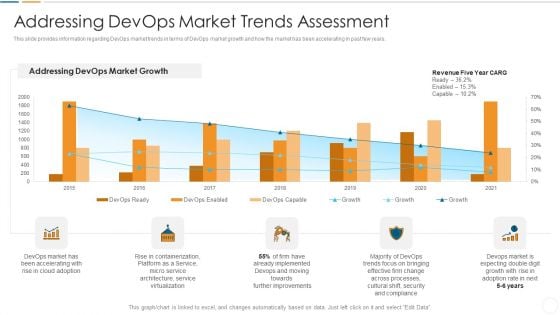
Future Trends Of Devops Industry IT Addressing Devops Market Trends Assessment Clipart PDF
This slide provides information regarding DevOps market trends in terms of DevOps market growth and how the market has been accelerating in past few years. Deliver an awe inspiring pitch with this creative future trends of devops industry it addressing devops market trends assessment clipart pdf bundle. Topics like addressing devops market growth, further improvements, cultural shift, security can be discussed with this completely editable template. It is available for immediate download depending on the needs and requirements of the user.
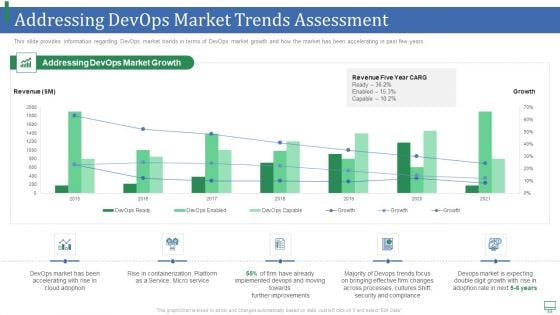
Addressing Devops Market Trends Assessment Portrait PDF
This slide provides information regarding DevOps market trends in terms of DevOps market growth and how the market has been accelerating in past few years. Deliver an awe inspiring pitch with this creative addressing devops market trends assessment portrait pdf bundle. Topics like service, implemented, processes, security, growth can be discussed with this completely editable template. It is available for immediate download depending on the needs and requirements of the user.
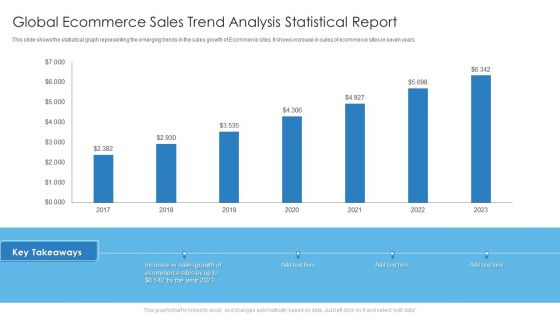
Global Ecommerce Sales Trend Analysis Statistical Report Mockup PDF
This slide shows the statistical graph representing the emerging trends in the sales growth of Ecommerce sites. It shows increase in sales of ecommerce sites in seven years. Deliver and pitch your topic in the best possible manner with this Global Ecommerce Sales Trend Analysis Statistical Report Mockup PDF. Use them to share invaluable insights on Sales Growth, Ecommerce Sites and impress your audience. This template can be altered and modified as per your expectations. So, grab it now.
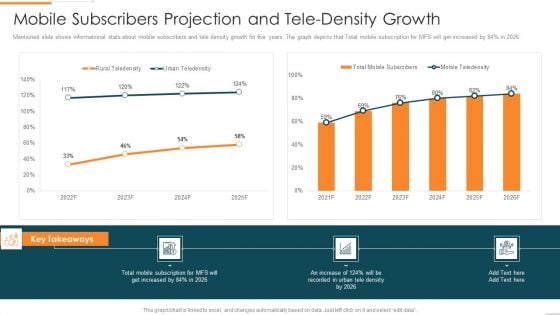
Enhanced Customer Banking Experience With Mobile Mobile Subscribers Projection Infographics PDF
Mentioned slide shows informational stats about mobile subscribers and tele density growth for five years. The graph depicts that Total mobile subscription for MFS will get increased by 84percent in 2026.Deliver an awe inspiring pitch with this creative Enhanced Customer Banking Experience With Mobile Mobile Subscribers Projection Infographics PDF bundle. Topics like Mobile Subscribers Projection And Tele-Density Growth can be discussed with this completely editable template. It is available for immediate download depending on the needs and requirements of the user.
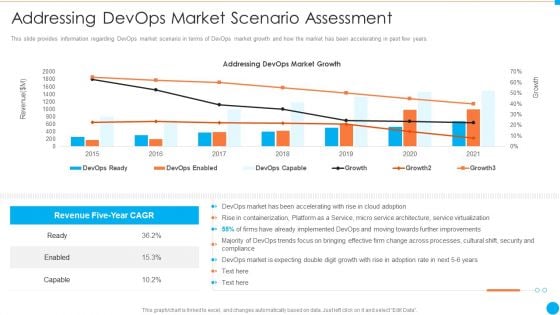
Addressing Devops Market Scenario Assessment IT Infrastructure By Executing Devops Approach Themes PDF
This slide provides information regarding DevOps market scenario in terms of DevOps market growth and how the market has been accelerating in past few years. Deliver an awe inspiring pitch with this creative addressing devops market scenario assessment it infrastructure by executing devops approach themes pdf bundle. Topics like growth, effective, improvements, virtualization, service can be discussed with this completely editable template. It is available for immediate download depending on the needs and requirements of the user.
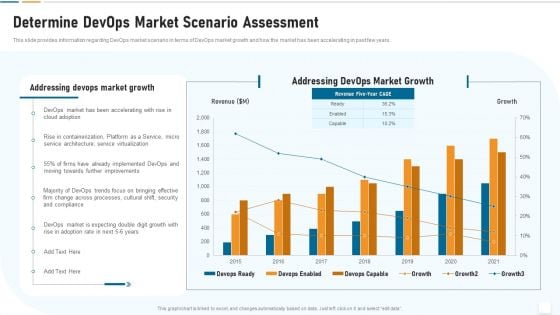
Strategic Development And Operations Execution IT Determine Devops Market Scenario Download PDF
This slide provides information regarding DevOps market scenario in terms of DevOps market growth and how the market has been accelerating in past few years. Deliver and pitch your topic in the best possible manner with this strategic development and operations execution it determine devops market scenario download pdf. Use them to share invaluable insights on improvements, implemented, processes, growth, service virtualization and impress your audience. This template can be altered and modified as per your expectations. So, grab it now.
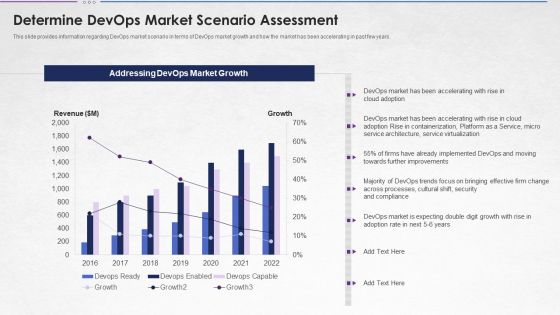
Steps For Devops Implementation IT Determine Devops Market Scenario Assessment Clipart PDF
This slide provides information regarding DevOps market scenario in terms of DevOps market growth and how the market has been accelerating in past few years. Deliver and pitch your topic in the best possible manner with this steps for devops implementation it determine devops market scenario assessment clipart pdf. Use them to share invaluable insights on market, service, security, growth and impress your audience. This template can be altered and modified as per your expectations. So, grab it now.
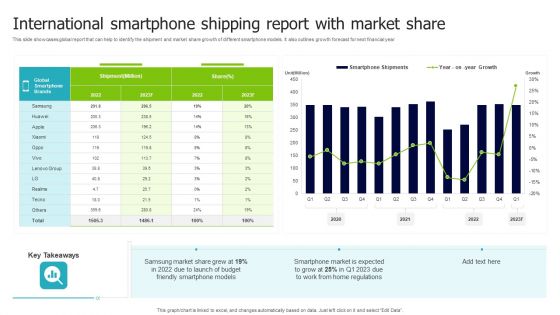
International Smartphone Shipping Report With Market Share Designs PDF
This slide showcases global report that can help to identify the shipment and market share growth of different smartphone models. It also outlines growth forecast for next financial year. Showcasing this set of slides titled International Smartphone Shipping Report With Market Share Designs PDF. The topics addressed in these templates are Shipment, Share, Global Smartphone Brands. All the content presented in this PPT design is completely editable. Download it and make adjustments in color, background, font etc. as per your unique business setting.
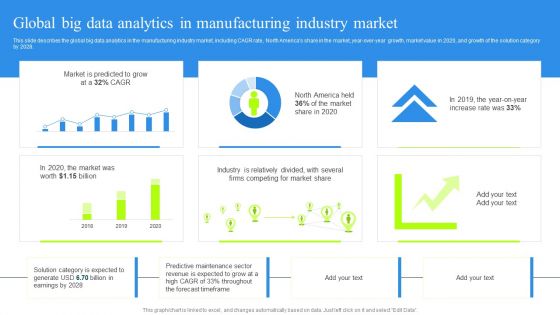
Global Big Data Analytics In Manufacturing Industry Market Pictures PDF
This slide describes the global big data analytics in the manufacturing industry market, including CAGR rate, North Americas share in the market, year-over-year growth, market value in 2020, and growth of the solution category by 2028. Find a pre-designed and impeccable Global Big Data Analytics In Manufacturing Industry Market Pictures PDF. The templates can ace your presentation without additional effort. You can download these easy-to-edit presentation templates to make your presentation stand out from others. So, what are you waiting for Download the template from Slidegeeks today and give a unique touch to your presentation.
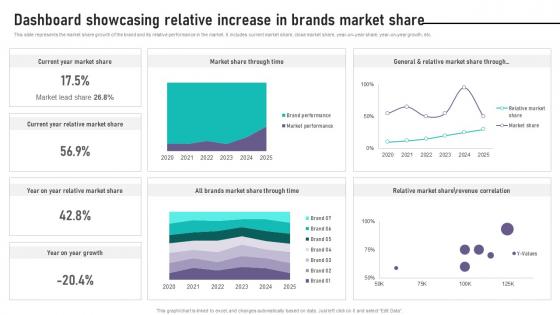
Brand Equity Management To Raise Dashboard Showcasing Relative Increase In Brands
This slide represents the market share growth of the brand and its relative performance in the market. It includes current market share, close market share, year-on-year share, year-on-year growth, etc. Crafting an eye-catching presentation has never been more straightforward. Let your presentation shine with this tasteful yet straightforward Brand Equity Management To Raise Dashboard Showcasing Relative Increase In Brands template. It offers a minimalistic and classy look that is great for making a statement. The colors have been employed intelligently to add a bit of playfulness while still remaining professional. Construct the ideal Brand Equity Management To Raise Dashboard Showcasing Relative Increase In Brands that effortlessly grabs the attention of your audience Begin now and be certain to wow your customers This slide represents the market share growth of the brand and its relative performance in the market. It includes current market share, close market share, year-on-year share, year-on-year growth, etc.
Marketing Agency Company Outline EBITDA And Margin Icons PDF
This slide illustrates a graph of EBITDA in AUD and margin in percentage for Pureprofile company showing growth trend in last six years from 2016 to 2021. It also showcases key insights for EBITDA. Are you in need of a template that can accommodate all of your creative concepts This one is crafted professionally and can be altered to fit any style. Use it with Google Slides or PowerPoint. Include striking photographs, symbols, depictions, and other visuals. Fill, move around, or remove text boxes as desired. Test out color palettes and font mixtures. Edit and save your work, or work with colleagues. Download Marketing Agency Company Outline EBITDA And Margin Icons PDF and observe how to make your presentation outstanding. Give an impeccable presentation to your group and make your presentation unforgettable.
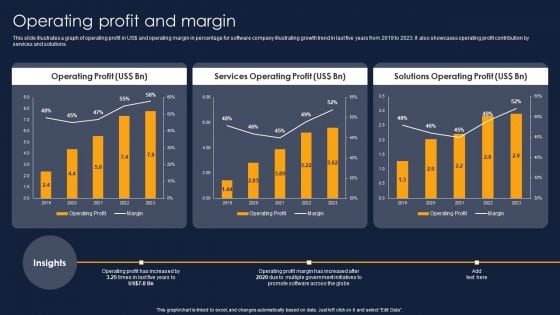
Operating Profit And Margin Financial Performance Report Of Software Firm Themes PDF
This slide illustrates a graph of operating profit in US doller and operating margin in percentage for software company illustrating growth trend in last five years from 2019 to 2023. It also showcases operating profit contribution by services and solutions. Slidegeeks is here to make your presentations a breeze with Operating Profit And Margin Financial Performance Report Of Software Firm Themes PDF With our easy-to-use and customizable templates, you can focus on delivering your ideas rather than worrying about formatting. With a variety of designs to choose from, you are sure to find one that suits your needs. And with animations and unique photos, illustrations, and fonts, you can make your presentation pop. So whether you are giving a sales pitch or presenting to the board, make sure to check out Slidegeeks first.
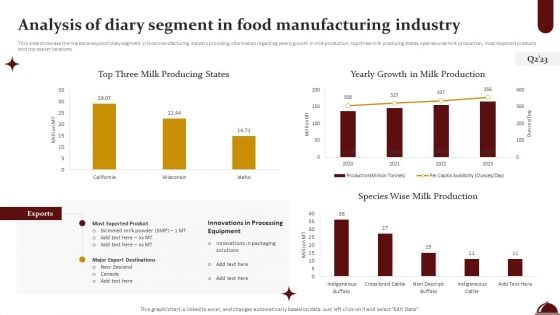
Food Processing Industry Latest Insights Trends And Analytics Analysis Of Diary Segment In Food Manufacturing Industry Mockup PDF
This slide showcase the market analysis of diary segment in food manufacturing industry providing information regarding yearly growth in milk production, top three milk producing states, species wise milk production, most exported products and top export locations. This Food Processing Industry Latest Insights Trends And Analytics Analysis Of Diary Segment In Food Manufacturing Industry Mockup PDF from Slidegeeks makes it easy to present information on your topic with precision. It provides customization options, so you can make changes to the colors, design, graphics, or any other component to create a unique layout. It is also available for immediate download, so you can begin using it right away. Slidegeeks has done good research to ensure that you have everything you need to make your presentation stand out. Make a name out there for a brilliant performance.
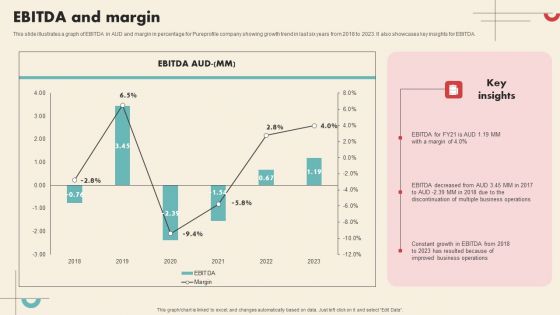
Data Driven Marketing Solutions Firm Company Profile EBITDA And Margin Download PDF
This slide illustrates a graph of EBITDA in AUD and margin in percentage for Pureprofile company showing growth trend in last six years from 2018 to 2023. It also showcases key insights for EBITDA. Whether you have daily or monthly meetings, a brilliant presentation is necessary. Data Driven Marketing Solutions Firm Company Profile EBITDA And Margin Download PDF can be your best option for delivering a presentation. Represent everything in detail using Data Driven Marketing Solutions Firm Company Profile EBITDA And Margin Download PDF and make yourself stand out in meetings. The template is versatile and follows a structure that will cater to your requirements. All the templates prepared by Slidegeeks are easy to download and edit. Our research experts have taken care of the corporate themes as well. So, give it a try and see the results.
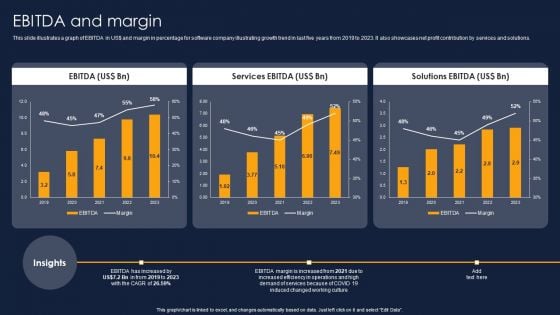
Ebitda And Margin Financial Performance Report Of Software Firm Pictures PDF
This slide illustrates a graph of EBITDA in US doller and margin in percentage for software company illustrating growth trend in last five years from 2019 to 2023. It also showcases net profit contribution by services and solutions. Get a simple yet stunning designed Ebitda And Margin Financial Performance Report Of Software Firm Pictures PDF. It is the best one to establish the tone in your meetings. It is an excellent way to make your presentations highly effective. So, download this PPT today from Slidegeeks and see the positive impacts. Our easy-to-edit Ebitda And Margin Financial Performance Report Of Software Firm Pictures PDF can be your go-to option for all upcoming conferences and meetings. So, what are you waiting for Grab this template today.

Net Profit And Margin Financial Performance Report Of Software Firm Demonstration PDF
This slide illustrates a graph of net profit in US doller and net margin in percentage for software company illustrating growth trend in last five years from 2019 to 2023. It also showcases net profit contribution by services and solutions. Present like a pro with Net Profit And Margin Financial Performance Report Of Software Firm Demonstration PDF Create beautiful presentations together with your team, using our easy-to-use presentation slides. Share your ideas in real-time and make changes on the fly by downloading our templates. So whether you are in the office, on the go, or in a remote location, you can stay in sync with your team and present your ideas with confidence. With Slidegeeks presentation got a whole lot easier. Grab these presentations today.
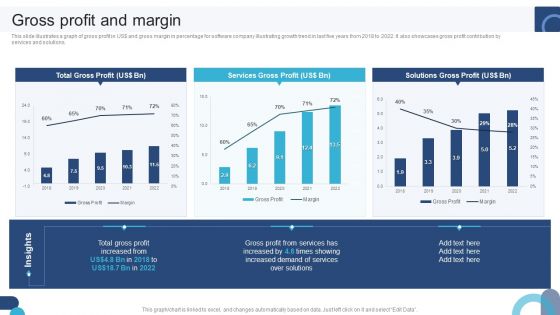
Digital Application Software Development Business Profile Gross Profit And Margin Pictures PDF
This slide illustrates a graph of gross profit in US dollar and gross margin in percentage for software company illustrating growth trend in last five years from 2018 to 2022. It also showcases gross profit contribution by services and solutions. Formulating a presentation can take up a lot of effort and time, so the content and message should always be the primary focus. The visuals of the PowerPoint can enhance the presenters message, so our Digital Application Software Development Business Profile Gross Profit And Margin Pictures PDF was created to help save time. Instead of worrying about the design, the presenter can concentrate on the message while our designers work on creating the ideal templates for whatever situation is needed. Slidegeeks has experts for everything from amazing designs to valuable content, we have put everything into Digital Application Software Development Business Profile Gross Profit And Margin Pictures PDF.
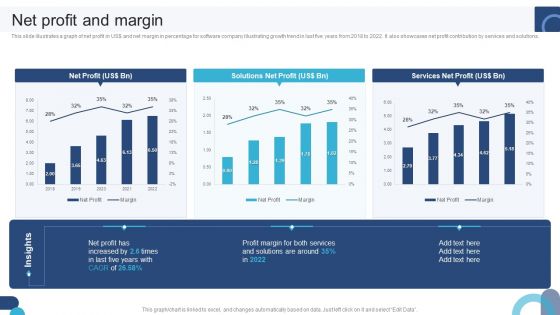
Digital Application Software Development Business Profile Net Profit And Margin Information PDF
This slide illustrates a graph of net profit in US dollar and net margin in percentage for software company illustrating growth trend in last five years from 2018 to 2022. It also showcases net profit contribution by services and solutions. Welcome to our selection of the Digital Application Software Development Business Profile Net Profit And Margin Information PDF. These are designed to help you showcase your creativity and bring your sphere to life. Planning and Innovation are essential for any business that is just starting out. This collection contains the designs that you need for your everyday presentations. All of our PowerPoints are 100 percent editable, so you can customize them to suit your needs. This multi-purpose template can be used in various situations. Grab these presentation templates today.
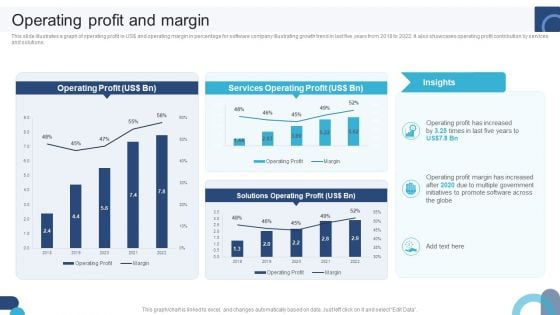
Digital Application Software Development Business Profile Operating Profit And Margin Professional PDF
This slide illustrates a graph of operating profit in US dollar and operating margin in percentage for software company illustrating growth trend in last five years from 2018 to 2022. It also showcases operating profit contribution by services and solutions. Explore a selection of the finest Digital Application Software Development Business Profile Operating Profit And Margin Professional PDF here. With a plethora of professionally designed and pre-made slide templates, you can quickly and easily find the right one for your upcoming presentation. You can use our Digital Application Software Development Business Profile Operating Profit And Margin Professional PDF to effectively convey your message to a wider audience. Slidegeeks has done a lot of research before preparing these presentation templates. The content can be personalized and the slides are highly editable. Grab templates today from Slidegeeks.
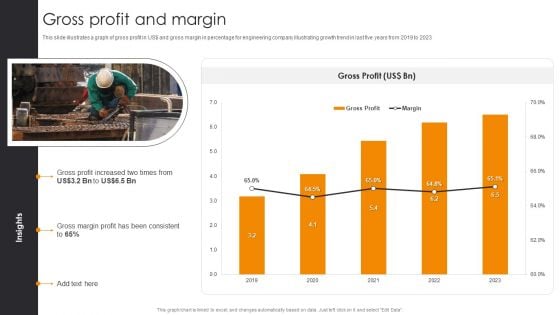
Gross Profit And Margin Engineering Company Financial Analysis Report Rules PDF
This slide illustrates a graph of gross profit in US dollar and gross margin in percentage for engineering company illustrating growth trend in last five years from 2019 to 2023. Retrieve professionally designed Gross Profit And Margin Engineering Company Financial Analysis Report Rules PDF to effectively convey your message and captivate your listeners. Save time by selecting pre-made slideshows that are appropriate for various topics, from business to educational purposes. These themes come in many different styles, from creative to corporate, and all of them are easily adjustable and can be edited quickly. Access them as PowerPoint templates or as Google Slides themes. You do not have to go on a hunt for the perfect presentation because Slidegeeks got you covered from everywhere.
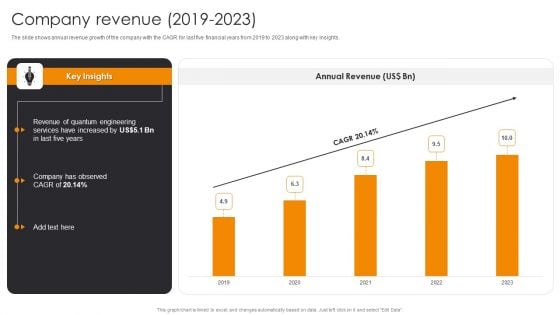
Company Revenue 2019 To 2023 Engineering Company Financial Analysis Report Structure PDF
The slide shows annual revenue growth of the company with the CAGR for last five financial years from 2019 to 2023 along with key insights.Presenting this PowerPoint presentation, titled Company Revenue 2019 To 2023 Engineering Company Financial Analysis Report Structure PDF, with topics curated by our researchers after extensive research. This editable presentation is available for immediate download and provides attractive features when used. Download now and captivate your audience. Presenting this Company Revenue 2019 To 2023 Engineering Company Financial Analysis Report Structure PDF. Our researchers have carefully researched and created these slides with all aspects taken into consideration. This is a completely customizable Company Revenue 2019 To 2023 Engineering Company Financial Analysis Report Structure PDF that is available for immediate downloading. Download now and make an impact on your audience. Highlight the attractive features available with our PPTs.
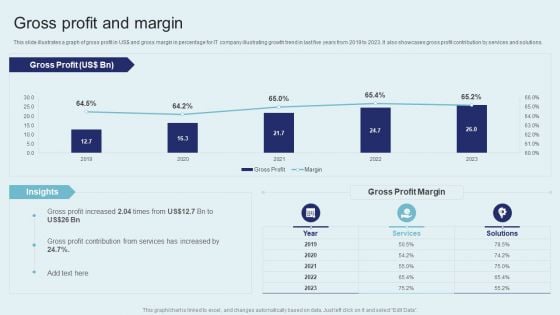
IT Firm Financial Statement Gross Profit And Margin Summary PDF
This slide illustrates a graph of gross profit in US dollar and gross margin in percentage for IT company illustrating growth trend in last five years from 2019 to 2023. It also showcases gross profit contribution by services and solutions. Boost your pitch with our creative IT Firm Financial Statement Gross Profit And Margin Summary PDF. Deliver an awe inspiring pitch that will mesmerize everyone. Using these presentation templates you will surely catch everyones attention. You can browse the ppts collection on our website. We have researchers who are experts at creating the right content for the templates. So you do not have to invest time in any additional work. Just grab the template now and use them.
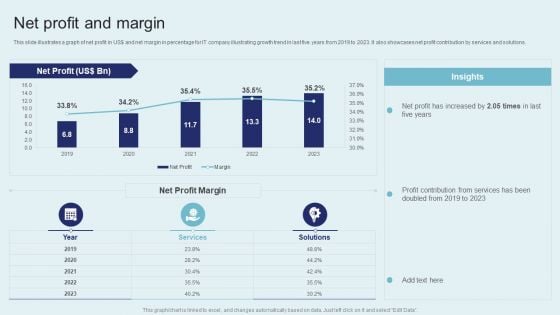
IT Firm Financial Statement Net Profit And Margin Slides PDF
This slide illustrates a graph of net profit in US dollar and net margin in percentage for IT company illustrating growth trend in last five years from 2019 to 2023. It also showcases net profit contribution by services and solutions. Do you have to make sure that everyone on your team knows about any specific topic I yes, then you should give IT Firm Financial Statement Net Profit And Margin Slides PDF a try. Our experts have put a lot of knowledge and effort into creating this impeccable IT Firm Financial Statement Net Profit And Margin Slides PDF. You can use this template for your upcoming presentations, as the slides are perfect to represent even the tiniest detail. You can download these templates from the Slidegeeks website and these are easy to edit. So grab these today.
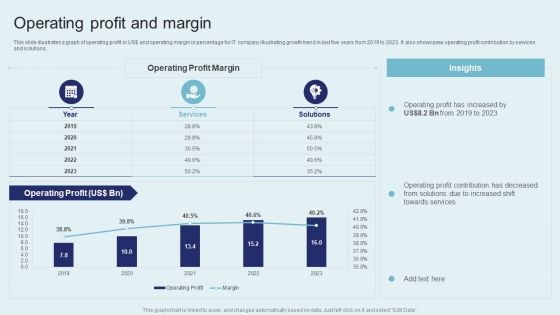
IT Firm Financial Statement Operating Profit And Margin Formats PDF
This slide illustrates a graph of operating profit in US dollar and operating margin in percentage for IT company IT Firm Fina growth trend in last five years from 2019 to 2023. It also showcases operating profit contribution by services and solutions. Get a simple yet stunning designed IT Firm Financial Statement Operating Profit And Margin Formats PDF. It is the best one to establish the tone in your meetings. It is an excellent way to make your presentations highly effective. So, download this PPT today from Slidegeeks and see the positive impacts. Our easy to edit IT Firm Financial Statement Operating Profit And Margin Formats PDF can be your go to option for all upcoming conferences and meetings. So, what are you waiting for Grab this template today.
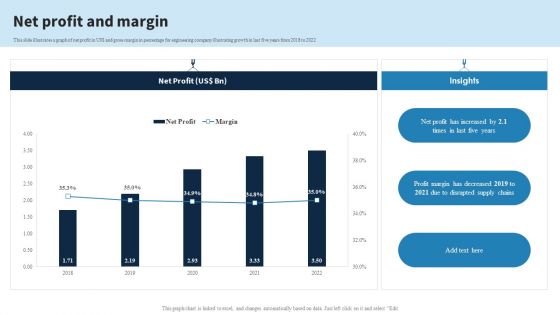
Engineering Services Company Report Net Profit And Margin Ppt PowerPoint Presentation File Aids PDF
This slide illustrates a graph of net profit in US dollar and gross margin in percentage for engineering company illustrating growth in last five years from 2018 to 2022. Present like a pro with Engineering Services Company Report Net Profit And Margin Ppt PowerPoint Presentation File Aids PDF Create beautiful presentations together with your team, using our easy-to-use presentation slides. Share your ideas in real-time and make changes on the fly by downloading our templates. So whether youre in the office, on the go, or in a remote location, you can stay in sync with your team and present your ideas with confidence. With Slidegeeks presentation got a whole lot easier. Grab these presentations today.
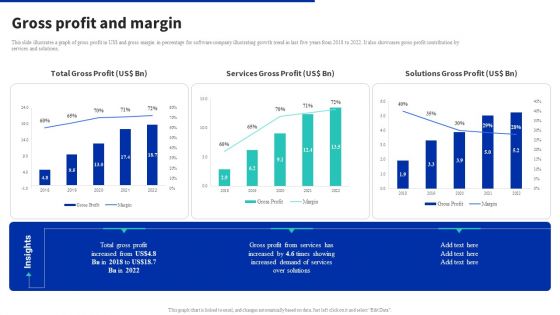
Digital Products Company Outline Gross Profit And Margin Professional PDF
This slide illustrates a graph of gross profit in US dollar and gross margin in percentage for software company illustrating growth trend in last five years from 2018 to 2022. It also showcases gross profit contribution by services and solutions. Get a simple yet stunning designed Digital Products Company Outline Gross Profit And Margin Professional PDF. It is the best one to establish the tone in your meetings. It is an excellent way to make your presentations highly effective. So, download this PPT today from Slidegeeks and see the positive impacts. Our easy to edit Digital Products Company Outline Gross Profit And Margin Professional PDF can be your go to option for all upcoming conferences and meetings. So, what are you waiting for Grab this template today.
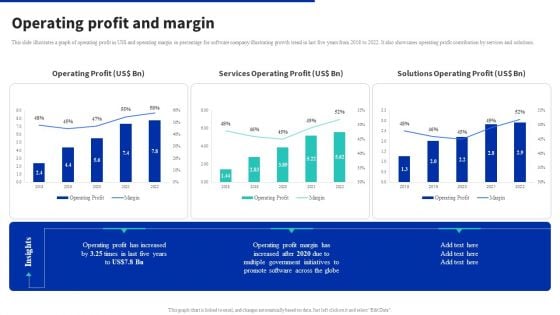
Digital Products Company Outline Operating Profit And Margin Structure PDF
This slide illustrates a graph of operating profit in US dollar and operating margin in percentage for software company illustrating growth trend in last five years from 2018 to 2022. It also showcases operating profit contribution by services and solutions. Present like a pro with Digital Products Company Outline Operating Profit And Margin Structure PDF Create beautiful presentations together with your team, using our easy to use presentation slides. Share your ideas in real time and make changes on the fly by downloading our templates. So whether you are in the office, on the go, or in a remote location, you can stay in sync with your team and present your ideas with confidence. With Slidegeeks presentation got a whole lot easier. Grab these presentations today.
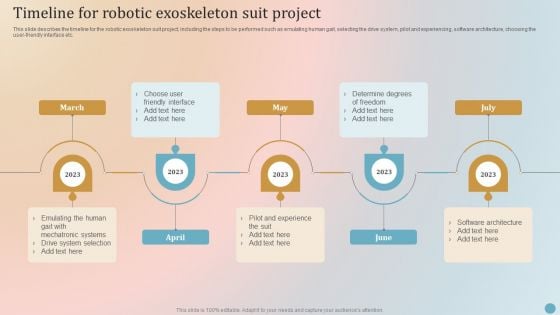
Timeline For Robotic Exoskeleton Suit Project Elements PDF
This slide represents the timeline for the growth of robotic exoskeletons in recent years from 2019 to 2023 by describing the total number of exoskeletons models or prototypes made. It also includes the establishment of future projects.Slidegeeks is one of the best resources for PowerPoint templates. You can download easily and regulate Timeline For Robotic Exoskeleton Suit Project Elements PDF for your personal presentations from our wonderful collection. A few clicks is all it takes to discover and get the most relevant and appropriate templates. Use our Templates to add a unique zing and appeal to your presentation and meetings. All the slides are easy to edit and you can use them even for advertisement purposes.
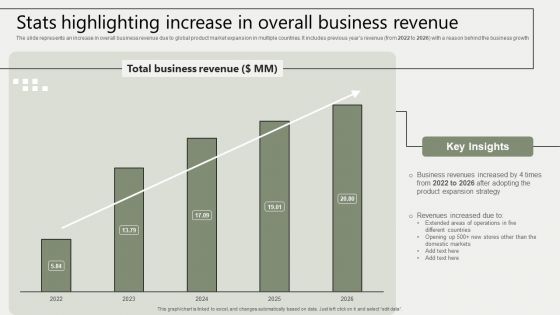
Global Business Market Development Guide Stats Highlighting Increase In Overall Business Revenue Mockup PDF
The slide represents an increase in overall business revenue due to global product market expansion in multiple countries. It includes previous years revenue from 2022 to 2026 with a reason behind the business growth Coming up with a presentation necessitates that the majority of the effort goes into the content and the message you intend to convey. The visuals of a PowerPoint presentation can only be effective if it supplements and supports the story that is being told. Keeping this in mind our experts created Global Business Market Development Guide Stats Highlighting Increase In Overall Business Revenue Mockup PDF to reduce the time that goes into designing the presentation. This way, you can concentrate on the message while our designers take care of providing you with the right template for the situation.
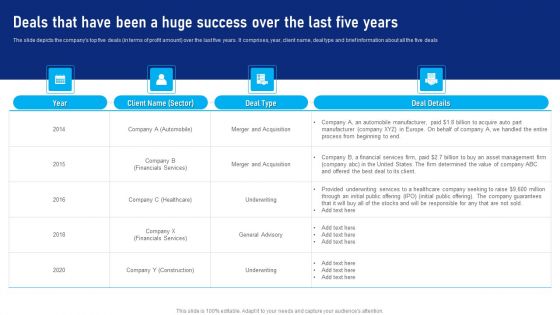
Buy Side Advisory Services In M And A Deals That Have Been A Huge Success Introduction PDF
The slide depicts the companys top five deals in terms of profit amount over the last five years. It comprises, year, client name, deal type and brief information about all the five deals. Are you searching for a Buy Side Advisory Services In M And A Deals That Have Been A Huge Success Introduction PDF that is uncluttered, straightforward, and original Its easy to edit, and you can change the colors to suit your personal or business branding. For a presentation that expresses how much effort you ve put in, this template is ideal With all of its features, including tables, diagrams, statistics, and lists, its perfect for a business plan presentation. Make your ideas more appealing with these professional slides. Download Buy Side Advisory Services In M And A Deals That Have Been A Huge Success Introduction PDF from Slidegeeks today.
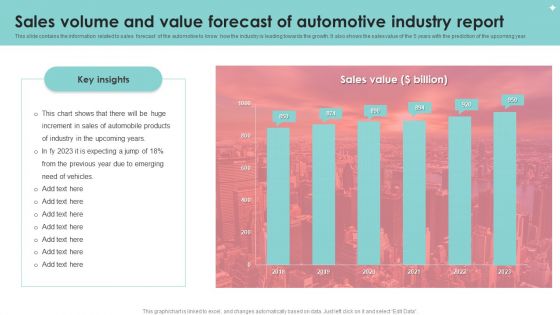
Sales Volume And Value Forecast Of Automotive Industry Report Diagrams PDF
This slide contains the information related to sales forecast of the automotive to know how the industry is leading towards the growth. It also shows the sales value of the 5 years with the prediction of the upcoming year. Showcasing this set of slides titled Sales Volume And Value Forecast Of Automotive Industry Report Diagrams PDF. The topics addressed in these templates are Sales Volume, Value Forecast, Automotive Industry Report. All the content presented in this PPT design is completely editable. Download it and make adjustments in color, background, font etc. as per your unique business setting.
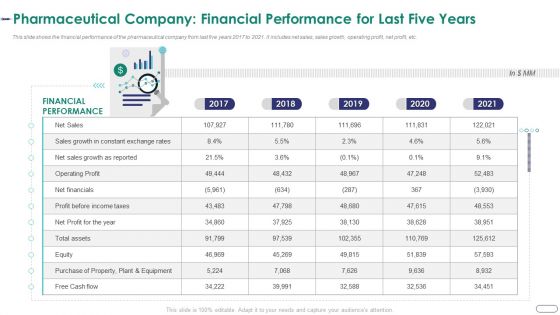
Strategies Envr Onmental Operational Challenges Pharmaceutical Company Financial Performance Elements PDF
This slide shows the financial performance of the pharmaceutical company from last five years 2017 to 2021. It includes net sales, sales growth, operating profit, net profit, etc. Deliver and pitch your topic in the best possible manner with this strategies envr onmental operational challenges pharmaceutical company financial performance elements pdf. Use them to share invaluable insights on pharmaceutical company financial performance for last five years and impress your audience. This template can be altered and modified as per your expectations. So, grab it now.
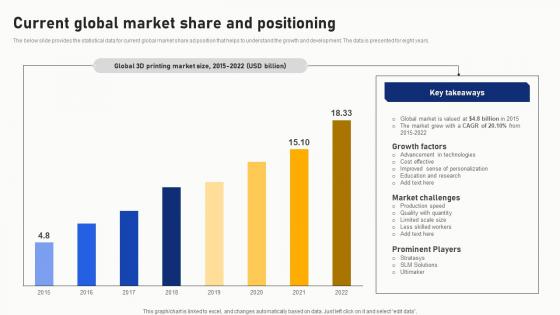
Current Global Market Share And Positioning Portrait Pdf
The below slide provides the statistical data for current global market share ad position that helps to understand the growth and development. The data is presented for eight years. Showcasing this set of slides titled Current Global Market Share And Positioning Portrait Pdf. The topics addressed in these templates are Current Global Market Share, Positioning. All the content presented in this PPT design is completely editable. Download it and make adjustments in color, background, font etc. as per your unique business setting. The below slide provides the statistical data for current global market share ad position that helps to understand the growth and development. The data is presented for eight years.
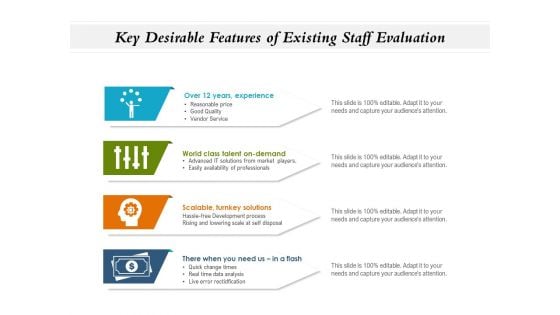
Key Desirable Features Of Existing Staff Evaluation Ppt PowerPoint Presentation Styles Portrait PDF
Persuade your audience using this key desirable features of existing staff evaluation ppt powerpoint presentation styles portrait pdf. This PPT design covers four stages, thus making it a great tool to use. It also caters to a variety of topics including over 12 years, experience, world class talent on-demand, scalable, turnkey solutions, there when you need us in a flash, reasonable price, good quality, vendor service, advanced it solutions from market players, easily availability of professionals, hassle free development process, rising and lowering scale at self disposal, quick change times, real time data analysis, live error rectidfication. Download this PPT design now to present a convincing pitch that not only emphasizes the topic but also showcases your presentation skills.
Zigzag Business Roadmap Infographics Powerpoint Slides
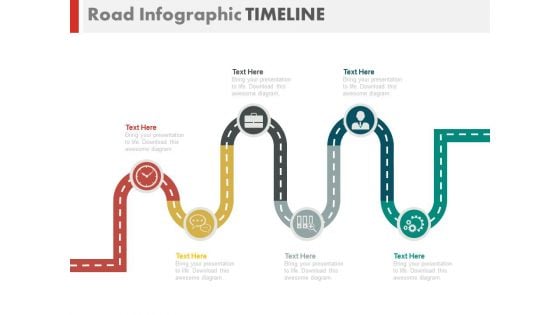
This timeline slide design can be used to display yearly business growth. It contains zigzag business roadmap with icons. This timeline template can be used in presentations where you need to display a roadmap or it may be used for business target analysis.
Zigzag Timeline With Business Icons Powerpoint Slides
This timeline slide design can be used to display yearly business growth. It contains zigzag business roadmap with icons. This timeline template can be used in presentations where you need to display a roadmap or it may be used for business target analysis.
Six Steps Timeline For Business Research And Analysis Powerpoint Slides
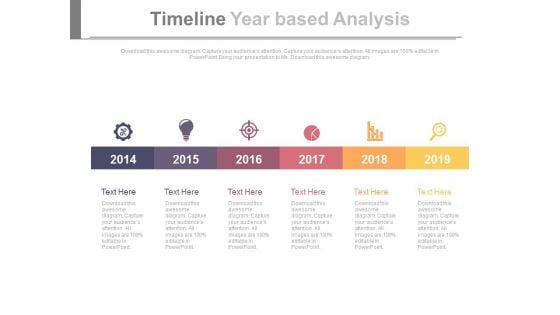
This timeline slide design can be used to display yearly business growth. It contains linear steps with icons. This timeline template can be used in presentations where you need to display research and analysis or it may be used for business target analysis.

Timeline Infographic Chart For Business Agenda Powerpoint Slides
This timeline slide design can be used to display yearly business growth. It contains zigzag business roadmap with icons. This timeline template can be used in presentations where you need to display a roadmap or it may be used for business target analysis.
Annual Sales Work Schedule For Estimation Of Revenue And Product Positioning Goals Demonstration PDF
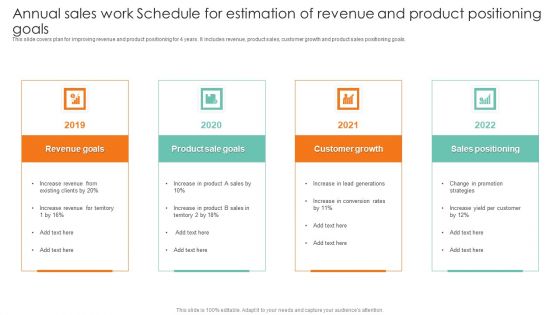
This slide covers plan for improving revenue and product positioning for 4 years. It includes revenue, product sales, customer growth and product sales positioning goals.Presenting Annual Sales Work Schedule For Estimation Of Revenue And Product Positioning Goals Demonstration PDF to dispense important information. This template comprises four stages. It also presents valuable insights into the topics including Revenue Goals, Customer Growth, Sales Positioning. This is a completely customizable PowerPoint theme that can be put to use immediately. So, download it and address the topic impactfully.
Decline In Sales Revenue Of Cnn E Commerce Company Globally Mockup PDF
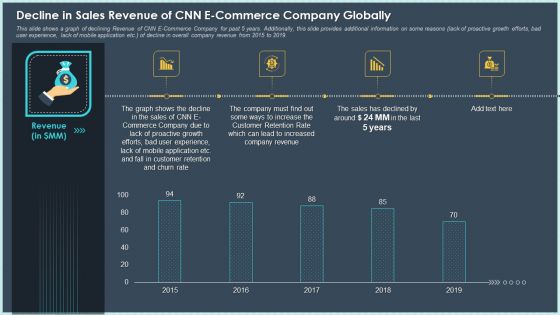
This slide shows a graph of declining Revenue of CNN E-Commerce Company for past 5 years. Additionally, this slide provides additional information on some reasons lack of proactive growth efforts, bad user experience, lack of mobile application etc. of decline in overall company revenue from 2015 to 2019. Deliver and pitch your topic in the best possible manner with this decline in sales revenue of cnn e commerce company globally mockup pdf. Use them to share invaluable insights on customer retention and churn rate, proactive growth, customer retention rate and impress your audience. This template can be altered and modified as per your expectations. So, grab it now.
Optimizing Brand Equity Through Strategic Management Dashboard Showcasing Relative Increase Brands Market Share Icons PDF
This slide represents the market share growth of the brand and its relative performance in the market. It includes current market share, close market share, year-on-year share, year-on-year growth, etc. From laying roadmaps to briefing everything in detail, our templates are perfect for you. You can set the stage with your presentation slides. All you have to do is download these easy-to-edit and customizable templates. Optimizing Brand Equity Through Strategic Management Dashboard Showcasing Relative Increase Brands Market Share Icons PDF will help you deliver an outstanding performance that everyone would remember and praise you for. Do download this presentation today.
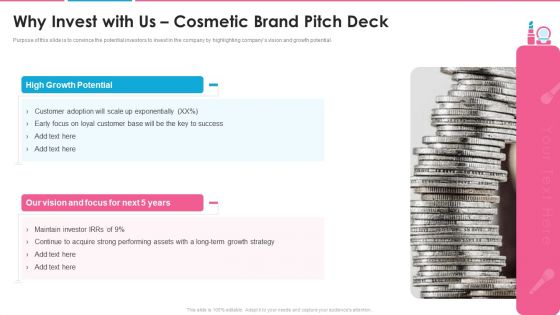
Investor Pitch Presentation For Beauty Product Brands Why Invest With Us Cosmetic Brand Pitch Deck Topics PDF
Purpose of this slide is to convince the potential investors to invest in the company by highlighting companys vision and growth potential. Presenting investor pitch presentation for beauty product brands why invest with us cosmetic brand pitch deck topics pdf to provide visual cues and insights. Share and navigate important information on two stages that need your due attention. This template can be used to pitch topics like high growth potential, our vision and focus for next 5 years. In addtion, this PPT design contains high resolution images, graphics, etc, that are easily editable and available for immediate download.
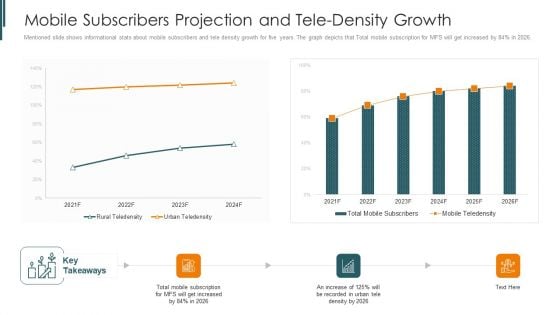
Introduction To Mobile Money In Developing Countries Mobile Subscribers Projection Elements PDF
Mentioned slide shows informational stats about mobile subscribers and tele density growth for five years. The graph depicts that Total mobile subscription for MFS will get increased by 84persent in 2026. Deliver an awe inspiring pitch with this creative introduction to mobile money in developing countries mobile subscribers projection elements pdf bundle. Topics like mobile subscribers projection and tele density growth can be discussed with this completely editable template. It is available for immediate download depending on the needs and requirements of the user.
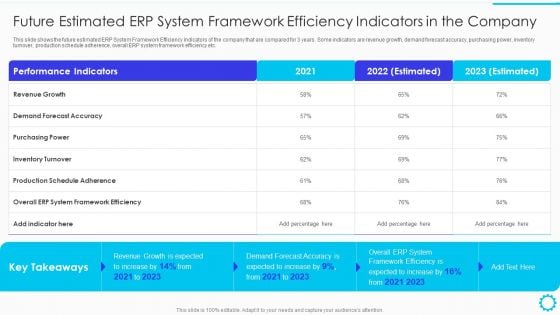
Summary Of Cloud ERP System Framework Future Estimated ERP System Framework Efficiency Indicators In The Company Background PDF
This slide shows the future estimated ERP System Framework Efficiency Indicators of the company that are compared for 3 years. Some indicators are revenue growth, demand forecast accuracy, purchasing power, inventory turnover, production schedule adherence, overall ERP system framework efficiency etc. Deliver and pitch your topic in the best possible manner with this Summary Of Cloud ERP System Framework Future Estimated ERP System Framework Efficiency Indicators In The Company Background PDF Use them to share invaluable insights on Revenue Growth Is Expected, Demand Forecast Accuracy, Framework Efficiency and impress your audience. This template can be altered and modified as per your expectations. So, grab it now.
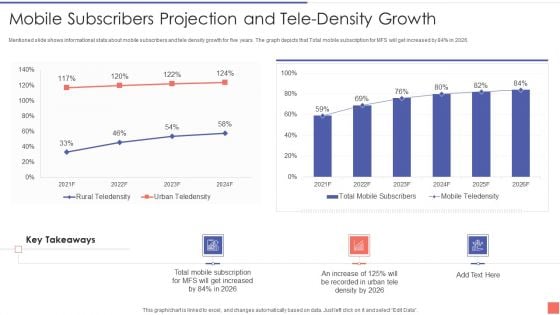
Providing Electronic Financial Services To Existing Consumers Mobile Subscribers Projection Demonstration PDF
Mentioned slide shows informational stats about mobile subscribers and tele density growth for five years. The graph depicts that Total mobile subscription for MFS will get increased by 84 percentage in 2026. Deliver an awe inspiring pitch with this creative Providing Electronic Financial Services To Existing Consumers Mobile Subscribers Projection Demonstration PDF bundle. Topics like Mobile Subscribers Projection And Tele Density Growth can be discussed with this completely editable template. It is available for immediate download depending on the needs and requirements of the user.
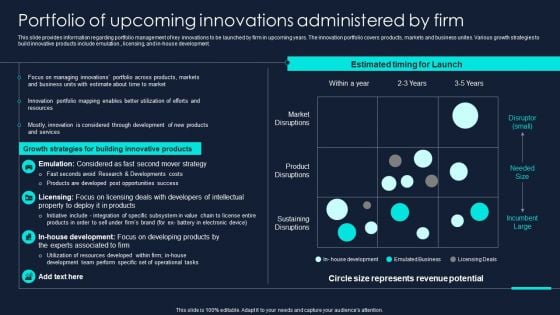
Developing Significant Business Portfolio Of Upcoming Innovations Administered Topics PDF
This slide provides information regarding portfolio management of key innovations to be launched by firm in upcoming years. The innovation portfolio covers products, markets and business unites. Various growth strategies to build innovative products include emulation., licensing, and in-house development. Deliver an awe inspiring pitch with this creativeDeveloping Significant Business Portfolio Of Upcoming Innovations Administered Topics PDF bundle. Topics like Estimated Timing Launch, Growth Strategies, Building Innovative Products can be discussed with this completely editable template. It is available for immediate download depending on the needs and requirements of the user.
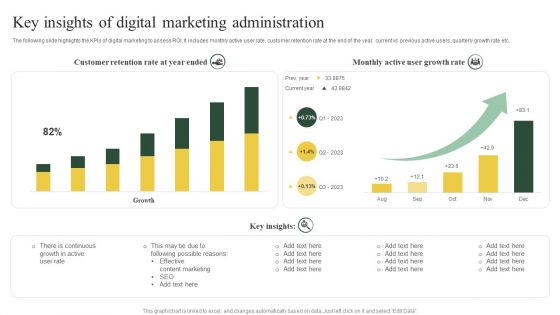
Key Insights Of Digital Marketing Administration Ppt PowerPoint Presentation Styles Graphics Template PDF
The following slide highlights the KPIs of digital marketing to assess ROI. It includes monthly active user rate, customer retention rate at the end of the year, current vs previous active users, quarterly growth rate etc.Pitch your topic with ease and precision using this Key Insights Of Digital Marketing Administration Ppt PowerPoint Presentation Styles Graphics Template PDF. This layout presents information on Possible Reasons, Content Marketing, Growth Rate. It is also available for immediate download and adjustment. So, changes can be made in the color, design, graphics or any other component to create a unique layout.
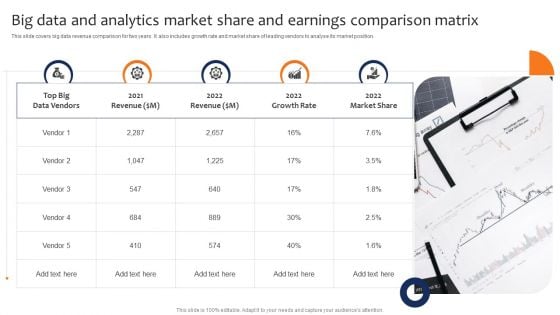
Big Data And Analytics Market Share And Earnings Comparison Matrix Elements PDF
This slide covers big data revenue comparison for two years. It also includes growth rate and market share of leading vendors to analyse its market position. Persuade your audience using this Big Data And Analytics Market Share And Earnings Comparison Matrix Elements PDF. This PPT design covers five stages, thus making it a great tool to use. It also caters to a variety of topics including Revenue, Growth Rate, Market Share. Download this PPT design now to present a convincing pitch that not only emphasizes the topic but also showcases your presentation skills.
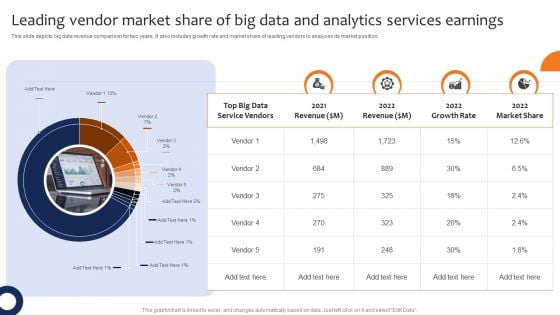
Leading Vendor Market Share Of Big Data And Analytics Services Earnings Professional PDF
This slide depicts big data revenue comparison for two years. It also includes growth rate and market share of leading vendors to analyses its market position. Pitch your topic with ease and precision using this Leading Vendor Market Share Of Big Data And Analytics Services Earnings Professional PDF. This layout presents information on Revenue, Growth Rate, Market Share. It is also available for immediate download and adjustment. So, changes can be made in the color, design, graphics or any other component to create a unique layout.
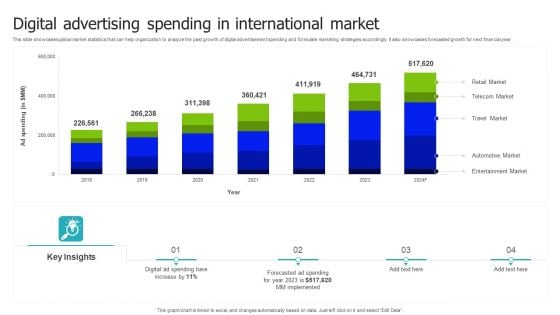
Digital Advertising Spending In International Market Demonstration PDF
This slide showcases global market statistics that can help organization to analyze the past growth of digital advertisement spending and formulate marketing strategies accordingly. It also showcases forecasted growth for next financial year. Showcasing this set of slides titled Digital Advertising Spending In International Market Demonstration PDF. The topics addressed in these templates are Retail Market, Telecom Market, Travel Market . All the content presented in this PPT design is completely editable. Download it and make adjustments in color, background, font etc. as per your unique business setting.
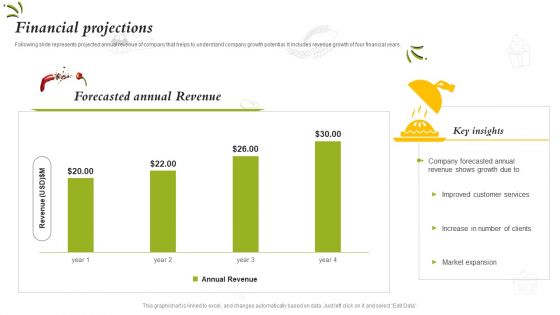
Catering Business Investment Funding Deck Financial Projections Slides PDF
Following slide represents projected annual revenue of company that helps to understand company growth potential. It includes revenue growth of four financial years. Crafting an eye catching presentation has never been more straightforward. Let your presentation shine with this tasteful yet straightforward Catering Business Investment Funding Deck Financial Projections Slides PDF template. It offers a minimalistic and classy look that is great for making a statement. The colors have been employed intelligently to add a bit of playfulness while still remaining professional. Construct the ideal Catering Business Investment Funding Deck Financial Projections Slides PDF that effortlessly grabs the attention of your audience. Begin now and be certain to wow your customers.
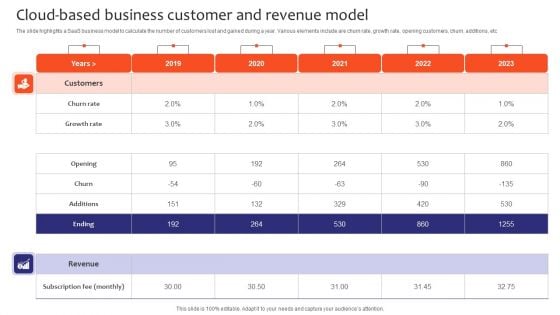
Cloud Based Business Customer And Revenue Model Information PDF
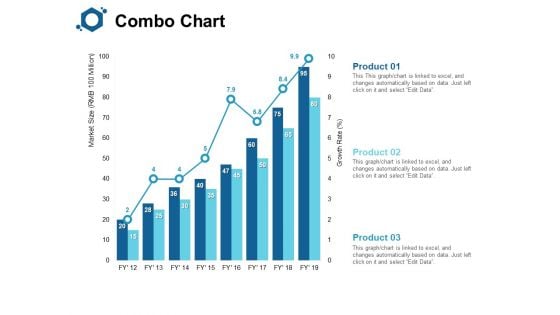
Combo Chart Finance Ppt PowerPoint Presentation Summary Images
Presenting this set of slides with name combo chart finance ppt powerpoint presentation summary images. The topics discussed in these slides are combo chart, product, growth rate, market size, financial year. This is a completely editable PowerPoint presentation and is available for immediate download. Download now and impress your audience.
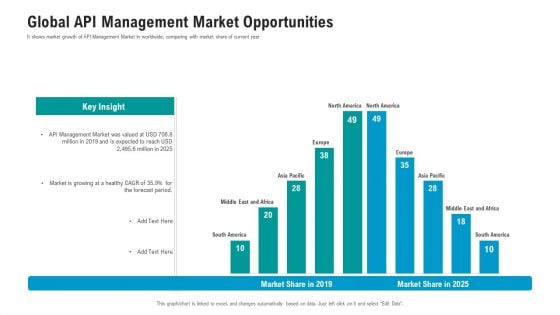
API Ecosystem Global API Management Market Opportunities Slides PDF
It shows market growth of API Management Market in worldwide, comparing with market share of current year. Deliver an awe inspiring pitch with this creative api ecosystem global api management market opportunities slides pdf bundle. Topics like management, market can be discussed with this completely editable template. It is available for immediate download depending on the needs and requirements of the user.
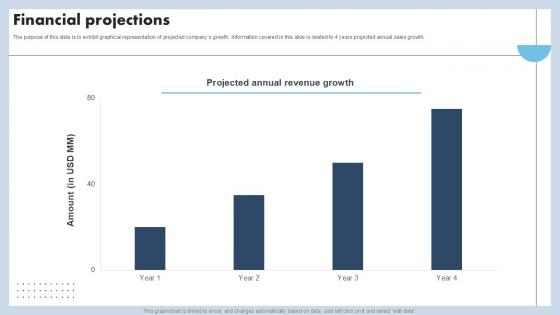
Financial Projections Capital Raising Pitch Deck For Advertising Services PPT Presentation
The purpose of this slide is to exhibit graphical representation of projected companys growth. Information covered in this slide is related to 4 years projected annual sales growth. Present like a pro with Financial Projections Capital Raising Pitch Deck For Advertising Services PPT Presentation. Create beautiful presentations together with your team, using our easy-to-use presentation slides. Share your ideas in real-time and make changes on the fly by downloading our templates. So whether you are in the office, on the go, or in a remote location, you can stay in sync with your team and present your ideas with confidence. With Slidegeeks presentation got a whole lot easier. Grab these presentations today. The purpose of this slide is to exhibit graphical representation of projected companys growth. Information covered in this slide is related to 4 years projected annual sales growth.
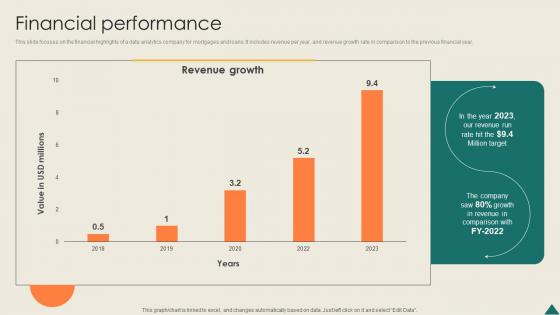
Financial Performance Financial Analytics Platform Investor Elevator Pitch Deck
This slide focuses on the financial highlights of a data analytics company for mortgages and loans. It includes revenue per year, and revenue growth rate in comparison to the previous financial year. Find a pre-designed and impeccable Financial Performance Financial Analytics Platform Investor Elevator Pitch Deck. The templates can ace your presentation without additional effort. You can download these easy-to-edit presentation templates to make your presentation stand out from others. So, what are you waiting for Download the template from Slidegeeks today and give a unique touch to your presentation. This slide focuses on the financial highlights of a data analytics company for mortgages and loans. It includes revenue per year, and revenue growth rate in comparison to the previous financial year.
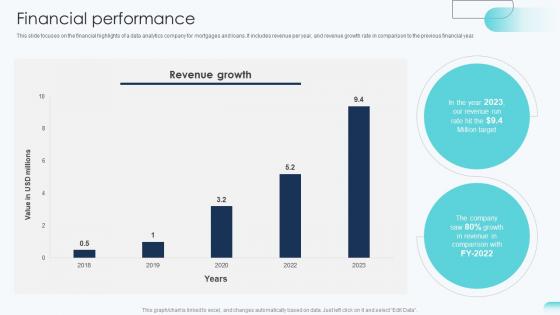
Financial Performance Big Data Analytics Investor Funding Elevator Pitch Deck
This slide focuses on the financial highlights of a data analytics company for mortgages and loans. It includes revenue per year, and revenue growth rate in comparison to the previous financial year. Present like a pro with Financial Performance Big Data Analytics Investor Funding Elevator Pitch Deck. Create beautiful presentations together with your team, using our easy-to-use presentation slides. Share your ideas in real-time and make changes on the fly by downloading our templates. So whether you are in the office, on the go, or in a remote location, you can stay in sync with your team and present your ideas with confidence. With Slidegeeks presentation got a whole lot easier. Grab these presentations today. This slide focuses on the financial highlights of a data analytics company for mortgages and loans. It includes revenue per year, and revenue growth rate in comparison to the previous financial year.
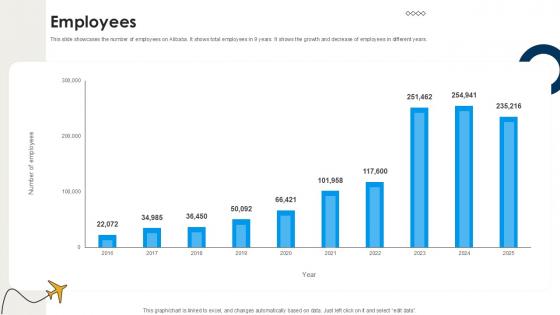
Employees International Trade Of Products And Services PPT Sample CP SS V
This slide showcases the number of employees on Alibaba. It shows total employees in 9 years. It shows the growth and decrease of employees in different years. Find highly impressive Employees International Trade Of Products And Services PPT Sample CP SS V on Slidegeeks to deliver a meaningful presentation. You can save an ample amount of time using these presentation templates. No need to worry to prepare everything from scratch because Slidegeeks experts have already done a huge research and work for you. You need to download Employees International Trade Of Products And Services PPT Sample CP SS V for your upcoming presentation. All the presentation templates are 100 percent editable and you can change the color and personalize the content accordingly. Download now This slide showcases the number of employees on Alibaba. It shows total employees in 9 years. It shows the growth and decrease of employees in different years.
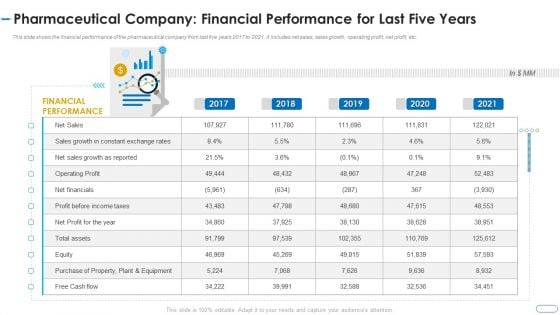
Initiatives Atmosphere Operation Problems Pharmaceutical Firm Pharmaceutical Financial Performance Clipart PDF
This slide shows the financial performance of the pharmaceutical company from last five years 2017 to 2021. It includes net sales, sales growth, operating profit, net profit, etc. Deliver and pitch your topic in the best possible manner with this initiatives atmosphere operation problems pharmaceutical firm pharmaceutical financial performance clipart pdf. Use them to share invaluable insights on financial performance, growth, sales, purchase, equipment and impress your audience. This template can be altered and modified as per your expectations. So, grab it now.
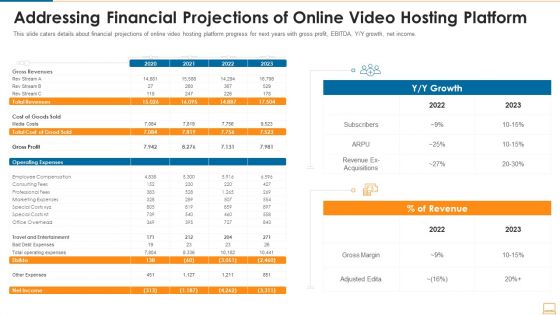
Addressing Financial Projections Of Online Video Hosting Platform Ppt Show Backgrounds PDF
This slide caters details about financial projections of online video hosting platform progress for next years with gross profit, EBITDA, Y or Y growth, net income. Deliver and pitch your topic in the best possible manner with this addressing financial projections of online video hosting platform ppt show backgrounds pdf. Use them to share invaluable insights on growth, revenue, operating expenses, cost and impress your audience. This template can be altered and modified as per your expectations. So, grab it now.


 Continue with Email

 Home
Home


