Year

Career Template 1 Ppt PowerPoint Presentation Styles Graphics Design
This is a career template 1 ppt powerpoint presentation styles graphics design. This is a six stage process. The stages in this process are career, years, business, management, timelines.
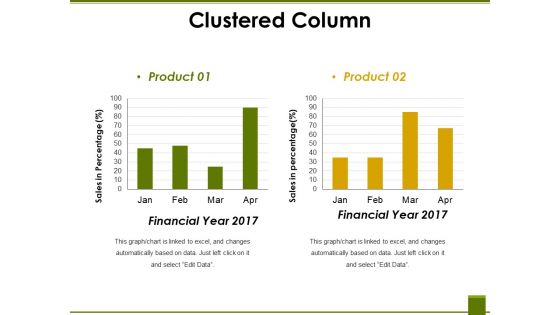
Clustered Column Ppt PowerPoint Presentation Ideas Graphic Tips
This is a clustered column ppt powerpoint presentation ideas graphic tips. This is a two stage process. The stages in this process are financial year, sales in percentage, product, graph, business.
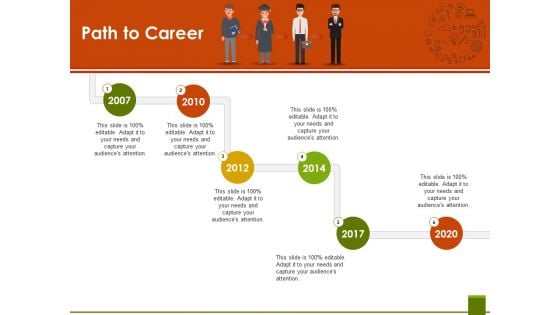
Path To Career Ppt PowerPoint Presentation Pictures Objects
This is a path to career ppt powerpoint presentation pictures objects. This is a six stage process. The stages in this process are path to career, years, business, management, timelines.
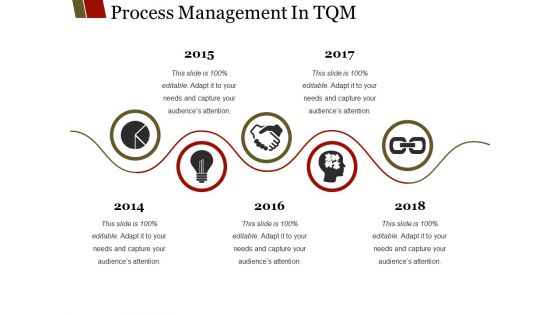
Process Management In Tqm Ppt PowerPoint Presentation Show Aids
This is a process management in tqm ppt powerpoint presentation show aids. This is a five stage process. The stages in this process are process, management, years, business, icons.
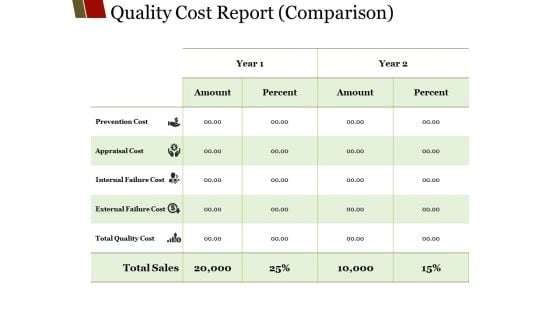
Quality Cost Report Comparison Ppt PowerPoint Presentation Visual Aids Model
This is a quality cost report comparison ppt powerpoint presentation visual aids model. This is a five stage process. The stages in this process are amount, percent, year, prevention cost, prevention cost.
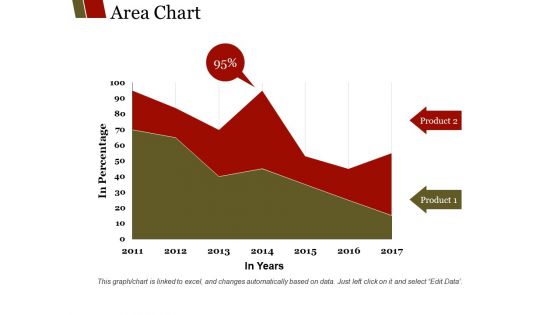
Area Chart Ppt PowerPoint Presentation Show Templates
This is a area chart ppt powerpoint presentation show templates. This is a two stage process. The stages in this process are product, in percentage, in years, finance, graph.
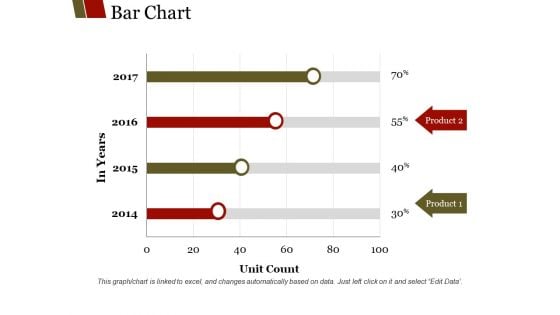
Bar Chart Ppt PowerPoint Presentation Outline Guidelines
This is a bar chart ppt powerpoint presentation outline guidelines. This is a four stage process. The stages in this process are product, unit count, in years, graph, finance, business.
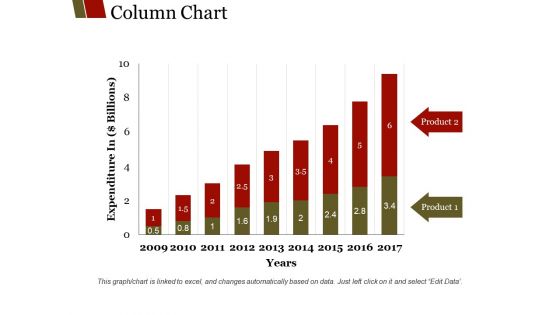
Column Chart Ppt PowerPoint Presentation Summary Graphics
This is a column chart ppt powerpoint presentation summary graphics. This is a nine stage process. The stages in this process are product, years, expenditure in billions, graph, business.
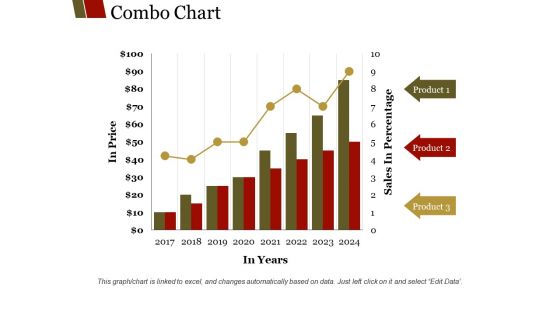
Combo Chart Ppt PowerPoint Presentation Summary Layouts
This is a combo chart ppt powerpoint presentation summary layouts. This is a eight stage process. The stages in this process are product, sales in percentage, in years, in price, graph.
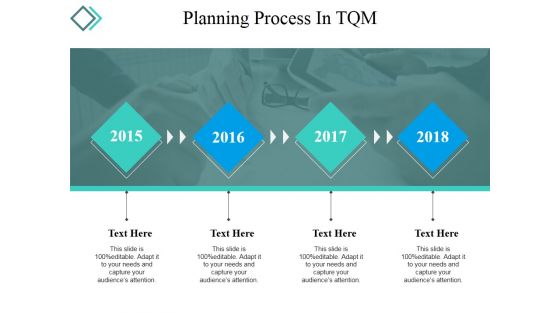
Planning Process In Tqm Ppt PowerPoint Presentation Infographics Template
This is a planning process in tqm ppt powerpoint presentation infographics template. This is a four stage process. The stages in this process are year, growth, success, time planning, business.
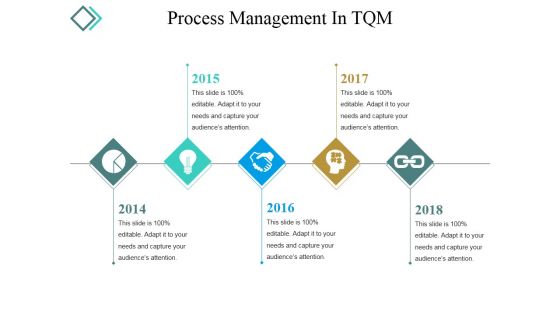
Process Management In Tqm Ppt PowerPoint Presentation Infographics Gridlines
This is a process management in tqm ppt powerpoint presentation infographics gridlines. This is a five stage process. The stages in this process are year, growth, success, time planning, business.
Projected Quarterly Sales Template Ppt PowerPoint Presentation Icon Example Topics
This is a projected quarterly sales template ppt powerpoint presentation icon example topics. This is a six stage process. The stages in this process are business, marketing, years, timeline, roadmap.
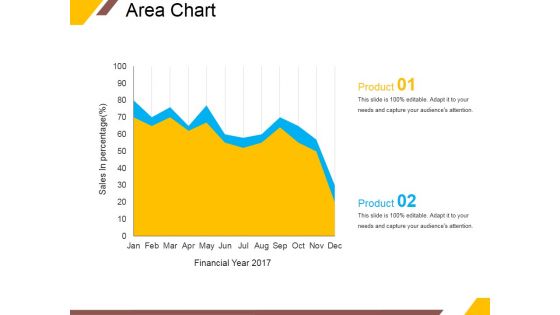
Area Chart Ppt PowerPoint Presentation Layouts Vector
This is a area chart ppt powerpoint presentation layouts vector. This is a two stage process. The stages in this process are area chart, product, sales in percentage, financial year.
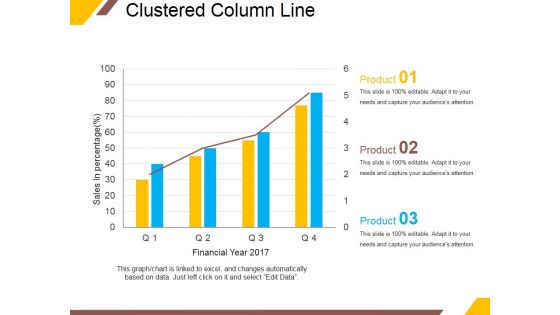
Clustered Column Line Ppt PowerPoint Presentation Portfolio Outline
This is a clustered column line ppt powerpoint presentation portfolio outline. This is a four stage process. The stages in this process are sales in percentage, financial year, product, graph, growth.
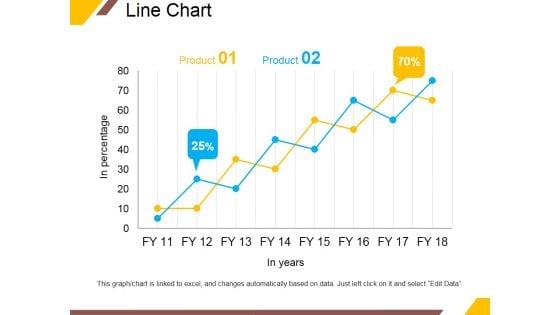
Line Chart Ppt PowerPoint Presentation Portfolio Infographic Template
This is a line chart ppt powerpoint presentation portfolio infographic template. This is a two stage process. The stages in this process are product, in years, business, percentage, growth.
Scatter Bubble Chart Ppt PowerPoint Presentation Icon Elements
This is a scatter bubble chart ppt powerpoint presentation icon elements. This is a six stage process. The stages in this process are highest profit, profit, financial year, product.
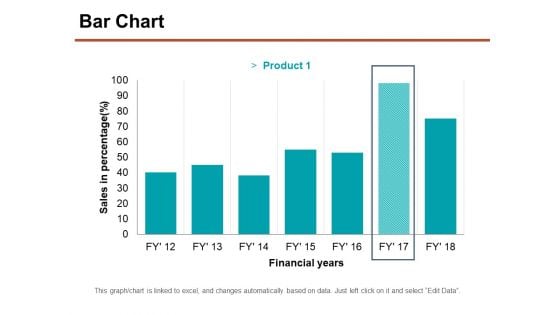
Bar Chart Ppt PowerPoint Presentation Professional Graphics Download
This is a bar chart ppt powerpoint presentation professional graphics download. This is a seven stage process. The stages in this process are sales in percentage, financial years, chart, business.
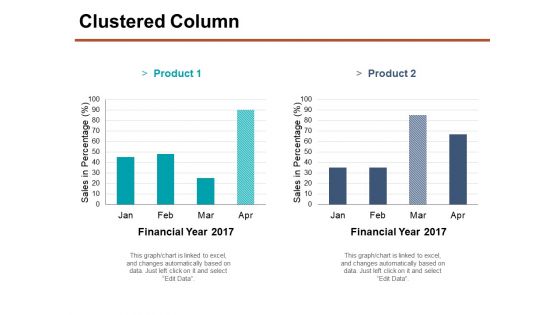
Clustered Column Ppt PowerPoint Presentation Portfolio Smartart
This is a clustered column ppt powerpoint presentation portfolio smartart. This is a two stage process. The stages in this process are financial year, product, sales in percentage, finance, business, graph.
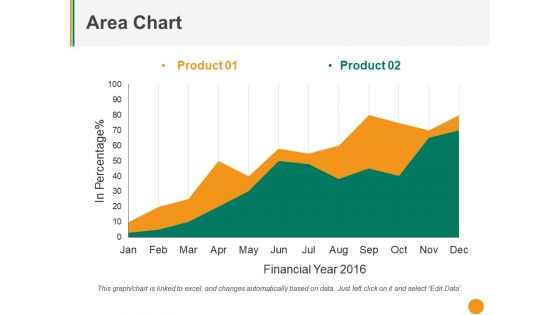
Area Chart Ppt PowerPoint Presentation File Graphic Tips
This is a area chart ppt powerpoint presentation file graphic tips. This is a two stage process. The stages in this process are product, in percentage, financial year, business, growth.
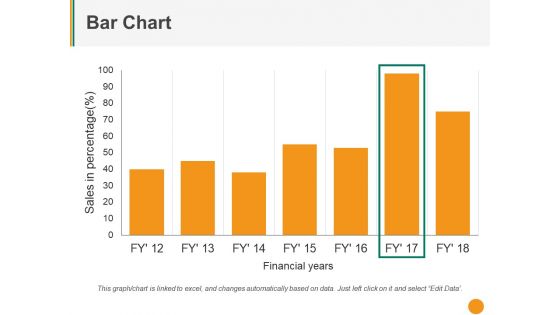
Bar Chart Ppt PowerPoint Presentation Styles Outfit
This is a bar chart ppt powerpoint presentation styles outfit. This is a Seven stage process. The stages in this process are sales in percentage, financial years, graph, business.
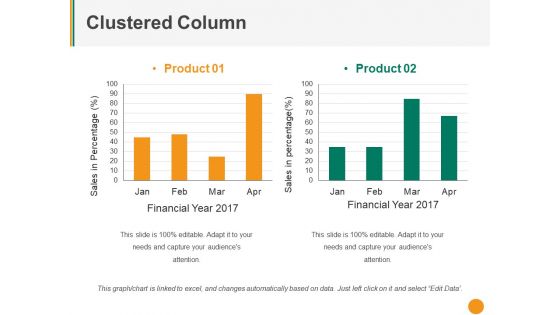
Clustered Column Ppt PowerPoint Presentation Pictures Mockup
This is a clustered column ppt powerpoint presentation pictures mockup. This is a two stage process. The stages in this process are product, sales in percentage, financial year, graph, business.
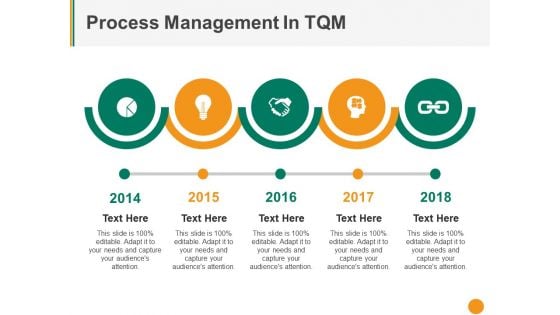
Process Management In Tqm Ppt PowerPoint Presentation Portfolio Information
This is a process management in tqm ppt powerpoint presentation portfolio information. This is a five stage process. The stages in this process are process, management, years, business, icons.
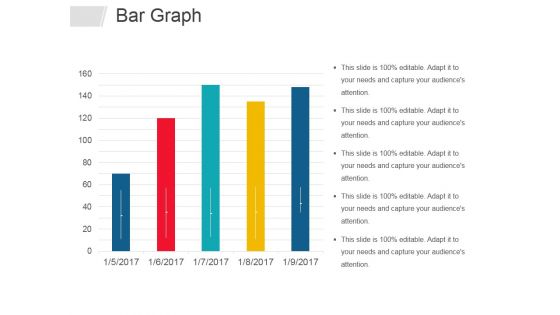
Bar Graph Ppt PowerPoint Presentation Infographics Graphics Design
This is a bar graph ppt powerpoint presentation infographics graphics design. This is a five stage process. The stages in this process are bar graph, business, years, marketing, management.
Planning Process In Tqm Ppt PowerPoint Presentation Icon Graphics Example
This is a planning process in tqm ppt powerpoint presentation icon graphics example. This is a four stage process. The stages in this process are timelines, years, business, management.
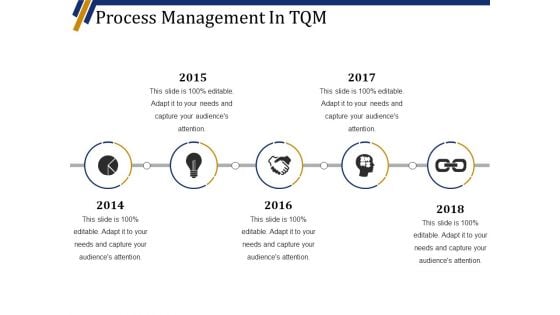
Process Management In Tqm Ppt PowerPoint Presentation Summary Design Ideas
This is a process management in tqm ppt powerpoint presentation summary design ideas. This is a five stage process. The stages in this process are years, icons, business, marketing, strategy.
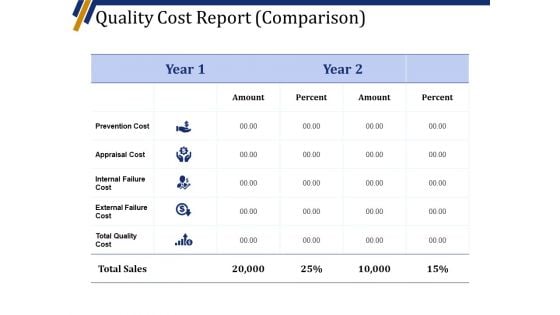
Quality Cost Report Comparison Template 1 Ppt PowerPoint Presentation Pictures Infographics
This is a quality cost report comparison template 1 ppt powerpoint presentation pictures infographics. This is a five stage process. The stages in this process are amount, percent, year, appraisal cost, prevention cost.
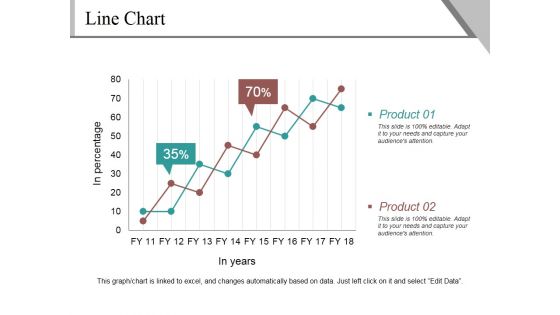
Line Chart Ppt PowerPoint Presentation Infographics Example
This is a line chart ppt powerpoint presentation infographics example. This is a two stage process. The stages in this process are product, in percentage, in years, finance, growth.
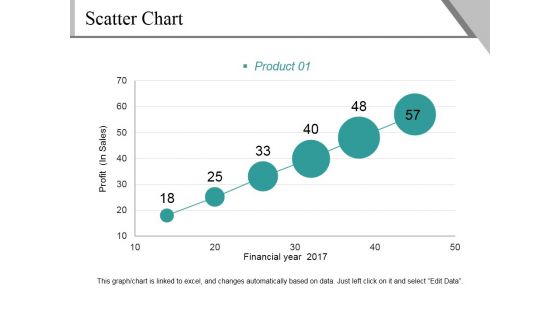
Scatter Chart Ppt PowerPoint Presentation File Background Image
This is a scatter chart ppt powerpoint presentation file background image. This is a six stage process. The stages in this process are profit, financial year, product, growth, success.
Bar Chart Ppt PowerPoint Presentation Icon Demonstration
This is a bar chart ppt powerpoint presentation icon demonstration. This is a seven stage process. The stages in this process are product, sales in percentage, financial year, graph.
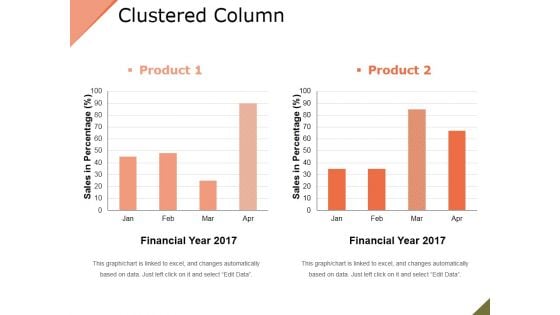
Clustered Column Ppt PowerPoint Presentation File Slide
This is a clustered column ppt powerpoint presentation file slide. This is a two stage process. The stages in this process are product, financial year, sales in percentage, bar graph.
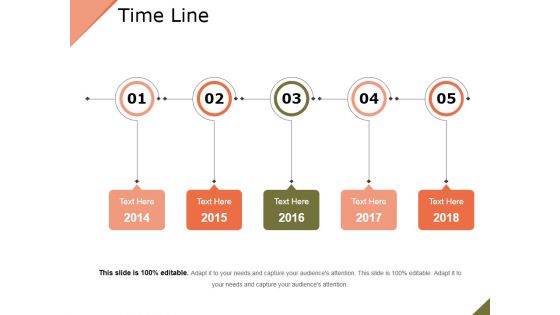
Time Line Ppt PowerPoint Presentation Show Graphics Pictures
This is a time line ppt powerpoint presentation show graphics pictures. This is a five stage process. The stages in this process are year, growth, success, time planning, business.
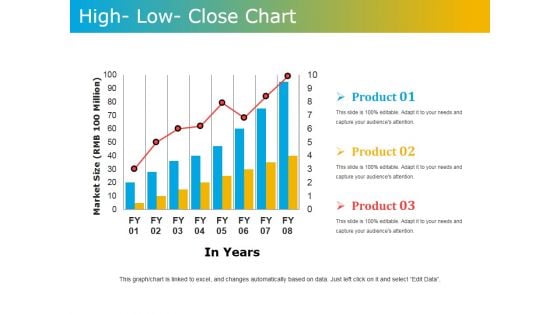
High Low Close Chart Ppt PowerPoint Presentation Model Graphics Tutorials
This is a high low close chart ppt powerpoint presentation model graphics tutorials. This is a three stage process. The stages in this process are market size, in years, product.
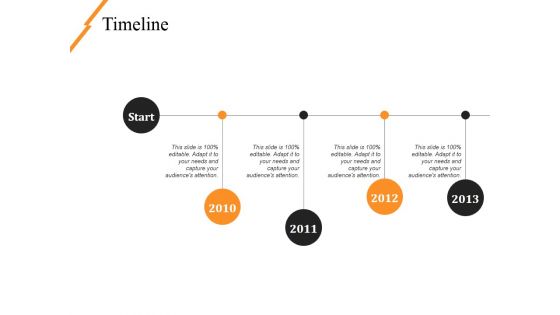
Timeline Template 1 Ppt PowerPoint Presentation Ideas Slideshow
This is a timeline template 1 ppt powerpoint presentation ideas slideshow. This is a four stage process. The stages in this process are year, growth, success, time planning, business.

Timeline Template 2 Ppt PowerPoint Presentation Portfolio Show
This is a timeline template 2 ppt powerpoint presentation portfolio show. This is a four stage process. The stages in this process are year, growth, success, time planning, business.
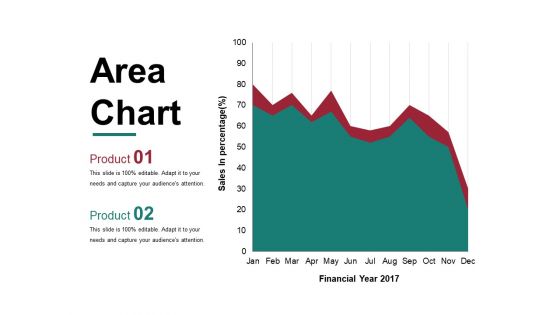
Area Chart Ppt PowerPoint Presentation Layouts Maker
This is a area chart ppt powerpoint presentation layouts maker. This is a two stage process. The stages in this process are financial year, sales in percentage, graph, business, marketing.
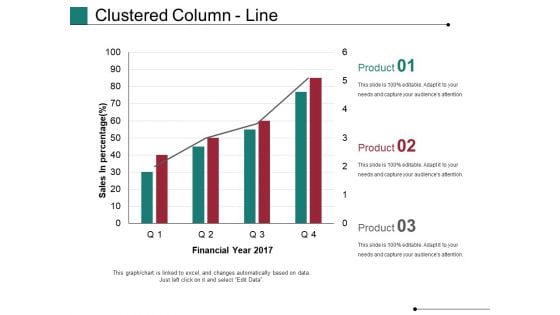
Clustered Column Line Ppt PowerPoint Presentation Model Rules
This is a clustered column line ppt powerpoint presentation model rules. This is a four stage process. The stages in this process are financial year, sales in percentage, business, marketing, growth, graph.
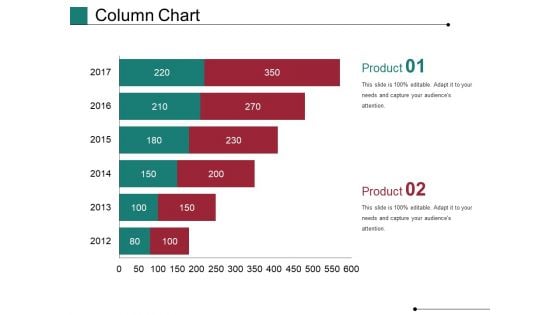
Column Chart Ppt PowerPoint Presentation Show Master Slide
This is a column chart ppt powerpoint presentation show master slide. This is a six stage process. The stages in this process are financial, years, business, marketing, finance, graph.
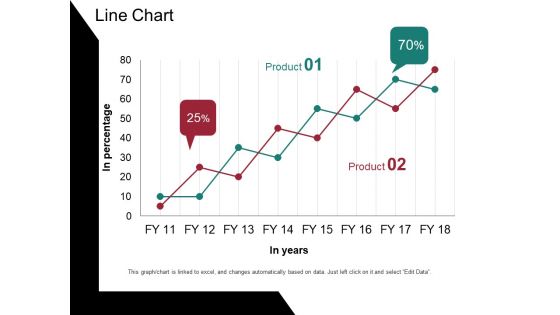
Line Chart Ppt PowerPoint Presentation Portfolio Design Templates
This is a line chart ppt powerpoint presentation portfolio design templates. This is a two stage process. The stages in this process are in percentage, in years, percentage, business, graph.
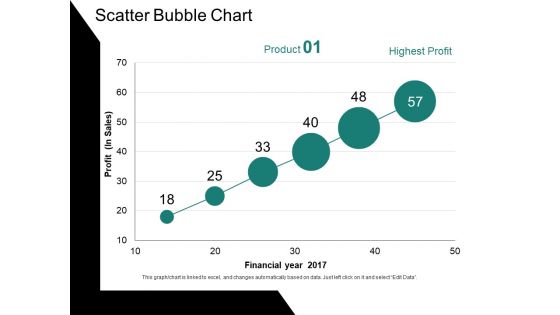
Scatter Bubble Chart Ppt PowerPoint Presentation Ideas Gallery
This is a scatter bubble chart ppt powerpoint presentation ideas gallery. This is a six stage process. The stages in this process are profit, financial year, chart, business, growth.
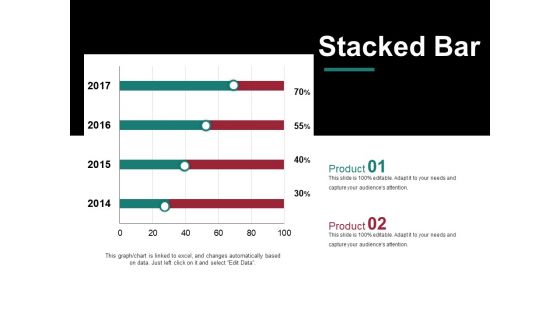
Stacked Bar Template 2 Ppt PowerPoint Presentation Model Graphic Images
This is a stacked bar template 2 ppt powerpoint presentation model graphic images. This is a two stage process. The stages in this process are business, years, marketing, percentage, finance.
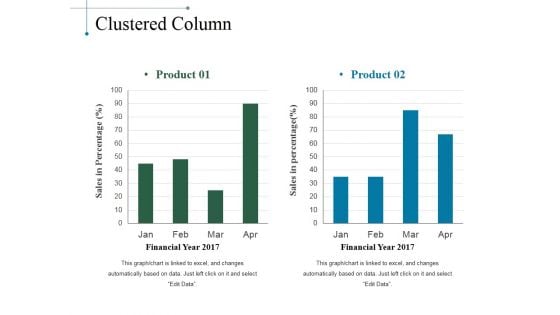
Clustered Column Ppt PowerPoint Presentation Slides Smartart
This is a clustered column ppt powerpoint presentation slides smartart. This is a two stage process. The stages in this process are product, sales in percentage, financial year, bar graph.
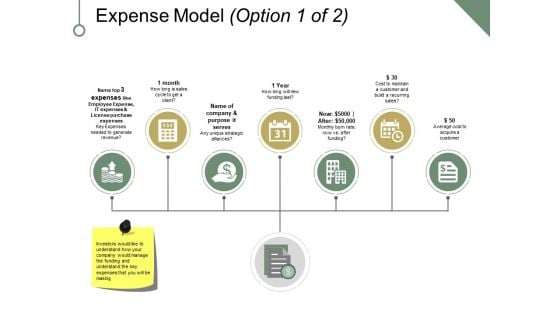
Expense Model Template 1 Ppt PowerPoint Presentation Portfolio Example
This is a expense model template 1 ppt powerpoint presentation portfolio example. This is a seven stage process. The stages in this process are month, business, management, year, name of company and purpose it serves.
Expense Model Template 2 Ppt PowerPoint Presentation Icon Format Ideas
This is a expense model template 2 ppt powerpoint presentation icon format ideas. This is a stage process. The stages in this process are month, business, management, year, name of company and purpose it serves.
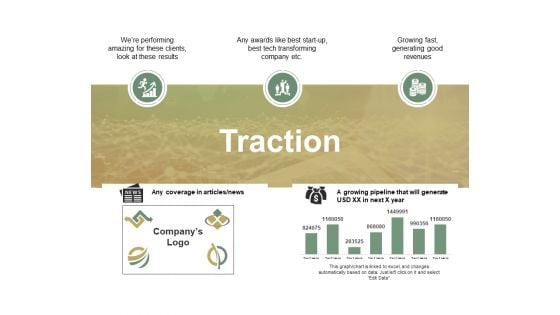
Traction Ppt PowerPoint Presentation Layouts Portrait
This is a traction ppt powerpoint presentation layouts portrait. This is a five stage process. The stages in this process are any coverage in articles news, growing pipeline that will generate usd xx in next x year, business, finance, marketing.
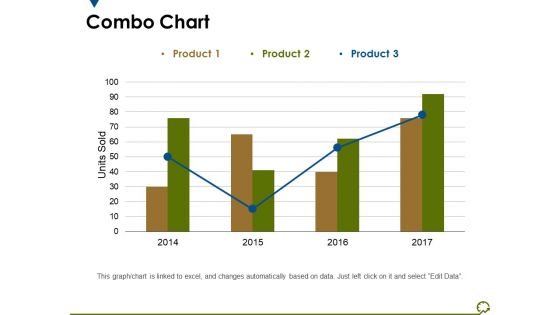
Combo Chart Ppt PowerPoint Presentation Outline Graphics Tutorials
This is a combo chart ppt powerpoint presentation outline graphics tutorials. This is a three stage process. The stages in this process are units sold, years, business, marketing, graph.
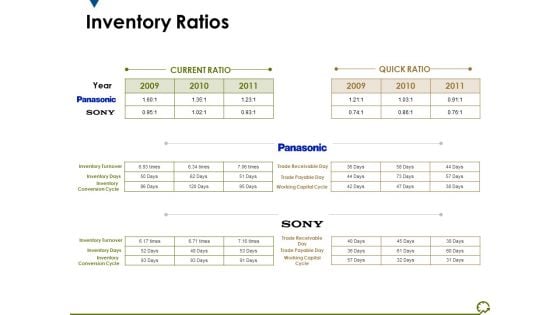
Inventory Ratios Ppt PowerPoint Presentation Layouts Brochure
This is a inventory ratios ppt powerpoint presentation layouts brochure. This is a three stage process. The stages in this process are quick ratio, current ratio, year, business, marketing, planning.
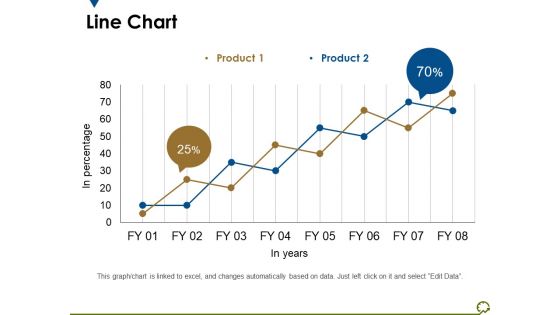
Line Chart Ppt PowerPoint Presentation Outline Diagrams
This is a line chart ppt powerpoint presentation outline diagrams. This is a two stage process. The stages in this process are in percentage, in years, percentage, business, marketing.
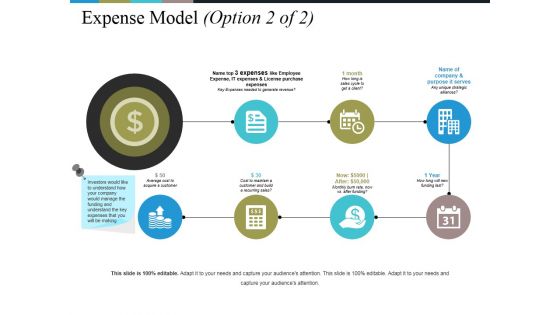
Expense Model Template 1 Ppt PowerPoint Presentation Pictures Template
This is a expense model template 1 ppt powerpoint presentation pictures template. This is a seven stage process. The stages in this process are name of company and purpose it serves, year, month, business, management.
Expense Model Template Ppt PowerPoint Presentation Icon Vector
This is a expense model template ppt powerpoint presentation icon vector. This is a seven stage process. The stages in this process are name of company and purpose it serves, year, month, business, management.
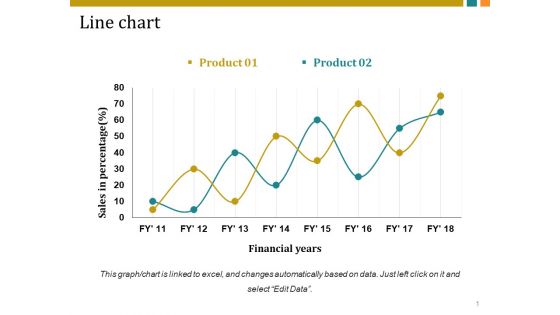
Line Chart Ppt PowerPoint Presentation Inspiration Vector
This is a line chart ppt powerpoint presentation inspiration vector. This is a two stage process. The stages in this process are sales in percentage, financial years, business, marketing, growth.
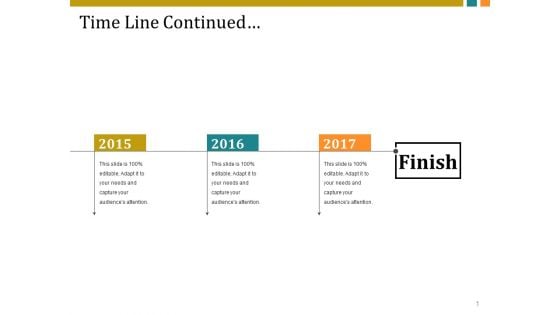
Time Line Continued Ppt PowerPoint Presentation Slides Example
This is a time line continued ppt powerpoint presentation slides example. This is a three stage process. The stages in this process are finish, timeline, business, management, planning, years.
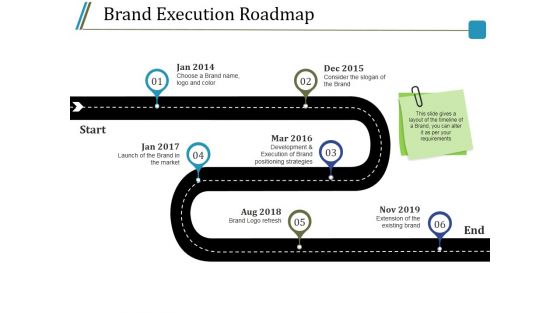
Brand Execution Roadmap Ppt PowerPoint Presentation Model Introduction
This is a brand execution roadmap ppt powerpoint presentation model introduction. This is a six stage process. The stages in this process are brand logo refresh, extension of the existing brand, timeline, year, growth.
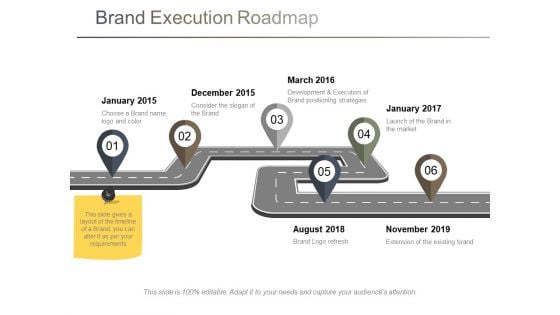
Brand Execution Roadmap Ppt PowerPoint Presentation Visual Aids Layouts
This is a brand execution roadmap ppt powerpoint presentation visual aids layouts. This is a six stage process. The stages in this process are roadmap, years, business, management, planning.

Line Chart Ppt PowerPoint Presentation Infographics Graphic Images
This is a line chart ppt powerpoint presentation infographics graphic images. This is a two stage process. The stages in this process are sales in percentage, financial years, growth, business, marketing.
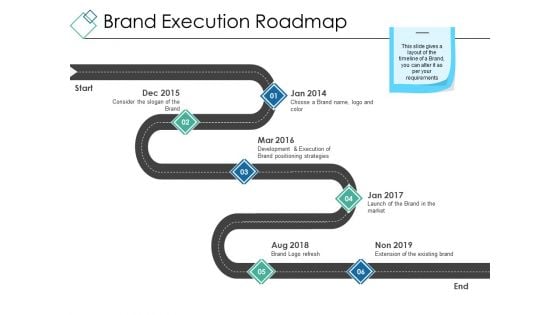
Brand Execution Roadmap Ppt PowerPoint Presentation Styles Design Inspiration
This is a brand execution roadmap ppt powerpoint presentation styles design inspiration. This is a six stage process. The stages in this process are start, end, roadmap, years, business.
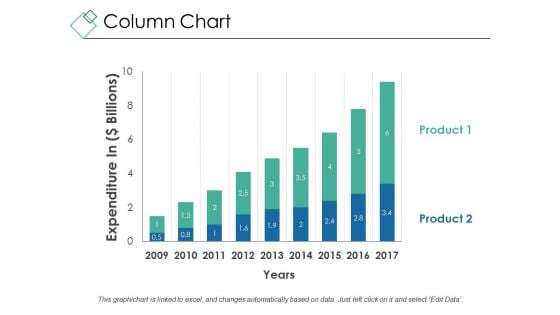
Column Chart Ppt PowerPoint Presentation Gallery Graphics Example
This is a column chart ppt powerpoint presentation gallery graphics example. This is a two stage process. The stages in this process are expenditure in, years, business, marketing, growth.
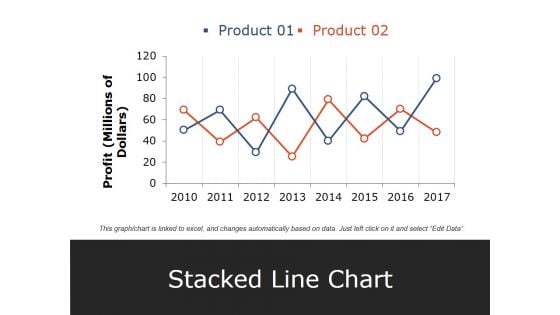
Stacked Line Chart Ppt PowerPoint Presentation Pictures Elements
This is a stacked line chart ppt powerpoint presentation pictures elements. This is a two stage process. The stages in this process are product, profit, stacked line chart, year, business.
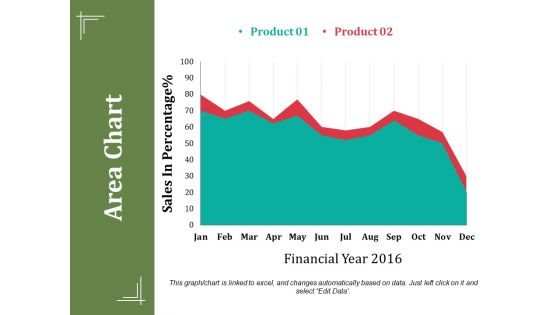
Area Chart Ppt PowerPoint Presentation Summary Show
This is a area chart ppt powerpoint presentation summary show. This is a two stage process. The stages in this process are sales in percentage, financial year, business, marketing, finance.
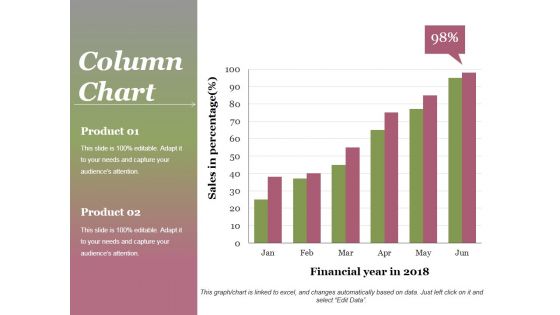
Column Chart Ppt PowerPoint Presentation Gallery Background
This is a column chart ppt powerpoint presentation gallery background. This is a two stage process. The stages in this process are product, sales in percentage, financial year, graph, success.
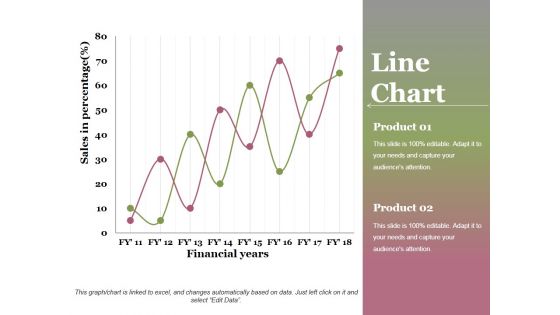
Line Chart Ppt PowerPoint Presentation Professional Graphics Design
This is a line chart ppt powerpoint presentation professional graphics design. This is a two stage process. The stages in this process are financial years, sales in percentage, product, growth, success.


 Continue with Email

 Home
Home


