Year
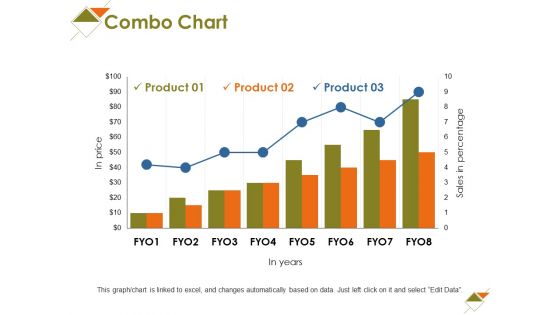
Combo Chart Ppt PowerPoint Presentation Show Elements
This is a combo chart ppt powerpoint presentation show elements. This is a three stage process. The stages in this process are in price, in years, business, marketing, growth.
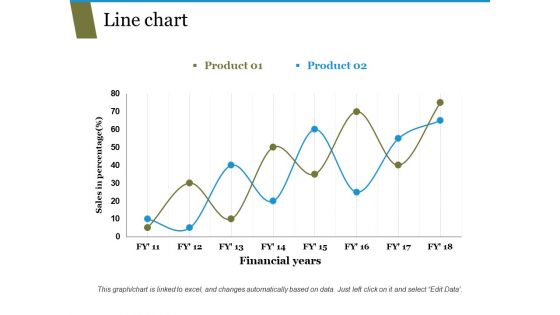
Line Chart Ppt PowerPoint Presentation Pictures Templates
This is a line chart ppt powerpoint presentation pictures templates. This is a two stage process. The stages in this process are sales in percentage, financial years, business, marketing, growth.
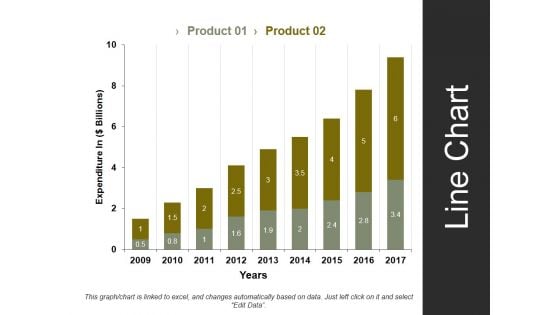
Line Chart Template 1 Ppt PowerPoint Presentation Styles Summary
This is a line chart template 1 ppt powerpoint presentation styles summary. This is a two stage process. The stages in this process are expenditure in, years, business, marketing, strategy.
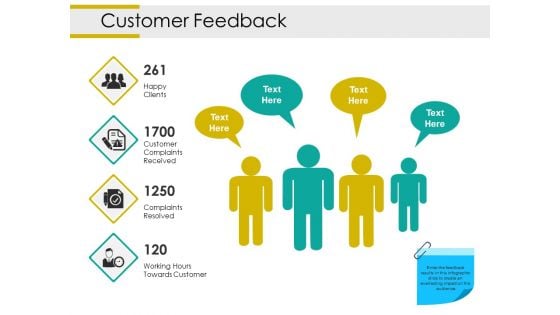
Customer Feedback Ppt PowerPoint Presentation Gallery Portfolio
This is a customer feedback ppt powerpoint presentation gallery portfolio. This is a four stage process. The stages in this process are happy clients, customer complaints received, complaints resolved, working hours towards customer, business, years.
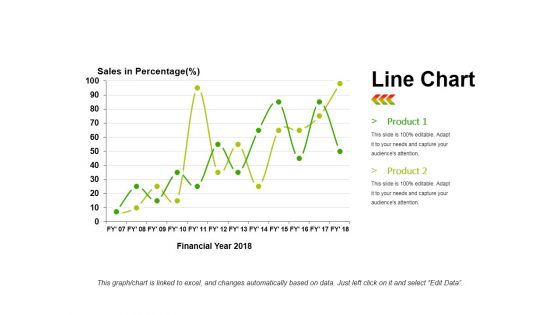
Line Chart Ppt PowerPoint Presentation Infographics Infographics
This is a line chart ppt powerpoint presentation infographics infographics. This is a two stage process. The stages in this process are product, sales in percentage, financial year, line chart, finance.
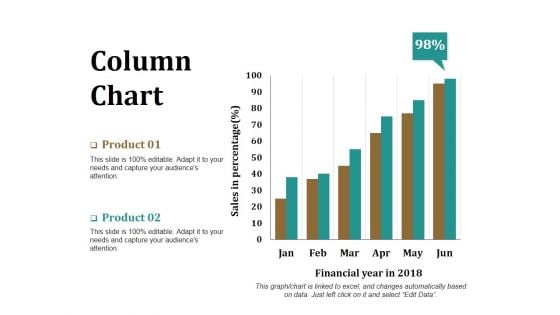
Column Chart Ppt PowerPoint Presentation Model Graphics Download
This is a column chart ppt powerpoint presentation model graphics download. This is a two stage process. The stages in this process are product, financial year, sales in percentage, bar graph, success.
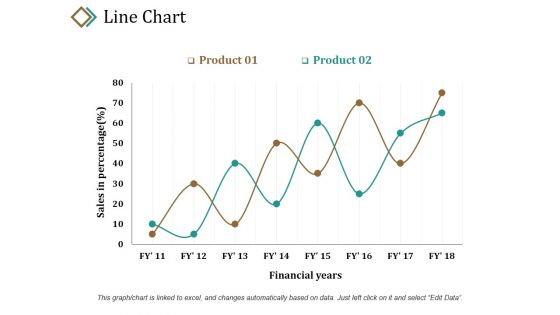
Line Chart Ppt PowerPoint Presentation Layouts Example
This is a line chart ppt powerpoint presentation layouts example. This is a two stage process. The stages in this process are sales in percentage, product, financial years, growth, success.
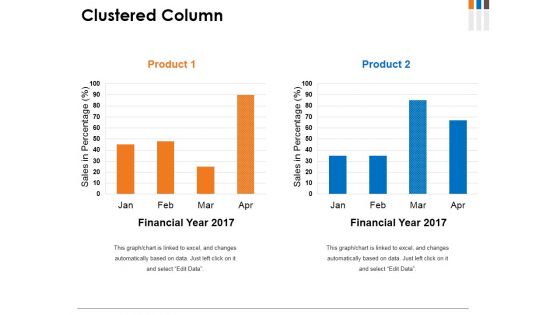
Clustered Column Ppt PowerPoint Presentation File Graphics
This is a clustered column ppt powerpoint presentation file graphics. This is a two stage process. The stages in this process are product, financial year, sales in percentage, graph, growth.
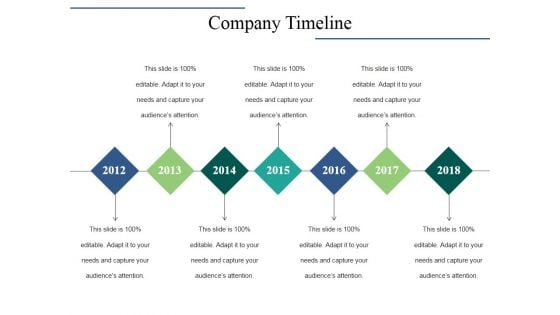
Company Timeline Ppt PowerPoint Presentation Summary Example Topics
This is a company timeline ppt powerpoint presentation summary example topics. This is a seven stage process. The stages in this process are year, growth, success, time planning, business.
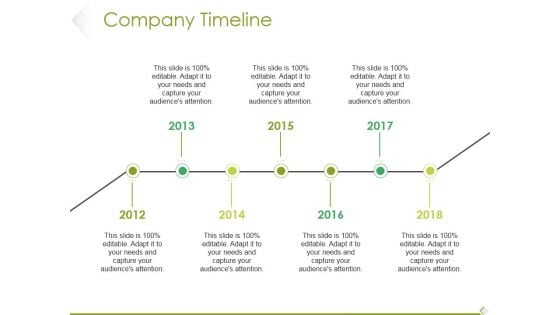
Company Timeline Ppt PowerPoint Presentation Infographic Template Template
This is a company timeline ppt powerpoint presentation infographic template template. This is a seven stage process. The stages in this process are year, growth, success, time planning, business.
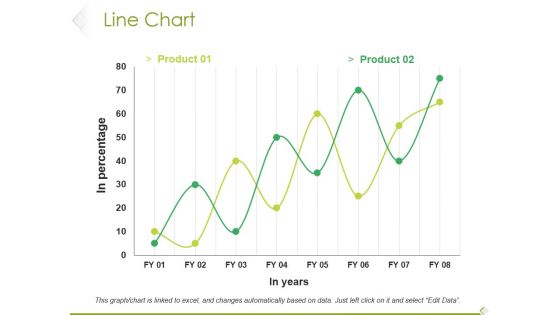
Line Chart Ppt PowerPoint Presentation File Example File
This is a line chart ppt powerpoint presentation file example file. This is a two stage process. The stages in this process are product, in percentage, in years, growth, success.
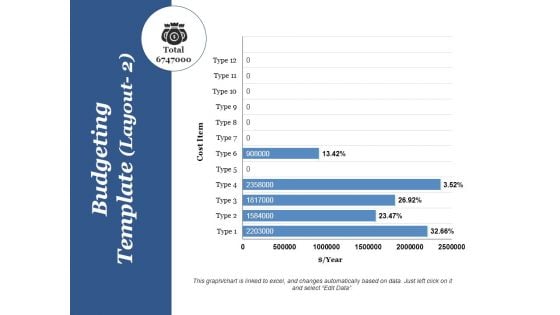
Budgeting Template 2 Ppt PowerPoint Presentation Pictures Model
This is a budgeting template 2 ppt powerpoint presentation pictures model. This is a five stage process. The stages in this process are cost item, year, budgeting template, cost, total.
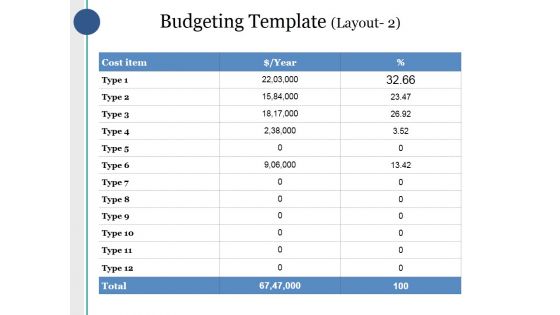
Budgeting Template Ppt PowerPoint Presentation Infographic Template Guide
This is a budgeting template ppt powerpoint presentation infographic template guide. This is a two stage process. The stages in this process are cost item, year, budgeting template, cost, total.
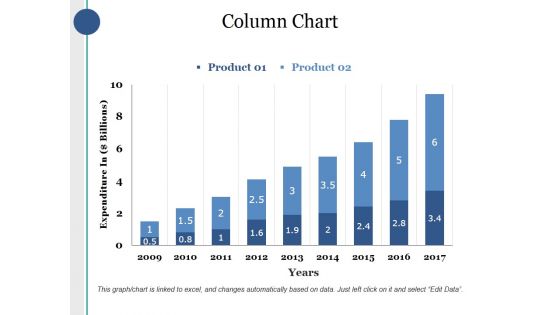
Column Chart Ppt PowerPoint Presentation Infographics Deck
This is a column chart ppt powerpoint presentation infographics deck. This is a two stage process. The stages in this process are product, expenditure in, years, bar graph, growth.
Bar Chart Ppt PowerPoint Presentation Icon Layout
This is a bar chart ppt powerpoint presentation icon layout. This is a one stage process. The stages in this process are sales in percentage, financial years, bar chart, finance, marketing.
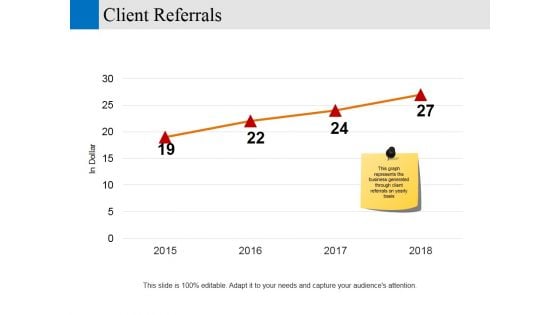
client referrals ppt powerpoint presentation visual aids show
This is a client referrals ppt powerpoint presentation visual aids show. This is a four stage process. The stages in this process are in dollar, years, business, marketing, growth.
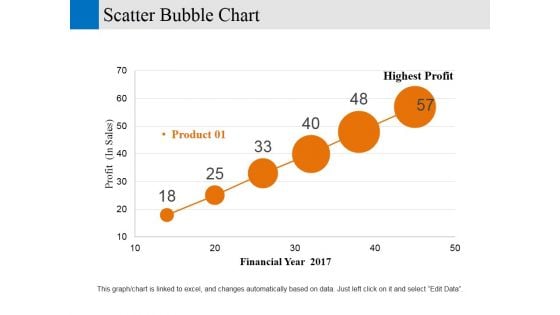
Scatter Bubble Chart Ppt PowerPoint Presentation Gallery Designs Download
This is a scatter bubble chart ppt powerpoint presentation gallery designs download. This is a six stage process. The stages in this process are financial year, profit, business, marketing, strategy.
Clustered Column Line Ppt PowerPoint Presentation Icon Good
This is a clustered column line ppt powerpoint presentation icon good. This is a three stage process. The stages in this process are product, financial year, bar graph, business, growth.
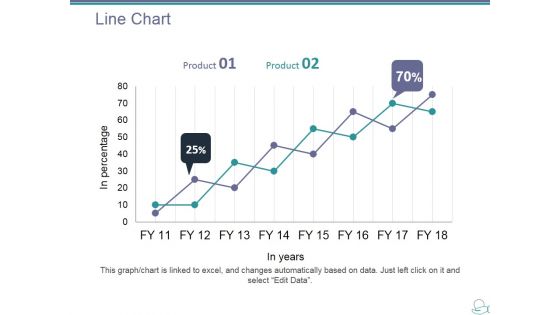
Line Chart Ppt PowerPoint Presentation Layouts Show
This is a line chart ppt powerpoint presentation layouts show. This is a two stage process. The stages in this process are product, in years, in percentage, line chart, growth.
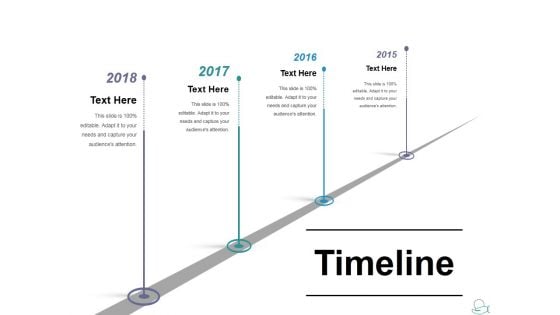
Timeline Ppt PowerPoint Presentation Infographic Template Format Ideas
This is a timeline ppt powerpoint presentation infographic template format ideas. This is a four stage process. The stages in this process are year, growth, success, time planning, business.
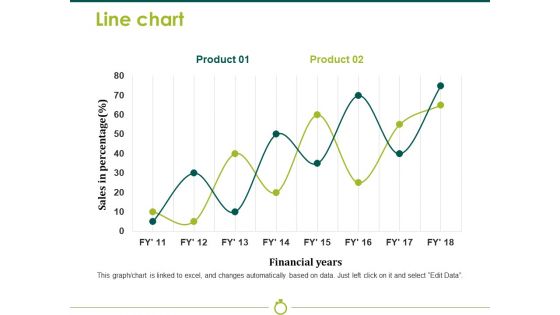
Line Chart Template 2 Ppt PowerPoint Presentation Model Background Image
This is a line chart template 2 ppt powerpoint presentation model background image. This is a two stage process. The stages in this process are sales in percentage, financial years, business, marketing, strategy, graph.
Bar Chart Ppt PowerPoint Presentation Icon Information
This is a bar chart ppt powerpoint presentation icon information. This is a one stage process. The stages in this process are product, sales in percentage, financial years, bar graph, growth.
Budgeting Template 2 Ppt PowerPoint Presentation Icon Infographics
This is a budgeting template 2 ppt powerpoint presentation icon infographics. This is a two stage process. The stages in this process are cost item, year, total, type, budgeting template.
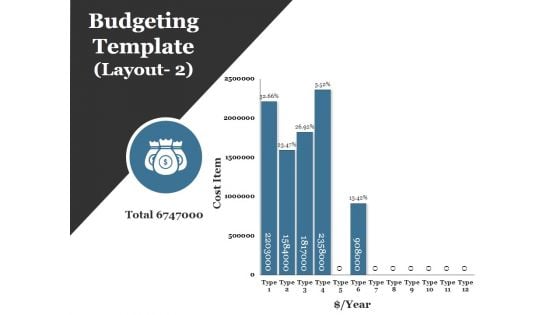
Budgeting Template 3 Ppt PowerPoint Presentation Ideas Graphics Tutorials
This is a budgeting template 3 ppt powerpoint presentation ideas graphics tutorials. This is a five stage process. The stages in this process are cost item, year, total, type, budgeting template.
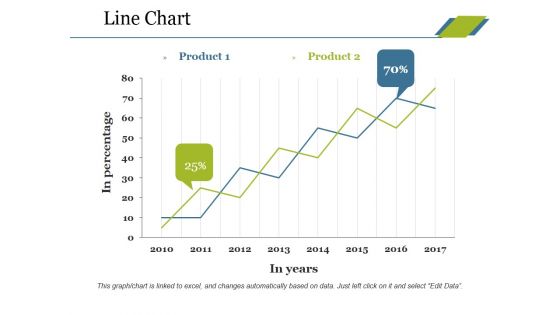
Line Chart Ppt PowerPoint Presentation Professional Tips
This is a line chart ppt powerpoint presentation professional tips. This is a two stage process. The stages in this process are product, in percentage, in years, growth, success.
Bar Chart Ppt PowerPoint Presentation Icon Introduction
This is a bar chart ppt powerpoint presentation icon introduction. This is a seven stage process. The stages in this process are in years, in percentage, business, marketing, graph.
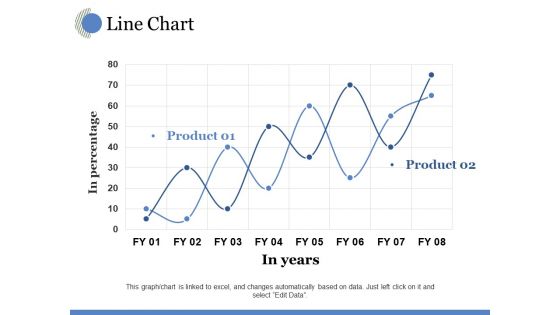
Line Chart Ppt PowerPoint Presentation Model Visual Aids
This is a line chart ppt powerpoint presentation model visual aids. This is a two stage process. The stages in this process are in years, in percentage, growth, business, marketing.
Sales Performance Of Competitors Ppt PowerPoint Presentation Show Icon
This is a sales performance of competitors ppt powerpoint presentation show icon. This is a three stage process. The stages in this process are own business, competitor, year, business, marketing.
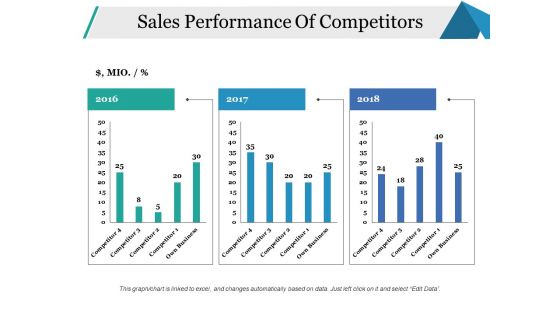
Sales Performance Of Competitors Ppt PowerPoint Presentation Portfolio Sample
This is a sales performance of competitors ppt powerpoint presentation portfolio sample. This is a three stage process. The stages in this process are business, marketing, finance, graph, years.
Sales Kpi Tracker Ppt PowerPoint Presentation Gallery Shapes
This is a sales kpi tracker ppt powerpoint presentation gallery shapes. This is a six stage process. The stages in this process are target growth, leads created, sales ratio, last year, stretched growth.
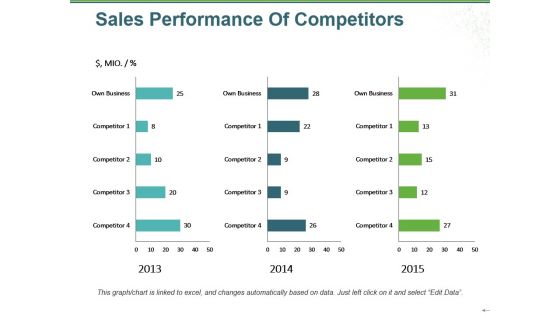
Sales Performance Of Competitors Ppt PowerPoint Presentation Portfolio Examples
This is a sales performance of competitors ppt powerpoint presentation portfolio examples. This is a three stage process. The stages in this process are own business, competitor, year, step, marketing.
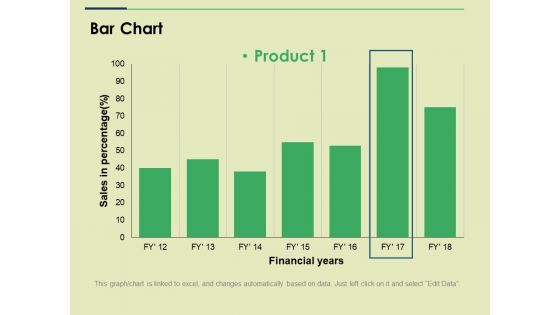
Bar Chart Ppt PowerPoint Presentation File Slide
This is a bar chart ppt powerpoint presentation file slide. This is a one stage process. The stages in this process are sales in percentage financial years, business, marketing, strategy, graph.
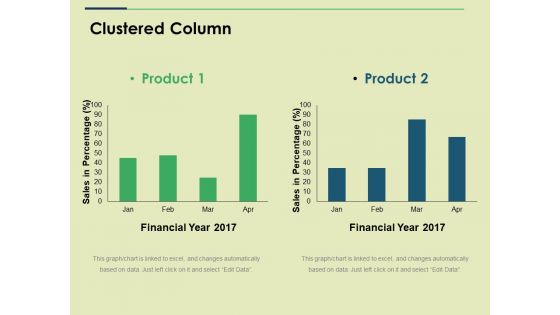
Clustered Column Ppt PowerPoint Presentation Show Graphics
This is a clustered column ppt powerpoint presentation show graphics. This is a two stage process. The stages in this process are financial year, sales in percentage, business, marketing, graph.
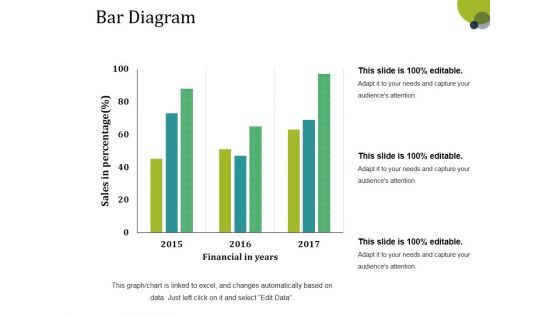
Bar Diagram Ppt PowerPoint Presentation Gallery Structure
This is a bar diagram ppt powerpoint presentation gallery structure. This is a three stage process. The stages in this process are financial in years, sales in percentage, bar graph, growth, success.
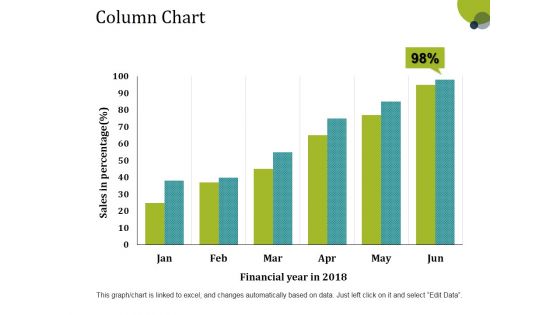
Column Chart Ppt PowerPoint Presentation Layouts Tips
This is a column chart ppt powerpoint presentation layouts tips. This is a six stage process. The stages in this process are sales in percentage, financial year, bar graph, growth, success.
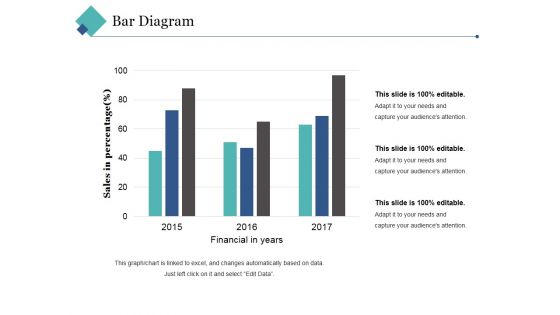
Bar Diagram Ppt PowerPoint Presentation Pictures Background Image
This is a bar diagram ppt powerpoint presentation pictures background image. This is a three stage process. The stages in this process are financial in years, sales in percentage, bar graph, growth, success.
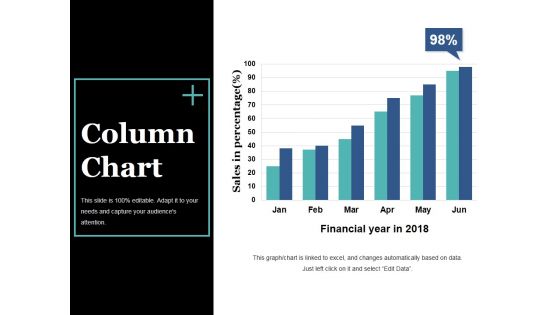
Column Chart Ppt PowerPoint Presentation Slides Visual Aids
This is a column chart ppt powerpoint presentation slides visual aids. This is a six stage process. The stages in this process are bar graph, growth, success, sales in percentage, financial year.
Activity Ratios Template 1 Ppt PowerPoint Presentation Outline Icons
This is a activity ratios template 1 ppt powerpoint presentation outline icons. This is a two stage process. The stages in this process are inventory turnover, receivables turnover, year, inventory ratio, category.
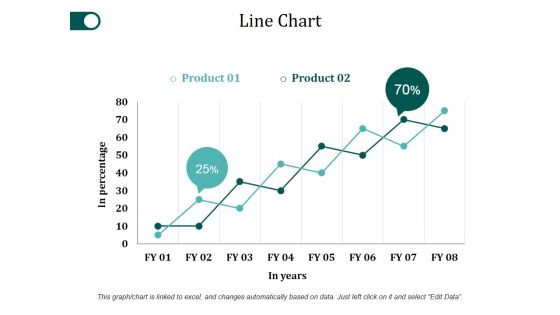
Line Chart Ppt PowerPoint Presentation Slides Ideas
This is a line chart ppt powerpoint presentation slides ideas. This is a two stage process. The stages in this process are product, in percentage, in years, growth, success.
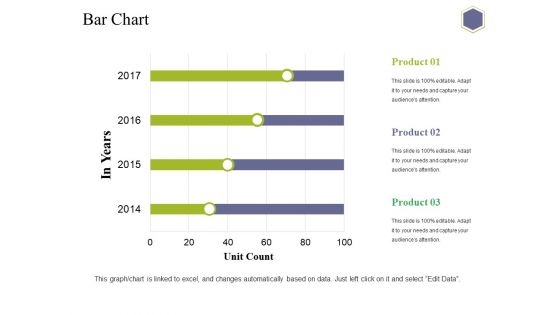
Bar Chart Ppt PowerPoint Presentation Slide Download
This is a bar chart ppt powerpoint presentation slide download. This is a three stage process. The stages in this process are chart, in years, unit count, business, marketing.
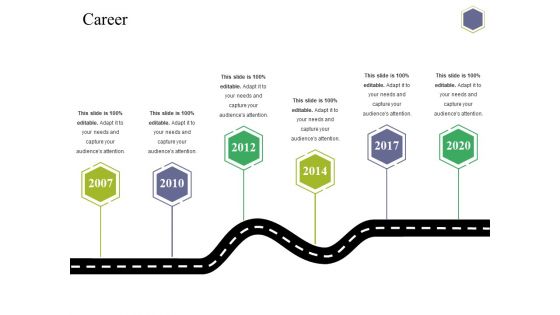
Career Template 2 Ppt PowerPoint Presentation Model Graphics Design
This is a career template 2 ppt powerpoint presentation model graphics design. This is a six stage process. The stages in this process are roadmap, management, years, business, management.
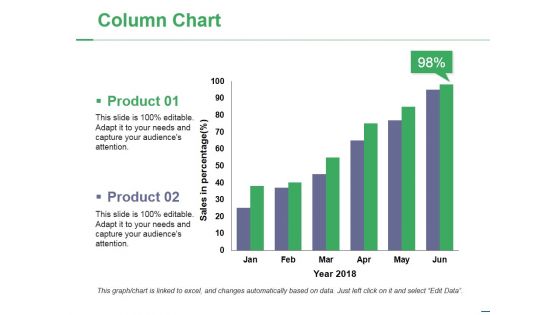
Column Chart Ppt PowerPoint Presentation Portfolio Slide Download
This is a column chart ppt powerpoint presentation portfolio slide download. This is a two stage process. The stages in this process are product, year, bar graph, success, business.
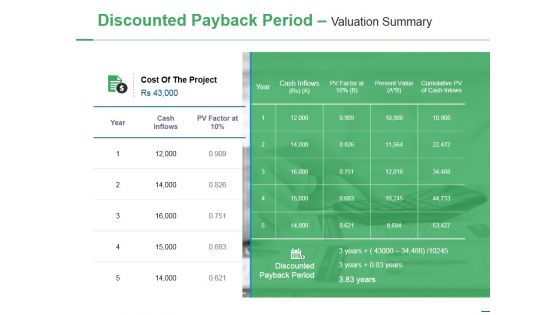
Discounted Payback Period Valuation Summary Ppt PowerPoint Presentation Inspiration Slide Download
This is a discounted payback period valuation summary ppt powerpoint presentation inspiration slide download. This is a two stage process. The stages in this process are cost of the project, cash inflows, year, discounted payback period.

Line Chart Ppt PowerPoint Presentation Show Guide
This is a line chart ppt powerpoint presentation show guide. This is a two stage process. The stages in this process are product, sales in percentage, financial years, growth, success.
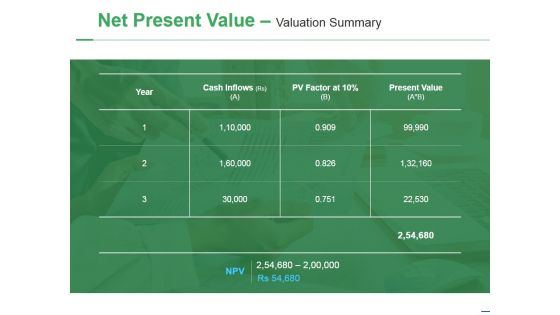
Net Present Value Valuation Summary Ppt PowerPoint Presentation Layouts Good
This is a net present value valuation summary ppt powerpoint presentation layouts good. This is a three stage process. The stages in this process are cash inflows, year, present value, pv factor, npv.
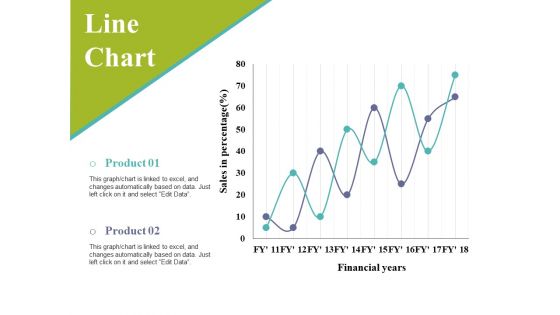
Line Chart Ppt PowerPoint Presentation Infographic Template Slides
This is a line chart ppt powerpoint presentation infographic template slides. This is a two stage process. The stages in this process are sales in percentage, financial years, business, marketing, graph.
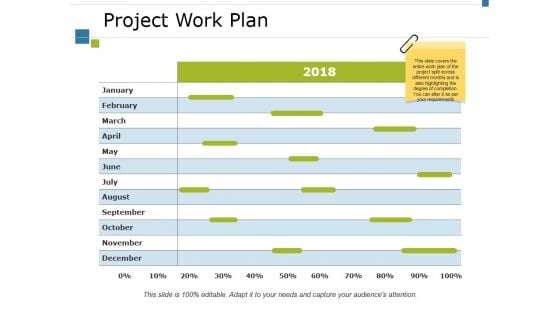
Project Work Plan Ppt PowerPoint Presentation Slides Example Introduction
This is a project work plan ppt powerpoint presentation slides example introduction. This is a nine stage process. The stages in this process are calendar, time planning, year, month, business.
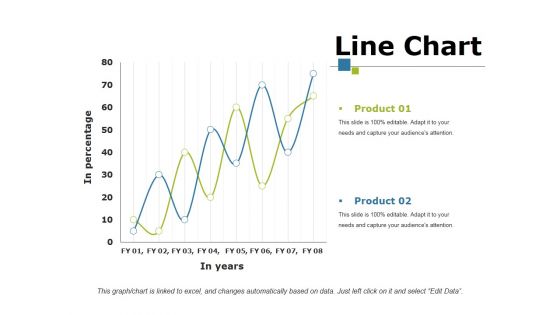
Line Chart Ppt PowerPoint Presentation Portfolio Mockup
This is a line chart ppt powerpoint presentation portfolio mockup. This is a two stage process. The stages in this process are product, in percentage, in year, growth, success.
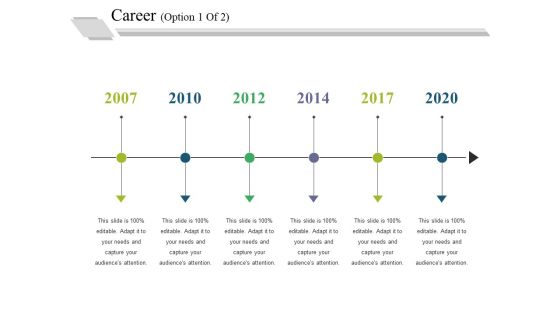
Career Template 1 Ppt PowerPoint Presentation Outline Format Ideas
This is a career template 1 ppt powerpoint presentation outline format ideas. This is a six stage process. The stages in this process are years, business, management, timeline, planning.
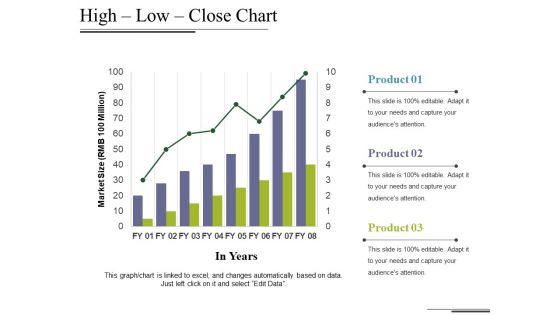
High Low Close Chart Ppt PowerPoint Presentation Styles Maker
This is a high low close chart ppt powerpoint presentation styles maker. This is a three stage process. The stages in this process are market size, in years, growth, business, marketing, graph.
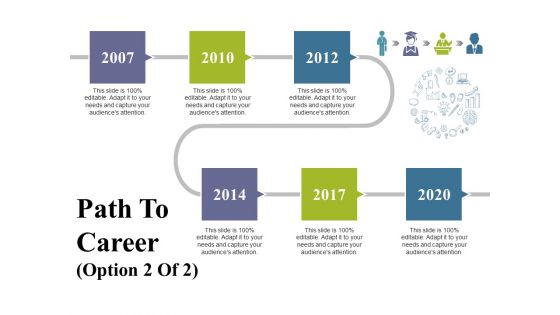
Path To Career Ppt PowerPoint Presentation Infographic Template Display
This is a path to career ppt powerpoint presentation infographic template display. This is a six stage process. The stages in this process are timelines, years, business, management, planning.
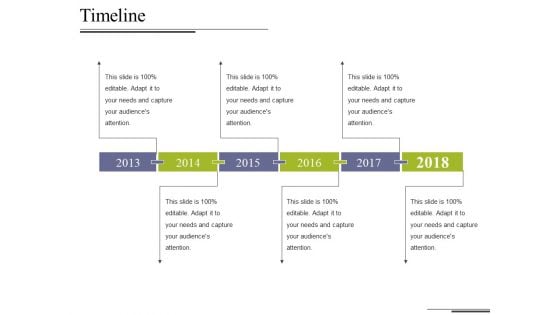
Timeline Ppt PowerPoint Presentation Model Portfolio
This is a path to career ppt powerpoint presentation infographic template display. This is a six stage process. The stages in this process are timelines, years, business, management, planning.
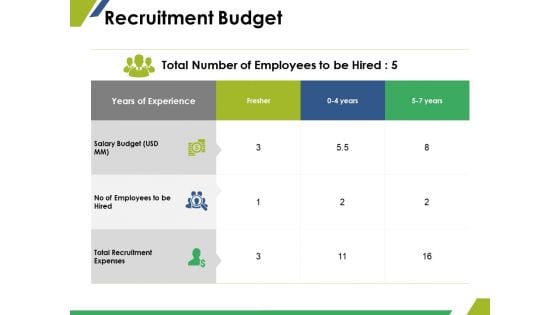
Recruitment Budget Ppt PowerPoint Presentation Show Graphic Tips
This is a recruitment budget ppt powerpoint presentation show graphic tips. This is a three stage process. The stages in this process are fresher, years, salary budget, no of employees to be hired, total recruitment expenses.
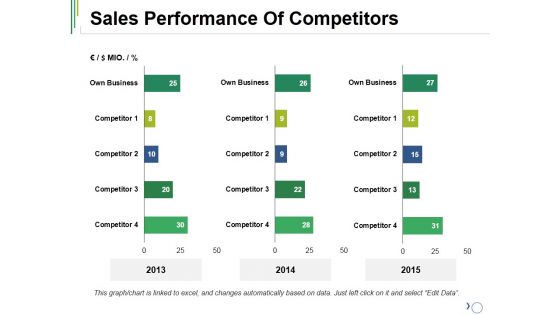
Sales Performance Of Competitors Ppt PowerPoint Presentation Summary Model
This is a sales performance of competitors ppt powerpoint presentation summary model. This is a three stage process. The stages in this process are own business, competitor, year, management, marketing.
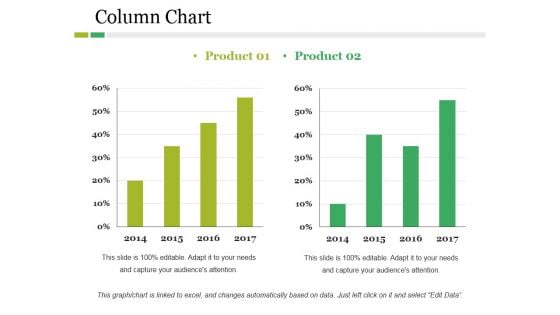
Column Chart Ppt PowerPoint Presentation Layouts Graphics Example
This is a column chart ppt powerpoint presentation layouts graphics example. This is a two stage process. The stages in this process are product, year, bar graph, business, finance.
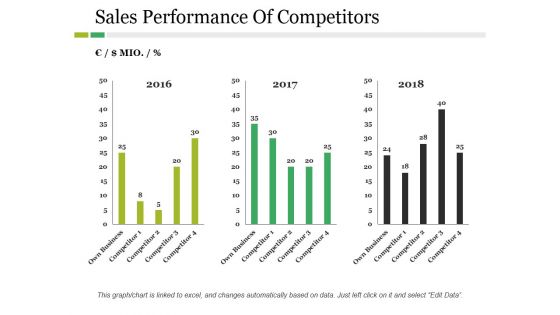
Sales Performance Of Competitors Ppt PowerPoint Presentation Inspiration Example
This is a sales performance of competitors ppt powerpoint presentation inspiration example. This is a three stage process. The stages in this process are business, marketing, year, bar graph, finance.

Competitive Landscape Model Ppt PowerPoint Presentation Complete Deck With Slides
This is a competitive landscape model ppt powerpoint presentation complete deck with slides. This is a one stage process. The stages in this process are competitive, landscape, model, year, business.
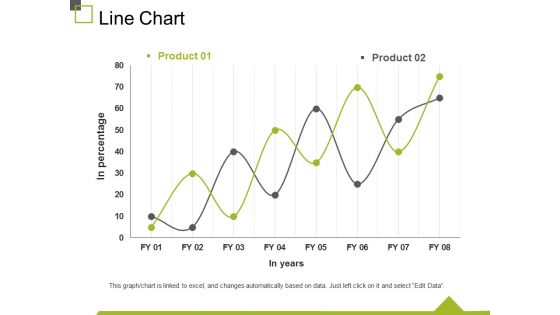
Line Chart Ppt PowerPoint Presentation Infographics Display
This is a line chart ppt powerpoint presentation infographics display. This is a two stage process. The stages in this process are in percentage, in years, chart, business, marketing.
Major Roadblocks Or Obstacles Ppt PowerPoint Presentation Icon Topics
This is a major roadblocks or obstacles ppt powerpoint presentation icon topics. This is a four stage process. The stages in this process are timeline, strategy, planning, years, management.
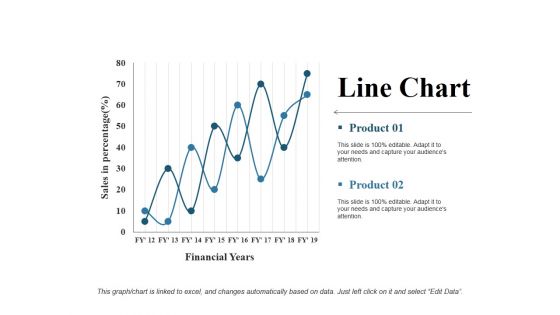
Line Chart Ppt PowerPoint Presentation Gallery Rules
This is a line chart ppt powerpoint presentation gallery rules. This is a two stage process. The stages in this process are financial years, product, sales in percentage, line chart, growth.


 Continue with Email

 Home
Home


