Yearly Schedule
Timeline Ppt PowerPoint Presentation Gallery Icon
This is a timeline ppt powerpoint presentation gallery icon. This is a three stage process. The stages in this process are year, growth, success, time planning, business.
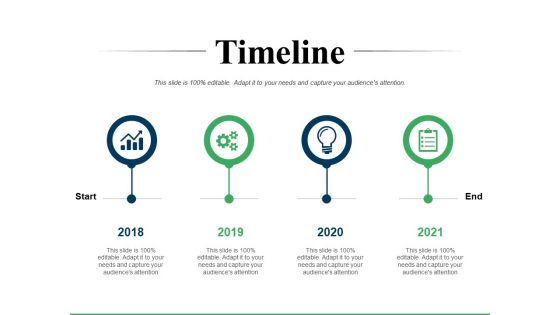
Timeline Ppt PowerPoint Presentation Slides Graphic Tips
This is a timeline ppt powerpoint presentation slides graphic tips. This is a four stage process. The stages in this process are year, growth, success, time planning, business.
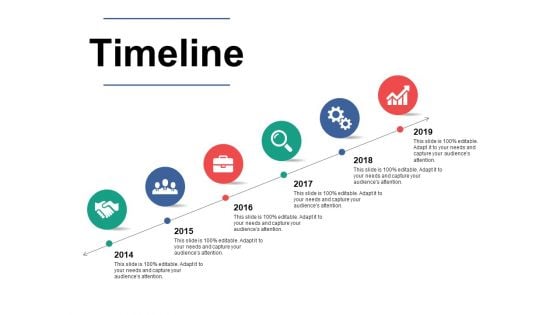
Timeline Ppt PowerPoint Presentation Infographic Template Layout
This is a timeline ppt powerpoint presentation infographic template layout. This is a six stage process. The stages in this process are year, growth, success, time planning, business.
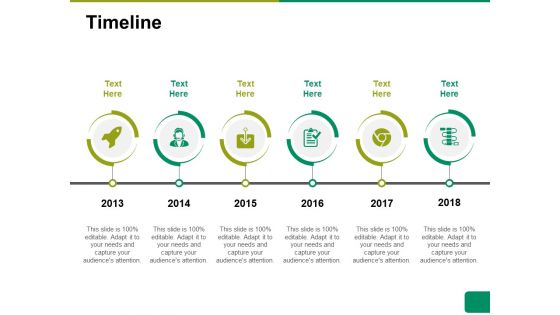
Timeline Ppt PowerPoint Presentation Infographics Example
This is a timeline ppt powerpoint presentation infographics example. This is a six stage process. The stages in this process are year, growth, success, time planning, business.
Timeline Ppt PowerPoint Presentation Portfolio Clipart
This is a timeline ppt powerpoint presentation portfolio clipart. This is a five stage process. The stages in this process are year, growth, success, time planning, business.

Timeline Ppt PowerPoint Presentation Summary Design Inspiration
This is a timeline ppt powerpoint presentation summary design inspiration. This is a seven stage process. The stages in this process are year, growth, success, time planning, business.
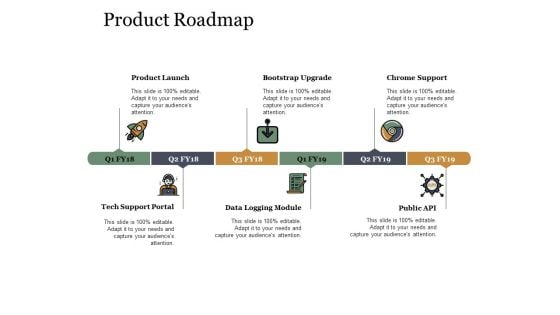
Product Roadmap Ppt PowerPoint Presentation Gallery Files
This is a product roadmap ppt powerpoint presentation gallery files. This is a six stage process. The stages in this process are year, growth, success, time planning, business.
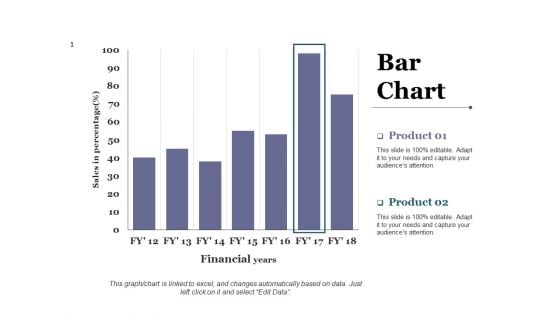
Bar Chart Ppt PowerPoint Presentation Diagram Lists
This is a bar chart ppt powerpoint presentation diagram lists. This is a two stage process. The stages in this process are business, marketing, financial years, sales in percentage, graph.
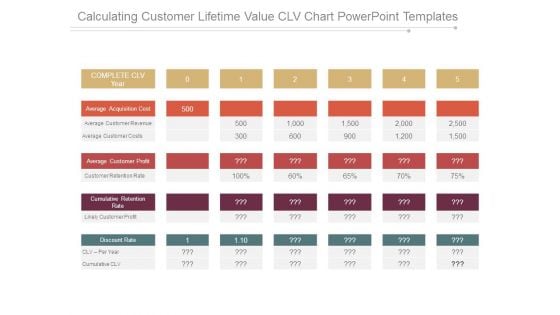
Calculating Customer Lifetime Value Clv Chart Powerpoint Templates
This is a calculating customer lifetime value clv chart powerpoint templates. This is a five stage process. The stages in this process are complete clv year, average acquisition cost, average customer revenue, average customer costs, average customer profit, customer retention rate, cumulative retention rate, likely customer profit, discount rate, clv per year, cumulative clv.
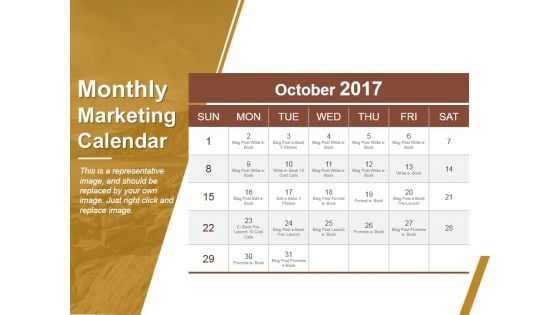
Monthly Marketing Calendar Ppt PowerPoint Presentation Layouts Slide Portrait
This is a monthly marketing calendar ppt powerpoint presentation layouts slide portrait. This is a seven stage process. The stages in this process are business, marketing, management, calendar, year.
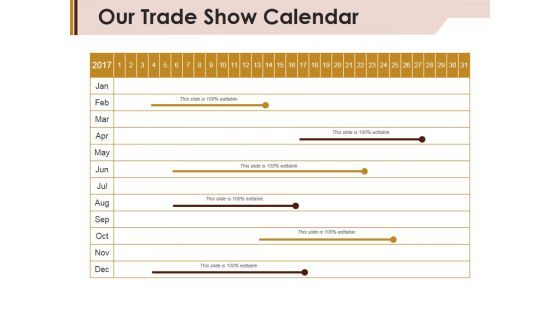
Our Trade Show Calendar Ppt PowerPoint Presentation Slides Gallery
This is a our trade show calendar ppt powerpoint presentation slides gallery. This is a six stage process. The stages in this process are years, calendar, date, business, marketing.
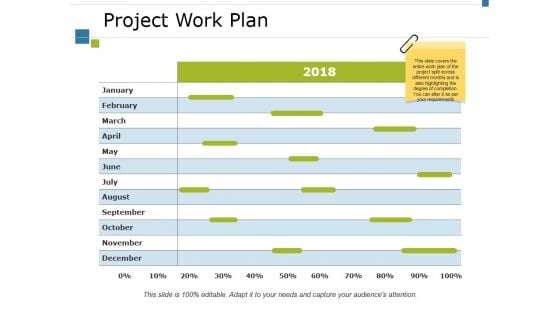
Project Work Plan Ppt PowerPoint Presentation Slides Example Introduction
This is a project work plan ppt powerpoint presentation slides example introduction. This is a nine stage process. The stages in this process are calendar, time planning, year, month, business.
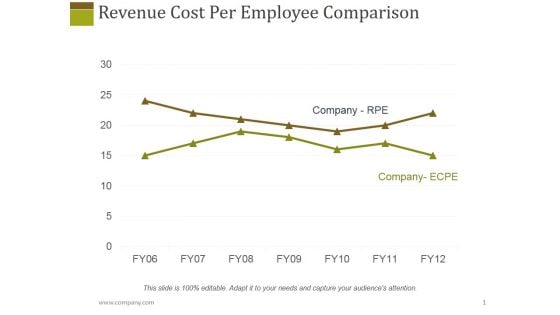
Revenue Cost Per Employee Comparison Ppt PowerPoint Presentation Diagram Lists
This is a revenue cost per employee comparison ppt powerpoint presentation diagram lists. This is a seven stage process. The stages in this process are year, graph, management, finance, company rpe.
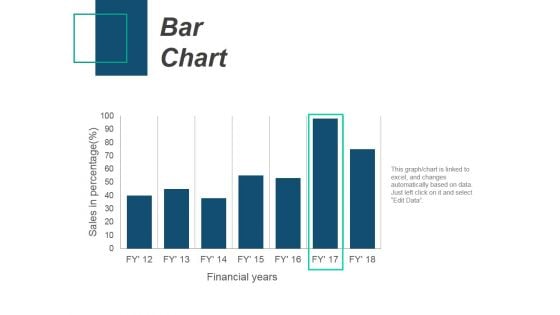
Bar Chart Ppt PowerPoint Presentation Professional Files
This is a bar chart ppt powerpoint presentation professional files. This is a seven stage process. The stages in this process are bar chart, product, sales in percentage, financial years.
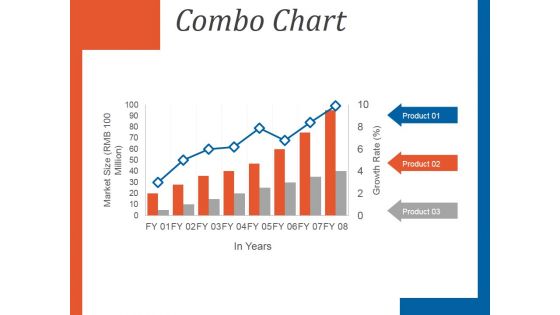
Combo Chart Ppt PowerPoint Presentation Design Ideas
This is a combo chart ppt powerpoint presentation design ideas. This is a eight stage process. The stages in this process are market size, combo chart, in years, product, growth rate.
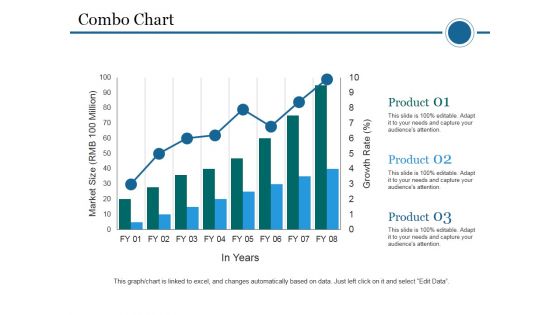
Combo Chart Ppt PowerPoint Presentation Infographics Summary
This is a combo chart ppt powerpoint presentation infographics summary. This is a three stage process. The stages in this process are market size, product, combo chart, years, business.
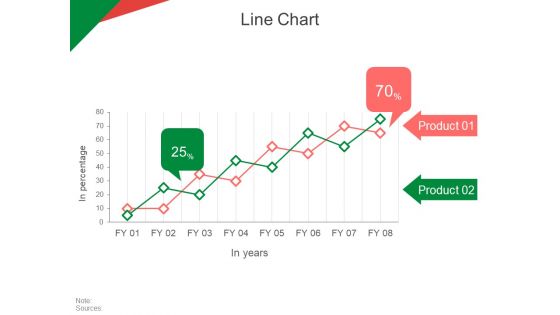
Line Chart Ppt PowerPoint Presentation Professional Smartart
This is a line chart ppt powerpoint presentation professional smartart. This is a two stage process. The stages in this process are in percentage, in years, product, finance, business.
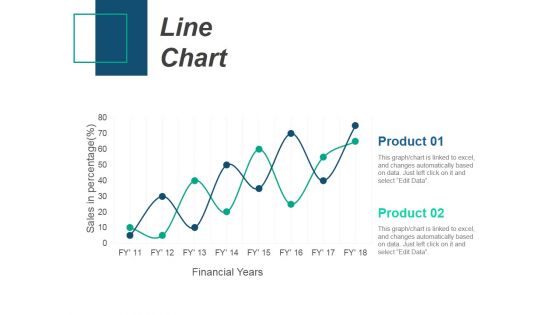
Line Chart Ppt PowerPoint Presentation Infographic Template Introduction
This is a line chart ppt powerpoint presentation infographic template introduction. This is a two stage process. The stages in this process are product, sales in percentage, financial years, line chart.
Line Chart Ppt PowerPoint Presentation Infographic Template Icons
This is a line chart ppt powerpoint presentation infographic template icons. This is a two stage process. The stages in this process are sales in percentage, financial years, product, line chart.

Combo Chart Ppt PowerPoint Presentation Summary Design Templates
This is a combo chart ppt powerpoint presentation summary design templates. This is a four stage process. The stages in this process are units sold, product, combo chart, years, planning.
Area Chart Ppt PowerPoint Presentation Icon Layout Ideas
This is a area chart ppt powerpoint presentation icon layout ideas. This is a two stage process. The stages in this process are area chart, sales in percentage, years, planning, business.
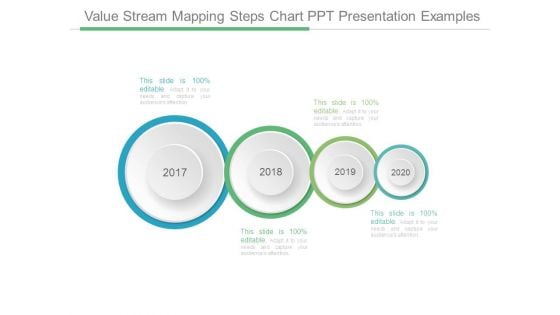
Value Stream Mapping Steps Chart Ppt Presentation Examples
This is a value stream mapping steps chart ppt presentation examples. This is a four stage process. The stages in this process are years, time planning, business, marketing, future.
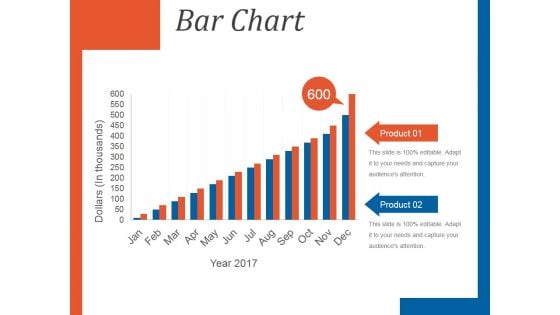
Bar Chart Template 1 Ppt PowerPoint Presentation Background Images
This is a bar chart template 1 ppt powerpoint presentation background images. This is a twelve stage process. The stages in this process are product, bar chart, dollars, year.
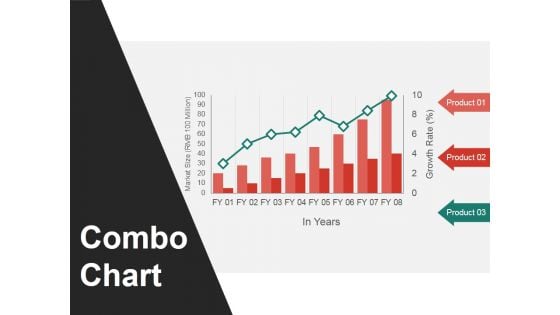
Combo Chart Ppt PowerPoint Presentation Gallery Visual Aids
This is a combo chart ppt powerpoint presentation gallery visual aids. This is a three stage process. The stages in this process are combo chart, in years, market size, product.
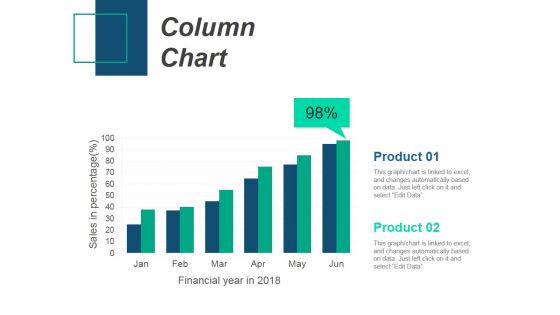
Column Chart Ppt PowerPoint Presentation Gallery Design Inspiration
This is a column chart ppt powerpoint presentation gallery design inspiration. This is a two stage process. The stages in this process are column chart, product, sales in percentage, financial years.
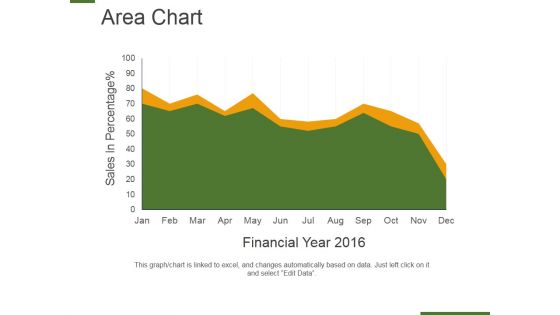
Area Chart Ppt PowerPoint Presentation Layouts Graphics Example
This is a area chart ppt powerpoint presentation layouts graphics example. This is a two stage process. The stages in this process are sales in percentage, financial year, business, marketing, presentation.
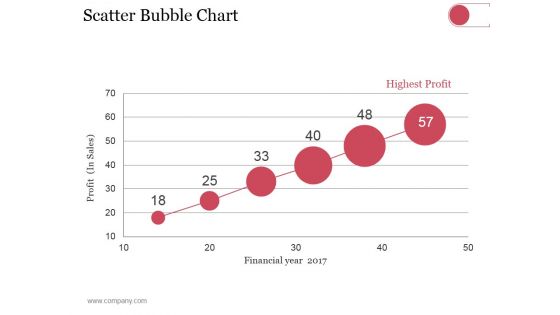
Scatter Bubble Chart Ppt PowerPoint Presentation Summary Pictures
This is a scatter bubble chart ppt powerpoint presentation summary pictures. This is a six stage process. The stages in this process are highest profit, financial year, profit in sales.
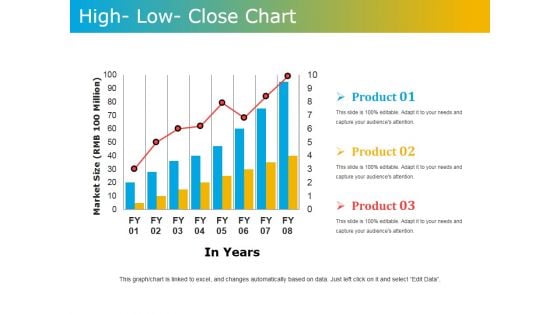
High Low Close Chart Ppt PowerPoint Presentation Model Graphics Tutorials
This is a high low close chart ppt powerpoint presentation model graphics tutorials. This is a three stage process. The stages in this process are market size, in years, product.
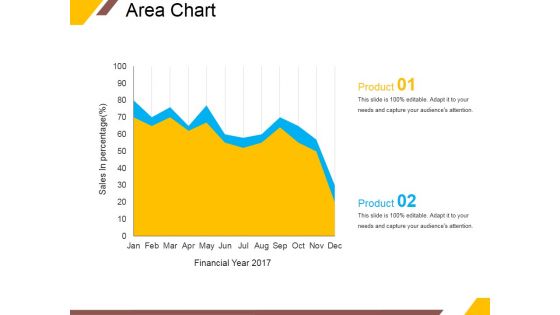
Area Chart Ppt PowerPoint Presentation Layouts Vector
This is a area chart ppt powerpoint presentation layouts vector. This is a two stage process. The stages in this process are area chart, product, sales in percentage, financial year.
Bar Chart Ppt PowerPoint Presentation Icon Layout
This is a bar chart ppt powerpoint presentation icon layout. This is a one stage process. The stages in this process are sales in percentage, financial years, bar chart, finance, marketing.
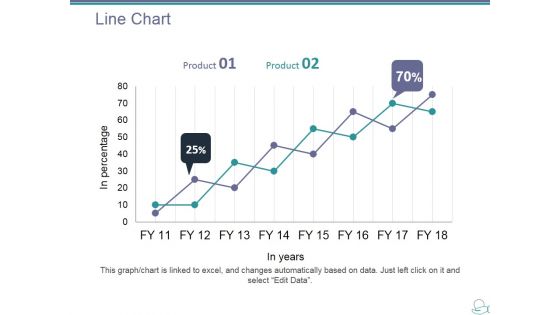
Line Chart Ppt PowerPoint Presentation Layouts Show
This is a line chart ppt powerpoint presentation layouts show. This is a two stage process. The stages in this process are product, in years, in percentage, line chart, growth.
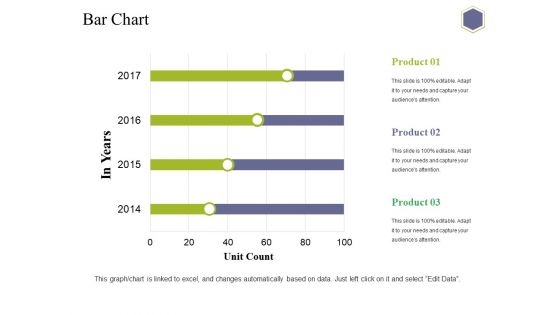
Bar Chart Ppt PowerPoint Presentation Slide Download
This is a bar chart ppt powerpoint presentation slide download. This is a three stage process. The stages in this process are chart, in years, unit count, business, marketing.
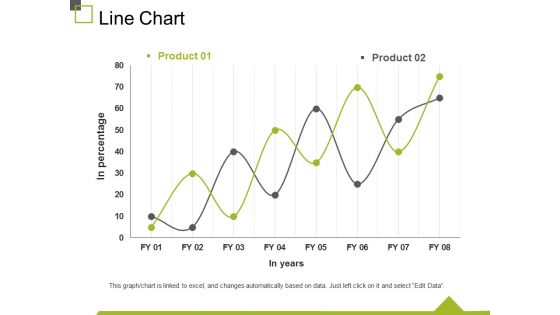
Line Chart Ppt PowerPoint Presentation Infographics Display
This is a line chart ppt powerpoint presentation infographics display. This is a two stage process. The stages in this process are in percentage, in years, chart, business, marketing.
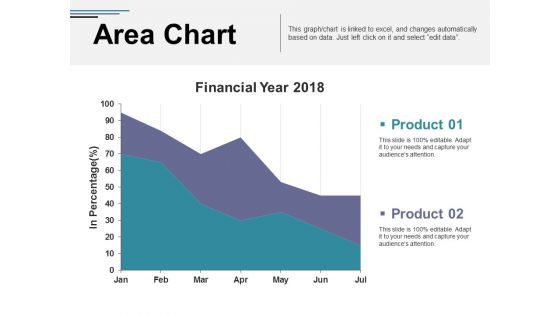
Area Chart Ppt PowerPoint Presentation Inspiration Professional
This is a area chart ppt powerpoint presentation inspiration professional. This is a two stage process. The stages in this process are financial year, in percentage, area chart, finance, business, marketing.
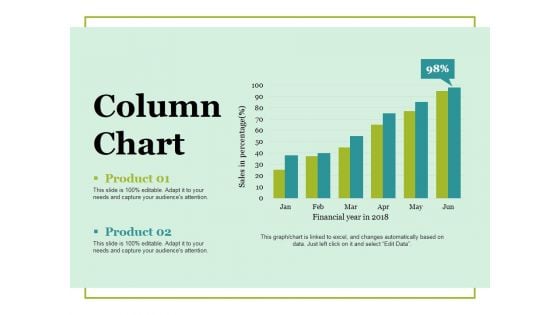
Column Chart Ppt PowerPoint Presentation Ideas Vector
This is a column chart ppt powerpoint presentation ideas vector. This is a two stage process. The stages in this process are column chart, product, financial years, sales in percentage, growth.
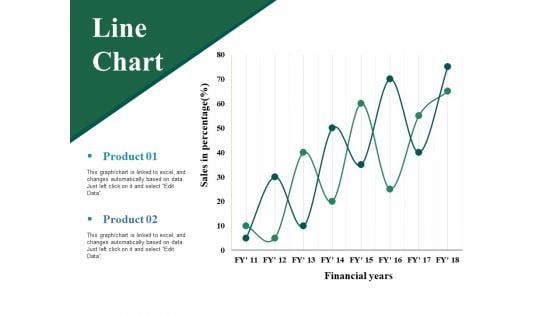
Line Chart Ppt PowerPoint Presentation Professional Grid
This is a line chart ppt powerpoint presentation professional grid. This is a two stage process. The stages in this process are sales in percentage, financial years, product, line chart.
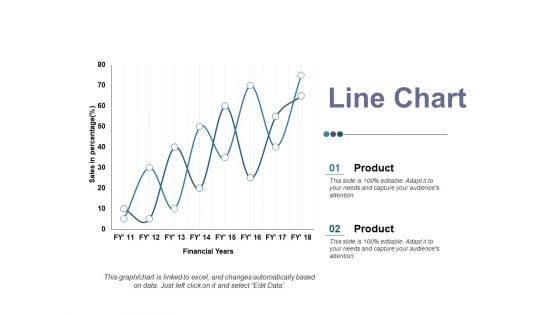
Line Chart Ppt PowerPoint Presentation Ideas Elements
This is a line chart ppt powerpoint presentation ideas elements. This is a two stage process. The stages in this process are product, sales in percentage, financial year, business, line chart.
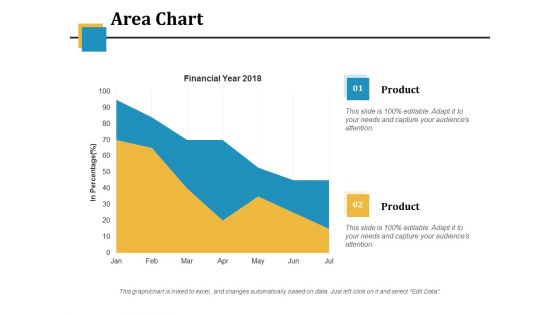
Area Chart Ppt PowerPoint Presentation Model Inspiration
This is a area chart ppt powerpoint presentation model inspiration. This is a two stage process. The stages in this process are financial year, in percentage, area chart, business, marketing.
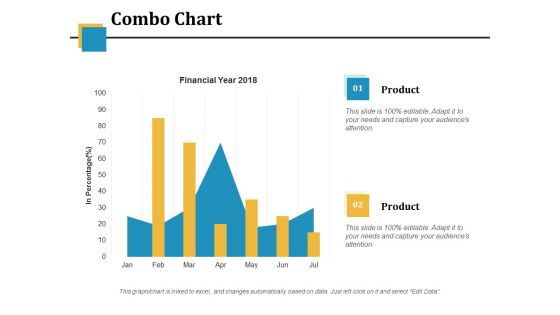
Combo Chart Ppt PowerPoint Presentation Model Vector
This is a combo chart ppt powerpoint presentation model vector. This is a two stage process. The stages in this process are financial year, in percentage, business, marketing, combo chart.
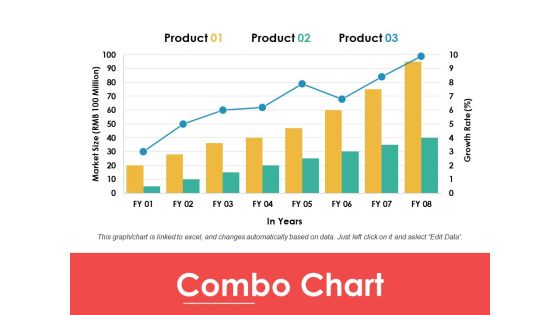
Combo Chart Ppt PowerPoint Presentation Pictures Objects
This is a combo chart ppt powerpoint presentation pictures objects. This is a three stage process. The stages in this process are product, combo chart, in years, market size.
Area Chart Ppt PowerPoint Presentation Icon Summary
This is a area chart ppt powerpoint presentation icon summary. This is a two stage process. The stages in this process are financial year, area chart, in percentage, product.
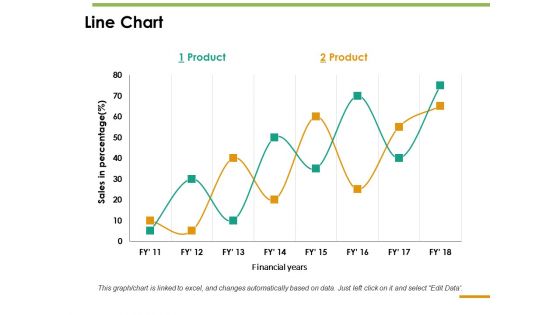
Line Chart Ppt PowerPoint Presentation Inspiration Guide
This is a line chart ppt powerpoint presentation inspiration guide. This is a two stage process. The stages in this process are line chart, sales in percentage, product, financial years.
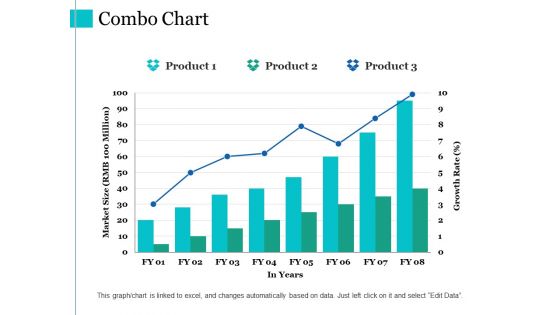
Combo Chart Ppt PowerPoint Presentation Gallery Diagrams
This is a combo chart ppt powerpoint presentation gallery diagrams. This is a three stage process. The stages in this process are combo chart, market size, product, in years, growth rate.
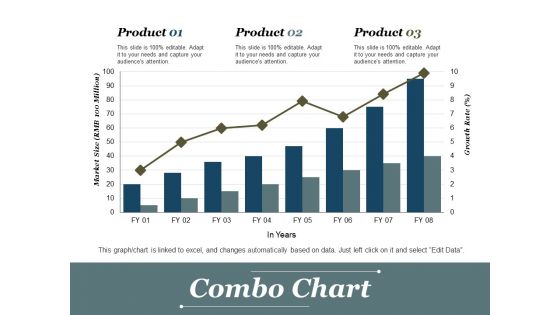
Combo Chart Ppt PowerPoint Presentation Slides Outline
This is a combo chart ppt powerpoint presentation slides outline. This is a three stage process. The stages in this process are combo chart, growth, product, financial year, business.
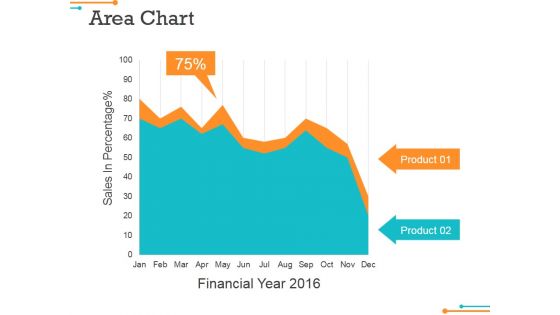
Area Chart Ppt Powerpoint Presentation File Show
This is a area chart ppt powerpoint presentation file show. This is a two stage process. The stages in this process are sales in percentage, financial year, product, financial, business.
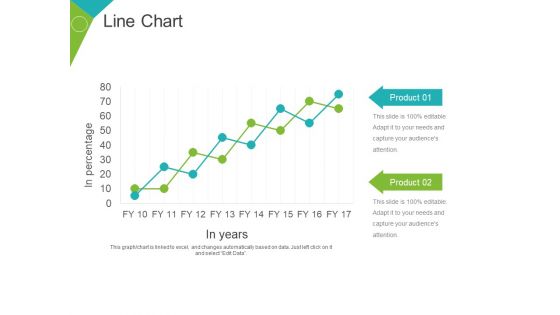
Line Chart Ppt PowerPoint Presentation Gallery Objects
This is a line chart ppt powerpoint presentation gallery objects. This is a two stage process. The stages in this process are product, business, marketing, growth, in years, in percentage.
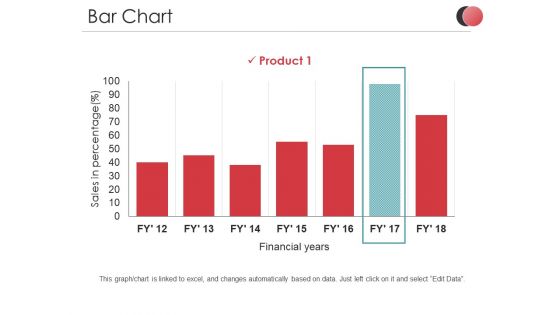
Bar Chart Ppt PowerPoint Presentation Outline Introduction
This is a bar chart ppt powerpoint presentation outline introduction. This is a one stage process. The stages in this process are sales in percentage, product, business, financial years, graph.
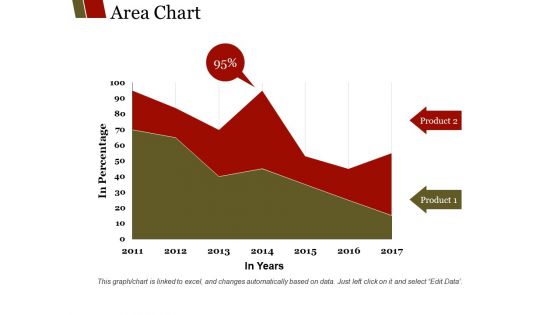
Area Chart Ppt PowerPoint Presentation Show Templates
This is a area chart ppt powerpoint presentation show templates. This is a two stage process. The stages in this process are product, in percentage, in years, finance, graph.
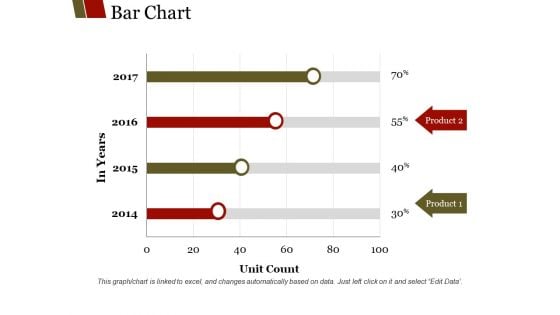
Bar Chart Ppt PowerPoint Presentation Outline Guidelines
This is a bar chart ppt powerpoint presentation outline guidelines. This is a four stage process. The stages in this process are product, unit count, in years, graph, finance, business.
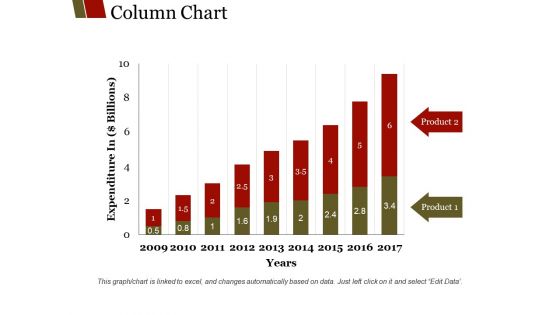
Column Chart Ppt PowerPoint Presentation Summary Graphics
This is a column chart ppt powerpoint presentation summary graphics. This is a nine stage process. The stages in this process are product, years, expenditure in billions, graph, business.
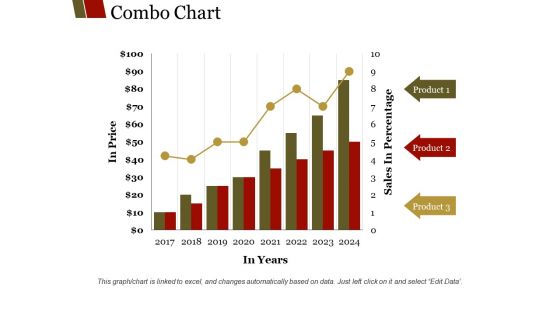
Combo Chart Ppt PowerPoint Presentation Summary Layouts
This is a combo chart ppt powerpoint presentation summary layouts. This is a eight stage process. The stages in this process are product, sales in percentage, in years, in price, graph.
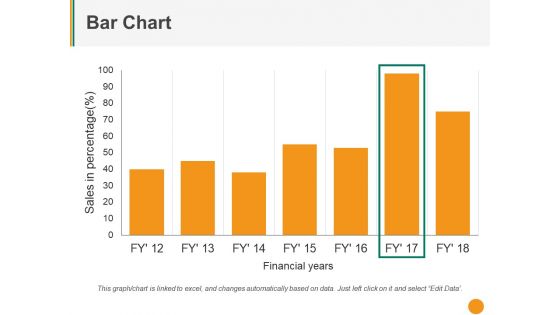
Bar Chart Ppt PowerPoint Presentation Styles Outfit
This is a bar chart ppt powerpoint presentation styles outfit. This is a Seven stage process. The stages in this process are sales in percentage, financial years, graph, business.
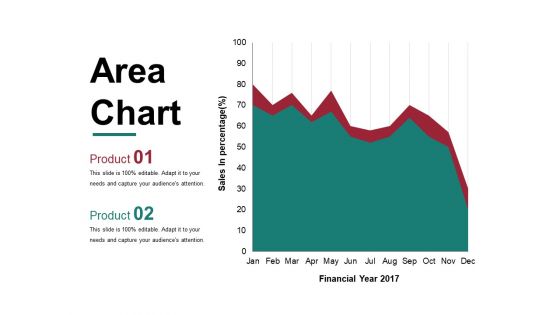
Area Chart Ppt PowerPoint Presentation Layouts Maker
This is a area chart ppt powerpoint presentation layouts maker. This is a two stage process. The stages in this process are financial year, sales in percentage, graph, business, marketing.
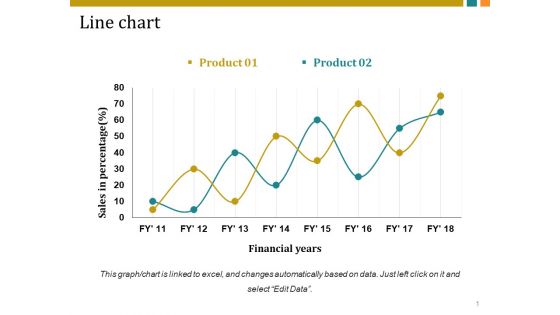
Line Chart Ppt PowerPoint Presentation Inspiration Vector
This is a line chart ppt powerpoint presentation inspiration vector. This is a two stage process. The stages in this process are sales in percentage, financial years, business, marketing, growth.
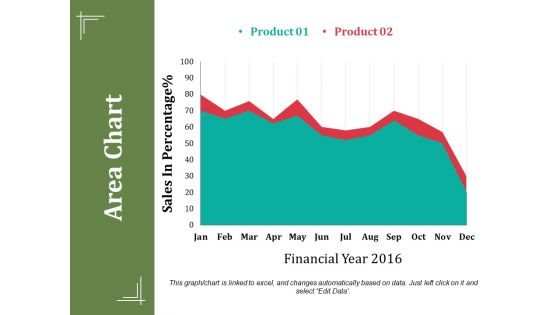
Area Chart Ppt PowerPoint Presentation Summary Show
This is a area chart ppt powerpoint presentation summary show. This is a two stage process. The stages in this process are sales in percentage, financial year, business, marketing, finance.
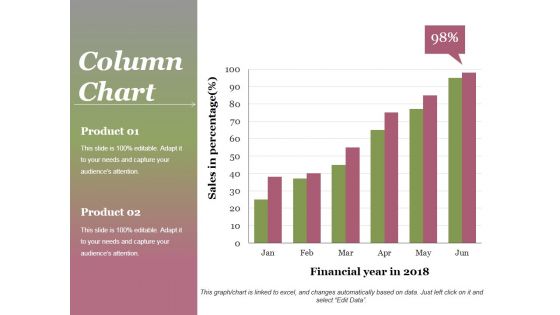
Column Chart Ppt PowerPoint Presentation Gallery Background
This is a column chart ppt powerpoint presentation gallery background. This is a two stage process. The stages in this process are product, sales in percentage, financial year, graph, success.
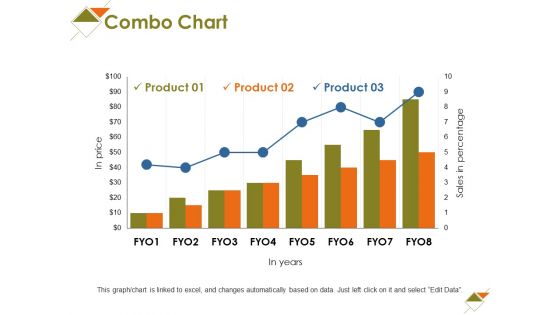
Combo Chart Ppt PowerPoint Presentation Show Elements
This is a combo chart ppt powerpoint presentation show elements. This is a three stage process. The stages in this process are in price, in years, business, marketing, growth.
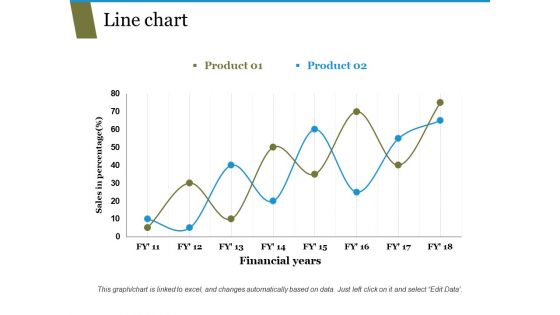
Line Chart Ppt PowerPoint Presentation Pictures Templates
This is a line chart ppt powerpoint presentation pictures templates. This is a two stage process. The stages in this process are sales in percentage, financial years, business, marketing, growth.
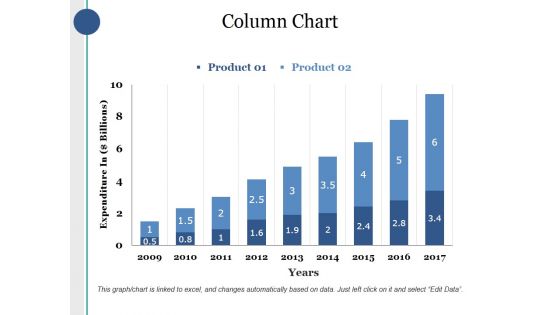
Column Chart Ppt PowerPoint Presentation Infographics Deck
This is a column chart ppt powerpoint presentation infographics deck. This is a two stage process. The stages in this process are product, expenditure in, years, bar graph, growth.
Bar Chart Ppt PowerPoint Presentation Icon Information
This is a bar chart ppt powerpoint presentation icon information. This is a one stage process. The stages in this process are product, sales in percentage, financial years, bar graph, growth.


 Continue with Email

 Home
Home


