Yearly Schedule
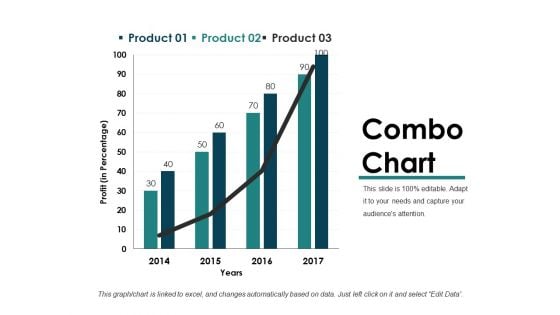
Combo Chart Ppt PowerPoint Presentation Slides Introduction
This is a combo chart ppt powerpoint presentation slides introduction. This is a four stage process. The stages in this process are profit, years, business, marketing, graph.
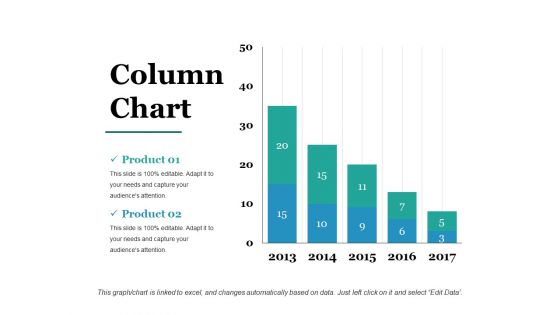
Column Chart Ppt PowerPoint Presentation Styles Picture
This is a column chart ppt powerpoint presentation styles picture. This is a five stage process. The stages in this process are years, business, marketing, graph, finance.
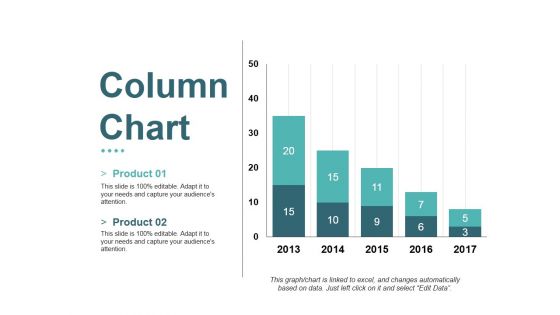
Column Chart Ppt PowerPoint Presentation Summary Maker
This is a column chart ppt powerpoint presentation summary maker. This is a two stage process. The stages in this process are business, marketing, product, bar graph, years.
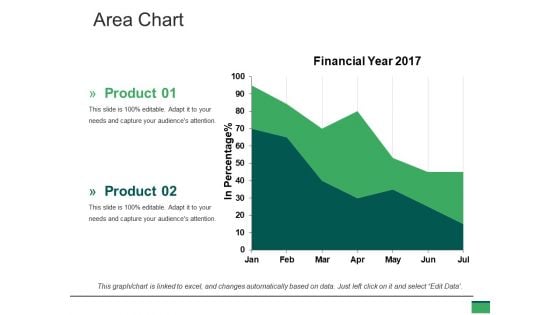
Area Chart Ppt PowerPoint Presentation Ideas Tips
This is a area chart ppt powerpoint presentation ideas tips. This is a two stage process. The stages in this process are in percentage, financial, year, business, marketing.
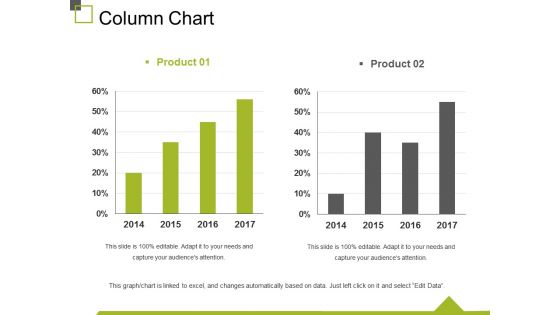
Column Chart Ppt PowerPoint Presentation Summary Slides
This is a column chart ppt powerpoint presentation summary slides. This is a two stage process. The stages in this process are finance, marketing, business, graph, years.
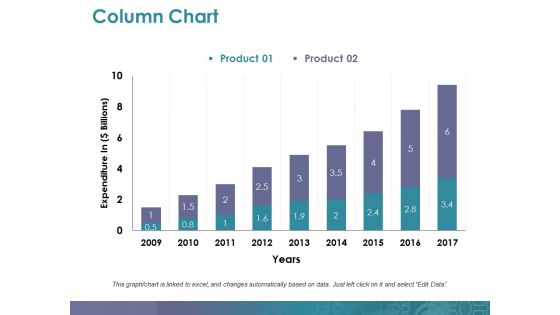
Column Chart Ppt PowerPoint Presentation Summary Deck
This is a column chart ppt powerpoint presentation summary deck. This is a two stage process. The stages in this process are expenditure in, years, business, marketing, graph.
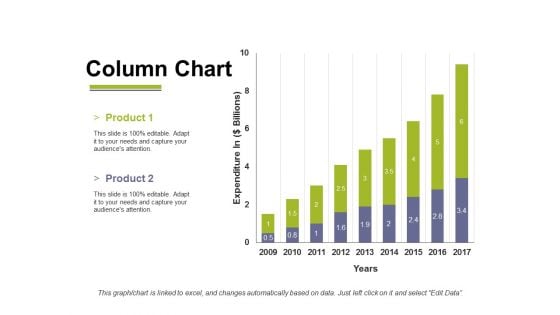
Column Chart Ppt PowerPoint Presentation File Inspiration
This is a column chart ppt powerpoint presentation file inspiration. This is a two stage process. The stages in this process are business, marketing, years, expenditure in, graph.
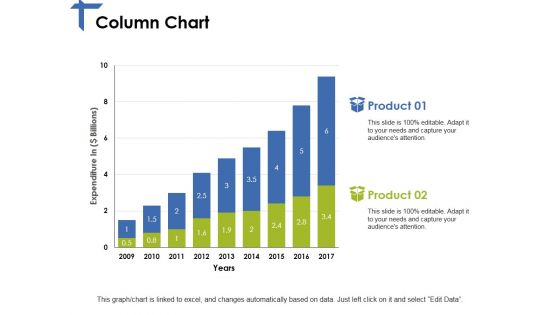
Column Chart Ppt PowerPoint Presentation Portfolio Topics
This is a column chart ppt powerpoint presentation portfolio topics. This is a two stage process. The stages in this process are expenditure, years, product, growth, success.

Column Chart Ppt PowerPoint Presentation Show Images
This is a column chart ppt powerpoint presentation show images. This is a two stage process. The stages in this process are product, expenditure, years, bar graph, growth.
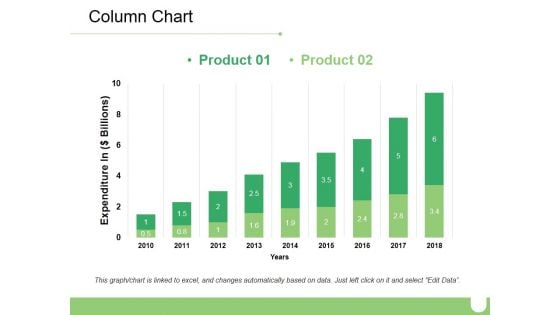
Column Chart Ppt PowerPoint Presentation Show Example
This is a column chart ppt powerpoint presentation show example. This is a two stage process. The stages in this process are business, marketing, expenditure in, finance, years.
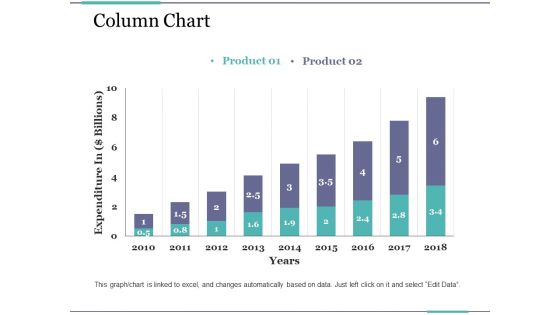
Column Chart Ppt PowerPoint Presentation Outline Deck
This is a column chart ppt powerpoint presentation outline deck. This is a two stage process. The stages in this process are business, marketing, expenditure in, years, graph.

Column Chart Ppt PowerPoint Presentation Ideas Deck
This is a column chart ppt powerpoint presentation ideas deck. This is a two stage process. The stages in this process are business, marketing, dollars, in years, graph.
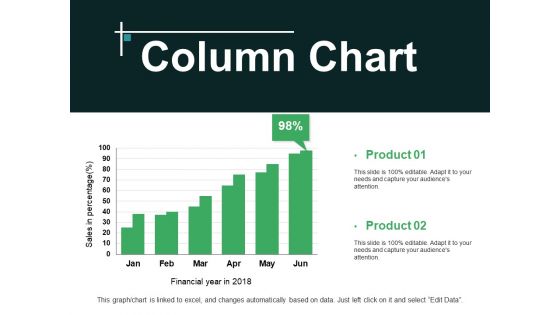
Column Chart Ppt PowerPoint Presentation Professional Aids
This is a column chart ppt powerpoint presentation professional aids. This is a two stage process. The stages in this process are product, sales in percentage, financial years.
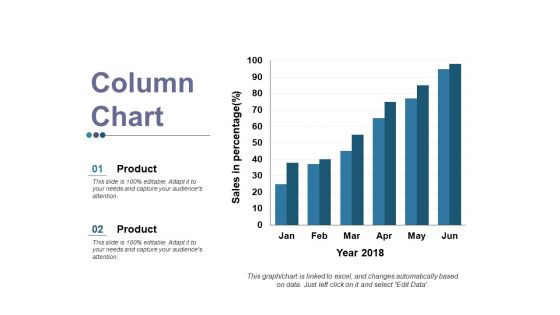
Column Chart Ppt PowerPoint Presentation Gallery Layout
This is a column chart ppt powerpoint presentation gallery layout. This is a two stage process. The stages in this process are product, sales in percentage, year.
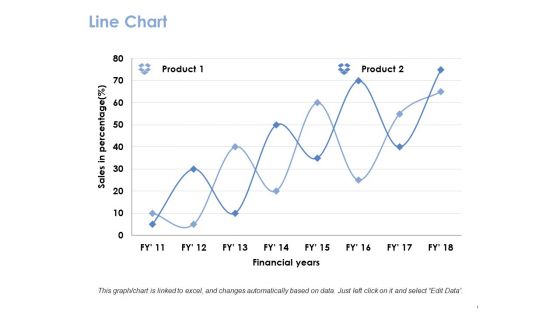
Line Chart Ppt PowerPoint Presentation Gallery Guide
This is a line chart ppt powerpoint presentation gallery guide. This is a two stage process. The stages in this process are product, financial years, sales in percentage.
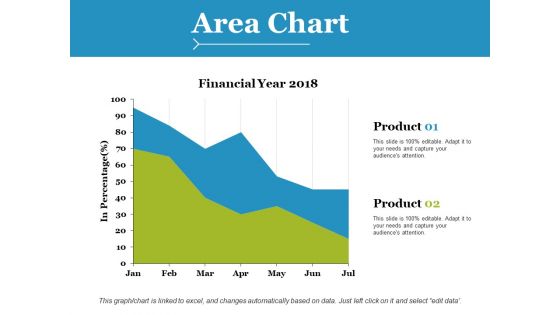
Area Chart Ppt PowerPoint Presentation Styles Brochure
This is a area chart ppt powerpoint presentation styles brochure. This is a two stage process. The stages in this process are product, financial years, in percentage.
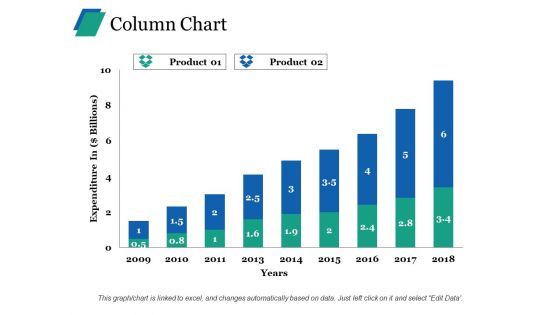
Column Chart Ppt PowerPoint Presentation Ideas Clipart
This is a column chart ppt powerpoint presentation ideas clipart. This is a two stage process. The stages in this process are product, expenditure in, years.
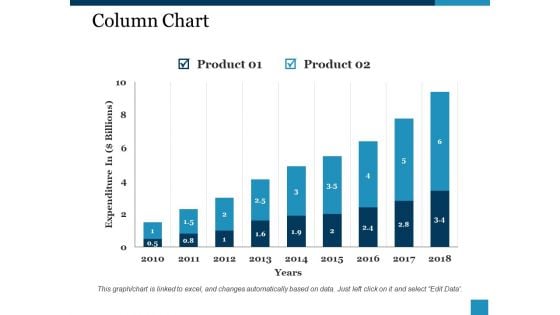
Column Chart Ppt PowerPoint Presentation Show Slideshow
This is a column chart ppt powerpoint presentation show slideshow. This is a two stage process. The stages in this process are product, expenditure, years.
Line Chart Ppt PowerPoint Presentation Icon Inspiration
This is a line chart ppt powerpoint presentation icon inspiration. This is a two stage process. The stages in this process are product, financial years, sales in percentage.
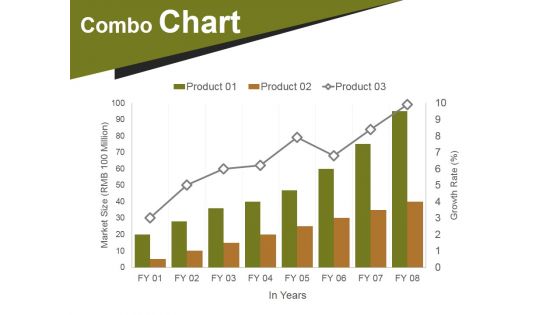
Combo Chart Ppt PowerPoint Presentation Portfolio Infographics
This is a combo chart ppt powerpoint presentation portfolio infographics. This is a eight stage process. The stages in this process are market size, growth, years, finance, business.
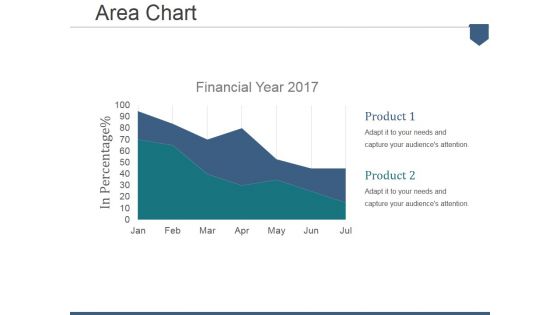
Area Chart Ppt PowerPoint Presentation Summary Example
This is a area chart ppt powerpoint presentation summary example. This is a two stage process. The stages in this process are financial year, in percentage, product.
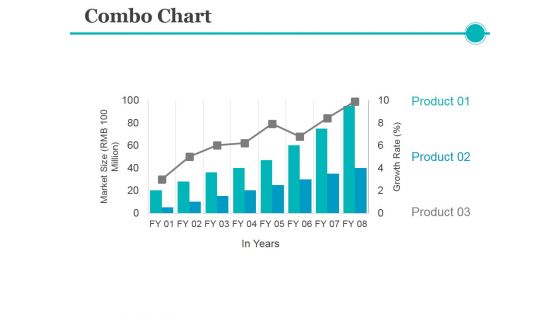
Combo Chart Ppt PowerPoint Presentation Pictures Layouts
This is a combo chart ppt powerpoint presentation pictures layouts. This is a eight stage process. The stages in this process are product, growth rate, market size, years.
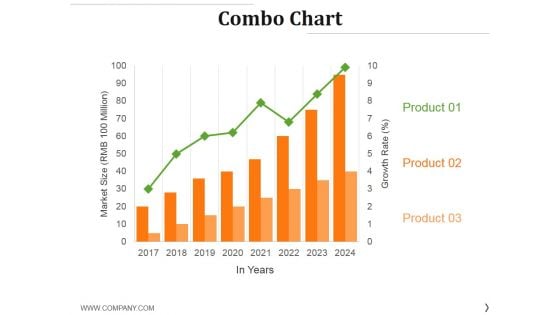
Combo Chart Ppt PowerPoint Presentation File Model
This is a combo chart ppt powerpoint presentation file model. This is a eight stage process. The stages in this process are product, year, market size, business, marketing.
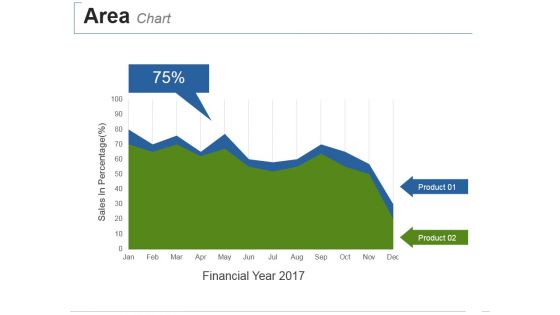
Area Chart Ppt PowerPoint Presentation Summary Deck
This is a area chart ppt powerpoint presentation summary deck. This is a two stage process. The stages in this process are sales in percentage, financial year.

Line Chart Ppt PowerPoint Presentation Pictures Maker
This is a line chart ppt powerpoint presentation pictures maker. This is a two stage process. The stages in this process are financial years, product, growth, success.
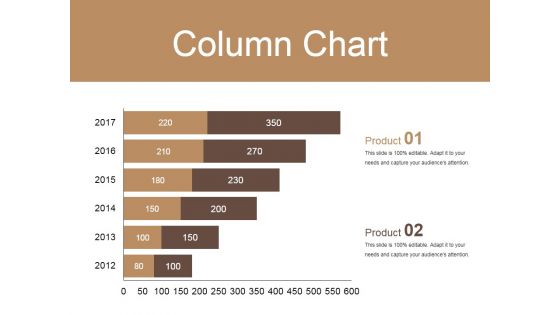
Column Chart Ppt PowerPoint Presentation Show Visuals
This is a column chart ppt powerpoint presentation show visuals. This is a two stage process. The stages in this process are product, year, success, step, business.

Column Chart Ppt PowerPoint Presentation Ideas Inspiration
This is a column chart ppt powerpoint presentation ideas inspiration. This is a five stage process. The stages in this process are graph, year, business, marketing, product.
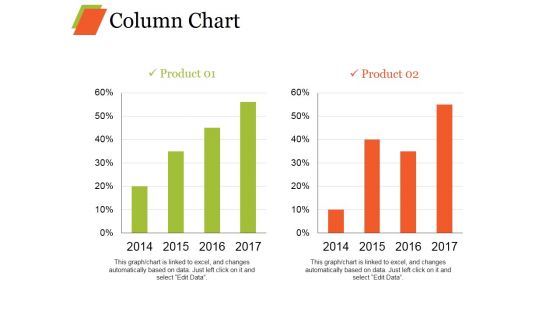
Column Chart Ppt PowerPoint Presentation Infographics Model
This is a column chart ppt powerpoint presentation infographics model. This is a two stage process. The stages in this process are bar graph, growth, product, percentage, year.
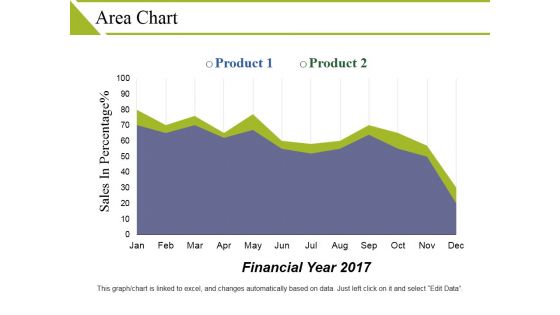
Area Chart Ppt PowerPoint Presentation Outline Objects
This is a area chart ppt powerpoint presentation outline objects. This is a two stage process. The stages in this process are product, sales in percentage, financial year.
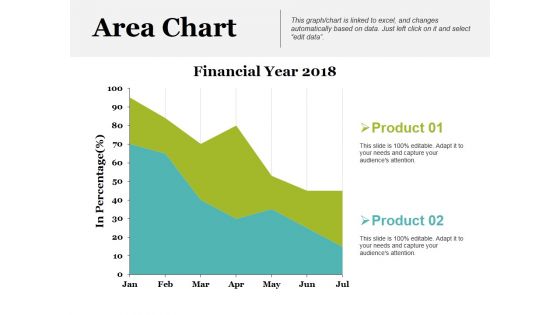
Area Chart Ppt PowerPoint Presentation Show Backgrounds
This is a area chart ppt powerpoint presentation show backgrounds. This is a two stage process. The stages in this process are financial year, product, in percentage.
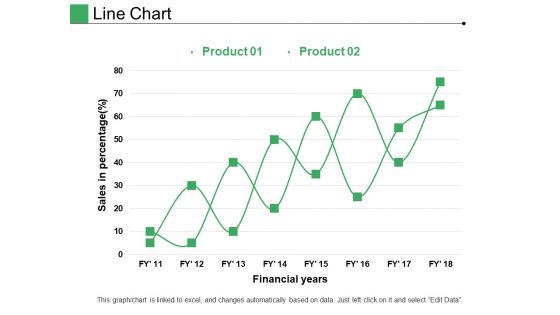
Line Chart Ppt PowerPoint Presentation Pictures Layout
This is a line chart ppt powerpoint presentation pictures layout. This is a two stage process. The stages in this process are product, financial years, sales in percentage.
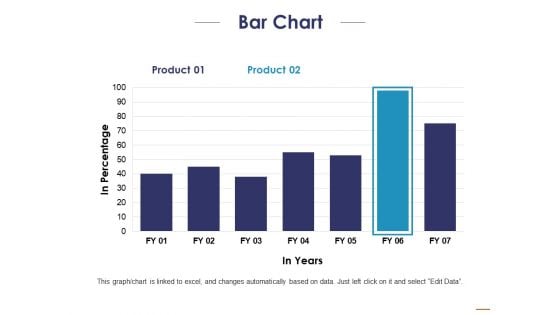
Bar Chart Ppt PowerPoint Presentation Portfolio Inspiration
This is a bar chart ppt powerpoint presentation portfolio inspiration. This is a two stage process. The stages in this process are product, in percentage, in years.
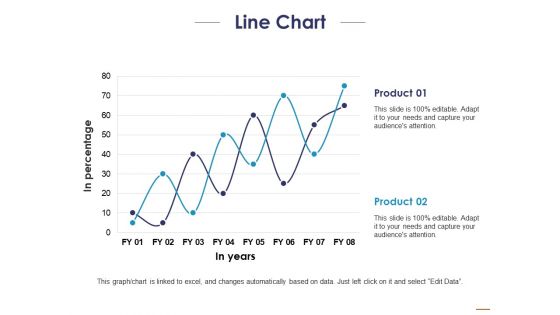
Line Chart Ppt PowerPoint Presentation Layouts Templates
This is a line chart ppt powerpoint presentation layouts templates. This is a two stage process. The stages in this process are product, in percentage, in years.
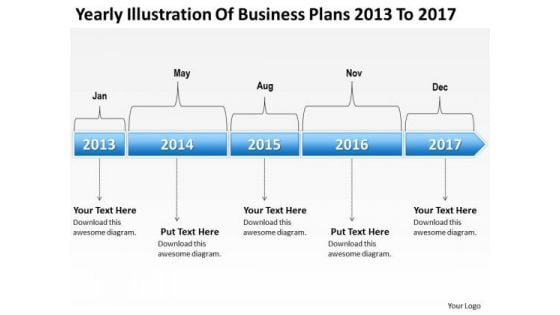
Massively Parallel Processing Plans 2013 To 2017 PowerPoint Templates Ppt Backgrounds For Slides
We present our massively parallel processing plans 2013 to 2017 PowerPoint templates PPT backgrounds for slides.Present our Business PowerPoint Templates because Our PowerPoint Templates and Slides will definately Enhance the stature of your presentation. Adorn the beauty of your thoughts with their colourful backgrounds. Download our Marketing PowerPoint Templates because you can Add colour to your speech with our PowerPoint Templates and Slides. Your presentation will leave your audience speechless. Download our Time Planning PowerPoint Templates because You can Double your output with our PowerPoint Templates and Slides. They make beating deadlines a piece of cake. Use our Shapes PowerPoint Templates because It can Bubble and burst with your ideas. Use our Success PowerPoint Templates because Our PowerPoint Templates and Slides are focused like a searchlight beam. They highlight your ideas for your target audience.Use these PowerPoint slides for presentations relating to 2013, 2014, 2015, April, August, Basic, Blue, Calendar, Classic, Date, Day, December, Design, Editable, February, Friday, Graphic, Grid, Holidays, Illustration, January, July, June, Layout, March, May, Monday, Month, Monthly, New, November, October, Planning, Red, Saturday, Schedule, Season, September, Simple, Sunday, Template, Thursday, Tuesday, Vector, Wednesday, Week, Weekend, Year. The prominent colors used in the PowerPoint template are Blue, White, Black. People tell us our massively parallel processing plans 2013 to 2017 PowerPoint templates PPT backgrounds for slides will make the presenter successul in his career/life. People tell us our 2015 PowerPoint templates and PPT Slides provide you with a vast range of viable options. Select the appropriate ones and just fill in your text. Presenters tell us our massively parallel processing plans 2013 to 2017 PowerPoint templates PPT backgrounds for slides will get their audience's attention. We assure you our Blue PowerPoint templates and PPT Slides are the best it can get when it comes to presenting. Presenters tell us our massively parallel processing plans 2013 to 2017 PowerPoint templates PPT backgrounds for slides will help you be quick off the draw. Just enter your specific text and see your points hit home. Professionals tell us our 2015 PowerPoint templates and PPT Slides are topically designed to provide an attractive backdrop to any subject. Give due attention to key features. Filter out the unnecessary with our Massively Parallel Processing Plans 2013 To 2017 PowerPoint Templates Ppt Backgrounds For Slides.
Column Chart Ppt PowerPoint Presentation Icon Graphics Pictures
This is a column chart ppt powerpoint presentation icon graphics pictures. This is a nine stage process. The stages in this process are product, growth, year, chart, management.
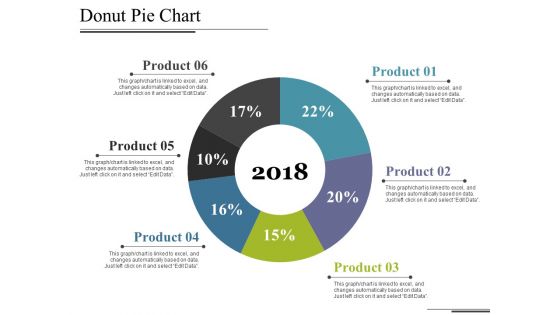
Donut Pie Chart Ppt PowerPoint Presentation Show Grid
This is a donut pie chart ppt powerpoint presentation show grid. This is a six stage process. The stages in this process are chart, years, percentage, business, management.

Line Chart Ppt PowerPoint Presentation Gallery Example Introduction
This is a line chart ppt powerpoint presentation portfolio shapes. This is a two stage process. The stages in this process are product, financial years, line chart.
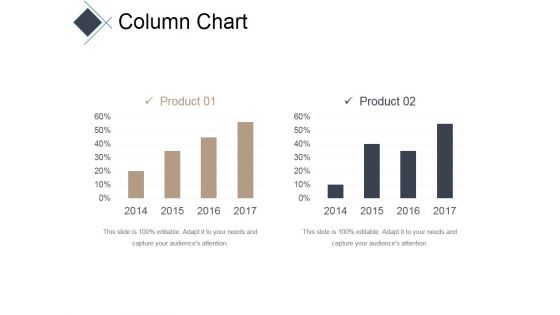
Column Chart Ppt PowerPoint Presentation Infographic Template Inspiration
This is a column chart ppt powerpoint presentation infographic template inspiration. This is a two stage process. The stages in this process are bar, years, business, marketing, success.
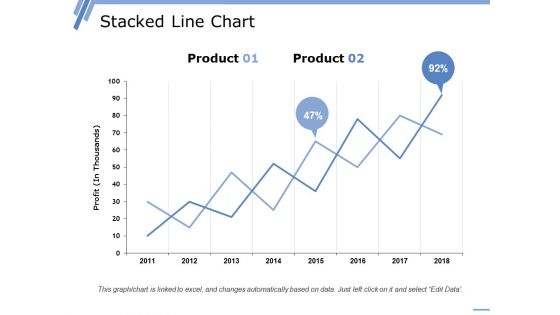
Stacked Line Chart Ppt PowerPoint Presentation Styles Graphics
This is a stacked line chart ppt powerpoint presentation styles graphics. This is a two stage process. The stages in this process are product, year, profit, percentage, growth.
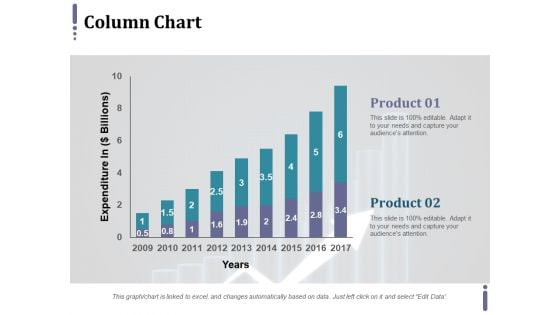
Column Chart Ppt PowerPoint Presentation Model Graphics Example
This is a column chart ppt powerpoint presentation model graphics example. This is a two stage process. The stages in this process are expenditure in, product, years.
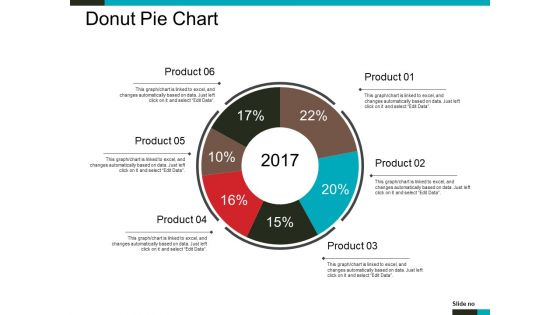
Donut Pie Chart Ppt PowerPoint Presentation Infographics Styles
This is a donut pie chart ppt powerpoint presentation infographics styles. This is a six stage process. The stages in this process are chart, percentage, years, business, management.
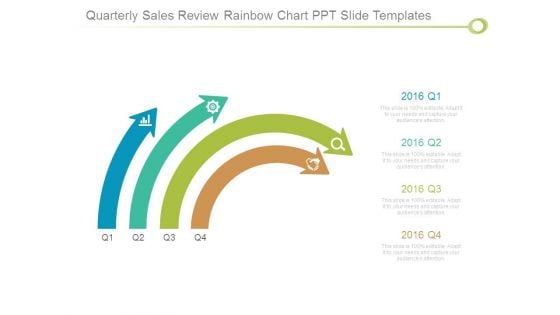
Quarterly Sales Review Rainbow Chart Ppt Slide Templates
This is a quarterly sales review rainbow chart ppt slide templates. This is a four stage process. The stages in this process are year, arrow, icons, strategy, business.
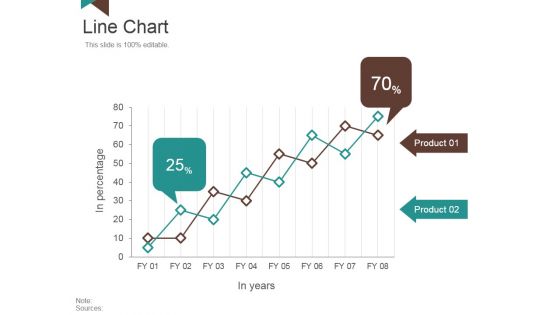
Line Chart Ppt PowerPoint Presentation Layouts Background Image
This is a line chart ppt powerpoint presentation layouts background image. This is a two stage process. The stages in this process are in percentage, in years, product.

Donut Pie Chart Ppt PowerPoint Presentation Infographics Images
This is a donut pie chart ppt powerpoint presentation infographics images. This is a seven stage process. The stages in this process are product, year, pie, process, business.
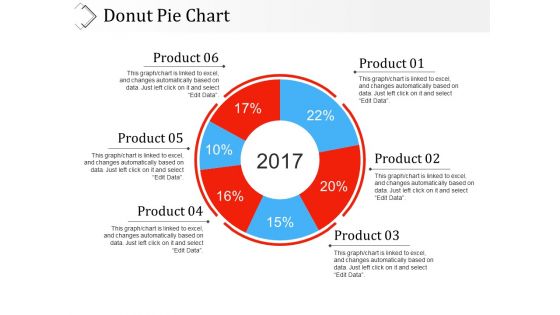
Donut Pie Chart Ppt PowerPoint Presentation Professional Slideshow
This is a donut pie chart ppt powerpoint presentation professional slideshow. This is a six stage process. The stages in this process are product, percentage, years, business, process.
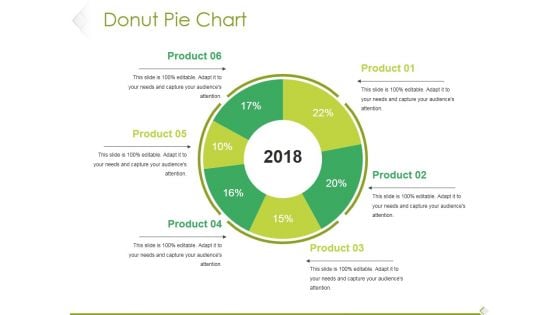
Donut Pie Chart Ppt PowerPoint Presentation Model Pictures
This is a donut pie chart ppt powerpoint presentation model pictures. This is a six stage process. The stages in this process are product, percentage, finance, year, business.
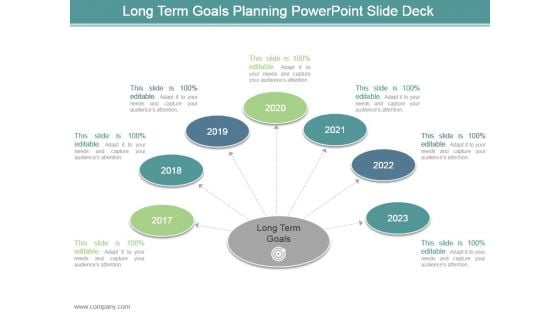
Long Term Goals Planning Powerpoint Slide Deck
This is a long term goals planning powerpoint slide deck. This is a seven stage process. The stages in this process are arrows, business, marketing, planning, years.
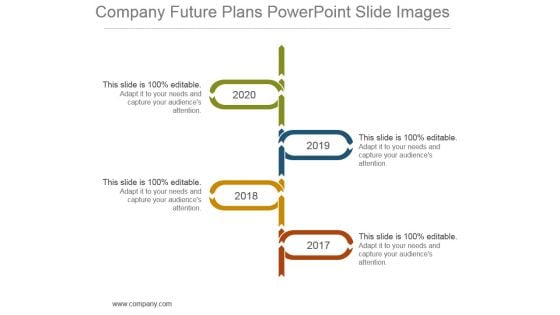
Company Future Plans Powerpoint Slide Images
This is a company future plans powerpoint slide images. This is a four stage process. The stages in this process are timeline, business, marketing, year, planning.
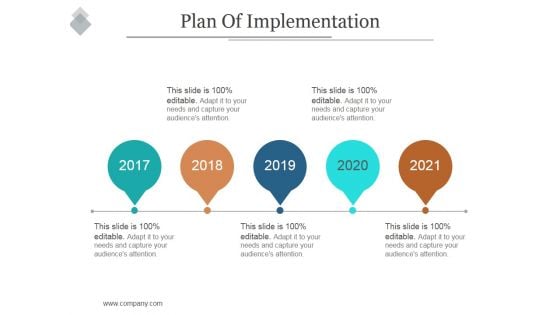
Plan Of Implementation Ppt PowerPoint Presentation Clipart
This is a plan of implementation ppt powerpoint presentation clipart. This is a five stage process. The stages in this process are business, timeline, years, business, planning.
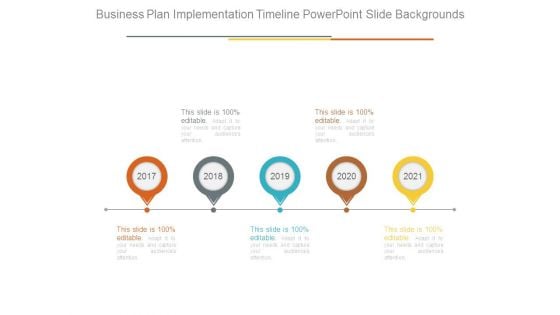
Business Plan Implementation Timeline Powerpoint Slide Backgrounds
This is a business plan implementation timeline powerpoint slide backgrounds. This is a five stage process. The stages in this process are timeline, years, future, business, marketing.
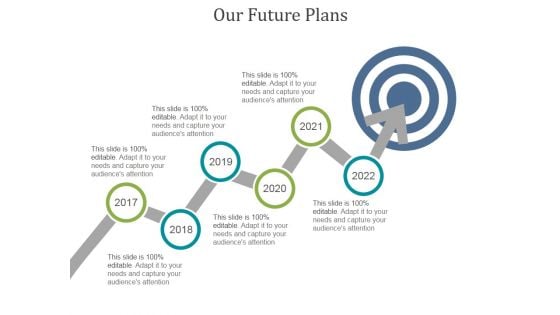
Our Future Plans Ppt PowerPoint Presentation Portfolio
This is a our future plans ppt powerpoint presentation portfolio. This is a six stage process. The stages in this process are business, years, growth, analysis, strategy, success.
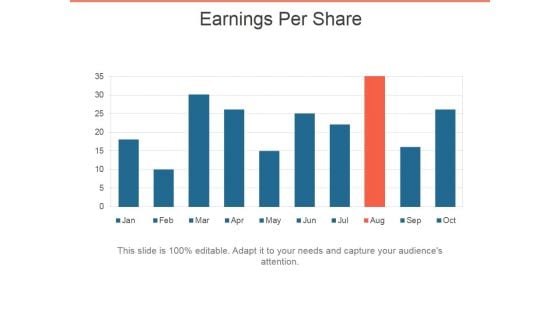
Earnings Per Share Ppt PowerPoint Presentation Layouts Ideas
This is a earnings per share ppt powerpoint presentation layouts ideas. This is a ten stage process. The stages in this process are business, years, planning, management, marketing.
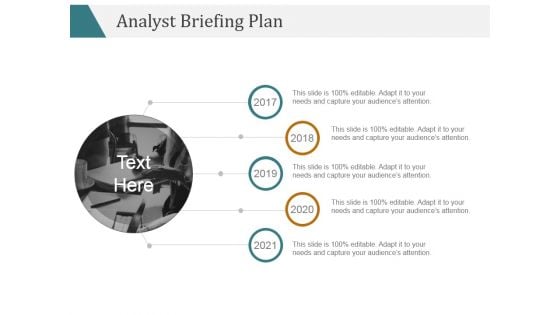
Analyst Briefing Plan Ppt PowerPoint Presentation Portfolio
This is a analyst briefing plan ppt powerpoint presentation portfolio. This is a five stage process. The stages in this process are year, growth, business, planning, success.
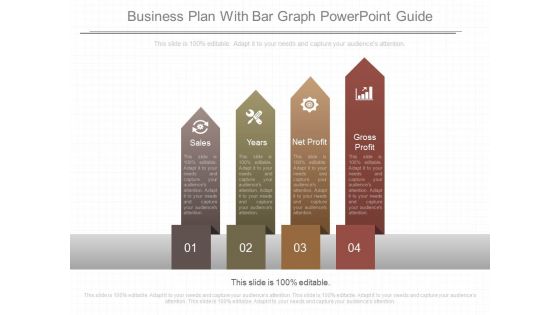
Business Plan With Bar Graph Powerpoint Guide
This is a business plan with bar graph powerpoint guide. This is a four stage process. The stages in this process are sales, years, net profit, gross profit.
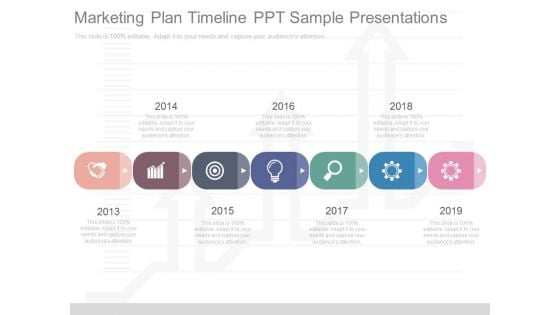
Marketing Plan Timeline Ppt Sample Presentations
This is a marketing plan timeline ppt sample presentations. This is a seven stage process. The stages in this process are year, growth, business, marketing, success.
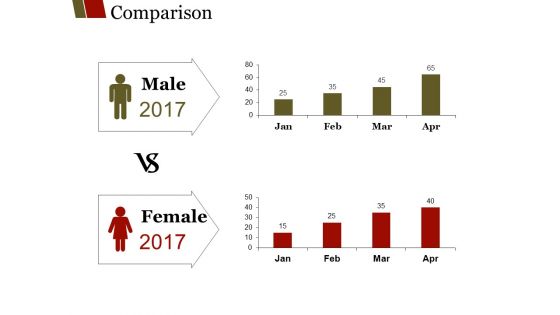
Comparison Ppt PowerPoint Presentation Outline Guidelines
This is a comparison ppt powerpoint presentation outline guidelines. This is a two stage process. The stages in this process are male, years, business, female, marketing.
Bar Graph Ppt PowerPoint Presentation Icon Inspiration
This is a bar graph ppt powerpoint presentation icon inspiration. This is a five stage process. The stages in this process are bar graph, financials, years, planning, business.
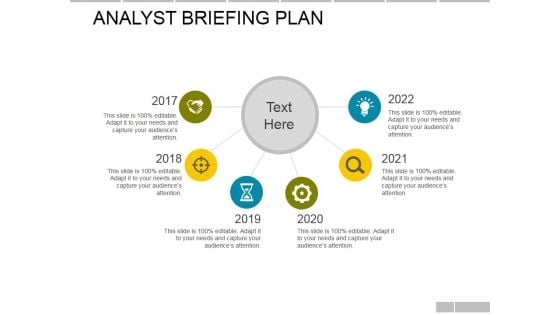
Analyst Briefing Plan Ppt PowerPoint Presentation Infographics Professional
This is a analyst briefing plan ppt powerpoint presentation infographics professional. This is a six stage process. The stages in this process are business, marketing, strategy, years, timeline.
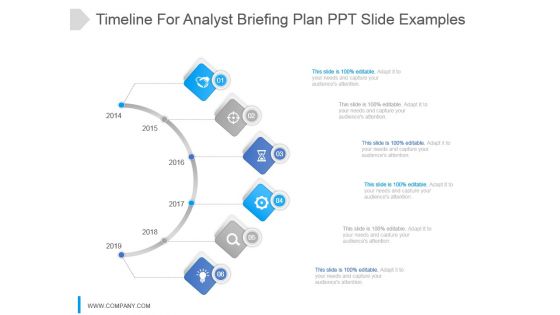
Timeline For Analyst Briefing Plan Ppt Slide Examples
This is a timeline for analyst briefing plan ppt slide examples. This is a six stage process. The stages in this process are icons, business, years, timeline, analysis.
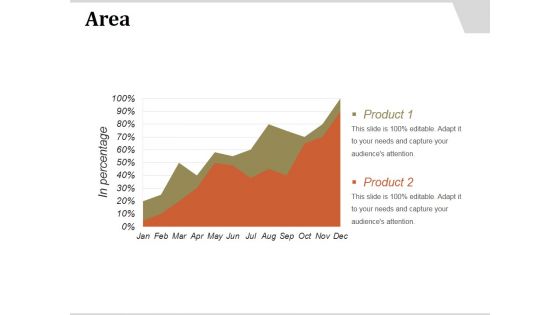
Area Ppt PowerPoint Presentation Show
This is a area ppt powerpoint presentation show. This is a two stage process. The stages in this process are area, bar graph, growth, years, business.


 Continue with Email

 Home
Home


