Yearly Schedule
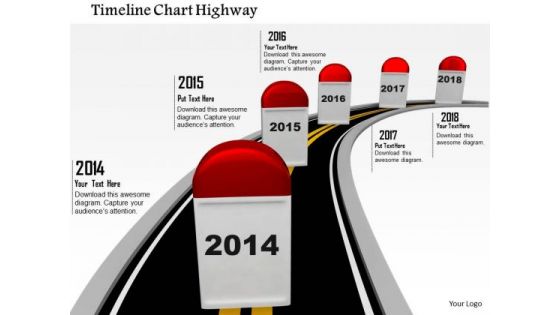
Stock Photo Timeline Chart Highway PowerPoint Slide
This image displays road with multiple milestones. This image contains continuous road with milestones in order to display timeline and yearly performance. This image may be used to present vision of a desired destination and the best road to take to reach that goal.
Linear Steps Timeline Chart And Icons Powerpoint Slides
This PowerPoint template graphics of linear timeline steps. Download this PPT chart for yearly business performance analysis. This PowerPoint slide is of great help in the business sector to make realistic presentations and provides effective way of presenting your newer thoughts.
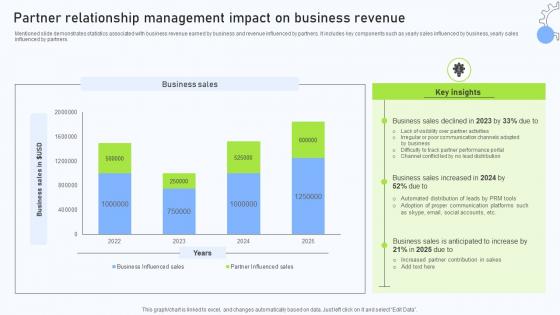
Relationship Management Automation Partner Relationship Management Impact
Mentioned slide demonstrates statistics associated with business revenue earned by business and revenue influenced by partners. It includes key components such as yearly sales influenced by business, yearly sales influenced by partners. Presenting this PowerPoint presentation, titled Relationship Management Automation Partner Relationship Management Impact, with topics curated by our researchers after extensive research. This editable presentation is available for immediate download and provides attractive features when used. Download now and captivate your audience. Presenting this Relationship Management Automation Partner Relationship Management Impact. Our researchers have carefully researched and created these slides with all aspects taken into consideration. This is a completely customizable Relationship Management Automation Partner Relationship Management Impact that is available for immediate downloading. Download now and make an impact on your audience. Highlight the attractive features available with our PPTs. Mentioned slide demonstrates statistics associated with business revenue earned by business and revenue influenced by partners. It includes key components such as yearly sales influenced by business, yearly sales influenced by partners.
IT Cost Assessment With KPI Dashboard To Gain Competitive Advantage Icons PDF
Showcasing this set of slides titled IT Cost Assessment With KPI Dashboard To Gain Competitive Advantage Icons PDF. The topics addressed in these templates are Actual Cost, Yearly Analysis, Breakdown Chart. All the content presented in this PPT design is completely editable. Download it and make adjustments in color, background, font etc. as per your unique business setting.
Dashboard Showing Workers Effectiveness And Absenteeism Report Ppt PowerPoint Presentation Icon Gallery PDF
Pitch your topic with ease and precision using this dashboard showing workers effectiveness and absenteeism report ppt powerpoint presentation icon gallery pdf. This layout presents information on avg yearly absenteeism, ole by department, overall labor effectiveness. It is also available for immediate download and adjustment. So, changes can be made in the color, design, graphics or any other component to create a unique layout.
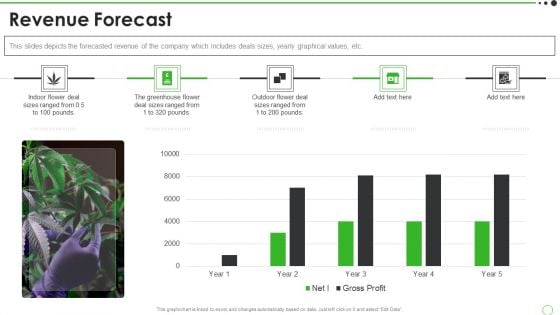
Cannabis Venture Capital Funding Revenue Forecast Topics PDF
This slides depicts the forecasted revenue of the company which includes deals sizes, yearly graphical values, etc. Deliver an awe inspiring pitch with this creative cannabis venture capital funding revenue forecast topics pdf bundle. Topics like revenue forecast can be discussed with this completely editable template. It is available for immediate download depending on the needs and requirements of the user.
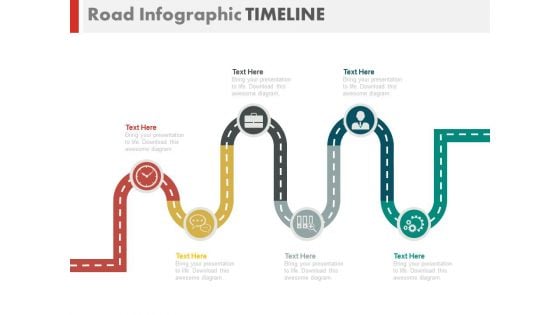
Zigzag Business Roadmap Infographics Powerpoint Slides
This timeline slide design can be used to display yearly business growth. It contains zigzag business roadmap with icons. This timeline template can be used in presentations where you need to display a roadmap or it may be used for business target analysis.
Zigzag Timeline With Business Icons Powerpoint Slides
This timeline slide design can be used to display yearly business growth. It contains zigzag business roadmap with icons. This timeline template can be used in presentations where you need to display a roadmap or it may be used for business target analysis.
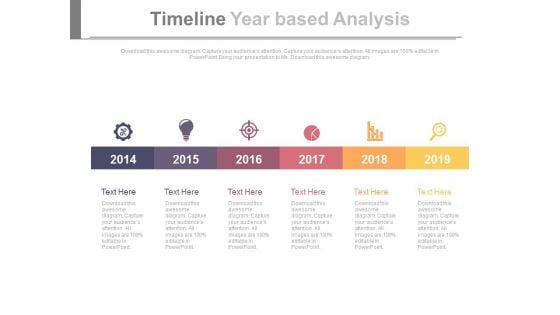
Six Steps Timeline For Business Research And Analysis Powerpoint Slides
This timeline slide design can be used to display yearly business growth. It contains linear steps with icons. This timeline template can be used in presentations where you need to display research and analysis or it may be used for business target analysis.
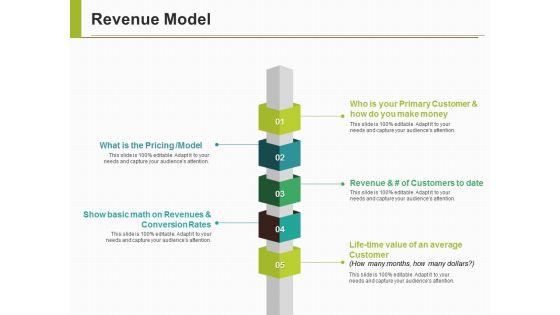
Revenue Model Template Ppt PowerPoint Presentation Infographic Template Inspiration
This is a revenue model template ppt powerpoint presentation infographic template inspiration. This is a six stage process. The stages in this process are pricing, estimated yearly revenue, expected arpu, recurring revenue frequency, expected conversion rate to get a paid client.
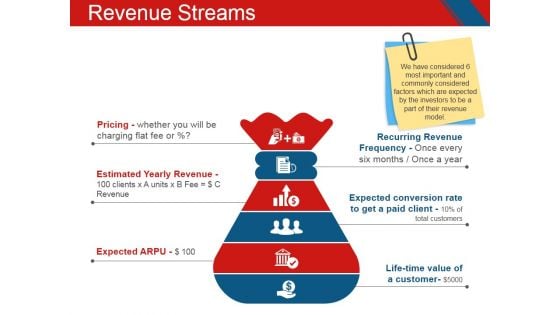
Revenue Streams Template 2 Ppt PowerPoint Presentation File Graphic Images
This is a revenue streams template 2 ppt powerpoint presentation file graphic images. This is a six stage process. The stages in this process are pricing, estimated yearly revenue, expected arpu, recurring revenue frequency, expected conversion rate to get a paid client, life time value of a customer.

Engineering Products And Services Demand Forecast Engineering Company Financial Analysis Report Template PDF
The following slide highlights the yearly demand and forecast of products and services provided by the engineering company. It shows the percentage revenue change from last year and the forecast for next year. This modern and well-arranged Engineering Products And Services Demand Forecast Engineering Company Financial Analysis Report Template PDF provides lots of creative possibilities. It is very simple to customize and edit with the Powerpoint Software. Just drag and drop your pictures into the shapes. All facets of this template can be edited with Powerpoint no extra software is necessary. Add your own material, put your images in the places assigned for them, adjust the colors, and then you can show your slides to the world, with an animated slide included.
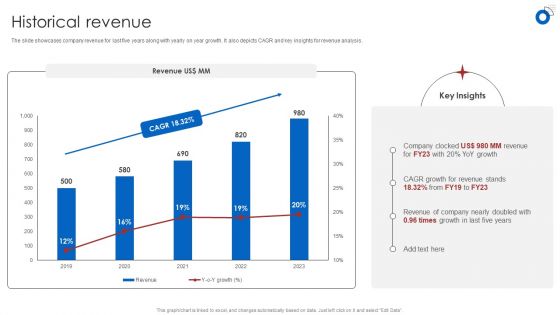
Insurance Business Financial Analysis Historical Revenue Ppt Styles Graphics PDF
The slide showcases company revenue for last five years along with yearly on year growth. It also depicts CAGR and key insights for revenue analysis. Crafting an eye-catching presentation has never been more straightforward. Let your presentation shine with this tasteful yet straightforward Insurance Business Financial Analysis Historical Revenue Ppt Styles Graphics PDF template. It offers a minimalistic and classy look that is great for making a statement. The colors have been employed intelligently to add a bit of playfulness while still remaining professional. Construct the ideal Insurance Business Financial Analysis Historical Revenue Ppt Styles Graphics PDF that effortlessly grabs the attention of your audience Begin now and be certain to wow your customers.
Statistics Showing Annual Sales Of Industry Leader Effective Startup Promotion Plan Icons Pdf
The following slide showcases graphical representation of market leader yearly sales. The slide covers detailed information about 4 years annual sales along with compound annual growth rate CAGR. Do you have to make sure that everyone on your team knows about any specific topic I yes, then you should give Statistics Showing Annual Sales Of Industry Leader Effective Startup Promotion Plan Icons Pdf a try. Our experts have put a lot of knowledge and effort into creating this impeccable Statistics Showing Annual Sales Of Industry Leader Effective Startup Promotion Plan Icons Pdf. You can use this template for your upcoming presentations, as the slides are perfect to represent even the tiniest detail. You can download these templates from the Slidegeeks website and these are easy to edit. So grab these today. The following slide showcases graphical representation of market leader yearly sales. The slide covers detailed information about 4 years annual sales along with compound annual growth rate CAGR.

Operating Profit Loss Wireless Communication Services Provider Company Profile CP SS V
Mentioned slide provides information about operating profits earned by Apple in last five years. It includes key elements such as yearly operating profit, operating profit margin, and key takeaways.Are you searching for a Operating Profit Loss Wireless Communication Services Provider Company Profile CP SS V that is uncluttered, straightforward, and original Its easy to edit, and you can change the colors to suit your personal or business branding. For a presentation that expresses how much effort you have put in, this template is ideal With all of its features, including tables, diagrams, statistics, and lists, its perfect for a business plan presentation. Make your ideas more appealing with these professional slides. Download Operating Profit Loss Wireless Communication Services Provider Company Profile CP SS V from Slidegeeks today. Mentioned slide provides information about operating profits earned by Apple in last five years. It includes key elements such as yearly operating profit, operating profit margin, and key takeaways.
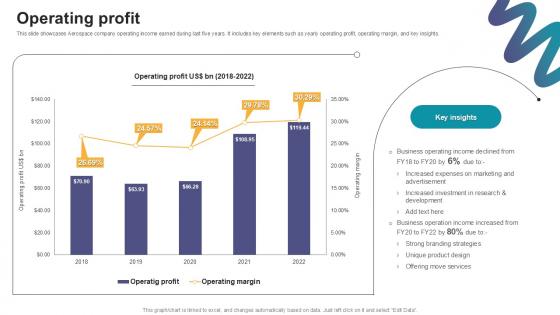
Operating Profit Digital Marketings Strategies PPT Slide CP SS V
This slide showcases Aerospace company operating income earned during last five years. It includes key elements such as yearly operating profit, operating margin, and key insights. Are you searching for a Operating Profit Digital Marketings Strategies PPT Slide CP SS V that is uncluttered, straightforward, and original Its easy to edit, and you can change the colors to suit your personal or business branding. For a presentation that expresses how much effort you have put in, this template is ideal With all of its features, including tables, diagrams, statistics, and lists, its perfect for a business plan presentation. Make your ideas more appealing with these professional slides. Download Operating Profit Digital Marketings Strategies PPT Slide CP SS V from Slidegeeks today. This slide showcases Aerospace company operating income earned during last five years. It includes key elements such as yearly operating profit, operating margin, and key insights.

Operating Profit And Margin Consumer Electronics Company Profile CP SS V
Mentioned slide provides information about Apple operating income earned during last five years. It includes key elements such as yearly operating profit, operating margin, and key insights.Whether you have daily or monthly meetings, a brilliant presentation is necessary. Operating Profit And Margin Consumer Electronics Company Profile CP SS V can be your best option for delivering a presentation. Represent everything in detail using Operating Profit And Margin Consumer Electronics Company Profile CP SS V and make yourself stand out in meetings. The template is versatile and follows a structure that will cater to your requirements. All the templates prepared by Slidegeeks are easy to download and edit. Our research experts have taken care of the corporate themes as well. So, give it a try and see the results. Mentioned slide provides information about Apple operating income earned during last five years. It includes key elements such as yearly operating profit, operating margin, and key insights.
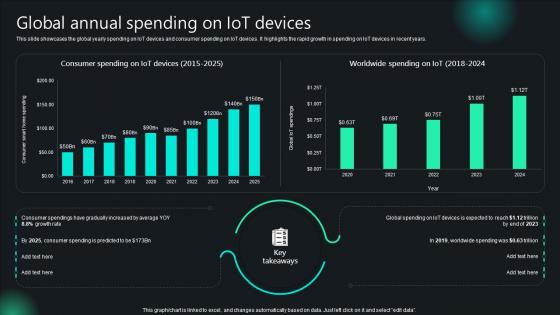
Unlocking Potential IoTs Application Global Annual Spending On IoT Devices IoT SS V
This slide showcases the global yearly spending on IoT devices and consumer spending on IoT devices. It highlights the rapid growth in spending on IoT devices in recent years. Welcome to our selection of the Unlocking Potential IoTs Application Global Annual Spending On IoT Devices IoT SS V. These are designed to help you showcase your creativity and bring your sphere to life. Planning and Innovation are essential for any business that is just starting out. This collection contains the designs that you need for your everyday presentations. All of our PowerPoints are 100Percent editable, so you can customize them to suit your needs. This multi-purpose template can be used in various situations. Grab these presentation templates today. This slide showcases the global yearly spending on IoT devices and consumer spending on IoT devices. It highlights the rapid growth in spending on IoT devices in recent years.
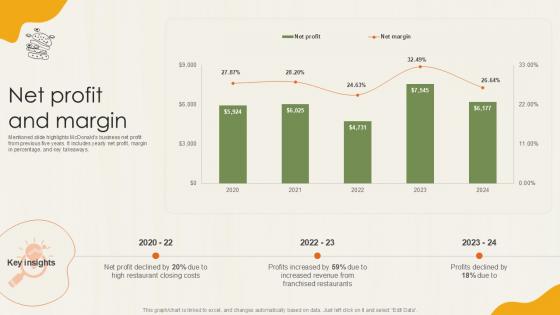
Net Profit And Margin Food Retailer Company Profile Ppt Sample CP SS V
Mentioned slide highlights McDonalds business net profit from previous five years. It includes yearly net profit, margin in percentage, and key takeaways. Welcome to our selection of the Net Profit And Margin Food Retailer Company Profile Ppt Sample CP SS V These are designed to help you showcase your creativity and bring your sphere to life. Planning and Innovation are essential for any business that is just starting out. This collection contains the designs that you need for your everyday presentations. All of our PowerPoints are 100Percent editable, so you can customize them to suit your needs. This multi-purpose template can be used in various situations. Grab these presentation templates today. Mentioned slide highlights McDonalds business net profit from previous five years. It includes yearly net profit, margin in percentage, and key takeaways.
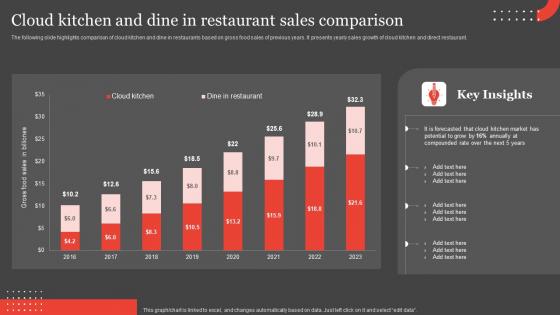
International Food Delivery Market Cloud Kitchen And Dine In Restaurant Sales Introduction Pdf
The following slide highlights comparison of cloud kitchen and dine in restaurants based on gross food sales of previous years. It presents yearly sales growth of cloud kitchen and direct restaurant. From laying roadmaps to briefing everything in detail, our templates are perfect for you. You can set the stage with your presentation slides. All you have to do is download these easy-to-edit and customizable templates. International Food Delivery Market Cloud Kitchen And Dine In Restaurant Sales Introduction Pdf will help you deliver an outstanding performance that everyone would remember and praise you for. Do download this presentation today. The following slide highlights comparison of cloud kitchen and dine in restaurants based on gross food sales of previous years. It presents yearly sales growth of cloud kitchen and direct restaurant.
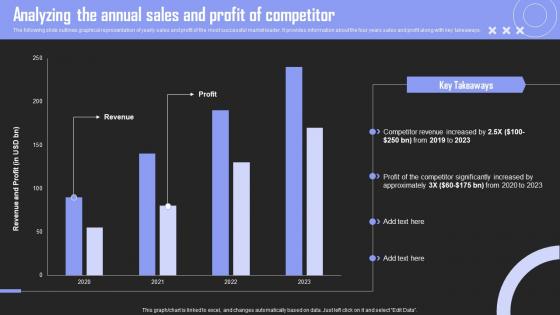
Analyzing The Annual Brand Building Techniques To Gain Competitive Edge Structure Pdf
The following slide outlines graphical representation of yearly sales and profit of the most successful market leader. It provides information about the four years sales and profit along with key takeaways. Want to ace your presentation in front of a live audience Our Analyzing The Annual Brand Building Techniques To Gain Competitive Edge Structure Pdf can help you do that by engaging all the users towards you. Slidegeeks experts have put their efforts and expertise into creating these impeccable powerpoint presentations so that you can communicate your ideas clearly. Moreover, all the templates are customizable, and easy to edit and downloadable. Use these for both personal and commercial use. The following slide outlines graphical representation of yearly sales and profit of the most successful market leader. It provides information about the four years sales and profit along with key takeaways.
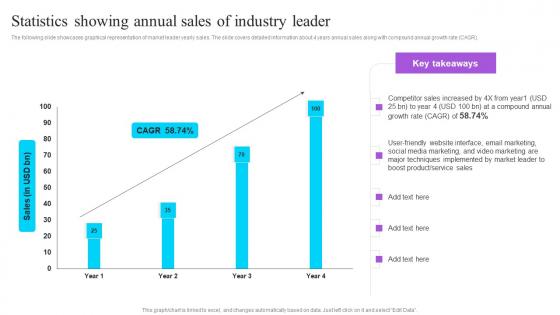
Statistics Showing Annual Sales Of Industry Leader Effective GTM Techniques Formats PDF
The following slide showcases graphical representation of market leader yearly sales. The slide covers detailed information about 4 years annual sales along with compound annual growth rate CAGR. Do you have to make sure that everyone on your team knows about any specific topic I yes, then you should give Statistics Showing Annual Sales Of Industry Leader Effective GTM Techniques Formats PDF a try. Our experts have put a lot of knowledge and effort into creating this impeccable Statistics Showing Annual Sales Of Industry Leader Effective GTM Techniques Formats PDF. You can use this template for your upcoming presentations, as the slides are perfect to represent even the tiniest detail. You can download these templates from the Slidegeeks website and these are easy to edit. So grab these today The following slide showcases graphical representation of market leader yearly sales. The slide covers detailed information about 4 years annual sales along with compound annual growth rate CAGR.
Financial Projections Value Based Investor Financing Pitch Deck Icons Pdf
The following slide outlines projected yearly growth of our company based on past performance. Information covered in this slide is related to annual sales of company for next four years. Do you have an important presentation coming up Are you looking for something that will make your presentation stand out from the rest Look no further than Financial Projections Value Based Investor Financing Pitch Deck Icons Pdf. With our professional designs, you can trust that your presentation will pop and make delivering it a smooth process. And with Slidegeeks, you can trust that your presentation will be unique and memorable. So why wait Grab Financial Projections Value Based Investor Financing Pitch Deck Icons Pdf today and make your presentation stand out from the rest The following slide outlines projected yearly growth of our company based on past performance. Information covered in this slide is related to annual sales of company for next four years.

Cloud Kitchen And Dine In Restaurant Sales Comparison Global Virtual Restaurant Infographics Pdf
The following slide highlights comparison of cloud kitchen and dine in restaurants based on gross food sales of previous years. It presents yearly sales growth of cloud kitchen and direct restaurant. Find highly impressive Cloud Kitchen And Dine In Restaurant Sales Comparison Global Virtual Restaurant Infographics Pdf on Slidegeeks to deliver a meaningful presentation. You can save an ample amount of time using these presentation templates. No need to worry to prepare everything from scratch because Slidegeeks experts have already done a huge research and work for you. You need to download Cloud Kitchen And Dine In Restaurant Sales Comparison Global Virtual Restaurant Infographics Pdf for your upcoming presentation. All the presentation templates are 100 percent editable and you can change the color and personalize the content accordingly. Download now. The following slide highlights comparison of cloud kitchen and dine in restaurants based on gross food sales of previous years. It presents yearly sales growth of cloud kitchen and direct restaurant.
Global Robotic Process Automation In Life Science Industry Icons Pdf
This slide provides information about the robotic process automation implementation market size of the life science industry in different years. It includes yearly earnings and changing growth rate. Pitch your topic with ease and precision using this Global Robotic Process Automation In Life Science Industry Icons Pdf. This layout presents information on Global Robotic Process Automation In Life Science Industry. It is also available for immediate download and adjustment. So, changes can be made in the color, design, graphics or any other component to create a unique layout. This slide provides information about the robotic process automation implementation market size of the life science industry in different years. It includes yearly earnings and changing growth rate.
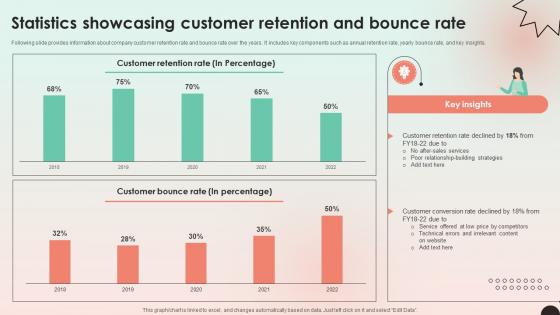
Web Consulting Business Performance Statistics Showcasing Customer Retention
Following slide provides information about company customer retention rate and bounce rate over the years. It includes key components such as annual retention rate, yearly bounce rate, and key insights. Find highly impressive Web Consulting Business Performance Statistics Showcasing Customer Retention on Slidegeeks to deliver a meaningful presentation. You can save an ample amount of time using these presentation templates. No need to worry to prepare everything from scratch because Slidegeeks experts have already done a huge research and work for you. You need to download Web Consulting Business Performance Statistics Showcasing Customer Retention for your upcoming presentation. All the presentation templates are 100 percent editable and you can change the color and personalize the content accordingly. Download now Following slide provides information about company customer retention rate and bounce rate over the years. It includes key components such as annual retention rate, yearly bounce rate, and key insights.
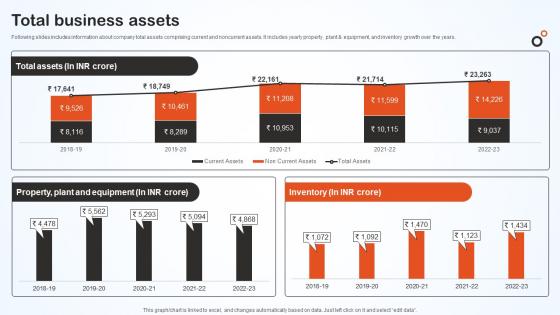
Total Business Assets Hero Bike Company Profile CP SS V
Following slides includes information about company total assets comprising current and noncurrent assets. It includes yearly property, plant and equipment, and inventory growth over the years. Present like a pro with Total Business Assets Hero Bike Company Profile CP SS V. Create beautiful presentations together with your team, using our easy-to-use presentation slides. Share your ideas in real-time and make changes on the fly by downloading our templates. So whether you are in the office, on the go, or in a remote location, you can stay in sync with your team and present your ideas with confidence. With Slidegeeks presentation got a whole lot easier. Grab these presentations today. Following slides includes information about company total assets comprising current and noncurrent assets. It includes yearly property, plant and equipment, and inventory growth over the years.
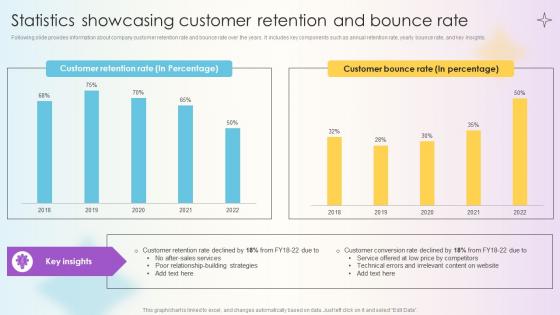
Managing Technical And Non Technical Statistics Showcasing Customer Retention
Following slide provides information about company customer retention rate and bounce rate over the years. It includes key components such as annual retention rate, yearly bounce rate, and key insights. If your project calls for a presentation, then Slidegeeks is your go-to partner because we have professionally designed, easy-to-edit templates that are perfect for any presentation. After downloading, you can easily edit Managing Technical And Non Technical Statistics Showcasing Customer Retention and make the changes accordingly. You can rearrange slides or fill them with different images. Check out all the handy templates Following slide provides information about company customer retention rate and bounce rate over the years. It includes key components such as annual retention rate, yearly bounce rate, and key insights.
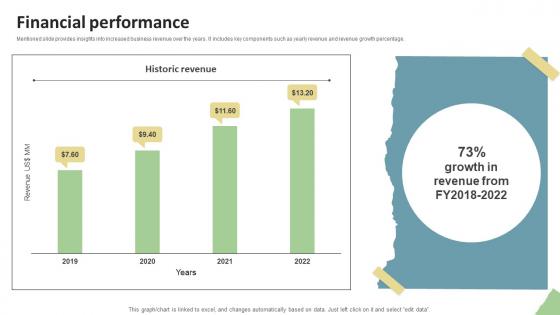
Financial Performance Education Platform Investor Funding Elevator Pitch Deck
Mentioned slide provides insights into increased business revenue over the years. It includes key components such as yearly revenue and revenue growth percentage. Present like a pro with Financial Performance Education Platform Investor Funding Elevator Pitch Deck. Create beautiful presentations together with your team, using our easy-to-use presentation slides. Share your ideas in real-time and make changes on the fly by downloading our templates. So whether you are in the office, on the go, or in a remote location, you can stay in sync with your team and present your ideas with confidence. With Slidegeeks presentation got a whole lot easier. Grab these presentations today. Mentioned slide provides insights into increased business revenue over the years. It includes key components such as yearly revenue and revenue growth percentage.
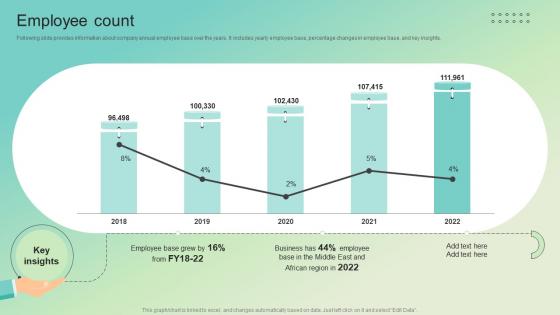
Employee Count Enterprise Software Solution Providing Company Profile CP SS V
Following slide provides information about company annual employee base over the years. It includes yearly employee base, percentage changes in employee base, and key insights.Formulating a presentation can take up a lot of effort and time, so the content and message should always be the primary focus. The visuals of the PowerPoint can enhance the presenters message, so our Employee Count Enterprise Software Solution Providing Company Profile CP SS V was created to help save time. Instead of worrying about the design, the presenter can concentrate on the message while our designers work on creating the ideal templates for whatever situation is needed. Slidegeeks has experts for everything from amazing designs to valuable content, we have put everything into Employee Count Enterprise Software Solution Providing Company Profile CP SS V. Following slide provides information about company annual employee base over the years. It includes yearly employee base, percentage changes in employee base, and key insights.
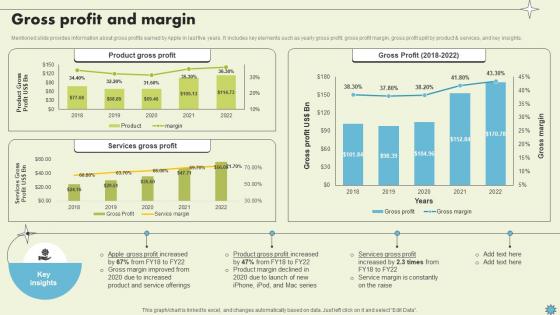
Gross Profit And Margin Consumer Electronics Company Profile CP SS V
Mentioned slide provides information about gross profits earned by Apple in last five years. It includes key elements such as yearly gross profit, gross profit margin, gross profit split by product and services, and key insights.Take your projects to the next level with our ultimate collection of Gross Profit And Margin Consumer Electronics Company Profile CP SS V. Slidegeeks has designed a range of layouts that are perfect for representing task or activity duration, keeping track of all your deadlines at a glance. Tailor these designs to your exact needs and give them a truly corporate look with your own brand colors they will make your projects stand out from the rest Mentioned slide provides information about gross profits earned by Apple in last five years. It includes key elements such as yearly gross profit, gross profit margin, gross profit split by product and services, and key insights.
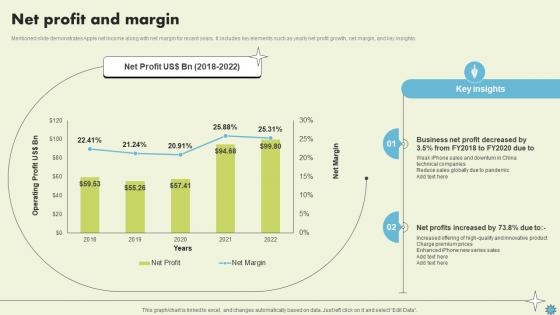
Net Profit And Margin Consumer Electronics Company Profile CP SS V
Mentioned slide demonstrates Apple net income along with net margin for recent years. It includes key elements such as yearly net profit growth, net margin, and key insights.Slidegeeks is here to make your presentations a breeze with Net Profit And Margin Consumer Electronics Company Profile CP SS V With our easy-to-use and customizable templates, you can focus on delivering your ideas rather than worrying about formatting. With a variety of designs to choose from, you are sure to find one that suits your needs. And with animations and unique photos, illustrations, and fonts, you can make your presentation pop. So whether you are giving a sales pitch or presenting to the board, make sure to check out Slidegeeks first Mentioned slide demonstrates Apple net income along with net margin for recent years. It includes key elements such as yearly net profit growth, net margin, and key insights.
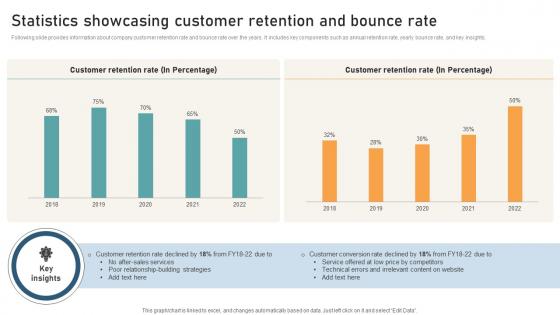
Comprehensive Guide For Website Statistics Showcasing Customer Retention And Bounce
Following slide provides information about company customer retention rate and bounce rate over the years. It includes key components such as annual retention rate, yearly bounce rate, and key insights. If your project calls for a presentation, then Slidegeeks is your go-to partner because we have professionally designed, easy-to-edit templates that are perfect for any presentation. After downloading, you can easily edit Comprehensive Guide For Website Statistics Showcasing Customer Retention And Bounce and make the changes accordingly. You can rearrange slides or fill them with different images. Check out all the handy templates Following slide provides information about company customer retention rate and bounce rate over the years. It includes key components such as annual retention rate, yearly bounce rate, and key insights.
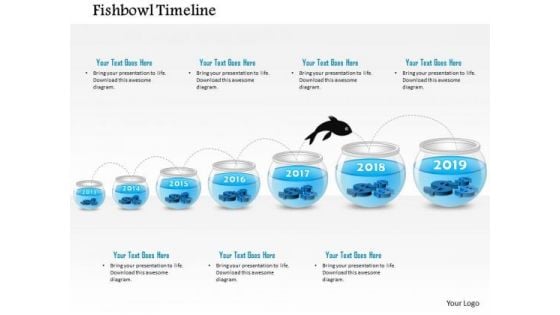
Business Diagram Seven Staged Fish Bowl Diagram Presentation Template
This business slide displays fish bowl diagram with 2013 and 2019 year numbers. This diagram depicts fish moving from year 2017 to year 2018. Use this diagram to build exclusive presentation for your viewers.
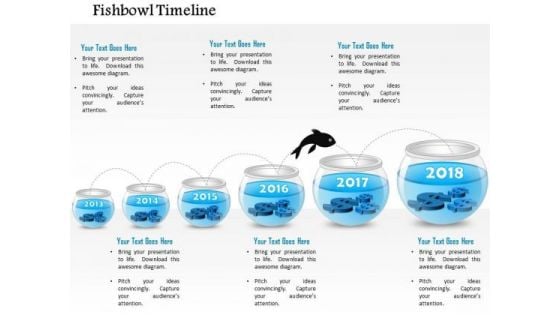
Business Diagram Six Staged Fish Bowl Diagram Presentation Template
This business slide displays fish bowl diagram with 2016 and 2017 year numbers. This diagram depicts fish moving from year 2017 to year 2018. Use this diagram to build exclusive presentation for your viewers.
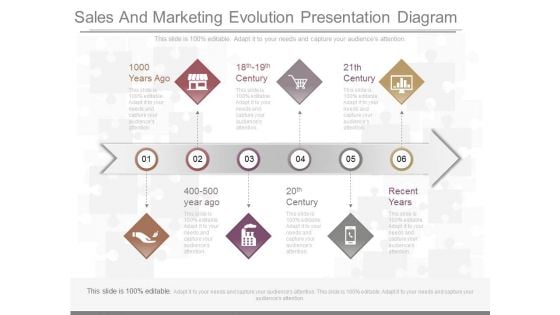
Sales And Marketing Evolution Presentation Diagram
This is a sales and marketing evolution presentation diagram. This is a six stage process. The stages in this process are 1000 years ago, 400-500 year ago, 18th-19th century, 20th century, 21th century, recent years.
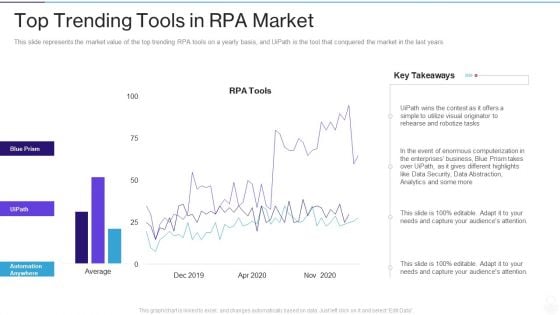
RPA IT Top Trending Tools In RPA Market Ppt Slides Show PDF
This slide represents the market value of the top trending RPA tools on a yearly basis, and UiPath is the tool that conquered the market in the last years. Deliver an awe inspiring pitch with this creative rpa it top trending tools in rpa market ppt slides show pdf bundle. Topics like data security, analytics, business, data abstraction, utilize visual can be discussed with this completely editable template. It is available for immediate download depending on the needs and requirements of the user.
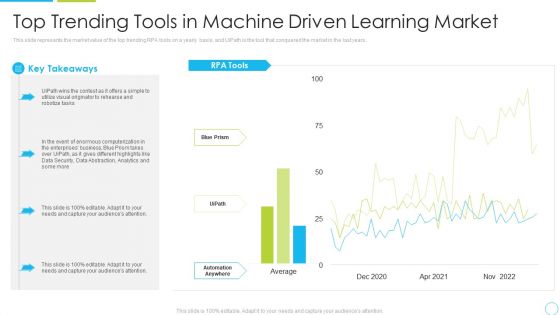
Top Trending Tools In Machine Driven Learning Market Ppt Pictures Example PDF
This slide represents the market value of the top trending RPA tools on a yearly basis, and UiPath is the tool that conquered the market in the last years. Deliver an awe inspiring pitch with this creative top trending tools in machine driven learning market ppt pictures example pdf bundle. Topics like analytics, enterprises, data security can be discussed with this completely editable template. It is available for immediate download depending on the needs and requirements of the user.
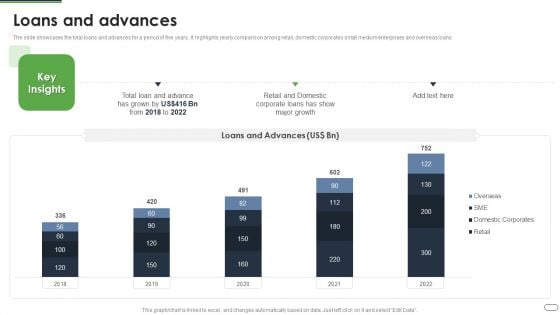
Financial Solutions Company Profile Loans And Advances Guidelines PDF
The slide showcases the total loans and advances for a period of five years. It highlights yearly comparison among retail, domestic corporates small medium enterprises and overseas loans Deliver an awe inspiring pitch with this creative Financial Solutions Company Profile Loans And Advances Guidelines PDF bundle. Topics like Loan Advance, Retail Domestic, Corporate Loans can be discussed with this completely editable template. It is available for immediate download depending on the needs and requirements of the user.
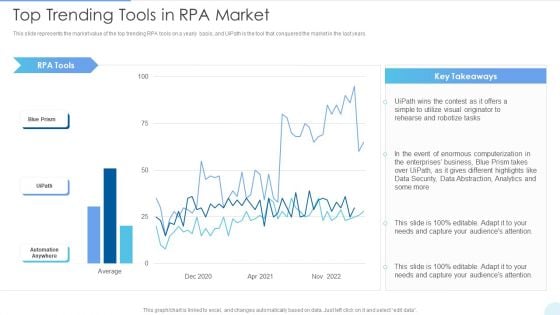
Top Trending Tools In RPA Market Topics PDF
This slide represents the market value of the top trending RPA tools on a yearly basis, and UiPath is the tool that conquered the market in the last years. Deliver and pitch your topic in the best possible manner with this Top Trending Tools In RPA Market Topics PDF. Use them to share invaluable insights on Enterprises Business, Top Trending Tools, Market and impress your audience. This template can be altered and modified as per your expectations. So, grab it now.
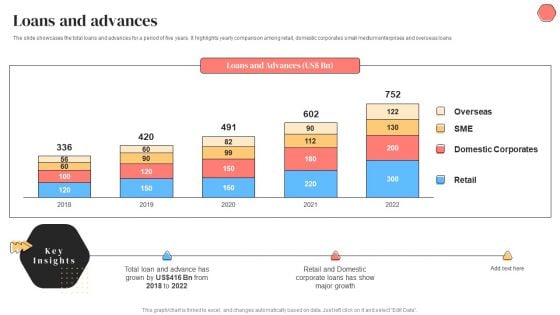
Banking Solutions Company Overview Loans And Advances Inspiration PDF
The slide showcases the total loans and advances for a period of five years. It highlights yearly comparison among retail, domestic corporates small medium enterprises and overseas loans. Deliver and pitch your topic in the best possible manner with this Banking Solutions Company Overview Loans And Advances Inspiration PDF. Use them to share invaluable insights on Major Growth, Retail And Domestic, Total Loan and impress your audience. This template can be altered and modified as per your expectations. So, grab it now.
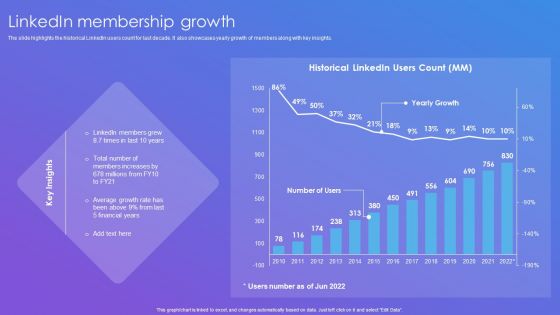
Linkedin Company Outline Linkedin Membership Growth Sample PDF
The slide highlights the historical LinkedIn users count for last decade. It also showcases yearly growth of members along with key insights.Deliver and pitch your topic in the best possible manner with this Linkedin Company Outline Linkedin Membership Growth Sample PDF. Use them to share invaluable insights on Members Increases, Average Growth, Financial Years and impress your audience. This template can be altered and modified as per your expectations. So, grab it now.
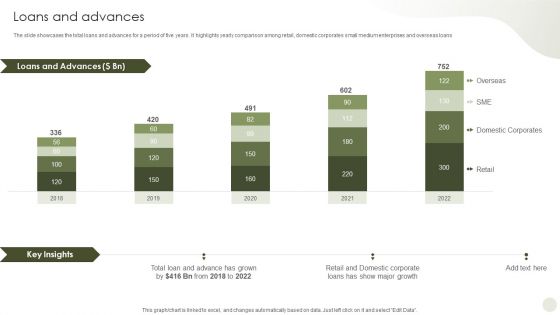
Commercial Bank Financial Services Company Profile Loans And Advances Rules PDF
The slide showcases the total loans and advances for a period of five years. It highlights yearly comparison among retail, domestic corporates small medium enterprises and overseas loans. Deliver an awe inspiring pitch with this creative Commercial Bank Financial Services Company Profile Loans And Advances Rules PDF bundle. Topics like Loans And Advances can be discussed with this completely editable template. It is available for immediate download depending on the needs and requirements of the user.
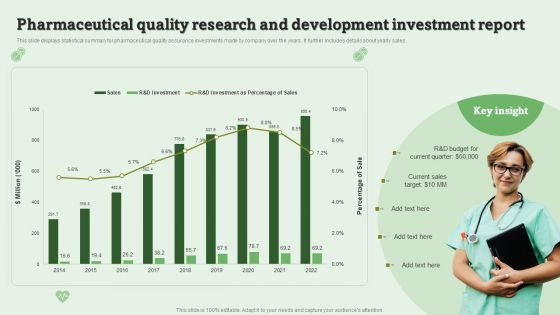
Pharmaceutical Quality Research And Development Investment Report Ppt PowerPoint Presentation Model Slides PDF
This slide displays statistical summary for pharmaceutical quality assurance investments made by company over the years. It further includes details about yearly sales. Showcasing this set of slides titled Pharmaceutical Quality Research And Development Investment Report Ppt PowerPoint Presentation Model Slides PDF. The topics addressed in these templates are Current Quarter, Current Sales, Percentage Sale. All the content presented in this PPT design is completely editable. Download it and make adjustments in color, background, font etc. as per your unique business setting.
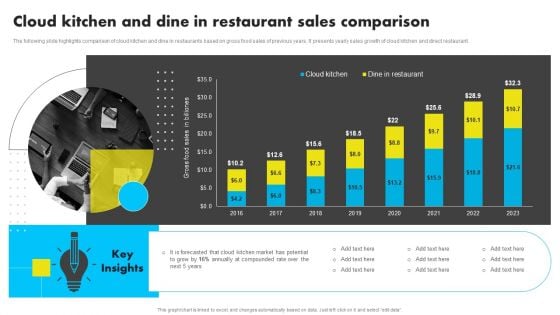
Cloud Kitchen And Dine In Restaurant Sales Comparison Analyzing Global Commissary Clipart PDF
The following slide highlights comparison of cloud kitchen and dine in restaurants based on gross food sales of previous years. It presents yearly sales growth of cloud kitchen and direct restaurant.There are so many reasons you need a Cloud Kitchen And Dine In Restaurant Sales Comparison Analyzing Global Commissary Clipart PDF. The first reason is you can notspend time making everything from scratch, Thus, Slidegeeks has made presentation templates for you too. You can easily download these templates from our website easily.
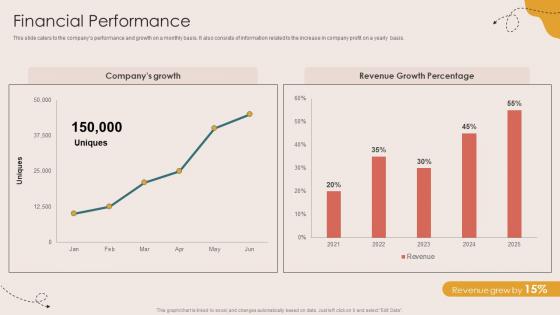
Financial Performance Children Events Listing Investor Funding Elevator Pitch Deck
This slide caters to the companys performance and growth on a monthly basis. It also consists of information related to the increase in company profit on a yearly basis. Present like a pro with Financial Performance Children Events Listing Investor Funding Elevator Pitch Deck. Create beautiful presentations together with your team, using our easy-to-use presentation slides. Share your ideas in real-time and make changes on the fly by downloading our templates. So whether you are in the office, on the go, or in a remote location, you can stay in sync with your team and present your ideas with confidence. With Slidegeeks presentation got a whole lot easier. Grab these presentations today. This slide caters to the companys performance and growth on a monthly basis. It also consists of information related to the increase in company profit on a yearly basis.
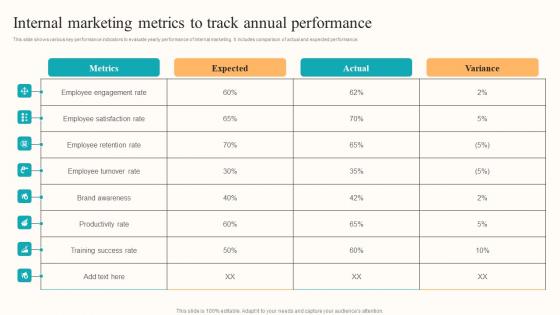
Internal Marketing Metrics Developing Employee Centric Marketing Program Introduction Pdf
This slide shows various key performance indicators to evaluate yearly performance of internal marketing. It includes comparison of actual and expected performance. If you are looking for a format to display your unique thoughts, then the professionally designed Internal Marketing Metrics Developing Employee Centric Marketing Program Introduction Pdf is the one for you. You can use it as a Google Slides template or a PowerPoint template. Incorporate impressive visuals, symbols, images, and other charts. Modify or reorganize the text boxes as you desire. Experiment with shade schemes and font pairings. Alter, share or cooperate with other people on your work. Download Internal Marketing Metrics Developing Employee Centric Marketing Program Introduction Pdf and find out how to give a successful presentation. Present a perfect display to your team and make your presentation unforgettable. This slide shows various key performance indicators to evaluate yearly performance of internal marketing. It includes comparison of actual and expected performance.
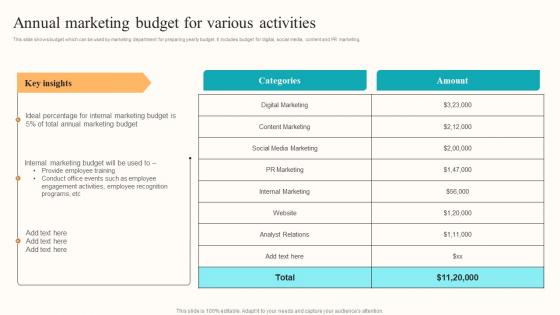
Annual Marketing Budget Developing Employee Centric Marketing Program Portrait Pdf
This slide shows budget which can be used by marketing department for preparing yearly budget. It includes budget for digital, social media, content and PR marketing. Create an editable Annual Marketing Budget Developing Employee Centric Marketing Program Portrait Pdf that communicates your idea and engages your audience. Whether you are presenting a business or an educational presentation, pre designed presentation templates help save time. Annual Marketing Budget Developing Employee Centric Marketing Program Portrait Pdf is highly customizable and very easy to edit, covering many different styles from creative to business presentations. Slidegeeks has creative team members who have crafted amazing templates. So, go and get them without any delay. This slide shows budget which can be used by marketing department for preparing yearly budget. It includes budget for digital, social media, content and PR marketing.
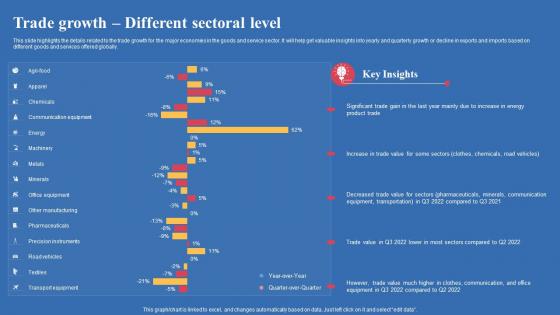
Trade Growth Different Sectoral Level Export Business Plan Sample Pdf
This slide highlights the details related to the trade growth for the major economies in the goods and service sector. It will help get valuable insights into yearly and quarterly growth or decline in exports and imports based on different goods and services offered globally. There are so many reasons you need a Trade Growth Different Sectoral Level Export Business Plan Sample Pdf The first reason is you can not spend time making everything from scratch, Thus, Slidegeeks has made presentation templates for you too. You can easily download these templates from our website easily. This slide highlights the details related to the trade growth for the major economies in the goods and service sector. It will help get valuable insights into yearly and quarterly growth or decline in exports and imports based on different goods and services offered globally.
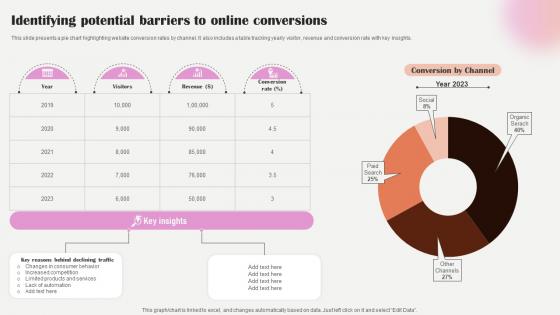
Salon Marketing Plan Identifying Potential Barriers To Online Conversions Strategy SS V
This slide presents a pie chart highlighting website conversion rates by channel. It also includes a table tracking yearly visitor, revenue and conversion rate with key insights. Create an editable Salon Marketing Plan Identifying Potential Barriers To Online Conversions Strategy SS V that communicates your idea and engages your audience. Whether you are presenting a business or an educational presentation, pre-designed presentation templates help save time. Salon Marketing Plan Identifying Potential Barriers To Online Conversions Strategy SS V is highly customizable and very easy to edit, covering many different styles from creative to business presentations. Slidegeeks has creative team members who have crafted amazing templates. So, go and get them without any delay. This slide presents a pie chart highlighting website conversion rates by channel. It also includes a table tracking yearly visitor, revenue and conversion rate with key insights.
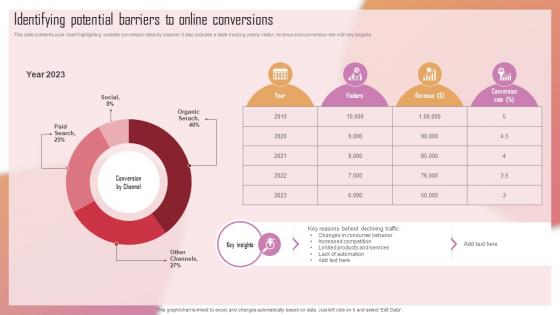
Customizing The Salon Experience Identifying Potential Barriers To Online Conversions Strategy SS V
This slide presents a pie chart highlighting website conversion rates by channel. It also includes a table tracking yearly visitor, revenue and conversion rate with key insights. Are you searching for a Customizing The Salon Experience Identifying Potential Barriers To Online Conversions Strategy SS V that is uncluttered, straightforward, and original Its easy to edit, and you can change the colors to suit your personal or business branding. For a presentation that expresses how much effort you have put in, this template is ideal With all of its features, including tables, diagrams, statistics, and lists, its perfect for a business plan presentation. Make your ideas more appealing with these professional slides. Download Customizing The Salon Experience Identifying Potential Barriers To Online Conversions Strategy SS V from Slidegeeks today. This slide presents a pie chart highlighting website conversion rates by channel. It also includes a table tracking yearly visitor, revenue and conversion rate with key insights.
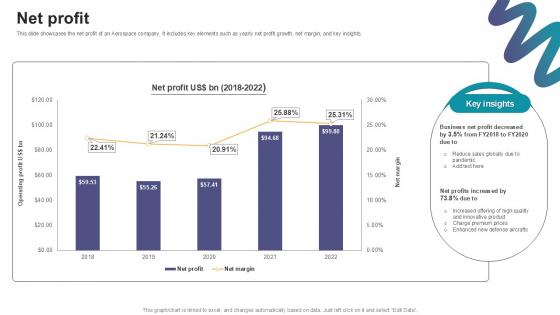
Net Profit Digital Marketings Strategies PPT PowerPoint CP SS V
This slide showcases the net profit of an Aerospace company. It includes key elements such as yearly net profit growth, net margin, and key insights. Welcome to our selection of the Net Profit Digital Marketings Strategies PPT PowerPoint CP SS V. These are designed to help you showcase your creativity and bring your sphere to life. Planning and Innovation are essential for any business that is just starting out. This collection contains the designs that you need for your everyday presentations. All of our PowerPoints are 100Percent editable, so you can customize them to suit your needs. This multi-purpose template can be used in various situations. Grab these presentation templates today. This slide showcases the net profit of an Aerospace company. It includes key elements such as yearly net profit growth, net margin, and key insights.
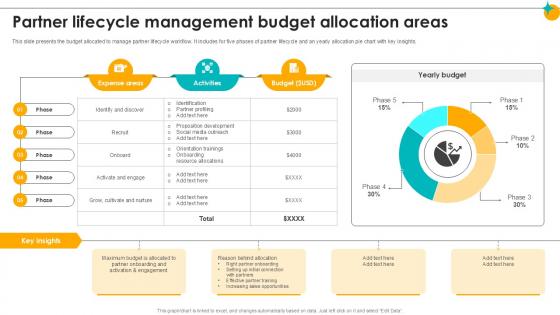
Partner Lifecycle Management Budget Allocation Partner Relationship Ppt Template
This slide presents the budget allocated to manage partner lifecycle workflow. It includes for five phases of partner lifecycle and an yearly allocation pie chart with key insights. Find highly impressive Partner Lifecycle Management Budget Allocation Partner Relationship Ppt Template on Slidegeeks to deliver a meaningful presentation. You can save an ample amount of time using these presentation templates. No need to worry to prepare everything from scratch because Slidegeeks experts have already done a huge research and work for you. You need to download Partner Lifecycle Management Budget Allocation Partner Relationship Ppt Template for your upcoming presentation. All the presentation templates are 100 percent editable and you can change the color and personalize the content accordingly. Download now This slide presents the budget allocated to manage partner lifecycle workflow. It includes for five phases of partner lifecycle and an yearly allocation pie chart with key insights.
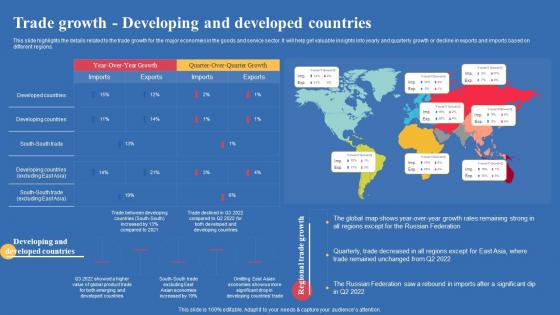
Trade Growth Developing And Developed Countries Export Business Plan Graphics Pdf
This slide highlights the details related to the trade growth for the major economies in the goods and service sector. It will help get valuable insights into yearly and quarterly growth or decline in exports and imports based on different regions. Want to ace your presentation in front of a live audience Our Trade Growth Developing And Developed Countries Export Business Plan Graphics Pdf can help you do that by engaging all the users towards you. Slidegeeks experts have put their efforts and expertise into creating these impeccable powerpoint presentations so that you can communicate your ideas clearly. Moreover, all the templates are customizable, and easy-to-edit and downloadable. Use these for both personal and commercial use. This slide highlights the details related to the trade growth for the major economies in the goods and service sector. It will help get valuable insights into yearly and quarterly growth or decline in exports and imports based on different regions.
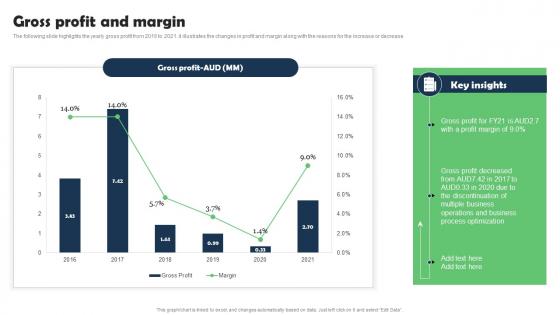
Gross Profit And Margin Marketing Research Services Management Business Background Pdf
The following slide highlights the yearly gross profit from 2016 to 2021. it illustrates the changes in profit and margin along with the reasons for the increase or decrease. Make sure to capture your audiences attention in your business displays with our gratis customizable Gross Profit And Margin Marketing Research Services Management Business Background Pdf. These are great for business strategies, office conferences, capital raising or task suggestions. If you desire to acquire more customers for your tech business and ensure they stay satisfied, create your own sales presentation with these plain slides. The following slide highlights the yearly gross profit from 2016 to 2021. it illustrates the changes in profit and margin along with the reasons for the increase or decrease.
Action Measures To Build Staff Employee Performance Tracking And Management Background Pdf
This slide showcases a dashboard presenting various metrics to measure and analyze employee overall performance. It outlines information about average absenteeism rate, yearly average overtime hours, training costs and overall labor effectiveness. Present like a pro with Action Measures To Build Staff Employee Performance Tracking And Management Background Pdf Create beautiful presentations together with your team, using our easy-to-use presentation slides. Share your ideas in real-time and make changes on the fly by downloading our templates. So whether you are in the office, on the go, or in a remote location, you can stay in sync with your team and present your ideas with confidence. With Slidegeeks presentation got a whole lot easier. Grab these presentations today. This slide showcases a dashboard presenting various metrics to measure and analyze employee overall performance. It outlines information about average absenteeism rate, yearly average overtime hours, training costs and overall labor effectiveness.
Employer Branding Strategy For Competitive Employee Performance Tracking Background Pdf
This slide showcases a dashboard presenting various metrics to measure and analyze employee overall performance. It outlines information about average absenteeism rate, yearly average overtime hours, training costs and overall labor effectiveness. Do you have an important presentation coming up Are you looking for something that will make your presentation stand out from the rest Look no further than Employer Branding Strategy For Competitive Employee Performance Tracking Background Pdf. With our professional designs, you can trust that your presentation will pop and make delivering it a smooth process. And with Slidegeeks, you can trust that your presentation will be unique and memorable. So why wait Grab Employer Branding Strategy For Competitive Employee Performance Tracking Background Pdf today and make your presentation stand out from the rest. This slide showcases a dashboard presenting various metrics to measure and analyze employee overall performance. It outlines information about average absenteeism rate, yearly average overtime hours, training costs and overall labor effectiveness.
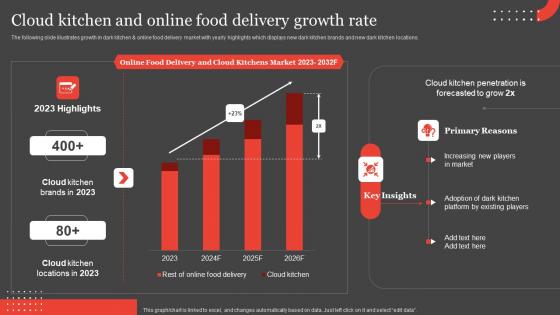
International Food Delivery Market Cloud Kitchen And Online Food Delivery Growth Information Pdf
The following slide illustrates growth in dark kitchen and online food delivery market with yearly highlights which displays new dark kitchen brands and new dark kitchen locations. Present like a pro with International Food Delivery Market Cloud Kitchen And Online Food Delivery Growth Information Pdf Create beautiful presentations together with your team, using our easy-to-use presentation slides. Share your ideas in real-time and make changes on the fly by downloading our templates. So whether you are in the office, on the go, or in a remote location, you can stay in sync with your team and present your ideas with confidence. With Slidegeeks presentation got a whole lot easier. Grab these presentations today. The following slide illustrates growth in dark kitchen and online food delivery market with yearly highlights which displays new dark kitchen brands and new dark kitchen locations.
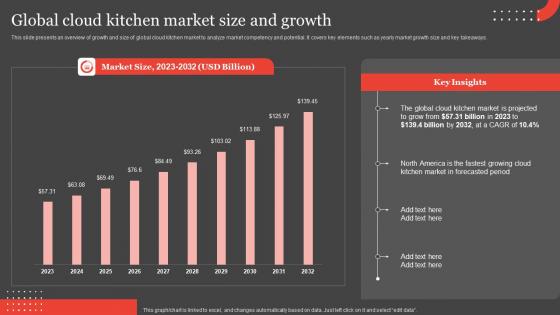
International Food Delivery Market Global Cloud Kitchen Market Size And Growth Demonstration Pdf
This slide presents an overview of growth and size of global cloud kitchen market to analyze market competency and potential. It covers key elements such as yearly market growth size and key takeaways. This International Food Delivery Market Global Cloud Kitchen Market Size And Growth Demonstration Pdf is perfect for any presentation, be it in front of clients or colleagues. It is a versatile and stylish solution for organizing your meetings. The International Food Delivery Market Global Cloud Kitchen Market Size And Growth Demonstration Pdf features a modern design for your presentation meetings. The adjustable and customizable slides provide unlimited possibilities for acing up your presentation. Slidegeeks has done all the homework before launching the product for you. So, do not wait, grab the presentation templates today This slide presents an overview of growth and size of global cloud kitchen market to analyze market competency and potential. It covers key elements such as yearly market growth size and key takeaways.
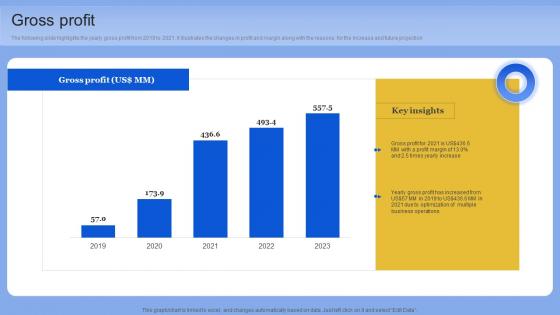
Gross Profit Data Analytics Company Outline Pictures PDF
The following slide highlights the yearly gross profit from 2019 to 2021. it illustrates the changes in profit and margin along with the reasons for the increase and future projection. Formulating a presentation can take up a lot of effort and time, so the content and message should always be the primary focus. The visuals of the PowerPoint can enhance the presenters message, so our Gross Profit Data Analytics Company Outline Pictures PDF was created to help save time. Instead of worrying about the design, the presenter can concentrate on the message while our designers work on creating the ideal templates for whatever situation is needed. Slidegeeks has experts for everything from amazing designs to valuable content, we have put everything into Gross Profit Data Analytics Company Outline Pictures PDF The following slide highlights the yearly gross profit from 2019 to 2021. it illustrates the changes in profit and margin along with the reasons for the increase and future projection


 Continue with Email

 Home
Home


