Yearly Schedule
Assets Branded Clothing Company Profile PPT PowerPoint CP SS V
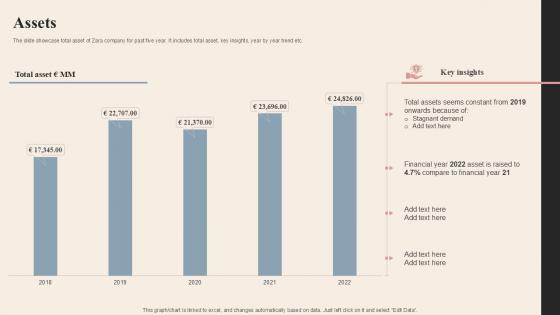
The slide showcase total asset of Zara company for past five year. It includes total asset, key insights, year by year trend etc. Find a pre-designed and impeccable Assets Branded Clothing Company Profile PPT PowerPoint CP SS V. The templates can ace your presentation without additional effort. You can download these easy-to-edit presentation templates to make your presentation stand out from others. So, what are you waiting for Download the template from Slidegeeks today and give a unique touch to your presentation. The slide showcase total asset of Zara company for past five year. It includes total asset, key insights, year by year trend etc.
Measuring Level Of Employee Engagement With Organization Designs PDF
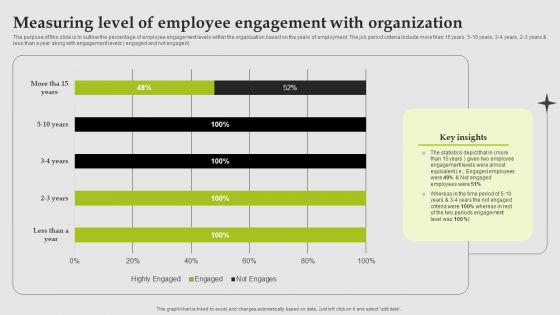
The purpose of this slide is to outline the percentage of employee engagement levels within the organization based on the years of employment. The job period criteria include more than 15 years, 5 10 years, 3 4 years, 2 3 years and less than a year along with engagement levels engaged and not engaged. Showcasing this set of slides titled Measuring Level Of Employee Engagement With Organization Designs PDF. The topics addressed in these templates are Employee, Equivalent, Organization. All the content presented in this PPT design is completely editable. Download it and make adjustments in color, background, font etc. as per your unique business setting.
3D Man Pushing Whiteboard With Numbers 2016 Powerpoint Templates
This PowerPoint template has been designed with graphics of 3d man pushing whiteboard of year 2016. This Professional slide may be used to display new years planning. Download this template to make an effective presentation in a very easy manner.

Stock Photo 2015 Plans At Construction Site With Crane PowerPoint Slide
Concept of construction has been displayed with graphic of cranes and year 2015. This image PPT slide contains the new year related topics. Use this image slide and make an innovative presentation for your viewers.
Company Sales And Performance Dashboard Ppt PowerPoint Presentation Show Structure
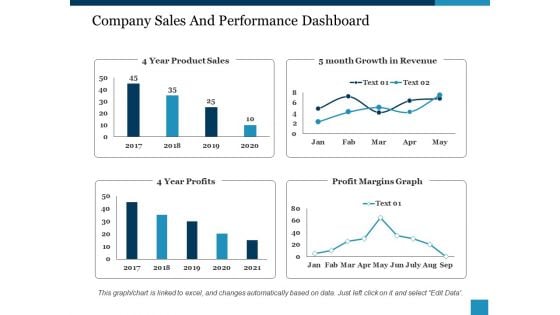
This is a company sales and performance dashboard ppt powerpoint presentation show structure. This is a four stage process. The stages in this process are year product sales, month growth in revenue, profit margins graph, year profits.

Stock Photo Green Numbers Of 2015 On Dollars PowerPoint Slide
Green numbers of 2015 year and dollars has been used to decorate this power point template slide. This image slide contains the concept of year based financial planning. Display planning in your finance and business related presentations.
Stock Photo Business Graph Of Two Thousand Fifteen PowerPoint Slide
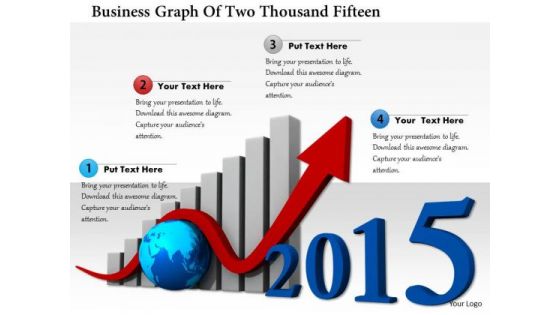
This Business Power Point image template has been designed with graphic of bar graph of 2015 year text. This image template contains the concept of new year planning. This image slide can be used for business and finance related presentations.
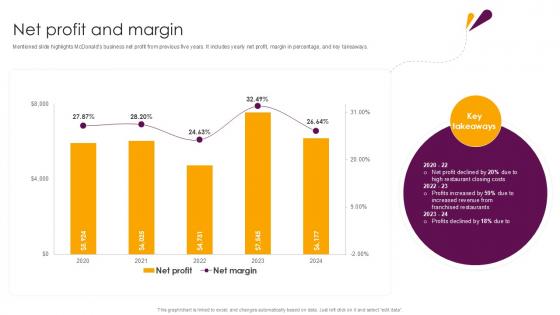
Net Profit And Margin Food And Beverages Company Profile Ppt Template CP SS V
Mentioned slide highlights McDonalds business net profit from previous five years. It includes yearly net profit, margin in percentage, and key takeaways. Presenting this PowerPoint presentation, titled Net Profit And Margin Food And Beverages Company Profile Ppt Template CP SS V with topics curated by our researchers after extensive research. This editable presentation is available for immediate download and provides attractive features when used. Download now and captivate your audience. Presenting this Net Profit And Margin Food And Beverages Company Profile Ppt Template CP SS V Our researchers have carefully researched and created these slides with all aspects taken into consideration. This is a completely customizable Net Profit And Margin Food And Beverages Company Profile Ppt Template CP SS V that is available for immediate downloading. Download now and make an impact on your audience. Highlight the attractive features available with our PPTs. Mentioned slide highlights McDonalds business net profit from previous five years. It includes yearly net profit, margin in percentage, and key takeaways.
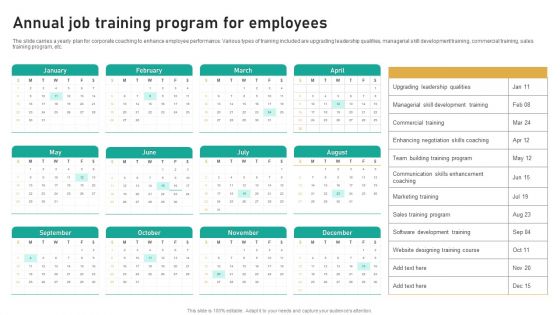
Annual Job Training Program For Employees Ppt Pictures Slide Portrait PDF
The slide carries a yearly plan for corporate coaching to enhance employee performance. Various types of training included are upgrading leadership qualities, managerial skill development training, commercial training, sales training program, etc. Presenting Annual Job Training Program For Employees Ppt Pictures Slide Portrait PDF to dispense important information. This template comprises one stages. It also presents valuable insights into the topics including Upgrading Leadership Qualities, Commercial Training, Marketing Training. This is a completely customizable PowerPoint theme that can be put to use immediately. So, download it and address the topic impactfully.

Pitch Deck For Short Term Debt Financing Revenue Model And Stream Rules PDF
The slides covers the key points to explain the Revenue model of the company. Key points include Pricing model, Estimated revenue, lifetime value of the customers, recurring revenue frequency, average revenue per user etc.Presenting pitch deck for short term debt financing revenue model and stream rules pdf. to provide visual cues and insights. Share and navigate important information on five stages that need your due attention. This template can be used to pitch topics like pricing, estimated yearly revenue, average revenue per user, lifetime value customer, recurring revenue frequency. In addtion, this PPT design contains high resolution images, graphics, etc, that are easily editable and available for immediate download.
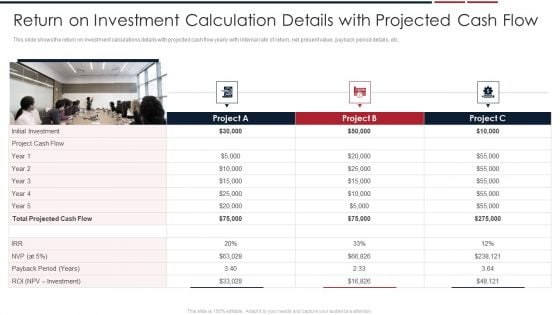
Assessing Startup Company Value Return On Investment Calculation Details With Projected Cash Flow Brochure PDF
This slide shows the return on investment calculations details with projected cash flow yearly with Internal rate of return, net present value, payback period details, etc. This is a assessing startup company value return on investment calculation details with projected cash flow brochure pdf template with various stages. Focus and dispense information on three stages using this creative set, that comes with editable features. It contains large content boxes to add your information on topics like return on investment calculation details with projected cash flow. You can also showcase facts, figures, and other relevant content using this PPT layout. Grab it now.
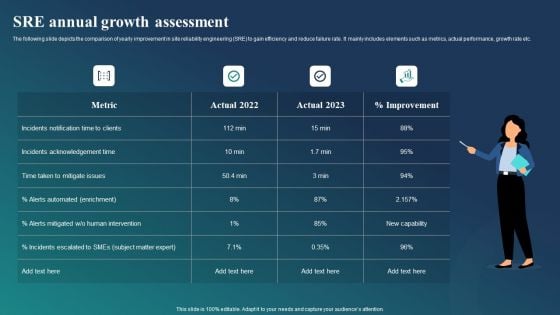
SRE Annual Growth Assessment Ppt Model Visuals PDF
The following slide depicts the comparison of yearly improvement in site reliability engineering SRE to gain efficiency and reduce failure rate. It mainly includes elements such as metrics, actual performance, growth rate etc. Presenting SRE Annual Growth Assessment Ppt Model Visuals PDF to dispense important information. This template comprises four stages. It also presents valuable insights into the topics including Metric, Actual 2022, Actual 2023, Improvement. This is a completely customizable PowerPoint theme that can be put to use immediately. So, download it and address the topic impactfully.
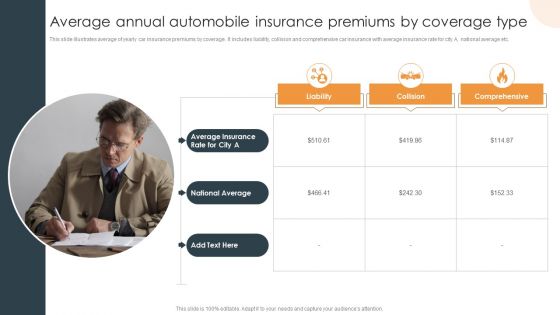
Average Annual Automobile Insurance Premiums By Coverage Type Sample PDF
This slide illustrates average of yearly car insurance premiums by coverage. It includes liability, collision and comprehensive car insurance with average insurance rate for city A, national average etc. Persuade your audience using this Average Annual Automobile Insurance Premiums By Coverage Type Sample PDF. This PPT design covers One stage, thus making it a great tool to use. It also caters to a variety of topics including National Average, Liability, Collision, Comprehensive. Download this PPT design now to present a convincing pitch that not only emphasizes the topic but also showcases your presentation skills.
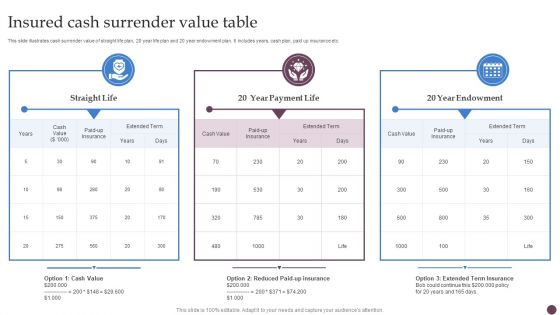
Insured Cash Surrender Value Table Ppt PowerPoint Presentation Gallery Deck PDF
This slide illustrates cash surrender value of straight life plan, 20 year life plan and 20 year endowment plan. It includes years, cash plan, paid up insurance etc. Presenting Insured Cash Surrender Value Table Ppt PowerPoint Presentation Gallery Deck PDF to dispense important information. This template comprises three stages. It also presents valuable insights into the topics including Straight Life, 20 Year, Payment Life, 20 Year Endowment. This is a completely customizable PowerPoint theme that can be put to use immediately. So, download it and address the topic impactfully.
Equity Crowd Investing Framework Of Revenue Generation Ppt Icon Rules PDF
The slides covers the key points to explain the Revenue model of the company. Key points include Pricing model, Estimated revenue, life time value of the customers, recurring revenue frequency, average revenue per user etc. Presenting equity crowd investing framework of revenue generation ppt icon rules pdf to provide visual cues and insights. Share and navigate important information on five stages that need your due attention. This template can be used to pitch topics like framework revenue generation, estimated yearly revenue, average revenue, recurring revenue frequency, pricing. In addtion, this PPT design contains high-resolution images, graphics, etc, that are easily editable and available for immediate download.
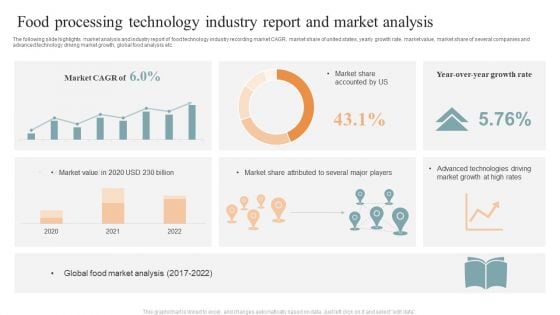
Food Processing Technology Industry Report And Market Analysis Brochure PDF
The following slide highlights market analysis and industry report of food technology industry recording market CAGR, market share of united states, yearly growth rate, market value, market share of several companies and advanced technology driving market growth, global food analysis etc. Pitch your topic with ease and precision using this Food Processing Technology Industry Report And Market Analysis Brochure PDF. This layout presents information on Market CAGR, Market Share Accounted, Global Food, Market Analysis. It is also available for immediate download and adjustment. So, changes can be made in the color, design, graphics or any other component to create a unique layout.
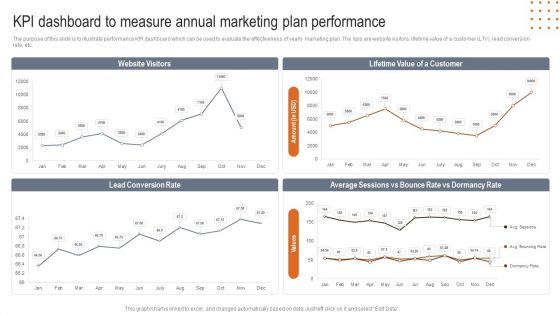
KPI Dashboard To Measure Annual Marketing Plan Performance Microsoft PDF
The purpose of this slide is to illustrate performance KPI dashboard which can be used to evaluate the effectiveness of yearly marketing plan. The kpis are website visitors, lifetime value of a customer LTV, lead conversion rate, etc. Showcasing this set of slides titled KPI Dashboard To Measure Annual Marketing Plan Performance Microsoft PDF. The topics addressed in these templates are Website Visitors, Lifetime Value Customer, Bounce Dormancy Rate. All the content presented in this PPT design is completely editable. Download it and make adjustments in color, background, font etc. as per your unique business setting.
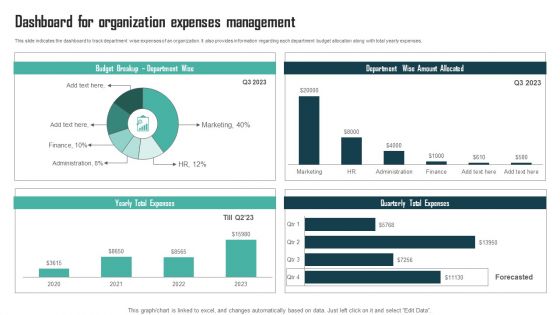
Expenses Management Plan Dashboard For Organization Expenses Management Mockup PDF
This slide indicates the dashboard to track department wise expenses of an organization. It also provides information regarding each department budget allocation along with total yearly expenses. Slidegeeks is one of the best resources for PowerPoint templates. You can download easily and regulate Expenses Management Plan Dashboard For Organization Expenses Management Mockup PDF for your personal presentations from our wonderful collection. A few clicks is all it takes to discover and get the most relevant and appropriate templates. Use our Templates to add a unique zing and appeal to your presentation and meetings. All the slides are easy to edit and you can use them even for advertisement purposes.
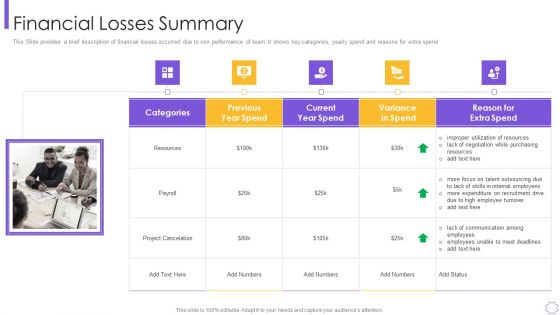
Organizational Program To Improve Team Productivity And Efficiency Financial Losses Summary Slides PDF
This Slide provides a brief description of financial losses occurred due to non performance of team. It shows key categories, yearly spend and reasons for extra spendThis is a organizational program to improve team productivity and efficiency financial losses summary slides pdf template with various stages. Focus and dispense information on five stages using this creative set, that comes with editable features. It contains large content boxes to add your information on topics like key takeaways, digital marketing team, analyst team You can also showcase facts, figures, and other relevant content using this PPT layout. Grab it now.

Half Annual Marketing Plan To Increase Company Sales Graphics PDF
The purpose of this slide is to present half yearly marketing plan of the organization. The plan covers information about different marketing activities, person responsible, status, timeline, priority, goal, and budget. Showcasing this set of slides titled Half Annual Marketing Plan To Increase Company Sales Graphics PDF. The topics addressed in these templates are Competitor Analysis, Introduce Customer, Referral Program. All the content presented in this PPT design is completely editable. Download it and make adjustments in color, background, font etc. as per your unique business setting.

KPI Dashboard To Track Sales And Operations Process Of Manufacturing Enterprise Brochure PDF
This slide depicts a dashboard to track the key performance metrics in sales and operations process of a manufacturing enterprise to analyze deviations in the actual and planned output. The key performing indicators are percentage deviation, dollar deviation, inventory in hand etc.Pitch your topic with ease and precision using this KPI Dashboard To Track Sales And Operations Process Of Manufacturing Enterprise Brochure PDF. This layout presents information on Planned Output, Yearly Growth, Inventory Hand. It is also available for immediate download and adjustment. So, changes can be made in the color, design, graphics or any other component to create a unique layout.
Mutual Funds Analysis Report With Credit Rating Ppt Slides Icon PDF
This slide shows mutual funds analysis sheet. It provides information such as asset under management AUM, scheme, credit rating, agency rank, weekly, monthly and yearly returns. Showcasing this set of slides titled Mutual Funds Analysis Report With Credit Rating Ppt Slides Icon PDF. The topics addressed in these templates are Scheme Name, Credit Rating, Credit Rating, Agency Rank. All the content presented in this PPT design is completely editable. Download it and make adjustments in color, background, font etc. as per your unique business setting.
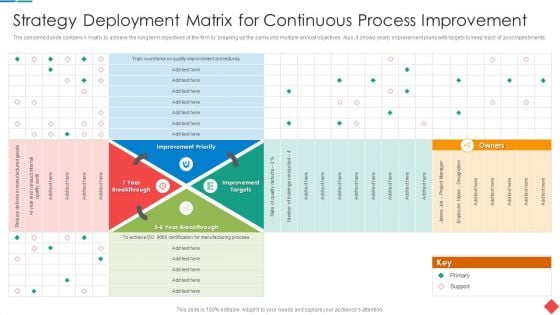
Strategy Deployment Matrix For Continuous Process Improvement Designs PDF
The concerned slide contains X matrix to achieve the long term objectives of the firm by breaking up the same into multiple annual objectives. Also, it shows yearly improvement plans with targets to keep track of accomplishments.Deliver an awe inspiring pitch with this creative Strategy Deployment Matrix For Continuous Process Improvement Designs PDF bundle. Topics like Improvement Priority, Improvement Targets, Breakthrough can be discussed with this completely editable template. It is available for immediate download depending on the needs and requirements of the user.
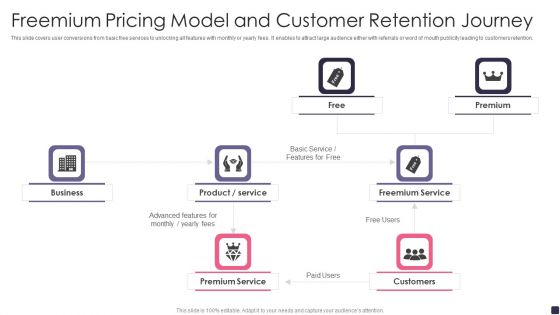
Freemium Pricing Model And Customer Retention Journey Information PDF
This slide covers user conversions from basic free services to unlocking all features with monthly or yearly fees. It enables to attract large audience either with referrals or word of mouth publicity leading to customers retention.Showcasing this set of slides titled Freemium Pricing Model And Customer Retention Journey Information PDF. The topics addressed in these templates are Gaming Platform, Freemium Pricing, Model Icon. All the content presented in this PPT design is completely editable. Download it and make adjustments in color, background, font etc. as per your unique business setting.
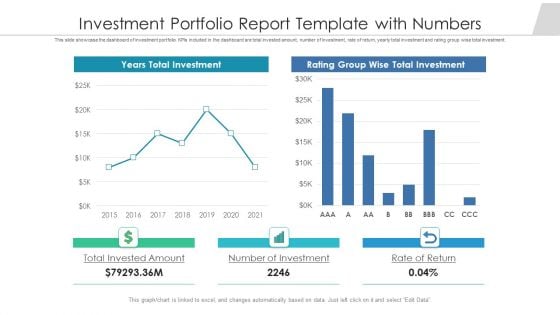
Investment Portfolio Report Template With Numbers Ppt PowerPoint Presentation Gallery Grid PDF
This slide showcase the dashboard of investment portfolio. KPIs included in the dashboard are total invested amount, number of investment, rate of return, yearly total investment and rating group wise total investment. Pitch your topic with ease and precision using this investment portfolio report template with numbers ppt powerpoint presentation gallery grid pdf. This layout presents information on total invested amount, number of investment, rate of return. It is also available for immediate download and adjustment. So, changes can be made in the color, design, graphics or any other component to create a unique layout.
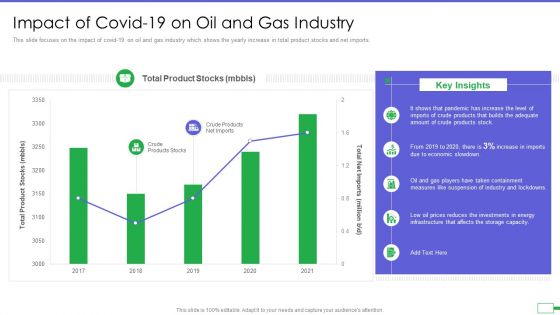
Iot And Digital Twin To Reduce Costs Post Covid Impact Of Covid 19 On Oil And Gas Industry Information PDF
This slide focuses on the impact of covid 19 on oil and gas industry which shows the yearly increase in total product stocks and net imports. Deliver an awe inspiring pitch with this creative iot and digital twin to reduce costs post covid impact of covid 19 on oil and gas industry information pdf bundle. Topics like capacity, investments, infrastructure, measures, economic can be discussed with this completely editable template. It is available for immediate download depending on the needs and requirements of the user.
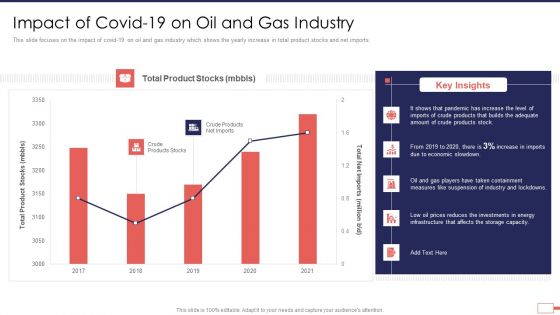
Iot Digital Twin Technology Post Covid Expenditure Management Impact Of Covid 19 On Oil And Gas Industry Summary PDF
This slide focuses on the impact of covid-19 on oil and gas industry which shows the yearly increase in total product stocks and net imports. Deliver an awe inspiring pitch with this creative iot digital twin technology post covid expenditure management impact of covid 19 on oil and gas industry summary pdf bundle. Topics like impact of covid 19 on oil and gas industry can be discussed with this completely editable template. It is available for immediate download depending on the needs and requirements of the user.
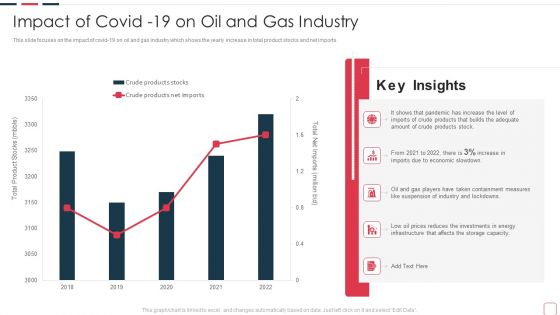
Price Benefit Internet Things Digital Twins Execution After Covid Impact Of Covid 19 On Oil Gas Download PDF
This slide focuses on the impact of covid 19 on oil and gas industry which shows the yearly increase in total product stocks and net imports. Deliver an awe inspiring pitch with this creative price benefit internet things digital twins execution after covid impact of covid 19 on oil gas download pdf bundle. Topics like impact of covid 19 on oil and gas industry can be discussed with this completely editable template. It is available for immediate download depending on the needs and requirements of the user.
Purpose Digital Twin Internet Things Reducing Costs After COVID Era Impact Of Covid 19 On Oil Icons PDF
This slide focuses on the impact of covid 19 on oil and gas industry which shows the yearly increase in total product stocks and net imports.Deliver and pitch your topic in the best possible manner with this purpose digital twin internet things reducing costs after covid era impact of covid 19 on oil icons pdf. Use them to share invaluable insights on impact of covid 19 on oil and gas industry and impress your audience. This template can be altered and modified as per your expectations. So, grab it now.
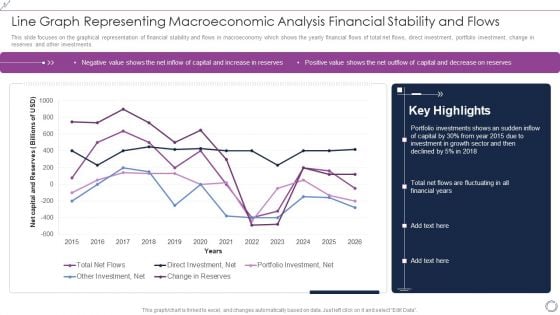
Line Graph Representing Macroeconomic Analysis Financial Stability And Flows Rules PDF
This slide focuses on the graphical representation of financial stability and flows in macroeconomy which shows the yearly financial flows of total net flows, direct investment, portfolio investment, change in reserves and other investments. Showcasing this set of slides titled Line Graph Representing Macroeconomic Analysis Financial Stability And Flows Rules PDF. The topics addressed in these templates are Total Net Flows, Direct Investment, Net, Portfolio Investment, Net. All the content presented in this PPT design is completely editable. Download it and make adjustments in color, background, font etc. as per your unique business setting.
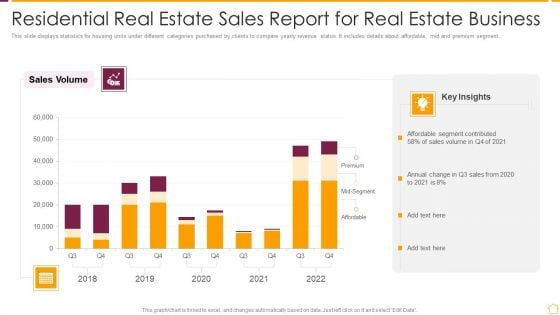
Residential Real Estate Sales Report For Real Estate Business Ppt PowerPoint Presentation File Master Slide PDF
This slide displays statistics for housing units under different categories purchased by clients to compare yearly revenue status. It includes details about affordable, mid and premium segment. Pitch your topic with ease and precision using this Residential Real Estate Sales Report For Real Estate Business Ppt PowerPoint Presentation File Master Slide PDF. This layout presents information on Affordable Segment Contributed, Sales Volume, 2018 To 2022. It is also available for immediate download and adjustment. So, changes can be made in the color, design, graphics or any other component to create a unique layout.
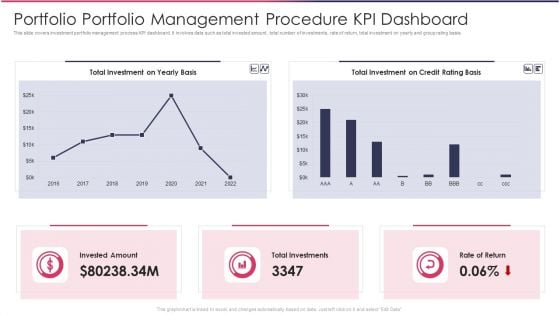
Portfolio Portfolio Management Procedure KPI Dashboard Demonstration PDF
This slide covers investment portfolio management process KPI dashboard. It involves data such as total invested amount, total number of investments, rate of return, total investment on yearly and group rating basis.Showcasing this set of slides titled Portfolio Portfolio Management Procedure KPI Dashboard Demonstration PDF The topics addressed in these templates are Total Investment, Credit Basis, Total Investments All the content presented in this PPT design is completely editable. Download it and make adjustments in color, background, font etc. as per your unique business setting.
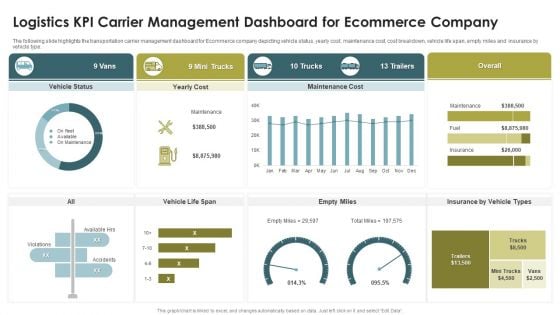
Logistics KPI Carrier Management Dashboard For Ecommerce Company Microsoft PDF
The following slide highlights the transportation carrier management dashboard for Ecommerce company depicting vehicle status, yearly cost, maintenance cost, cost breakdown, vehicle life span, empty miles and insurance by vehicle type. Pitch your topic with ease and precision using this Logistics KPI Carrier Management Dashboard For Ecommerce Company Microsoft PDF. This layout presents information on Mini Trucks, 13 Trailers, Empty Miles, Vehicle Life Span. It is also available for immediate download and adjustment. So, changes can be made in the color, design, graphics or any other component to create a unique layout.
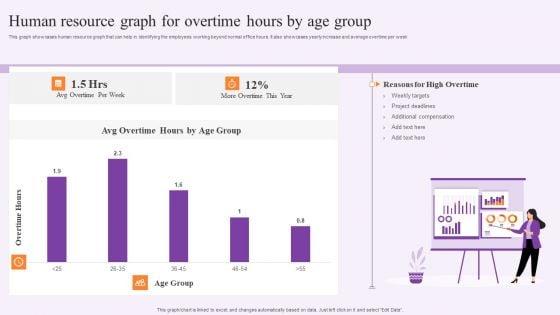
Human Resource Graph For Overtime Hours By Age Group Rules PDF
This graph showcases human resource graph that can help in identifying the employees working beyond normal office hours. It also showcases yearly increase and average overtime per week. Pitch your topic with ease and precision using this Human Resource Graph For Overtime Hours By Age Group Rules PDF. This layout presents information on Weekly Targets, Project Deadlines. It is also available for immediate download and adjustment. So, changes can be made in the color, design, graphics or any other component to create a unique layout.
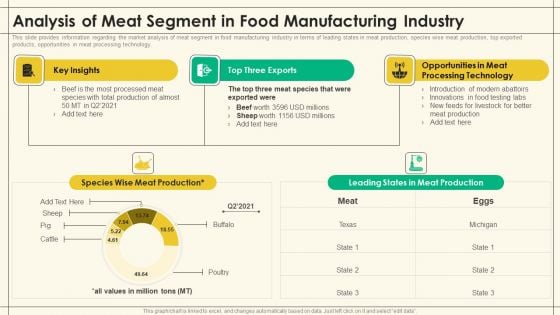
Precooked Food Industry Analysis Analysis Of Meat Segment In Food Manufacturing Industry Inspiration PDF
This slide showcase the market analysis of diary segment in food manufacturing industry providing information regarding yearly growth in milk production, top three milk producing states, species wise milk production, most exported products and top export locations.Deliver and pitch your topic in the best possible manner with this Precooked Food Industry Analysis Analysis Of Meat Segment In Food Manufacturing Industry Inspiration PDF. Use them to share invaluable insights on Production Establishments, Highest Employment, Food Manufacturing and impress your audience. This template can be altered and modified as per your expectations. So, grab it now.
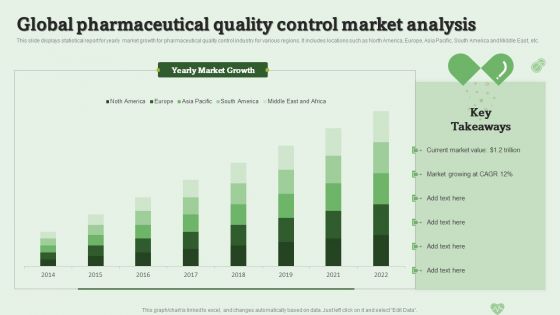
Global Pharmaceutical Quality Control Market Analysis Ppt PowerPoint Presentation Show Slides PDF
This slide displays statistical report for yearly market growth for pharmaceutical quality control industry for various regions. It includes locations such as North America, Europe, Asia Pacific, South America and Middle East, etc. Showcasing this set of slides titled Global Pharmaceutical Quality Control Market Analysis Ppt PowerPoint Presentation Show Slides PDF. The topics addressed in these templates are Market Value, Market Growing, Market Growth. All the content presented in this PPT design is completely editable. Download it and make adjustments in color, background, font etc. as per your unique business setting.
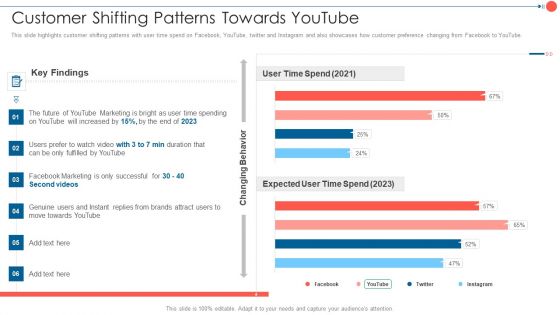
Youtube Advertising Techniques Customer Shifting Patterns Towards Youtube Professional PDF
This slide highlights customer shifting patterns with user time spend on Facebook, YouTube, twitter and Instagram and also showcases how customer preference changing from Facebook to YouTube. Deliver and pitch your topic in the best possible manner with this Youtube Advertising Techniques Customer Shifting Patterns Towards Youtube Professional PDF. Use them to share invaluable insights on Yearly Company Revenue, Monthly Product Sales, 2016 To 2021 and impress your audience. This template can be altered and modified as per your expectations. So, grab it now.
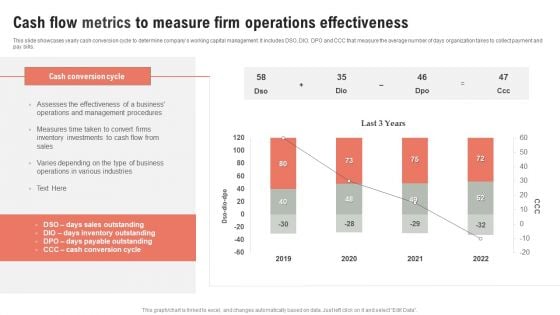
Cash Flow Metrics To Measure Firm Operations Effectiveness Ppt Outline Infographic Template PDF
This slide showcases yearly cash conversion cycle to determine companys working capital management. It includes DSO, DIO, DPO and CCC that measure the average number of days organization takes to collect payment and pay bills. Pitch your topic with ease and precision using this Cash Flow Metrics To Measure Firm Operations Effectiveness Ppt Outline Infographic Template PDF. This layout presents information on Cash Conversion Cycle, 2019 To 2022, Cash Flow. It is also available for immediate download and adjustment. So, changes can be made in the color, design, graphics or any other component to create a unique layout.
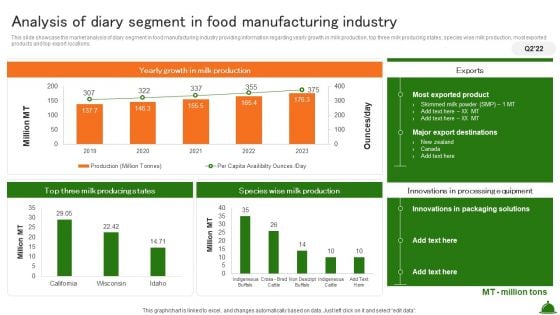
Analysis Of Diary Segment In Food Manufacturing Industry Industry Analysis Of Food Elements PDF
This slide showcase the market analysis of diary segment in food manufacturing industry providing information regarding yearly growth in milk production, top three milk producing states, species wise milk production, most exported products and top export locations.Make sure to capture your audiences attention in your business displays with our gratis customizable Analysis Of Diary Segment In Food Manufacturing Industry Industry Analysis Of Food Elements PDF. These are great for business strategies, office conferences, capital raising or task suggestions. If you desire to acquire more customers for your tech business and ensure they stay satisfied, create your own sales presentation with these plain slides.
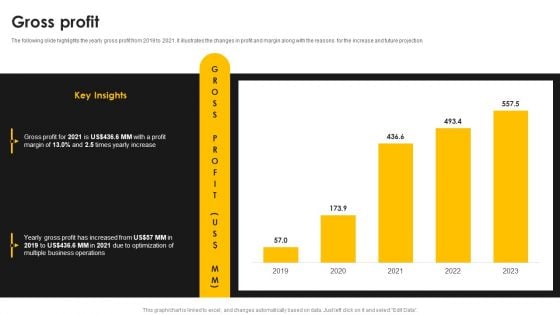
Kantar Consulting Company Outline Gross Profit Template PDF
The following slide highlights the yearly gross profit from 2019 to 2021. it illustrates the changes in profit and margin along with the reasons for the increase and future projection. Take your projects to the next level with our ultimate collection of Kantar Consulting Company Outline Gross Profit Template PDF. Slidegeeks has designed a range of layouts that are perfect for representing task or activity duration, keeping track of all your deadlines at a glance. Tailor these designs to your exact needs and give them a truly corporate look with your own brand colors they will make your projects stand out from the rest.
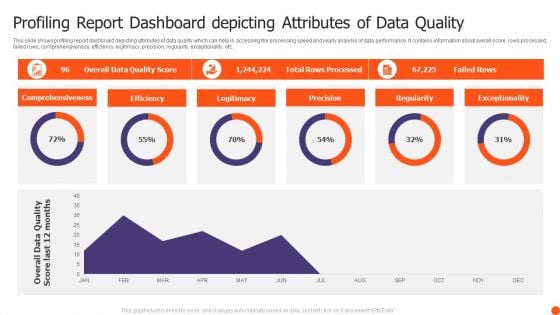
Profiling Report Dashboard Depicting Attributes Of Data Quality Themes PDF
This slide shows profiling report dashboard depicting attributes of data quality which can help in accessing the processing speed and yearly analysis of data performance. It contains information about overall score, rows processed, failed rows, comprehensiveness, efficiency, legitimacy, precision, regularity, exceptionality, etc. Pitch your topic with ease and precision using this Profiling Report Dashboard Depicting Attributes Of Data Quality Themes PDF. This layout presents information on Comprehensiveness, Efficiency, Legitimacy, Precision. It is also available for immediate download and adjustment. So, changes can be made in the color, design, graphics or any other component to create a unique layout.
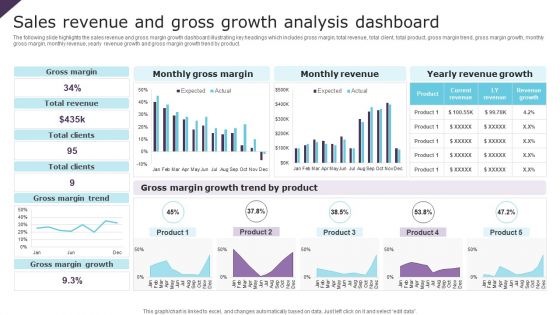
Sales Revenue And Gross Growth Analysis Dashboard Ppt Inspiration Background Image PDF
The following slide highlights the sales revenue and gross margin growth dashboard illustrating key headings which includes gross margin, total revenue, total client, total product, gross margin trend, gross margin growth, monthly gross margin, monthly revenue, yearly revenue growth and gross margin growth trend by product. Showcasing this set of slides titled Sales Revenue And Gross Growth Analysis Dashboard Ppt Inspiration Background Image PDF. The topics addressed in these templates are Gross Margin, Total Revenue, Total Clients. All the content presented in this PPT design is completely editable. Download it and make adjustments in color, background, font etc. as per your unique business setting.
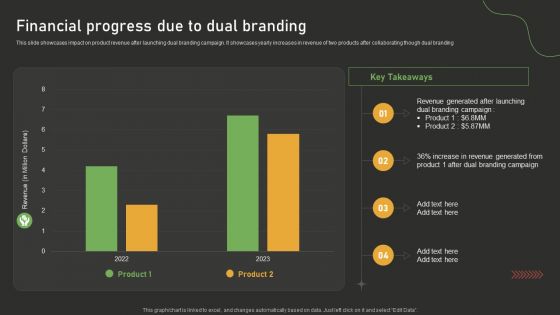
Financial Progress Due To Dual Branding Dual Branding Campaign For Product Promotion Infographics PDF
This slide showcases impact on product revenue after launching dual branding campaign. It showcases yearly increases in revenue of two products after collaborating though dual branding.Make sure to capture your audiences attention in your business displays with our gratis customizable Financial Progress Due To Dual Branding Dual Branding Campaign For Product Promotion Infographics PDF. These are great for business strategies, office conferences, capital raising or task suggestions. If you desire to acquire more customers for your tech business and ensure they stay satisfied, create your own sales presentation with these plain slides.
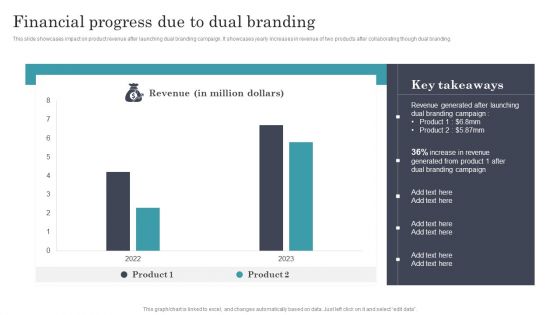
Developing Dual Branding Campaign For Brand Marketing Financial Progress Due To Dual Branding Guidelines PDF
This slide showcases impact on product revenue after launching dual branding campaign. It showcases yearly increases in revenue of two products after collaborating though dual branding. Slidegeeks is one of the best resources for PowerPoint templates. You can download easily and regulate Developing Dual Branding Campaign For Brand Marketing Financial Progress Due To Dual Branding Guidelines PDF for your personal presentations from our wonderful collection. A few clicks is all it takes to discover and get the most relevant and appropriate templates. Use our Templates to add a unique zing and appeal to your presentation and meetings. All the slides are easy to edit and you can use them even for advertisement purposes.
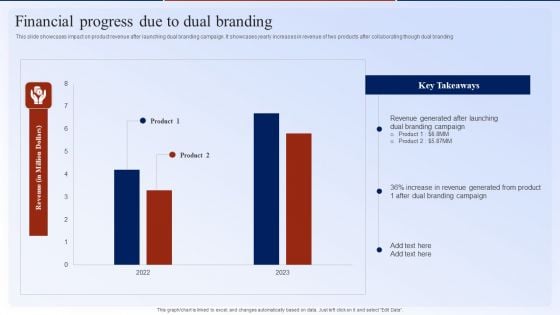
Financial Progress Due To Dual Branding Dual Branding Marketing Campaign Graphics PDF
This slide showcases impact on product revenue after launching dual branding campaign. It showcases yearly increases in revenue of two products after collaborating though dual branding. Boost your pitch with our creative Financial Progress Due To Dual Branding Dual Branding Marketing Campaign Graphics PDF. Deliver an awe-inspiring pitch that will mesmerize everyone. Using these presentation templates you will surely catch everyones attention. You can browse the ppts collection on our website. We have researchers who are experts at creating the right content for the templates. So you do not have to invest time in any additional work. Just grab the template now and use them.
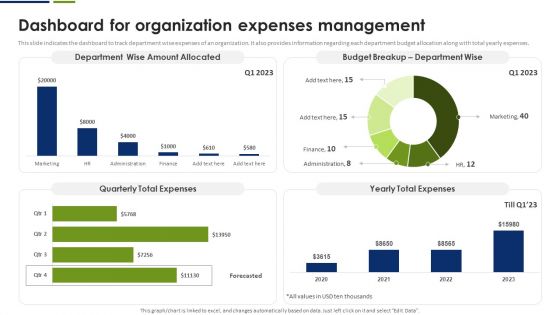
Dashboard For Organization Expenses Management Summary PDF
This slide indicates the dashboard to track department wise expenses of an organization. It also provides information regarding each department budget allocation along with total yearly expenses. Crafting an eye catching presentation has never been more straightforward. Let your presentation shine with this tasteful yet straightforward Dashboard For Organization Expenses Management Summary PDF template. It offers a minimalistic and classy look that is great for making a statement. The colors have been employed intelligently to add a bit of playfulness while still remaining professional. Construct the ideal Dashboard For Organization Expenses Management Summary PDF that effortlessly grabs the attention of your audience Begin now and be certain to wow your customers.
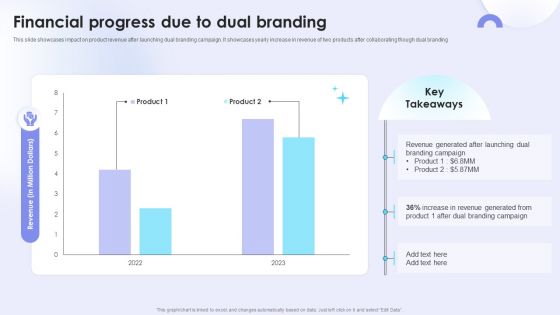
Dual Branding Campaign To Boost Sales Of Product Or Services Financial Progress Due To Dual Branding Pictures PDF
This slide showcases impact on product revenue after launching dual branding campaign. It showcases yearly increase in revenue of two products after collaborating though dual branding Take your projects to the next level with our ultimate collection of DDual Branding Campaign To Boost Sales Of Product Or Services Financial Progress Due To Dual Branding Pictures PDF. Slidegeeks has designed a range of layouts that are perfect for representing task or activity duration, keeping track of all your deadlines at a glance. Tailor these designs to your exact needs and give them a truly corporate look with your own brand colors they will make your projects stand out from the rest.
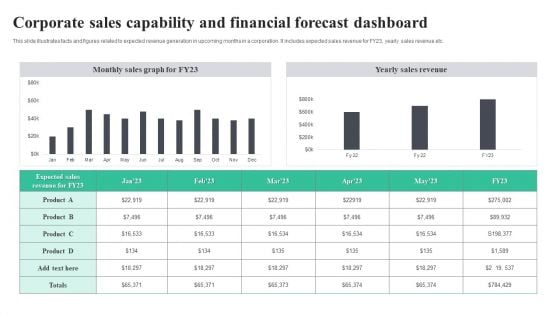
Corporate Sales Capability And Financial Forecast Dashboard Download PDF
This slide illustrates facts and figures related to expected revenue generation in upcoming months in a corporation. It includes expected sales revenue for FY23, yearly sales revenue etc. Showcasing this set of slides titled Corporate Sales Capability And Financial Forecast Dashboard Download PDF. The topics addressed in these templates are Corporate Sales, Capability And Financial, Forecast Dashboard. All the content presented in this PPT design is completely editable. Download it and make adjustments in color, background, font etc. as per your unique business setting
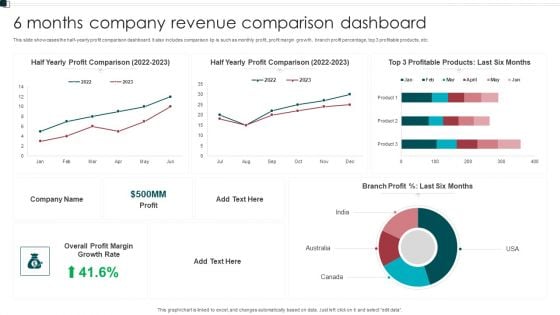
6 Months Company Revenue Comparison Dashboard Graphics PDF
This slide showcases the half yearly profit comparison dashboard. It also includes comparison kp is such as monthly profit, profit margin growth, branch profit percentage, top 3 profitable products, etc. Showcasing this set of slides titled 6 Months Company Revenue Comparison Dashboard Graphics PDF. The topics addressed in these templates are Growth Rate, Overall Profit Margin, Branch Profit. All the content presented in this PPT design is completely editable. Download it and make adjustments in color, background, font etc. as per your unique business setting.
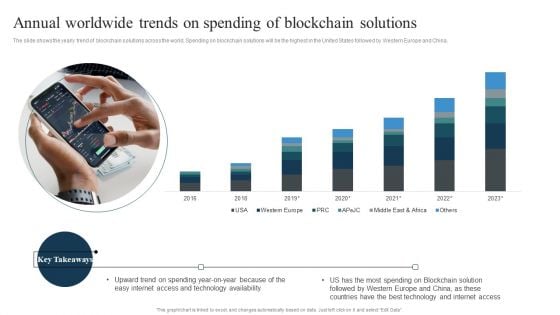
Annual Worldwide Trends On Spending Of Blockchain Solutions Introduction PDF
The slide shows the yearly trend of blockchain solutions across the world. Spending on blockchain solutions will be the highest in the United States followed by Western Europe and China.Pitch your topic with ease and precision using this Annual Worldwide Trends On Spending Of Blockchain Solutions Introduction PDF. This layout presents information on Technology Availability, Upward Trend Spending, Technology Internet Access. It is also available for immediate download and adjustment. So, changes can be made in the color, design, graphics or any other component to create a unique layout.
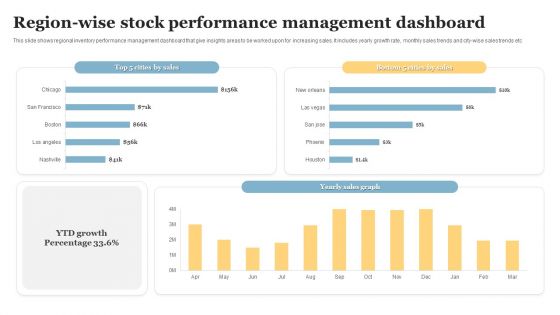
Region Wise Stock Performance Management Dashboard Introduction PDF
This slide shows regional inventory performance management dashboard that give insights areas to be worked upon for increasing sales. It includes yearly growth rate, monthly sales trends and city wise sales trends etc. Pitch your topic with ease and precision using this Region Wise Stock Performance Management Dashboard Introduction PDF. This layout presents information on Stock Performance, Management Dashboard. It is also available for immediate download and adjustment. So, changes can be made in the color, design, graphics or any other component to create a unique layout.

Business Ecological Footprints Consumption And Biocapacity Analysis Designs PDF
This slide depicts the ecological footprint and biocapacity past trends along with its future predictions. The purpose of this template is to analyze ecological footprint level in present, past and future. It includes information related to the ecological debt, productivity level and usage on yearly basis. Pitch your topic with ease and precision using this Business Ecological Footprints Consumption And Biocapacity Analysis Designs PDF. This layout presents information on Business Ecological Footprints, Consumption Biocapacity Analysis. It is also available for immediate download and adjustment. So, changes can be made in the color, design, graphics or any other component to create a unique layout.
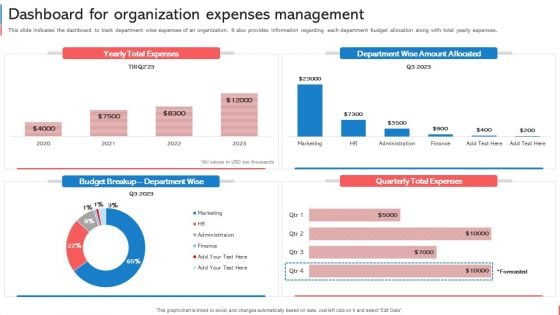
Company Budget Analysis Dashboard For Organization Expenses Management Graphics PDF
This slide indicates the dashboard to track department wise expenses of an organization. It also provides information regarding each department budget allocation along with total yearly expenses. Create an editable Company Budget Analysis Dashboard For Organization Expenses Management Graphics PDF that communicates your idea and engages your audience. Whether youre presenting a business or an educational presentation, pre-designed presentation templates help save time. Company Budget Analysis Dashboard For Organization Expenses Management Graphics PDF is highly customizable and very easy to edit, covering many different styles from creative to business presentations. Slidegeeks has creative team members who have crafted amazing templates. So, go and get them without any delay.
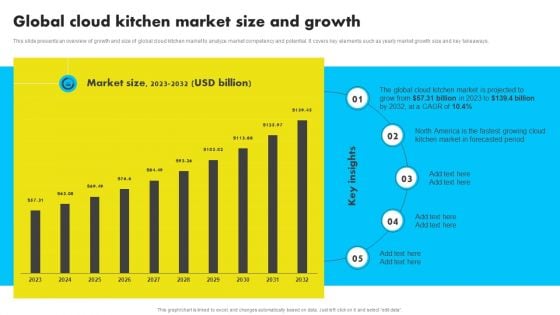
Global Cloud Kitchen Market Size And Growth Analyzing Global Commissary Kitchen Industry Download PDF
This slide presents an overview of growth and size of global cloud kitchen market to analyze market competency and potential. It covers key elements such as yearly market growth size and key takeaways.The best PPT templates are a great way to save time, energy, and resources. Slidegeeks have 100 precent editable powerpoint slides making them incredibly versatile. With these quality presentation templates, you can create a captivating and memorable presentation by combining visually appealing slides and effectively communicating your message. Download Global Cloud Kitchen Market Size And Growth Analyzing Global Commissary Kitchen Industry Download PDF from Slidegeeks and deliver a wonderful presentation.
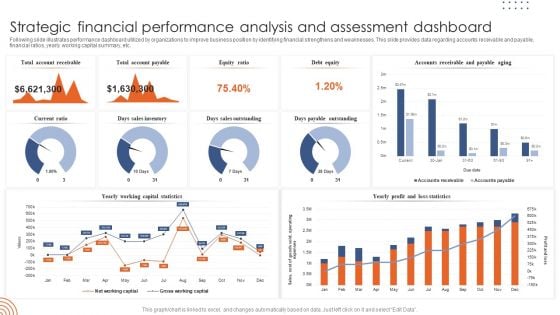
Strategic Financial Performance Analysis And Assessment Dashboard Template PDF
Following slide illustrates performance dashboard utilized by organizations to improve business position by identifying financial strengthens and weaknesses. This slide provides data regarding accounts receivable and payable, financial ratios, yearly working capital summary, etc. Showcasing this set of slides titled Strategic Financial Performance Analysis And Assessment Dashboard Template PDF. The topics addressed in these templates are Strategic Financial Performance, Analysis Assessment Dashboard. All the content presented in this PPT design is completely editable. Download it and make adjustments in color, background, font etc. as per your unique business setting.
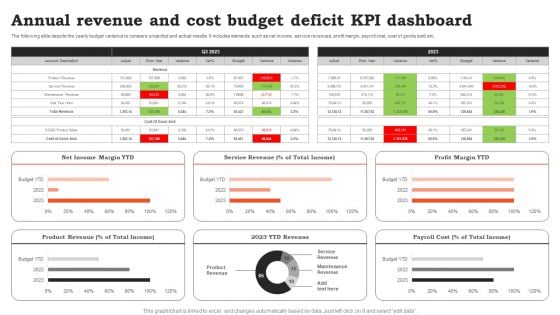
Annual Revenue And Cost Budget Deficit KPI Dashboard Ideas PDF
The following slide depicts the yearly budget variance to compare projected and actual results. It includes elements such as net income, service revenues, profit margin, payroll cost, cost of goods sold etc. Showcasing this set of slides titled Annual Revenue And Cost Budget Deficit KPI Dashboard Ideas PDF. The topics addressed in these templates are Cost Budget, Deficit KPI Dashboard. All the content presented in this PPT design is completely editable. Download it and make adjustments in color, background, font etc. as per your unique business setting.
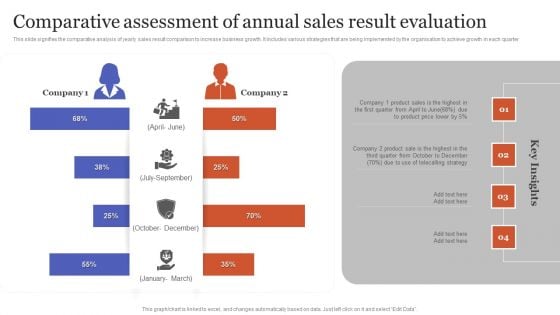
Comparative Assessment Of Annual Sales Result Evaluation Elements PDF
This slide signifies the comparative analysis of yearly sales result comparison to increase business growth. It includes various strategies that are being implemented by the organisation to achieve growth in each quarter Pitch your topic with ease and precision using this Comparative Assessment Of Annual Sales Result Evaluation Elements PDF. This layout presents information on Telecalling Strategy, Product Sales, Product Lower. It is also available for immediate download and adjustment. So, changes can be made in the color, design, graphics or any other component to create a unique layout.
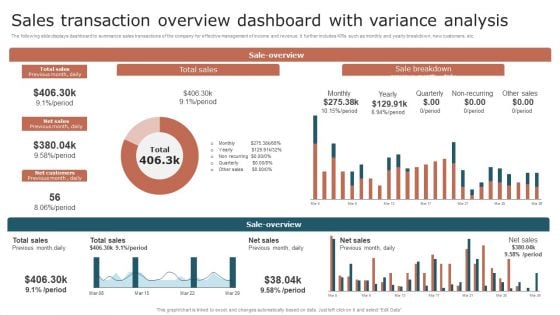
Sales Transaction Overview Dashboard With Variance Analysis Summary PDF
The following slide displays dashboard to summarize sales transactions of the company for effective management of income and revenue. It further includes KPIs such as monthly and yearly breakdown, new customers, etc. Showcasing this set of slides titled Sales Transaction Overview Dashboard With Variance Analysis Summary PDF. The topics addressed in these templates are Sales, Customers, Variance Analysis. All the content presented in this PPT design is completely editable. Download it and make adjustments in color, background, font etc. as per your unique business setting.
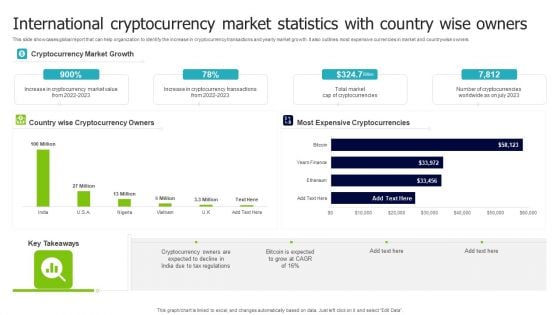
International Cryptocurrency Market Statistics With Country Wise Owners Formats PDF
This slide showcases global report that can help organization to identify the increase in cryptocurrency transactions and yearly market growth. It also outlines most expensive currencies in market and countrywise owners. Showcasing this set of slides titled International Cryptocurrency Market Statistics With Country Wise Owners Formats PDF. The topics addressed in these templates are Cryptocurrency Market Growth, Most Expensive Cryptocurrencies, Cryptocurrency Owners. All the content presented in this PPT design is completely editable. Download it and make adjustments in color, background, font etc. as per your unique business setting.
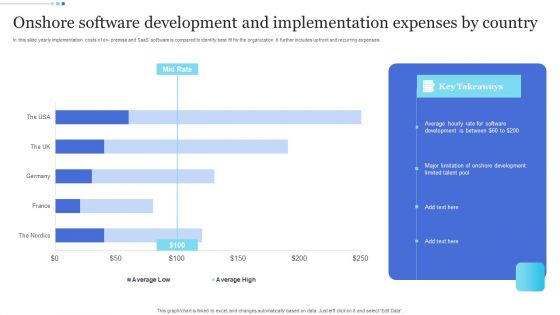
Onshore Software Development And Implementation Expenses By Country Template PDF
In this slide yearly implementation costs of on- premise and SaaS software is compared to identify best fit for the organization. It further includes upfront and recurring expenses. Showcasing this set of slides titled Onshore Software Development And Implementation Expenses By Country Template PDF. The topics addressed in these templates are Onshore Software Development, Implementation Expenses By Country. All the content presented in this PPT design is completely editable. Download it and make adjustments in color, background, font etc. as per your unique business setting.


 Continue with Email

 Home
Home


