data analytics
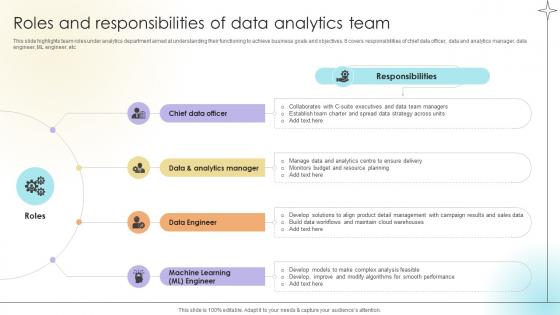
Roles And Responsibilities Of Data Analytics Team Data Analytics SS V
This slide highlights team roles under analytics department aimed at understanding their functioning to achieve business goals and objectives. It covers responsibilities of chief data officer, data and analytics manager, data engineer, ML engineer, etc.This Roles And Responsibilities Of Data Analytics Team Data Analytics SS V from Slidegeeks makes it easy to present information on your topic with precision. It provides customization options, so you can make changes to the colors, design, graphics, or any other component to create a unique layout. It is also available for immediate download, so you can begin using it right away. Slidegeeks has done good research to ensure that you have everything you need to make your presentation stand out. Make a name out there for a brilliant performance. This slide highlights team roles under analytics department aimed at understanding their functioning to achieve business goals and objectives. It covers responsibilities of chief data officer, data and analytics manager, data engineer, ML engineer, etc.
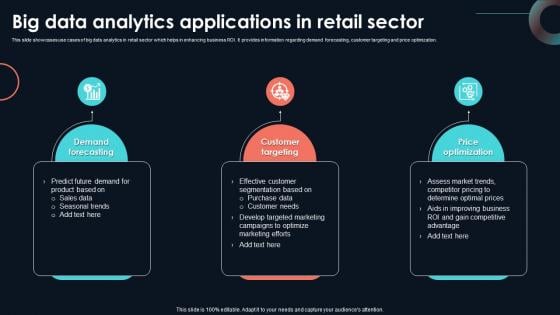
Big Data Analytics Applications In Retail Developing Strategic Insights Using Big Data Analytics SS V
This slide showcases use cases of big data analytics in retail sector which helps in enhancing business ROI. It provides information regarding demand forecasting, customer targeting and price optimization. Whether you have daily or monthly meetings, a brilliant presentation is necessary. Big Data Analytics Applications In Retail Developing Strategic Insights Using Big Data Analytics SS V can be your best option for delivering a presentation. Represent everything in detail using Big Data Analytics Applications In Retail Developing Strategic Insights Using Big Data Analytics SS V and make yourself stand out in meetings. The template is versatile and follows a structure that will cater to your requirements. All the templates prepared by Slidegeeks are easy to download and edit. Our research experts have taken care of the corporate themes as well. So, give it a try and see the results. This slide showcases use cases of big data analytics in retail sector which helps in enhancing business ROI. It provides information regarding demand forecasting, customer targeting and price optimization.
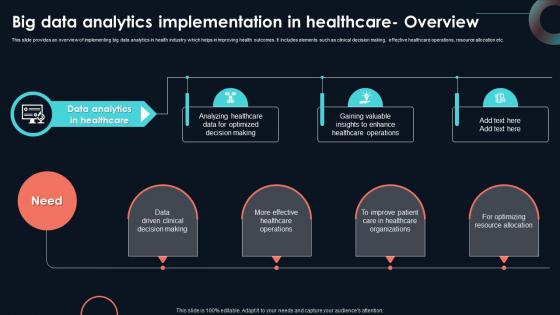
Big Data Analytics Implementation In Developing Strategic Insights Using Big Data Analytics SS V
This slide provides an overview of implementing big data analytics in health industry which helps in improving health outcomes. It includes elements such as clinical decision making, effective healthcare operations, resource allocation etc. If you are looking for a format to display your unique thoughts, then the professionally designed Big Data Analytics Implementation In Developing Strategic Insights Using Big Data Analytics SS V is the one for you. You can use it as a Google Slides template or a PowerPoint template. Incorporate impressive visuals, symbols, images, and other charts. Modify or reorganize the text boxes as you desire. Experiment with shade schemes and font pairings. Alter, share or cooperate with other people on your work. Download Big Data Analytics Implementation In Developing Strategic Insights Using Big Data Analytics SS V and find out how to give a successful presentation. Present a perfect display to your team and make your presentation unforgettable. This slide provides an overview of implementing big data analytics in health industry which helps in improving health outcomes. It includes elements such as clinical decision making, effective healthcare operations, resource allocation etc.

Benefits Of Using Big Data Analytics In Developing Strategic Insights Using Big Data Analytics SS V
This slide showcases impact of using big data analytics software for enhancing logistics operations and improving overall business performance. It provides information regarding key focus areas such as sales, operations planning, sourcing, production, warehousing, transportation etc. Get a simple yet stunning designed Benefits Of Using Big Data Analytics In Developing Strategic Insights Using Big Data Analytics SS V. It is the best one to establish the tone in your meetings. It is an excellent way to make your presentations highly effective. So, download this PPT today from Slidegeeks and see the positive impacts. Our easy-to-edit Benefits Of Using Big Data Analytics In Developing Strategic Insights Using Big Data Analytics SS V can be your go-to option for all upcoming conferences and meetings. So, what are you waiting for Grab this template today. This slide showcases impact of using big data analytics software for enhancing logistics operations and improving overall business performance. It provides information regarding key focus areas such as sales, operations planning, sourcing, production, warehousing, transportation etc.
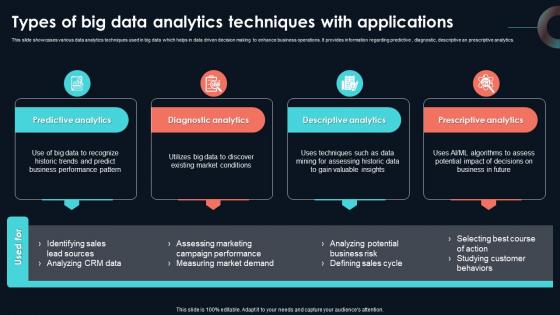
Types Of Big Data Analytics Techniques With Developing Strategic Insights Using Big Data Analytics SS V
This slide showcases various data analytics techniques used in big data which helps in data driven decision making to enhance business operations. It provides information regarding predictive , diagnostic, descriptive an prescriptive analytics. This slide showcases various data analytics techniques used in big data which helps in data driven decision making to enhance business operations. It provides information regarding predictive , diagnostic, descriptive an prescriptive analytics. Do you know about Slidesgeeks Types Of Big Data Analytics Techniques With Developing Strategic Insights Using Big Data Analytics SS V These are perfect for delivering any kind od presentation. Using it, create PowerPoint presentations that communicate your ideas and engage audiences. Save time and effort by using our pre-designed presentation templates that are perfect for a wide range of topic. Our vast selection of designs covers a range of styles, from creative to business, and are all highly customizable and easy to edit. Download as a PowerPoint template or use them as Google Slides themes. This slide showcases various data analytics techniques used in big data which helps in data driven decision making to enhance business operations. It provides information regarding predictive , diagnostic, descriptive an prescriptive analytics.
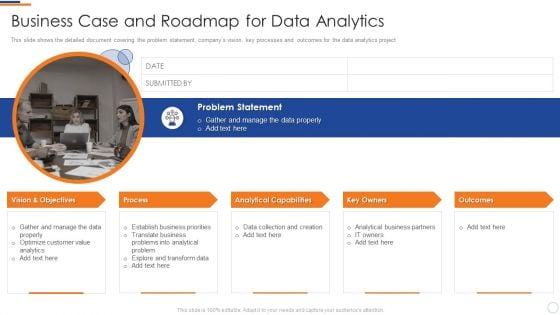
Business Intelligence And Big Data Analytics Business Case And Roadmap For Data Analytics Designs PDF
This slide shows the detailed document covering the problem statement, companys vision, key processes and outcomes for the data analytics project. Presenting business intelligence and big data analytics business case and roadmap for data analytics designs pdf to provide visual cues and insights. Share and navigate important information on one stages that need your due attention. This template can be used to pitch topics like problem statement, vision and objectives, process, analytical capabilities, key owners. In addtion, this PPT design contains high resolution images, graphics, etc, that are easily editable and available for immediate download.
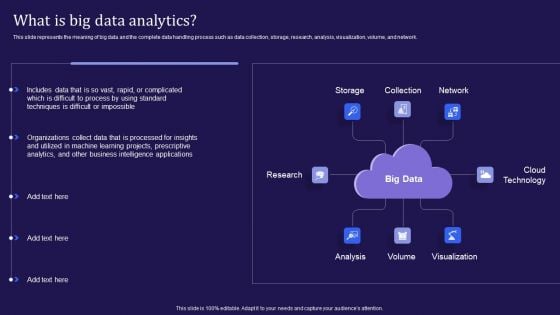
Big Data Analytics Lifecycle What Is Big Data Analytics Ppt Layouts Portrait PDF
This slide represents the meaning of big data and the complete data handling process such as data collection, storage, research, analysis, visualization, volume, and network. Present like a pro with Big Data Analytics Lifecycle What Is Big Data Analytics Ppt Layouts Portrait PDF Create beautiful presentations together with your team, using our easy-to-use presentation slides. Share your ideas in real-time and make changes on the fly by downloading our templates. So whether youre in the office, on the go, or in a remote location, you can stay in sync with your team and present your ideas with confidence. With Slidegeeks presentation got a whole lot easier. Grab these presentations today.
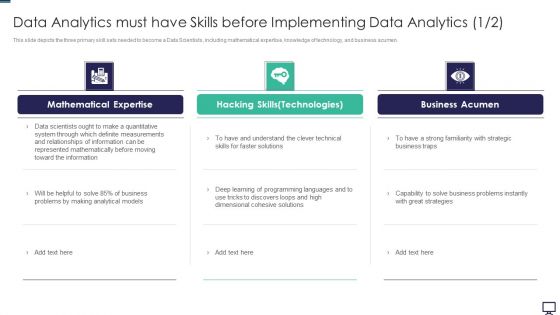
Data Analytics Must Have Skills Before Implementing Data Analytics Ppt Ideas PDF
This slide depicts the three primary skill sets needed to become a Data Scientists, including mathematical expertise, knowledge of technology, and business acumen. Deliver an awe inspiring pitch with this creative data analytics must have skills before implementing data analytics ppt ideas pdf bundle. Topics like business, system, measurements, information can be discussed with this completely editable template. It is available for immediate download depending on the needs and requirements of the user.
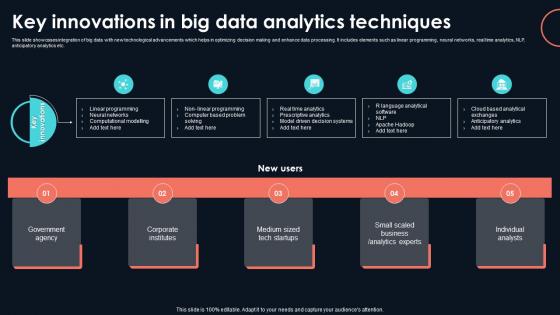
Key Innovations In Big Data Analytics Developing Strategic Insights Using Big Data Analytics SS V
This slide showcases integration of big data with new technological advancements which helps in optimizing decision making and enhance data processing. It includes elements such as linear programming, neural networks, real time analytics, NLP, anticipatory analytics etc. Whether you have daily or monthly meetings, a brilliant presentation is necessary. Key Innovations In Big Data Analytics Developing Strategic Insights Using Big Data Analytics SS V can be your best option for delivering a presentation. Represent everything in detail using Key Innovations In Big Data Analytics Developing Strategic Insights Using Big Data Analytics SS V and make yourself stand out in meetings. The template is versatile and follows a structure that will cater to your requirements. All the templates prepared by Slidegeeks are easy to download and edit. Our research experts have taken care of the corporate themes as well. So, give it a try and see the results. This slide showcases integration of big data with new technological advancements which helps in optimizing decision making and enhance data processing. It includes elements such as linear programming, neural networks, real time analytics, NLP, anticipatory analytics etc.
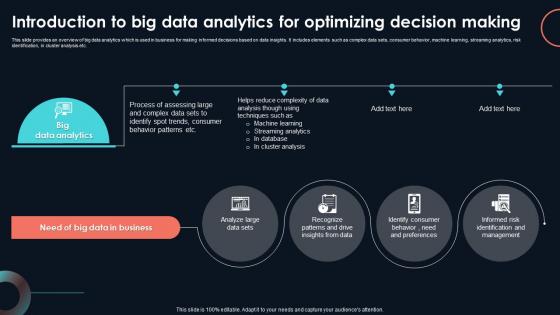
Introduction To Big Data Analytics For Developing Strategic Insights Using Big Data Analytics SS V
This slide provides an overview of big data analytics which is used in business for making informed decisions based on data insights. It includes elements such as complex data sets, consumer behavior, machine learning, streaming analytics, risk identification, in cluster analysis etc. Slidegeeks is one of the best resources for PowerPoint templates. You can download easily and regulate Introduction To Big Data Analytics For Developing Strategic Insights Using Big Data Analytics SS V for your personal presentations from our wonderful collection. A few clicks is all it takes to discover and get the most relevant and appropriate templates. Use our Templates to add a unique zing and appeal to your presentation and meetings. All the slides are easy to edit and you can use them even for advertisement purposes. This slide provides an overview of big data analytics which is used in business for making informed decisions based on data insights. It includes elements such as complex data sets, consumer behavior, machine learning, streaming analytics, risk identification, in cluster analysis etc.
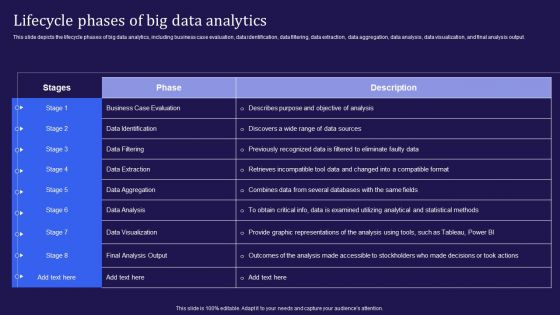
Big Data Analytics Lifecycle Lifecycle Phases Of Big Data Analytics Ppt Gallery Sample PDF
This slide depicts the lifecycle phases of big data analytics, including business case evaluation, data identification, data filtering, data extraction, data aggregation, data analysis, data visualization, and final analysis output. Slidegeeks is one of the best resources for PowerPoint templates. You can download easily and regulate Big Data Analytics Lifecycle Lifecycle Phases Of Big Data Analytics Ppt Gallery Sample PDF for your personal presentations from our wonderful collection. A few clicks is all it takes to discover and get the most relevant and appropriate templates. Use our Templates to add a unique zing and appeal to your presentation and meetings. All the slides are easy to edit and you can use them even for advertisement purposes.
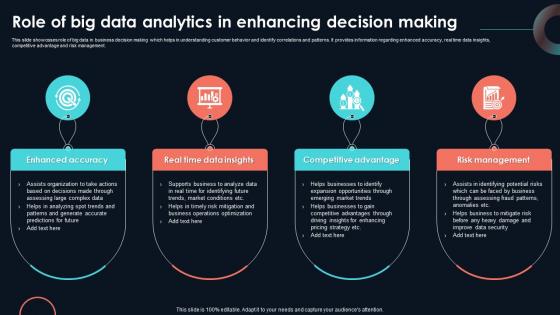
Role Of Big Data Analytics In Enhancing Developing Strategic Insights Using Big Data Analytics SS V
This slide showcases role of big data in business decision making which helps in understanding customer behavior and identify correlations and patterns. It provides information regarding enhanced accuracy, real time data insights, competitive advantage and risk management. Explore a selection of the finest Role Of Big Data Analytics In Enhancing Developing Strategic Insights Using Big Data Analytics SS V here. With a plethora of professionally designed and pre-made slide templates, you can quickly and easily find the right one for your upcoming presentation. You can use our Role Of Big Data Analytics In Enhancing Developing Strategic Insights Using Big Data Analytics SS V to effectively convey your message to a wider audience. Slidegeeks has done a lot of research before preparing these presentation templates. The content can be personalized and the slides are highly editable. Grab templates today from Slidegeeks. This slide showcases role of big data in business decision making which helps in understanding customer behavior and identify correlations and patterns. It provides information regarding enhanced accuracy, real time data insights, competitive advantage and risk management.

Combined Strength Of Big Data Analytics Developing Strategic Insights Using Big Data Analytics SS V
This slide showcases benefits of leveraging descriptive, predictive and prescriptive analytics combined to improve business operations. It provides information regarding accurate forecasting, identifying uncertainties, outcome driven recommendations etc. Formulating a presentation can take up a lot of effort and time, so the content and message should always be the primary focus. The visuals of the PowerPoint can enhance the presenters message, so our Combined Strength Of Big Data Analytics Developing Strategic Insights Using Big Data Analytics SS V was created to help save time. Instead of worrying about the design, the presenter can concentrate on the message while our designers work on creating the ideal templates for whatever situation is needed. Slidegeeks has experts for everything from amazing designs to valuable content, we have put everything into Combined Strength Of Big Data Analytics Developing Strategic Insights Using Big Data Analytics SS V This slide showcases benefits of leveraging descriptive, predictive and prescriptive analytics combined to improve business operations. It provides information regarding accurate forecasting, identifying uncertainties, outcome driven recommendations etc.
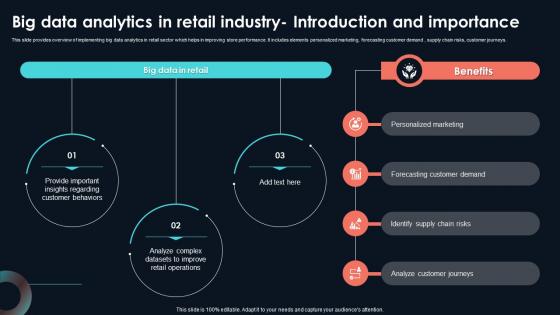
Big Data Analytics In Retail Industry Developing Strategic Insights Using Big Data Analytics SS V
This slide provides overview of implementing big data analytics in retail sector which helps in improving store performance. It includes elements personalized marketing, forecasting customer demand , supply chain risks, customer journeys. Are you in need of a template that can accommodate all of your creative concepts This one is crafted professionally and can be altered to fit any style. Use it with Google Slides or PowerPoint. Include striking photographs, symbols, depictions, and other visuals. Fill, move around, or remove text boxes as desired. Test out color palettes and font mixtures. Edit and save your work, or work with colleagues. Download Big Data Analytics In Retail Industry Developing Strategic Insights Using Big Data Analytics SS V and observe how to make your presentation outstanding. Give an impeccable presentation to your group and make your presentation unforgettable. This slide provides overview of implementing big data analytics in retail sector which helps in improving store performance. It includes elements personalized marketing, forecasting customer demand , supply chain risks, customer journeys.
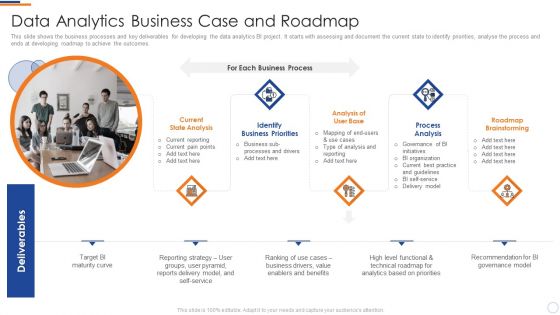
Business Intelligence And Big Data Analytics Data Analytics Business Case And Roadmap Template PDF
This slide shows the business processes and key deliverables for developing the data analytics BI project. It starts with assessing and document the current state to identify priorities, analyse the process and ends at developing roadmap to achieve the outcomes. This is a business intelligence and big data analytics data analytics business case and roadmap template pdf template with various stages. Focus and dispense information on five stages using this creative set, that comes with editable features. It contains large content boxes to add your information on topics like current state analysis, identify business priorities, analysis user base, process analysis, roadmap brainstorming. You can also showcase facts, figures, and other relevant content using this PPT layout. Grab it now.
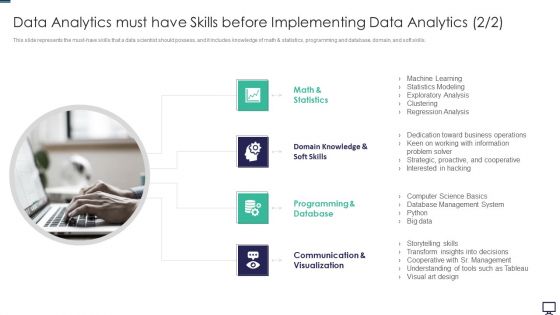
Data Analytics Must Have Skills Before Implementing Data Analytics Database Ppt Layouts Clipart Images PDF
This slide represents the must have skills that a data scientist should possess, and it includes knowledge of math and statistics, programming and database, domain, and soft skills. This is a data analytics must have skills before implementing data analytics database ppt layouts clipart images pdf template with various stages. Focus and dispense information on four stages using this creative set, that comes with editable features. It contains large content boxes to add your information on topics like database, communication, management, design, information. You can also showcase facts, figures, and other relevant content using this PPT layout. Grab it now.
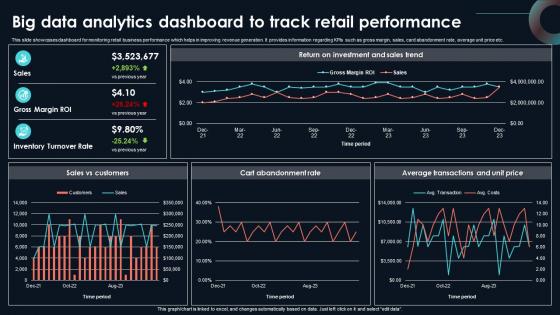
Big Data Analytics Dashboard To Track Developing Strategic Insights Using Big Data Analytics SS V
This slide showcases dashboard for monitoring retail business performance which helps in improving revenue generation. It provides information regarding KPIs such as gross margin, sales, card abandonment rate, average unit price etc. If your project calls for a presentation, then Slidegeeks is your go-to partner because we have professionally designed, easy-to-edit templates that are perfect for any presentation. After downloading, you can easily edit Big Data Analytics Dashboard To Track Developing Strategic Insights Using Big Data Analytics SS V and make the changes accordingly. You can rearrange slides or fill them with different images. Check out all the handy templates This slide showcases dashboard for monitoring retail business performance which helps in improving revenue generation. It provides information regarding KPIs such as gross margin, sales, card abandonment rate, average unit price etc.
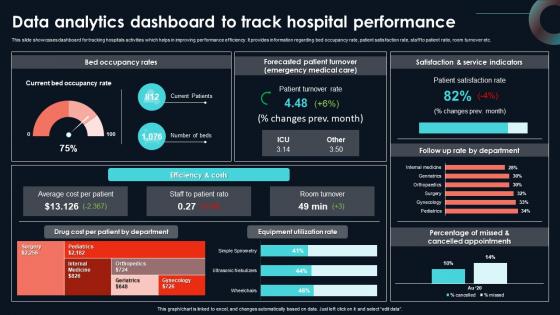
Data Analytics Dashboard To Track Hospital Developing Strategic Insights Using Big Data Analytics SS V
This slide showcases dashboard for tracking hospitals activities which helps in improving performance efficiency. It provides information regarding bed occupancy rate, patient satisfaction rate, staff to patient ratio, room turnover etc. The best PPT templates are a great way to save time, energy, and resources. Slidegeeks have 100 percent editable powerpoint slides making them incredibly versatile. With these quality presentation templates, you can create a captivating and memorable presentation by combining visually appealing slides and effectively communicating your message. Download Data Analytics Dashboard To Track Hospital Developing Strategic Insights Using Big Data Analytics SS V from Slidegeeks and deliver a wonderful presentation. This slide showcases dashboard for tracking hospitals activities which helps in improving performance efficiency. It provides information regarding bed occupancy rate, patient satisfaction rate, staff to patient ratio, room turnover etc.
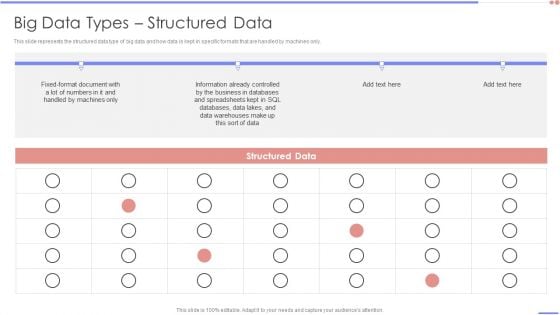
Data Analytics Management Big Data Types Structured Data Introduction PDF
This slide represents the structured data type of big data and how data is kept in specific formats that are handled by machines only.Deliver an awe inspiring pitch with this creative Data Analytics Management Big Data Types Structured Data Introduction PDF bundle. Topics like Handled By Machines, Information, Business Databases can be discussed with this completely editable template. It is available for immediate download depending on the needs and requirements of the user.
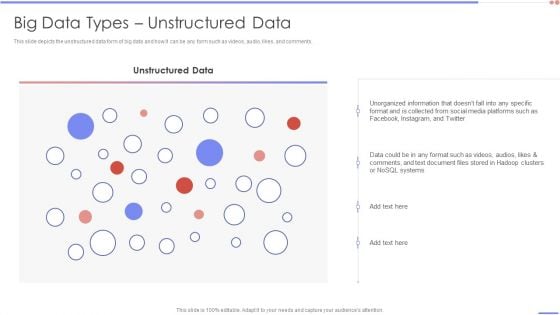
Data Analytics Management Big Data Types Unstructured Data Brochure PDF
This slide depicts the unstructured data form of big data and how it can be any form such as videos, audio, likes, and comments. Deliver and pitch your topic in the best possible manner with this Data Analytics Management Big Data Types Unstructured Data Brochure PDF. Use them to share invaluable insights on Unorganized Information, Format Collected, Document Stored and impress your audience. This template can be altered and modified as per your expectations. So, grab it now.

Product Analytics Tool 2 Adobe Analytics To Generate Data Product Analytics Implementation Data Analytics V
This slide provides an overview of product analytic tool Adobe Analytics. It covers details regarding tool description, benefits and pricing plans such as select, prime and ultimate.Slidegeeks is here to make your presentations a breeze with Product Analytics Tool 2 Adobe Analytics To Generate Data Product Analytics Implementation Data Analytics V With our easy-to-use and customizable templates, you can focus on delivering your ideas rather than worrying about formatting. With a variety of designs to choose from, you are sure to find one that suits your needs. And with animations and unique photos, illustrations, and fonts, you can make your presentation pop. So whether you are giving a sales pitch or presenting to the board, make sure to check out Slidegeeks first This slide provides an overview of product analytic tool Adobe Analytics. It covers details regarding tool description, benefits and pricing plans such as select, prime and ultimate.
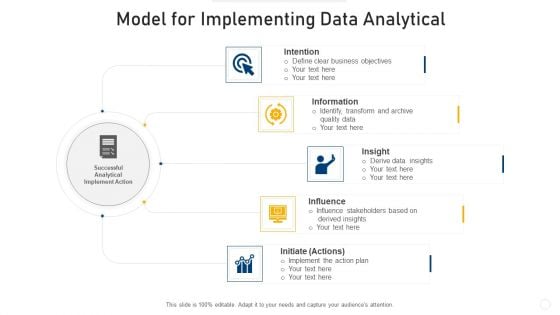
Model For Implementing Data Analytical Infographics PDF
Presenting model for implementing data analytical infographics pdf to dispense important information. This template comprises five stages. It also presents valuable insights into the topics including intention, insight, influence. This is a completely customizable PowerPoint theme that can be put to use immediately. So, download it and address the topic impactfully.
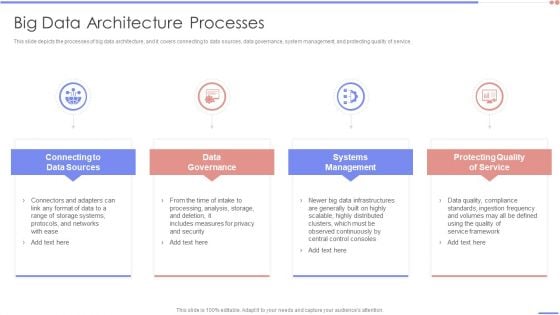
Data Analytics Management Big Data Architecture Processes Information PDF
This slide depicts the processes of big data architecture, and it covers connecting to data sources, data governance, system management, and protecting quality of service.Presenting Data Analytics Management Big Data Architecture Processes Information PDF to provide visual cues and insights. Share and navigate important information on four stages that need your due attention. This template can be used to pitch topics like Data Governance, Systems Management, Protecting Quality. In addtion, this PPT design contains high resolution images, graphics, etc, that are easily editable and available for immediate download.

Data Analytics Management Big Data Architecture Layers Introduction PDF
This slide describes the layers of big data architecture that include the big data source layer, management storage layer, analysis layer, and consumption layer.This is a Data Analytics Management Big Data Architecture Layers Introduction PDF template with various stages. Focus and dispense information on four stages using this creative set, that comes with editable features. It contains large content boxes to add your information on topics like Data Sources, Analysis Layer, Management Storage. You can also showcase facts, figures, and other relevant content using this PPT layout. Grab it now.
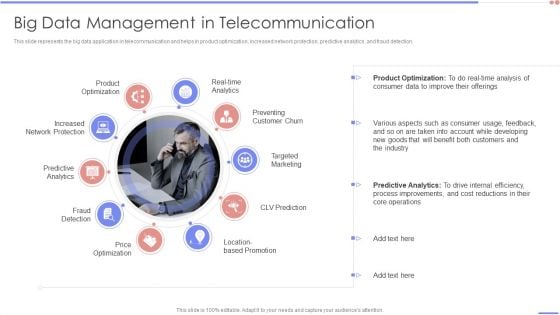
Data Analytics Management Big Data Management In Telecommunication Infographics PDF
This slide represents the big data application in telecommunication and helps in product optimization, increased network protection, predictive analytics, and fraud detection.Presenting Data Analytics Management Big Data Management In Telecommunication Infographics PDF to provide visual cues and insights. Share and navigate important information on ten stages that need your due attention. This template can be used to pitch topics like Product Optimization, Predictive Analytics, Fraud Detection. In addtion, this PPT design contains high resolution images, graphics, etc, that are easily editable and available for immediate download.
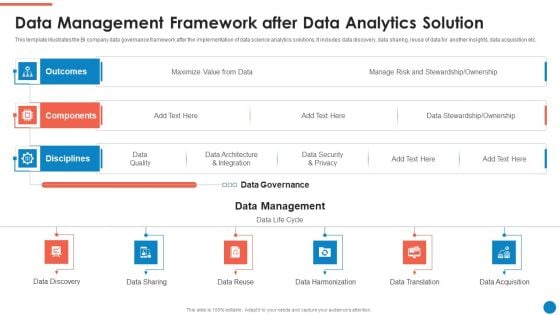
Data And Analytics Playbook Data Management Framework After Data Analytics Solution Designs PDF
This template illustrates the BI company data governance framework after the implementation of data science analytics solutions. It includes data discovery, data sharing, reuse of data for another insights, data acquisition etc. Deliver an awe inspiring pitch with this creative Data And Analytics Playbook Data Management Framework After Data Analytics Solution Designs PDF bundle. Topics like Outcomes, Components, Disciplines, Data Management, Data Governance can be discussed with this completely editable template. It is available for immediate download depending on the needs and requirements of the user.
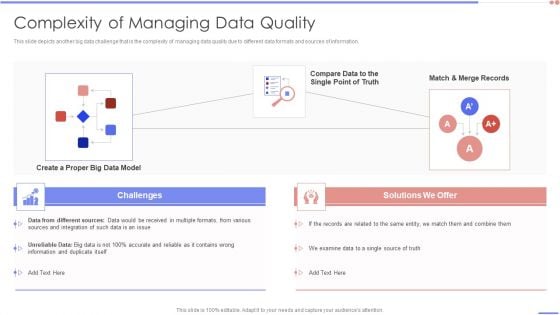
Data Analytics Management Complexity Of Managing Data Quality Summary PDF
This slide depicts another big data challenge that is the complexity of managing data quality due to different data formats and sources of information.Deliver an awe inspiring pitch with this creative Data Analytics Management Complexity Of Managing Data Quality Summary PDF bundle. Topics like Received In Multiple, Accurate Reliable, Information Duplicate can be discussed with this completely editable template. It is available for immediate download depending on the needs and requirements of the user.
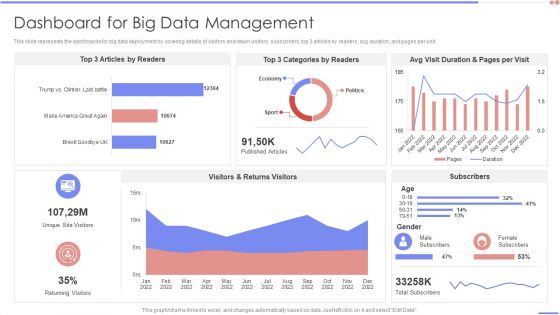
Data Analytics Management Dashboard For Big Data Management Background PDF
This slide represents the dashboards for big data deployment by covering details of visitors and return visitors, subscribers, top 3 articles by readers, avg duration, and pages per visit. Deliver and pitch your topic in the best possible manner with this Data Analytics Management Dashboard For Big Data Management Background PDF. Use them to share invaluable insights on Article Readers, Categories Readers, Duration Pages and impress your audience. This template can be altered and modified as per your expectations. So, grab it now.
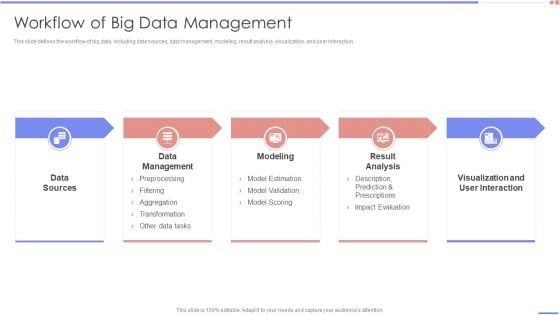
Data Analytics Management Workflow Of Big Data Management Infographics PDF
This slide defines the workflow of big data, including data sources, data management, modeling, result analysis, visualization, and user interaction.This is a Data Analytics Management Workflow Of Big Data Management Infographics PDF template with various stages. Focus and dispense information on five stages using this creative set, that comes with editable features. It contains large content boxes to add your information on topics like Data Management, Visualization Interaction, Result Analysis. You can also showcase facts, figures, and other relevant content using this PPT layout. Grab it now.
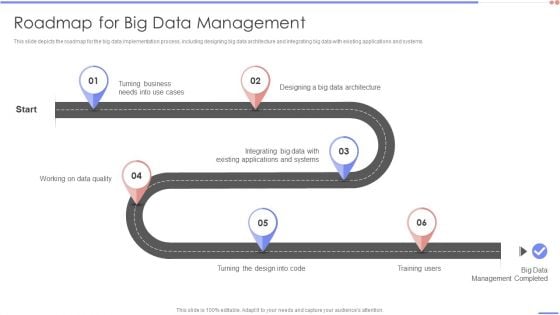
Data Analytics Management Roadmap For Big Data Management Portrait PDF
This slide depicts the roadmap for the big data implementation process, including designing big data architecture and integrating big data with existing applications and systems.This is a Data Analytics Management Roadmap For Big Data Management Portrait PDF template with various stages. Focus and dispense information on six stages using this creative set, that comes with editable features. It contains large content boxes to add your information on topics like Turning Business, Data Architecture, Existing Applications. You can also showcase facts, figures, and other relevant content using this PPT layout. Grab it now.
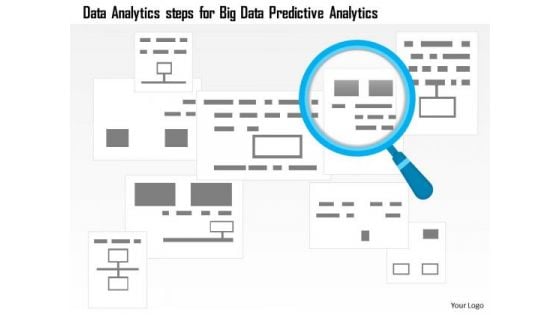
Business Diagram Data Analytics Steps For Big Data Predictive Analytics Ppt Slide
This power point template has been designed with graphic of magnifier over boxes. This slide contains the concept of predictive analytics of big data. This diagram can be used for data analytics related topics in any presentation.

Prescriptive Analytics Software Tool Google Looker Data Analytics SS V
This slide provides overview of Google Looker as a data analytics tool. It covers details of Google Looker regarding description, unique selling propositions, features and pricing plans.Explore a selection of the finest Prescriptive Analytics Software Tool Google Looker Data Analytics SS V here. With a plethora of professionally designed and pre-made slide templates, you can quickly and easily find the right one for your upcoming presentation. You can use our Prescriptive Analytics Software Tool Google Looker Data Analytics SS V to effectively convey your message to a wider audience. Slidegeeks has done a lot of research before preparing these presentation templates. The content can be personalized and the slides are highly editable. Grab templates today from Slidegeeks. This slide provides overview of Google Looker as a data analytics tool. It covers details of Google Looker regarding description, unique selling propositions, features and pricing plans.
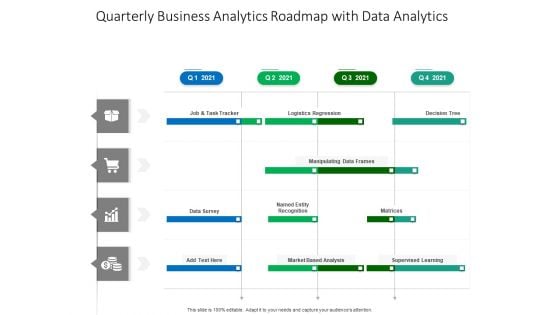
Quarterly Business Analytics Roadmap With Data Analytics Brochure
We present our quarterly business analytics roadmap with data analytics brochure. This PowerPoint layout is easy-to-edit so you can change the font size, font type, color, and shape conveniently. In addition to this, the PowerPoint layout is Google Slides compatible, so you can share it with your audience and give them access to edit it. Therefore, download and save this well-researched quarterly business analytics roadmap with data analytics brochure in different formats like PDF, PNG, and JPG to smoothly execute your business plan.

Prescriptive Analytics Software Tool Tableau Data Analytics SS V
This slide provides overview of Tableau as a data analytics tools providing data visualization features. It covers details of Tableau regarding description, features and pricing plans.Retrieve professionally designed Prescriptive Analytics Software Tool Tableau Data Analytics SS V to effectively convey your message and captivate your listeners. Save time by selecting pre-made slideshows that are appropriate for various topics, from business to educational purposes. These themes come in many different styles, from creative to corporate, and all of them are easily adjustable and can be edited quickly. Access them as PowerPoint templates or as Google Slides themes. You do not have to go on a hunt for the perfect presentation because Slidegeeks got you covered from everywhere. This slide provides overview of Tableau as a data analytics tools providing data visualization features. It covers details of Tableau regarding description, features and pricing plans.
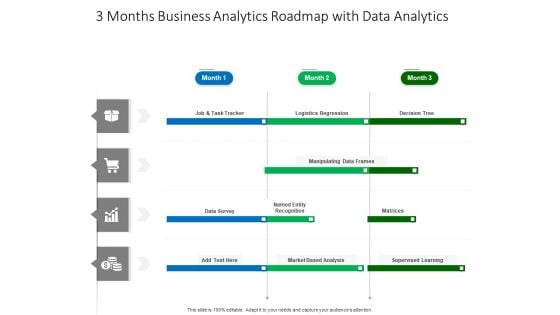
3 Months Business Analytics Roadmap With Data Analytics Structure
We present our 3 months business analytics roadmap with data analytics structure. This PowerPoint layout is easy-to-edit so you can change the font size, font type, color, and shape conveniently. In addition to this, the PowerPoint layout is Google Slides compatible, so you can share it with your audience and give them access to edit it. Therefore, download and save this well-researched 3 months business analytics roadmap with data analytics structure in different formats like PDF, PNG, and JPG to smoothly execute your business plan.
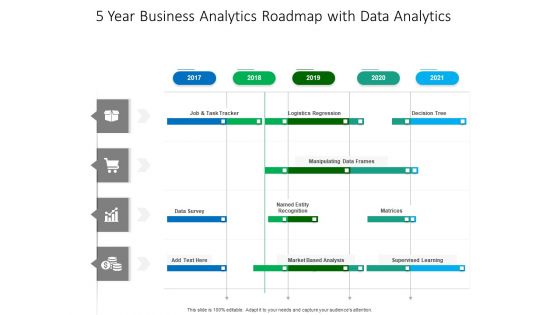
5 Year Business Analytics Roadmap With Data Analytics Sample
We present our 5 year business analytics roadmap with data analytics sample. This PowerPoint layout is easy-to-edit so you can change the font size, font type, color, and shape conveniently. In addition to this, the PowerPoint layout is Google Slides compatible, so you can share it with your audience and give them access to edit it. Therefore, download and save this well-researched 5 year business analytics roadmap with data analytics sample in different formats like PDF, PNG, and JPG to smoothly execute your business plan.
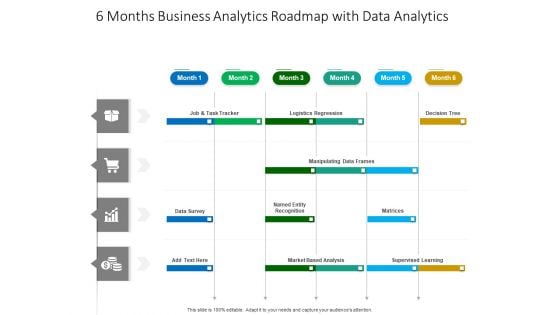
6 Months Business Analytics Roadmap With Data Analytics Brochure
We present our 6 months business analytics roadmap with data analytics brochure. This PowerPoint layout is easy-to-edit so you can change the font size, font type, color, and shape conveniently. In addition to this, the PowerPoint layout is Google Slides compatible, so you can share it with your audience and give them access to edit it. Therefore, download and save this well-researched 6 months business analytics roadmap with data analytics brochure in different formats like PDF, PNG, and JPG to smoothly execute your business plan.

Prescriptive Analytics Software Tool Rapidminer Data Analytics SS V
This slide provides overview of RapidMiner as a prescriptive analytics tool to help businesses evaluate its usability. It covers details of RapidMiner regarding description, features and pricing plans.Are you searching for a Prescriptive Analytics Software Tool Rapidminer Data Analytics SS V that is uncluttered, straightforward, and original Its easy to edit, and you can change the colors to suit your personal or business branding. For a presentation that expresses how much effort you have put in, this template is ideal With all of its features, including tables, diagrams, statistics, and lists, its perfect for a business plan presentation. Make your ideas more appealing with these professional slides. Download Prescriptive Analytics Software Tool Rapidminer Data Analytics SS V from Slidegeeks today. This slide provides overview of RapidMiner as a prescriptive analytics tool to help businesses evaluate its usability. It covers details of RapidMiner regarding description, features and pricing plans.

Prescriptive Analytics Software Tool Alteryx Data Analytics SS V
This slide provides an overview of advanced analytic tool Alteryx. It covers details regarding unique selling propositions, customer reviews and pricing plans of Alteryx.This Prescriptive Analytics Software Tool Alteryx Data Analytics SS V is perfect for any presentation, be it in front of clients or colleagues. It is a versatile and stylish solution for organizing your meetings. The Prescriptive Analytics Software Tool Alteryx Data Analytics SS V features a modern design for your presentation meetings. The adjustable and customizable slides provide unlimited possibilities for acing up your presentation. Slidegeeks has done all the homework before launching the product for you. So, do not wait, grab the presentation templates today This slide provides an overview of advanced analytic tool Alteryx. It covers details regarding unique selling propositions, customer reviews and pricing plans of Alteryx.

Product Analytics Implementation For Enhanced Business Insights Data Analytics V
Half Yearly Business Analytics Roadmap With Data Analytics Icons
Presenting our jaw-dropping half yearly business analytics roadmap with data analytics icons. You can alternate the color, font size, font type, and shapes of this PPT layout according to your strategic process. This PPT presentation is compatible with Google Slides and is available in both standard screen and widescreen aspect ratios. You can also download this well-researched PowerPoint template design in different formats like PDF, JPG, and PNG. So utilize this visually-appealing design by clicking the download button given below.
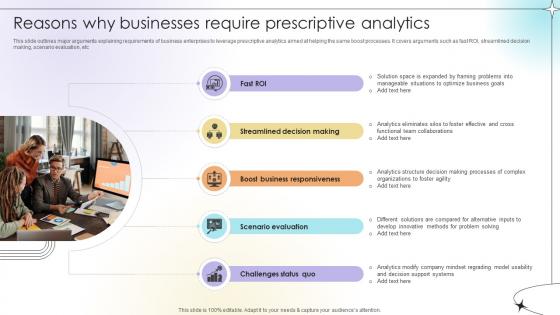
Reasons Why Businesses Require Prescriptive Analytics Data Analytics SS V
This slide outlines major arguments explaining requirements of business enterprises to leverage prescriptive analytics aimed at helping the same boost processes. It covers arguments such as fast ROI, streamlined decision making, scenario evaluation, etc.Here you can discover an assortment of the finest PowerPoint and Google Slides templates. With these templates, you can create presentations for a variety of purposes while simultaneously providing your audience with an eye-catching visual experience. Download Reasons Why Businesses Require Prescriptive Analytics Data Analytics SS V to deliver an impeccable presentation. These templates will make your job of preparing presentations much quicker, yet still, maintain a high level of quality. Slidegeeks has experienced researchers who prepare these templates and write high-quality content for you. Later on, you can personalize the content by editing the Reasons Why Businesses Require Prescriptive Analytics Data Analytics SS V. This slide outlines major arguments explaining requirements of business enterprises to leverage prescriptive analytics aimed at helping the same boost processes. It covers arguments such as fast ROI, streamlined decision making, scenario evaluation, etc.
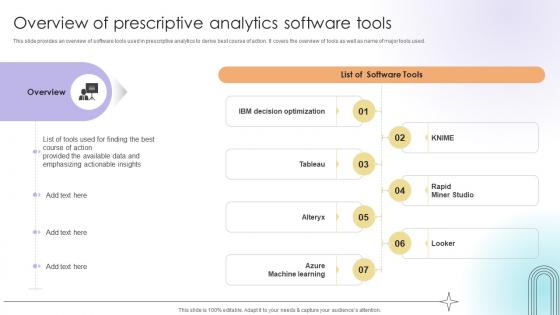
Overview Of Prescriptive Analytics Software Tools Data Analytics SS V
This slide provides an overview of software tools used in prescriptive analytics to derive best course of action. It covers the overview of tools as well as name of major tools used.Formulating a presentation can take up a lot of effort and time, so the content and message should always be the primary focus. The visuals of the PowerPoint can enhance the presenters message, so our Overview Of Prescriptive Analytics Software Tools Data Analytics SS V was created to help save time. Instead of worrying about the design, the presenter can concentrate on the message while our designers work on creating the ideal templates for whatever situation is needed. Slidegeeks has experts for everything from amazing designs to valuable content, we have put everything into Overview Of Prescriptive Analytics Software Tools Data Analytics SS V. This slide provides an overview of software tools used in prescriptive analytics to derive best course of action. It covers the overview of tools as well as name of major tools used.

Segmentation Of Global Prescriptive Analytics Market Data Analytics SS V
This slide provides an overview of market segmentation of prescriptive analytics at a global level. It covers segmentation analysis based on region, data type, component and deployment with key takeaways.Take your projects to the next level with our ultimate collection of Segmentation Of Global Prescriptive Analytics Market Data Analytics SS V. Slidegeeks has designed a range of layouts that are perfect for representing task or activity duration, keeping track of all your deadlines at a glance. Tailor these designs to your exact needs and give them a truly corporate look with your own brand colors they will make your projects stand out from the rest This slide provides an overview of market segmentation of prescriptive analytics at a global level. It covers segmentation analysis based on region, data type, component and deployment with key takeaways.
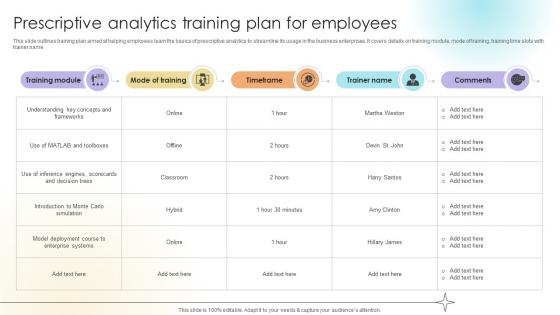
Prescriptive Analytics Training Plan For Employees Data Analytics SS V
This slide outlines training plan aimed at helping employees learn the basics of prescriptive analytics to streamline its usage in the business enterprises. It covers details on training module, mode of training, training time slots with trainer name.Slidegeeks has constructed Prescriptive Analytics Training Plan For Employees Data Analytics SS V after conducting extensive research and examination. These presentation templates are constantly being generated and modified based on user preferences and critiques from editors. Here, you will find the most attractive templates for a range of purposes while taking into account ratings and remarks from users regarding the content. This is an excellent jumping-off point to explore our content and will give new users an insight into our top-notch PowerPoint Templates. This slide outlines training plan aimed at helping employees learn the basics of prescriptive analytics to streamline its usage in the business enterprises. It covers details on training module, mode of training, training time slots with trainer name.

Graph Illustrating Impact Of Prescriptive Analytics Data Analytics SS V
This slide showcases graph highlighting impact analysis of prescriptive analytics on businesses via use of major performance indicators. It provides information total revenue, inventory levels and labour costs with key insights.Take your projects to the next level with our ultimate collection of Graph Illustrating Impact Of Prescriptive Analytics Data Analytics SS V. Slidegeeks has designed a range of layouts that are perfect for representing task or activity duration, keeping track of all your deadlines at a glance. Tailor these designs to your exact needs and give them a truly corporate look with your own brand colors they will make your projects stand out from the rest This slide showcases graph highlighting impact analysis of prescriptive analytics on businesses via use of major performance indicators. It provides information total revenue, inventory levels and labour costs with key insights.
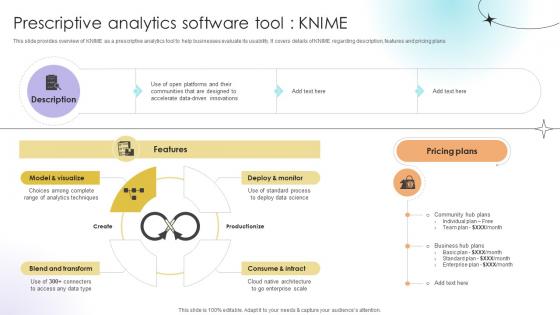
Prescriptive Analytics Software Tool Knime Data Analytics SS V
This slide provides overview of KNIME as a prescriptive analytics tool to help businesses evaluate its usability. It covers details of KNIME regarding description, features and pricing plans.The Prescriptive Analytics Software Tool Knime Data Analytics SS V is a compilation of the most recent design trends as a series of slides. It is suitable for any subject or industry presentation, containing attractive visuals and photo spots for businesses to clearly express their messages. This template contains a variety of slides for the user to input data, such as structures to contrast two elements, bullet points, and slides for written information. Slidegeeks is prepared to create an impression. This slide provides overview of KNIME as a prescriptive analytics tool to help businesses evaluate its usability. It covers details of KNIME regarding description, features and pricing plans.
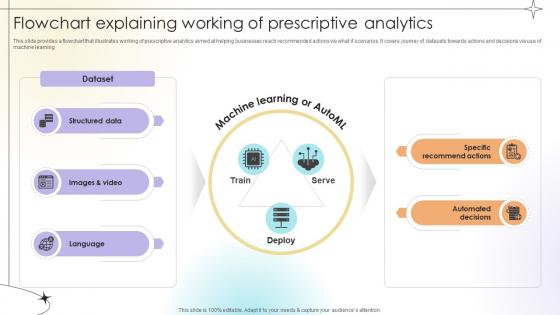
Flowchart Explaining Working Of Prescriptive Analytics Data Analytics SS V
This slide provides a flowchart that illustrates working of prescriptive analytics aimed at helping businesses reach recommended actions via what if scenarios. It covers journey of datasets towards actions and decisions via use of machine learning.This Flowchart Explaining Working Of Prescriptive Analytics Data Analytics SS V from Slidegeeks makes it easy to present information on your topic with precision. It provides customization options, so you can make changes to the colors, design, graphics, or any other component to create a unique layout. It is also available for immediate download, so you can begin using it right away. Slidegeeks has done good research to ensure that you have everything you need to make your presentation stand out. Make a name out there for a brilliant performance. This slide provides a flowchart that illustrates working of prescriptive analytics aimed at helping businesses reach recommended actions via what if scenarios. It covers journey of datasets towards actions and decisions via use of machine learning.

Advantages Of Leveraging Heuristics Analytics Data Analytics SS V
This slide outlines key advantages of leveraging heuristic analysis aimed at helping businesses improve decision making. It covers the benefits such as faster decisions, decisions with limited information and identification of errors Find a pre-designed and impeccable Advantages Of Leveraging Heuristics Analytics Data Analytics SS V. The templates can ace your presentation without additional effort. You can download these easy-to-edit presentation templates to make your presentation stand out from others. So, what are you waiting for Download the template from Slidegeeks today and give a unique touch to your presentation. This slide outlines key advantages of leveraging heuristic analysis aimed at helping businesses improve decision making. It covers the benefits such as faster decisions, decisions with limited information and identification of errors
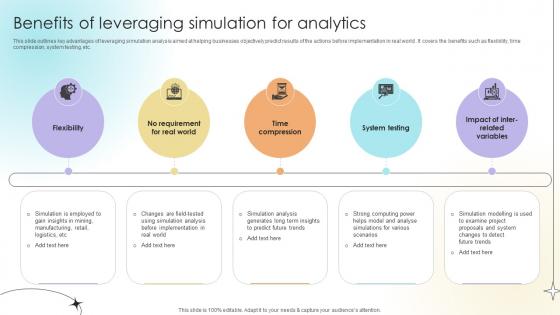
Benefits Of Leveraging Simulation For Analytics Data Analytics SS V
This slide outlines key advantages of leveraging simulation analysis aimed at helping businesses objectively predict results of the actions before implementation in real world . It covers the benefits such as flexibility, time compression, system testing, etc. This modern and well-arranged Benefits Of Leveraging Simulation For Analytics Data Analytics SS V provides lots of creative possibilities. It is very simple to customize and edit with the Powerpoint Software. Just drag and drop your pictures into the shapes. All facets of this template can be edited with Powerpoint, no extra software is necessary. Add your own material, put your images in the places assigned for them, adjust the colors, and then you can show your slides to the world, with an animated slide included. This slide outlines key advantages of leveraging simulation analysis aimed at helping businesses objectively predict results of the actions before implementation in real world . It covers the benefits such as flexibility, time compression, system testing, etc.
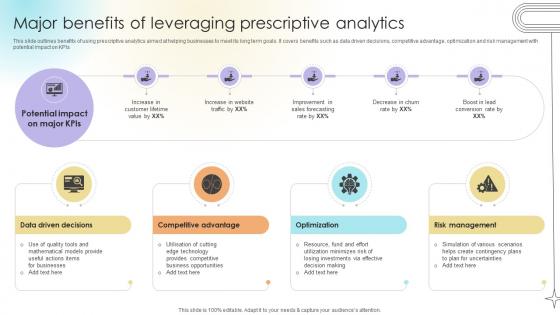
Major Benefits Of Leveraging Prescriptive Analytics Data Analytics SS V
This slide outlines benefits of using prescriptive analytics aimed at helping businesses to meet its long term goals. It covers benefits such as data driven decisions, competitive advantage, optimization and risk management with potential impact on KPIs.Are you in need of a template that can accommodate all of your creative concepts This one is crafted professionally and can be altered to fit any style. Use it with Google Slides or PowerPoint. Include striking photographs, symbols, depictions, and other visuals. Fill, move around, or remove text boxes as desired. Test out color palettes and font mixtures. Edit and save your work, or work with colleagues. Download Major Benefits Of Leveraging Prescriptive Analytics Data Analytics SS V and observe how to make your presentation outstanding. Give an impeccable presentation to your group and make your presentation unforgettable. This slide outlines benefits of using prescriptive analytics aimed at helping businesses to meet its long term goals. It covers benefits such as data driven decisions, competitive advantage, optimization and risk management with potential impact on KPIs.
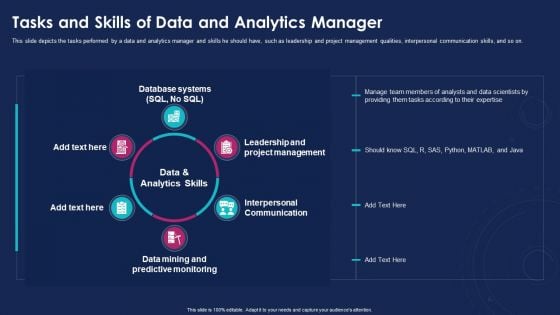
Data Analytics IT Tasks And Skills Of Data And Analytics Manager Ppt Gallery Influencers PDF
This slide depicts the tasks performed by a data and analytics manager and skills he should have, such as leadership and project management qualities, interpersonal communication skills, and so on. This is a data analytics it tasks and skills of data and analytics manager ppt gallery influencers pdf template with various stages. Focus and dispense information on six stages using this creative set, that comes with editable features. It contains large content boxes to add your information on topics like data mining and predictive monitoring, interpersonal communication, leadership and project management, database systems. You can also showcase facts, figures, and other relevant content using this PPT layout. Grab it now.
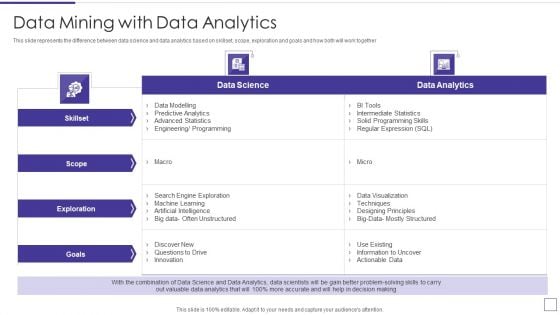
Data Mining Implementation Data Mining With Data Analytics Structure PDF
This slide represents the difference between data science and data analytics based on skillset, scope, exploration and goals and how both will work together Deliver and pitch your topic in the best possible manner with this data mining implementation data mining with data analytics structure pdf Use them to share invaluable insights on advanced statistics, predictive analytics, data modelling and impress your audience. This template can be altered and modified as per your expectations. So, grab it now.
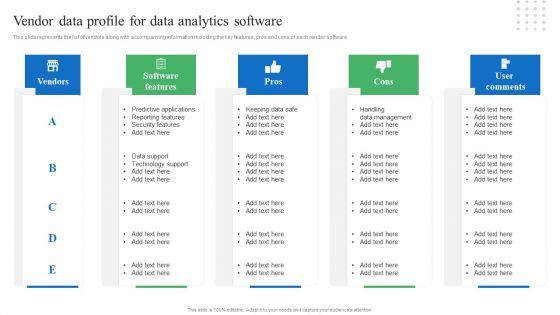
Toolkit For Data Science And Analytics Transition Vendor Data Profile For Data Analytics Software Infographics PDF
This slide represents the list of vendors along with accompanying information including the key features, pros and cons of each vendor software. If your project calls for a presentation, then Slidegeeks is your go to partner because we have professionally designed, easy to edit templates that are perfect for any presentation. After downloading, you can easily edit Toolkit For Data Science And Analytics Transition Vendor Data Profile For Data Analytics Software Infographics PDF and make the changes accordingly. You can rearrange slides or fill them with different images. Check out all the handy templates.
Data Science Big Data Analytics Ppt PowerPoint Presentation Gallery Shapes
This is a data science big data analytics ppt powerpoint presentation gallery shapes. This is a six stage process. The stages in this process are data science big data analytics.
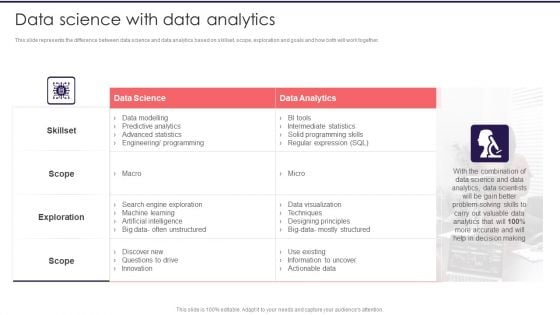
Information Studies Data Science With Data Analytics Background PDF
This slide represents the difference between data science and data analytics based on skillset, scope, exploration and goals and how both will work together. Deliver an awe inspiring pitch with this creative Information Studies Data Science With Data Analytics Background PDF bundle. Topics like Data Science, Data Analytics, Data Visualization can be discussed with this completely editable template. It is available for immediate download depending on the needs and requirements of the user.

Data Democratization Challenges In Product Data Analytics Ideas Pdf
This slide represents the data democratization challenges for product data analytics with relevant mitigation strategies. These challenges include challenges like complication of data analytics architecture, lack of data centralization, etc. Showcasing this set of slides titled Data Democratization Challenges In Product Data Analytics Ideas Pdf. The topics addressed in these templates are Data Privacy And Security, Data Literacy , Data Reliability And Homogeneity. All the content presented in this PPT design is completely editable. Download it and make adjustments in color, background, font etc. as per your unique business setting. This slide represents the data democratization challenges for product data analytics with relevant mitigation strategies. These challenges include challenges like complication of data analytics architecture, lack of data centralization, etc.
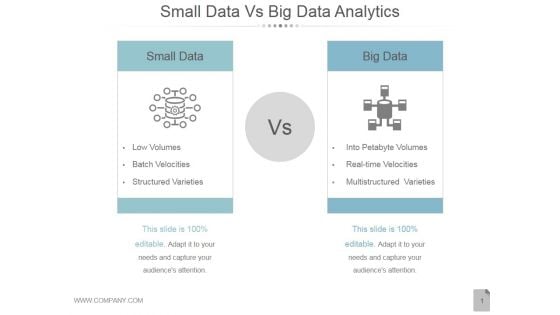
Small Data Vs Big Data Analytics Ppt PowerPoint Presentation Influencers
This is a small data vs big data analytics ppt powerpoint presentation influencers. This is a two stage process. The stages in this process are small data, big data.

Data Science With Data Analytics Ppt Outline Design Templates PDF
Deliver and pitch your topic in the best possible manner with this data science with data analytics ppt outline design templates pdf. Use them to share invaluable insights on data science, data analytics and impress your audience. This template can be altered and modified as per your expectations. So, grab it now.
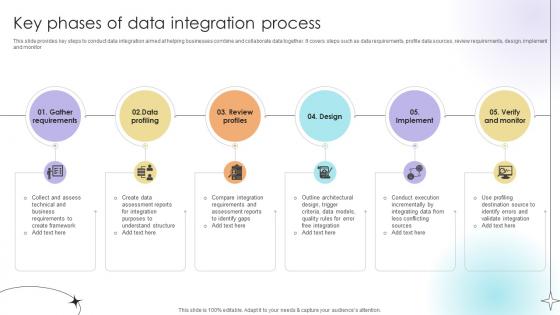
Key Phases Of Data Integration Process Data Analytics SS V
This slide provides key steps to conduct data integration aimed at helping businesses combine and collaborate data together. It covers steps such as data requirements, profile data sources, review requirements, design, implement and monitor.Slidegeeks is here to make your presentations a breeze with Key Phases Of Data Integration Process Data Analytics SS V With our easy-to-use and customizable templates, you can focus on delivering your ideas rather than worrying about formatting. With a variety of designs to choose from, you are sure to find one that suits your needs. And with animations and unique photos, illustrations, and fonts, you can make your presentation pop. So whether you are giving a sales pitch or presenting to the board, make sure to check out Slidegeeks first This slide provides key steps to conduct data integration aimed at helping businesses combine and collaborate data together. It covers steps such as data requirements, profile data sources, review requirements, design, implement and monitor.


 Continue with Email

 Home
Home


