data analytics
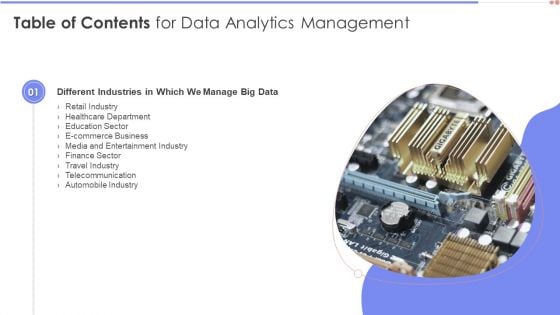
Table Of Contents For Data Analytics Management Slide Elements PDF
This is a Table Of Contents For Data Analytics Management Slide Elements PDF template with various stages. Focus and dispense information on one stage using this creative set, that comes with editable features. It contains large content boxes to add your information on topics like Different Industries, Healthcare Department, Entertainment Industry. You can also showcase facts, figures, and other relevant content using this PPT layout. Grab it now.
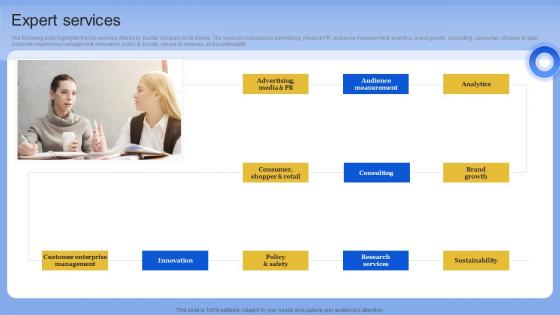
Expert Services Data Analytics Company Outline Elements PDF
The following slide highlights the top services offered by Kantar company to its clients. The services included are advertising, media and PR, audience measurement, analytics, brand growth, consulting, consumer, shopper and retail, customer experience management, innovation, policy and society, research services, and sustainability. Whether you have daily or monthly meetings, a brilliant presentation is necessary. Expert Services Data Analytics Company Outline Elements PDF can be your best option for delivering a presentation. Represent everything in detail using Expert Services Data Analytics Company Outline Elements PDF and make yourself stand out in meetings. The template is versatile and follows a structure that will cater to your requirements. All the templates prepared by Slidegeeks are easy to download and edit. Our research experts have taken care of the corporate themes as well. So, give it a try and see the results. The following slide highlights the top services offered by Kantar company to its clients. The services included are advertising, media and PR, audience measurement, analytics, brand growth, consulting, consumer, shopper and retail, customer experience management, innovation, policy and society, research services, and sustainability
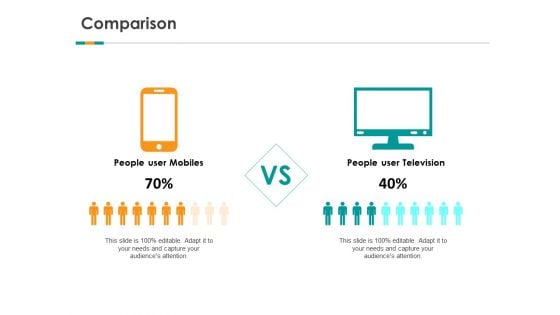
Big Data Analytics Comparison Technology Ppt Summary Rules PDF
This is a big data analytics comparison technology ppt summary rules pdf template with various stages. Focus and dispense information on two stages using this creative set, that comes with editable features. It contains large content boxes to add your information on topics like people user, comparison, audiences attention. You can also showcase facts, figures, and other relevant content using this PPT layout. Grab it now.
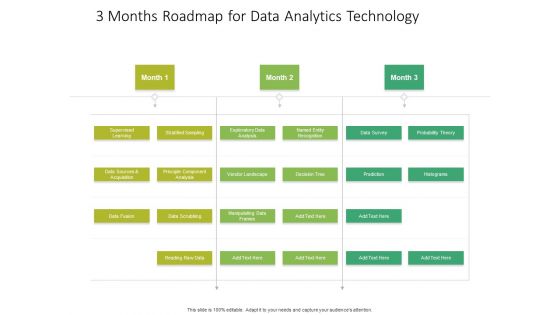
3 Months Roadmap For Data Analytics Technology Infographics
Presenting our jaw-dropping 3 months roadmap for data analytics technology infographics. You can alternate the color, font size, font type, and shapes of this PPT layout according to your strategic process. This PPT presentation is compatible with Google Slides and is available in both standard screen and widescreen aspect ratios. You can also download this well-researched PowerPoint template design in different formats like PDF, JPG, and PNG. So utilize this visually-appealing design by clicking the download button given below.
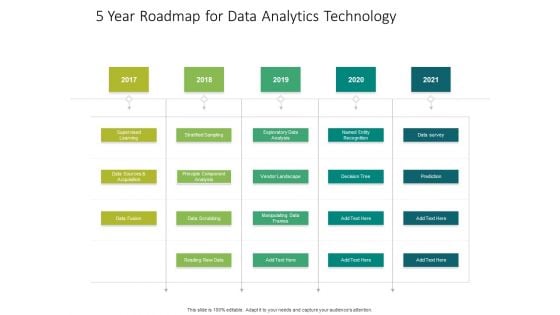
5 Year Roadmap For Data Analytics Technology Microsoft
Presenting our jaw-dropping 5 year roadmap for data analytics technology microsoft. You can alternate the color, font size, font type, and shapes of this PPT layout according to your strategic process. This PPT presentation is compatible with Google Slides and is available in both standard screen and widescreen aspect ratios. You can also download this well-researched PowerPoint template design in different formats like PDF, JPG, and PNG. So utilize this visually-appealing design by clicking the download button given below.

Big Data Analytics Financial Euro Dollar Ppt Gallery Model PDF
This is a big data analytics financial euro dollar ppt gallery model pdf template with various stages. Focus and dispense information on three stages using this creative set, that comes with editable features. It contains large content boxes to add your information on topics like dollar, rupees, euro. You can also showcase facts, figures, and other relevant content using this PPT layout. Grab it now.
Data Analytics In Banking With Icons Ppt File Summary PDF
Presenting data analytics in banking with icons ppt file summary pdf to provide visual cues and insights. Share and navigate important information on six stages that need your due attention. This template can be used to pitch topics like product management, marketing, operations and execution, risk and compliance. In addition, this PPT design contains high-resolution images, graphics, etc, that are easily editable and available for immediate download.
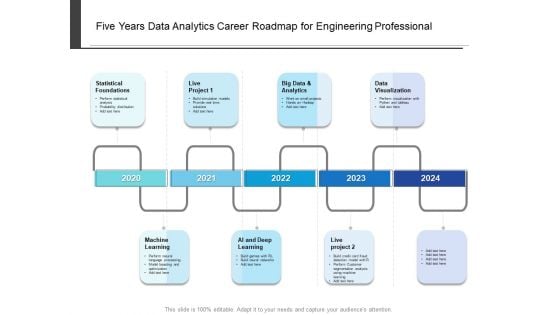
Five Years Data Analytics Career Roadmap For Engineering Professional Introduction
Presenting our innovatively-structured five years data analytics career roadmap for engineering professional introduction Template. Showcase your roadmap process in different formats like PDF, PNG, and JPG by clicking the download button below. This PPT design is available in both Standard Screen and Widescreen aspect ratios. It can also be easily personalized and presented with modified font size, font type, color, and shapes to measure your progress in a clear way.
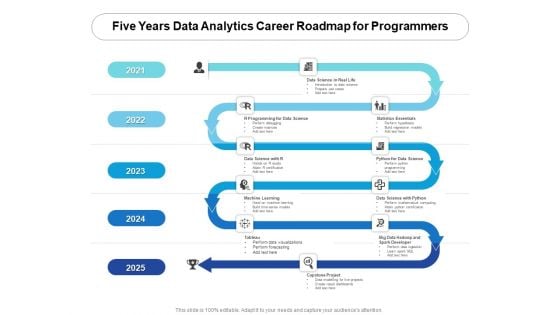
Five Years Data Analytics Career Roadmap For Programmers Pictures
Introducing our five years data analytics career roadmap for programmers pictures. This PPT presentation is Google Slides compatible, therefore, you can share it easily with the collaborators for measuring the progress. Also, the presentation is available in both standard screen and widescreen aspect ratios. So edit the template design by modifying the font size, font type, color, and shapes as per your requirements. As this PPT design is fully editable it can be presented in PDF, JPG and PNG formats.
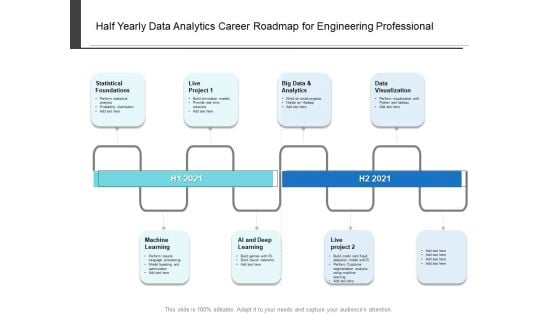
Half Yearly Data Analytics Career Roadmap For Engineering Professional Themes
Presenting our innovatively-structured half yearly data analytics career roadmap for engineering professional themes Template. Showcase your roadmap process in different formats like PDF, PNG, and JPG by clicking the download button below. This PPT design is available in both Standard Screen and Widescreen aspect ratios. It can also be easily personalized and presented with modified font size, font type, color, and shapes to measure your progress in a clear way.
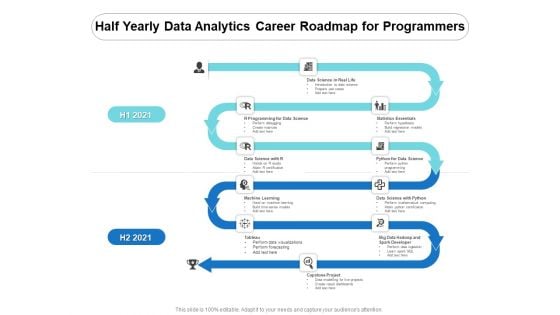
Half Yearly Data Analytics Career Roadmap For Programmers Demonstration
Introducing our half yearly data analytics career roadmap for programmers demonstration. This PPT presentation is Google Slides compatible, therefore, you can share it easily with the collaborators for measuring the progress. Also, the presentation is available in both standard screen and widescreen aspect ratios. So edit the template design by modifying the font size, font type, color, and shapes as per your requirements. As this PPT design is fully editable it can be presented in PDF, JPG and PNG formats.
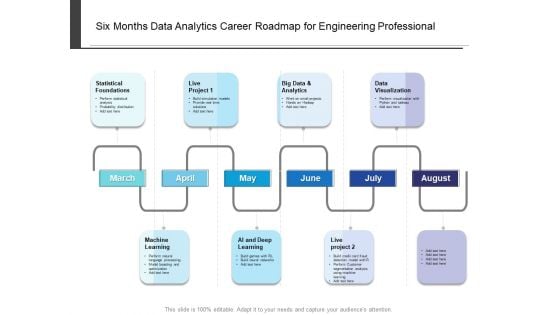
Six Months Data Analytics Career Roadmap For Engineering Professional Mockup
Presenting our innovatively-structured six months data analytics career roadmap for engineering professional mockup Template. Showcase your roadmap process in different formats like PDF, PNG, and JPG by clicking the download button below. This PPT design is available in both Standard Screen and Widescreen aspect ratios. It can also be easily personalized and presented with modified font size, font type, color, and shapes to measure your progress in a clear way.

Six Months Data Analytics Career Roadmap For Programmers Demonstration
Introducing our six months data analytics career roadmap for programmers demonstration. This PPT presentation is Google Slides compatible, therefore, you can share it easily with the collaborators for measuring the progress. Also, the presentation is available in both standard screen and widescreen aspect ratios. So edit the template design by modifying the font size, font type, color, and shapes as per your requirements. As this PPT design is fully editable it can be presented in PDF, JPG and PNG formats.
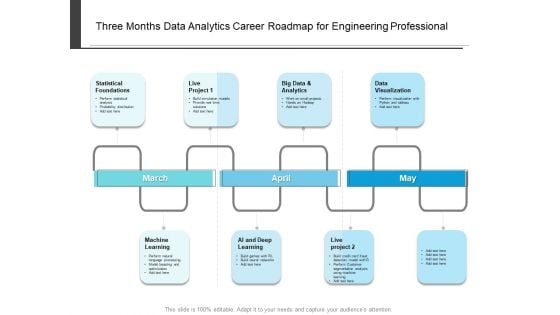
Three Months Data Analytics Career Roadmap For Engineering Professional Designs
Presenting our innovatively-structured three months data analytics career roadmap for engineering professional designs Template. Showcase your roadmap process in different formats like PDF, PNG, and JPG by clicking the download button below. This PPT design is available in both Standard Screen and Widescreen aspect ratios. It can also be easily personalized and presented with modified font size, font type, color, and shapes to measure your progress in a clear way.
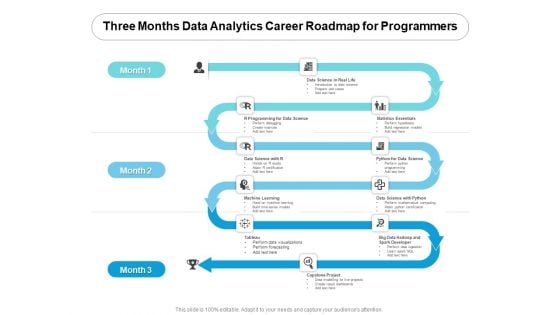
Three Months Data Analytics Career Roadmap For Programmers Rules
Introducing our three months data analytics career roadmap for programmers rules. This PPT presentation is Google Slides compatible, therefore, you can share it easily with the collaborators for measuring the progress. Also, the presentation is available in both standard screen and widescreen aspect ratios. So edit the template design by modifying the font size, font type, color, and shapes as per your requirements. As this PPT design is fully editable it can be presented in PDF, JPG and PNG formats.
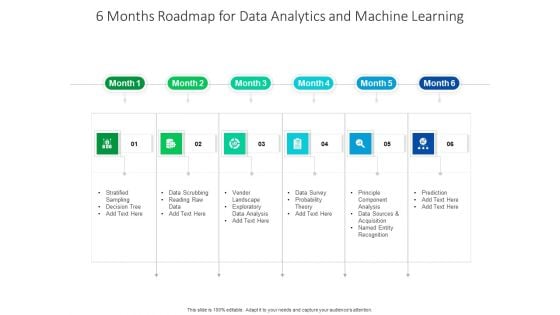
6 Months Roadmap For Data Analytics And Machine Learning Rules
Introducing our 6 months roadmap for data analytics and machine learning rules. This PPT presentation is Google Slides compatible, therefore, you can share it easily with the collaborators for measuring the progress. Also, the presentation is available in both standard screen and widescreen aspect ratios. So edit the template design by modifying the font size, font type, color, and shapes as per your requirements. As this PPT design is fully editable it can be presented in PDF, JPG and PNG formats.
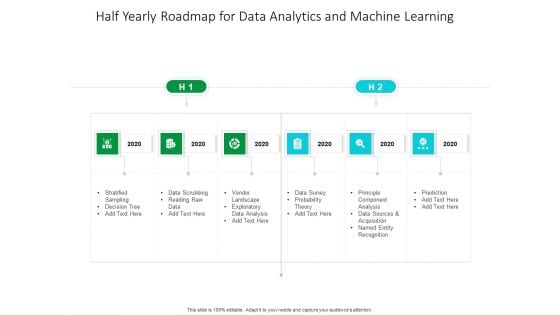
Half Yearly Roadmap For Data Analytics And Machine Learning Diagrams
Introducing our half yearly roadmap for data analytics and machine learning diagrams. This PPT presentation is Google Slides compatible, therefore, you can share it easily with the collaborators for measuring the progress. Also, the presentation is available in both standard screen and widescreen aspect ratios. So edit the template design by modifying the font size, font type, color, and shapes as per your requirements. As this PPT design is fully editable it can be presented in PDF, JPG and PNG formats.
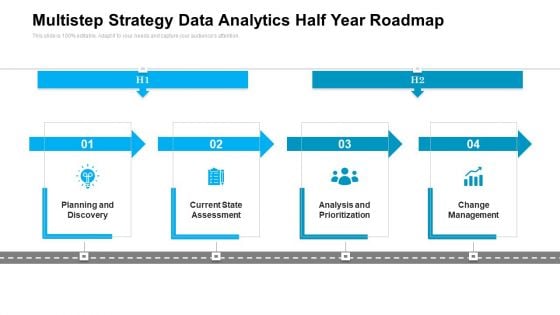
Multistep Strategy Data Analytics Half Year Roadmap Summary
Introducing our multistep strategy data analytics half year roadmap summary. This PPT presentation is Google Slides compatible, therefore, you can share it easily with the collaborators for measuring the progress. Also, the presentation is available in both standard screen and widescreen aspect ratios. So edit the template design by modifying the font size, font type, color, and shapes as per your requirements. As this PPT design is fully editable it can be presented in PDF, JPG and PNG formats.
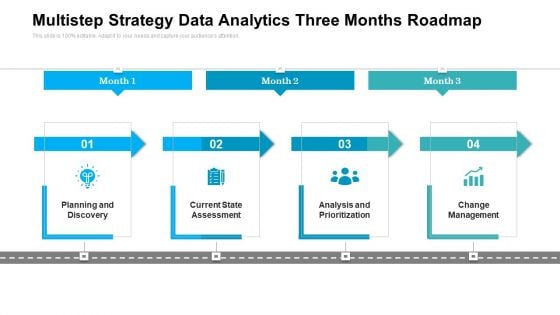
Multistep Strategy Data Analytics Three Months Roadmap Mockup
Presenting our jaw dropping multistep strategy data analytics three months roadmap mockup. You can alternate the color, font size, font type, and shapes of this PPT layout according to your strategic process. This PPT presentation is compatible with Google Slides and is available in both standard screen and widescreen aspect ratios. You can also download this well researched PowerPoint template design in different formats like PDF, JPG, and PNG. So utilize this visually appealing design by clicking the download button given below.
Playbook For Business Intelligence And Data Analytics Implementations Template
Are you tired of boring presentations that fail to captivate your audience Look no further than our Playbook For Business Intelligence And Data Analytics Implementations Template. It is designed to impress and capture attention. With 100 percent editable slides and visually-stunning graphics, you will be able to create presentations that wow. Do not settle for mediocrity, elevate your game with our A4 Playbook PPT Template.
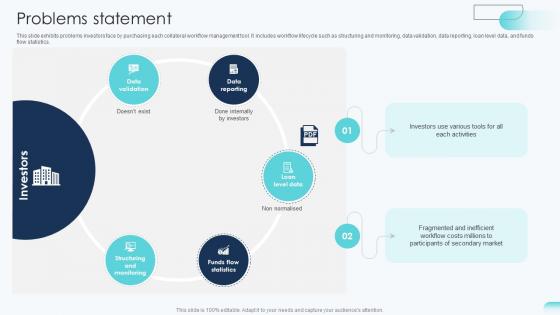
Problems Statement Big Data Analytics Investor Funding Elevator Pitch Deck
This slide exhibits problems investors face by purchasing each collateral workflow management tool. It includes workflow lifecycle such as structuring and monitoring, data validation, data reporting, loan level data, and funds flow statistics. Formulating a presentation can take up a lot of effort and time, so the content and message should always be the primary focus. The visuals of the PowerPoint can enhance the presenters message, so our Problems Statement Big Data Analytics Investor Funding Elevator Pitch Deck was created to help save time. Instead of worrying about the design, the presenter can concentrate on the message while our designers work on creating the ideal templates for whatever situation is needed. Slidegeeks has experts for everything from amazing designs to valuable content, we have put everything into Problems Statement Big Data Analytics Investor Funding Elevator Pitch Deck. This slide exhibits problems investors face by purchasing each collateral workflow management tool. It includes workflow lifecycle such as structuring and monitoring, data validation, data reporting, loan level data, and funds flow statistics.
Icons Slide Data Analytics Company Outline Sample PDF
Introducing our well designed Icons Slide Data Analytics Company Outline Sample PDF set of slides. The slide displays editable icons to enhance your visual presentation. The icons can be edited easily. So customize according to your business to achieve a creative edge. Download and share it with your audience. The following slide highlights the list of industries that are served by kantar company to provide expert services as research and consulting firm. The industries included are automotive and mobility, consumer packaged goods, energy and utilities, fashion, beauty and luxury, finance, government and public sector, health, hospitality, leisure and travel media, retail, sport and leisure and technology and telecoms.

Consumer Packaged Goods Industry Data Analytics Company Outline Mockup PDF
The following slide highlights the research services offered by Kantar company to the consumer packaged goods industry. It also shows the clients and impact of solutions provided. There are so many reasons you need a Consumer Packaged Goods Industry Data Analytics Company Outline Mockup PDF The first reason is you can not spend time making everything from scratch, Thus, Slidegeeks has made presentation templates for you too. You can easily download these templates from our website easily. The following slide highlights the research services offered by Kantar company to the consumer packaged goods industry. It also shows the clients and impact of solutions provided.

Product Data Analytics Ppt PowerPoint Presentation Complete Deck With Slides
If designing a presentation takes a lot of your time and resources and you are looking for a better alternative, then this Product Data Analytics Ppt PowerPoint Presentation Complete Deck With Slides is the right fit for you. This is a prefabricated set that can help you deliver a great presentation on the topic. All the twenty slides included in this sample template can be used to present a birds eye view of the topic. These slides are also fully editable, giving you enough freedom to add specific details to make this layout more suited to your business setting. Apart from the content, all other elements like color, design, theme are also replaceable and editable. This helps in designing a variety of presentations with a single layout. Not only this, you can use this PPT design in formats like PDF, PNG, and JPG once downloaded. Therefore, without any further ado, download and utilize this sample presentation as per your liking. Our Product Data Analytics Ppt PowerPoint Presentation Complete Deck With Slides are topically designed to provide an attractive backdrop to any subject. Use them to look like a presentation pro.
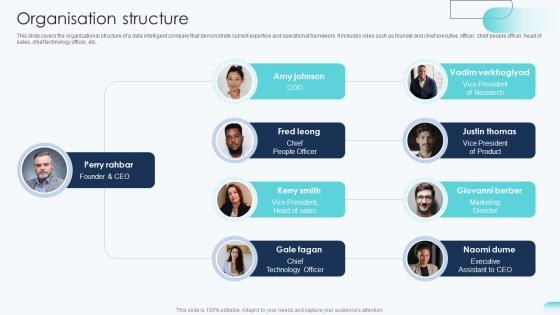
Organisation Structure Big Data Analytics Investor Funding Elevator Pitch Deck
This slide covers the organizational structure of a data intelligent company that demonstrate current expertise and operational framework. It includes roles such as founder and chief executive officer, chief people officer, head of sales, chief technology officer, etc. Crafting an eye-catching presentation has never been more straightforward. Let your presentation shine with this tasteful yet straightforward Organisation Structure Big Data Analytics Investor Funding Elevator Pitch Deck template. It offers a minimalistic and classy look that is great for making a statement. The colors have been employed intelligently to add a bit of playfulness while still remaining professional. Construct the ideal Organisation Structure Big Data Analytics Investor Funding Elevator Pitch Deck that effortlessly grabs the attention of your audience Begin now and be certain to wow your customers This slide covers the organizational structure of a data intelligent company that demonstrate current expertise and operational framework. It includes roles such as founder and chief executive officer, chief people officer, head of sales, chief technology officer, etc.
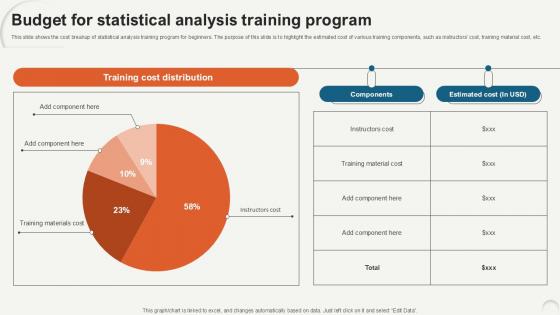
Budget For Statistical Data Analytics For Informed Decision Ppt Slide
This slide shows the cost breakup of statistical analysis training program for beginners. The purpose of this slide is to highlight the estimated cost of various training components, such as instructors cost, training material cost, etc. Do you have to make sure that everyone on your team knows about any specific topic I yes, then you should give Budget For Statistical Data Analytics For Informed Decision Ppt Slide a try. Our experts have put a lot of knowledge and effort into creating this impeccable Budget For Statistical Data Analytics For Informed Decision Ppt Slide. You can use this template for your upcoming presentations, as the slides are perfect to represent even the tiniest detail. You can download these templates from the Slidegeeks website and these are easy to edit. So grab these today This slide shows the cost breakup of statistical analysis training program for beginners. The purpose of this slide is to highlight the estimated cost of various training components, such as instructors cost, training material cost, etc.

Key Steps To Conduct Heuristic Analysis Data Analytics SS V
This slide outlines major steps to conduct heuristics analysis aimed at helping businesses conduct evaluation and generate meaningful changes. It covers steps such as define analysis scope, end user knowledge, define heuristics, choose reporting style, set up scoring system and analyze.Do you have an important presentation coming up Are you looking for something that will make your presentation stand out from the rest Look no further than Key Steps To Conduct Heuristic Analysis Data Analytics SS V. With our professional designs, you can trust that your presentation will pop and make delivering it a smooth process. And with Slidegeeks, you can trust that your presentation will be unique and memorable. So why wait Grab Key Steps To Conduct Heuristic Analysis Data Analytics SS V today and make your presentation stand out from the rest This slide outlines major steps to conduct heuristics analysis aimed at helping businesses conduct evaluation and generate meaningful changes. It covers steps such as define analysis scope, end user knowledge, define heuristics, choose reporting style, set up scoring system and analyze.
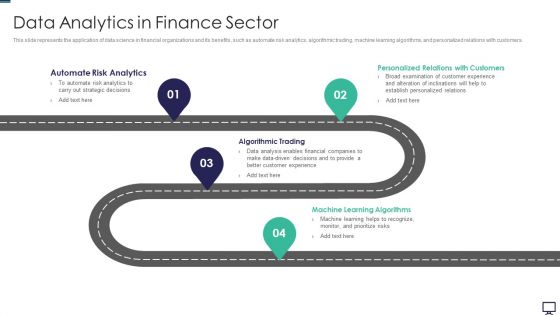
Data Analytics In Finance Sector Ppt Pictures Mockup PDF
This slide represents the application of data science in financial organizations and its benefits, such as automate risk analytics, algorithmic trading, machine learning algorithms, and personalized relations with customers. This is a data analytics in finance sector ppt pictures mockup pdf template with various stages. Focus and dispense information on four stages using this creative set, that comes with editable features. It contains large content boxes to add your information on topics like customer, strategic, analytics. You can also showcase facts, figures, and other relevant content using this PPT layout. Grab it now.
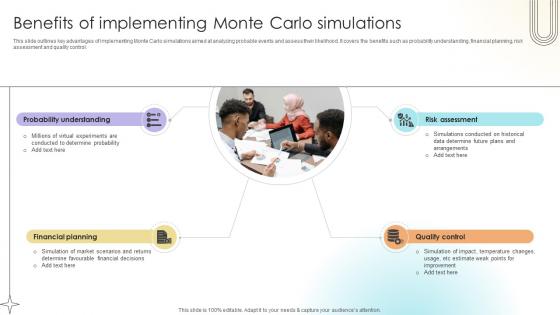
Benefits Of Implementing Monte Carlo Simulations Data Analytics SS V
This slide outlines key advantages of implementing Monte Carlo simulations aimed at analyzing probable events and assess their likelihood. It covers the benefits such as probability understanding, financial planning, risk assessment and quality control. Formulating a presentation can take up a lot of effort and time, so the content and message should always be the primary focus. The visuals of the PowerPoint can enhance the presenters message, so our Benefits Of Implementing Monte Carlo Simulations Data Analytics SS V was created to help save time. Instead of worrying about the design, the presenter can concentrate on the message while our designers work on creating the ideal templates for whatever situation is needed. Slidegeeks has experts for everything from amazing designs to valuable content, we have put everything into Benefits Of Implementing Monte Carlo Simulations Data Analytics SS V. This slide outlines key advantages of implementing Monte Carlo simulations aimed at analyzing probable events and assess their likelihood. It covers the benefits such as probability understanding, financial planning, risk assessment and quality control.
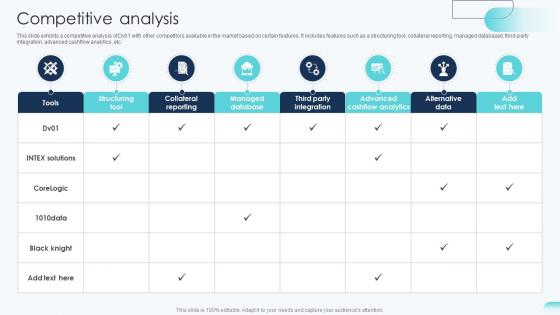
Competitive Analysis Big Data Analytics Investor Funding Elevator Pitch Deck
This slide exhibits a competitive analysis of Dv01 with other competitors available in the market based on certain features. It includes features such as a structuring tool, collateral reporting, managed databased, third-party integration, advanced cashflow analytics, etc. Want to ace your presentation in front of a live audience Our Competitive Analysis Big Data Analytics Investor Funding Elevator Pitch Deck can help you do that by engaging all the users towards you. Slidegeeks experts have put their efforts and expertise into creating these impeccable powerpoint presentations so that you can communicate your ideas clearly. Moreover, all the templates are customizable, and easy-to-edit and downloadable. Use these for both personal and commercial use. This slide exhibits a competitive analysis of Dv01 with other competitors available in the market based on certain features. It includes features such as a structuring tool, collateral reporting, managed databased, third-party integration, advanced cashflow analytics, etc.
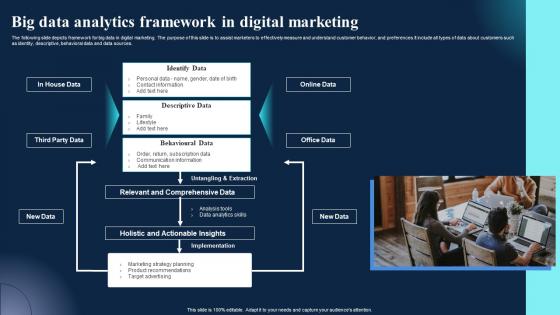
Big Data Analytics Framework In Digital Marketing Clipart Pdf
The following slide depicts framework for big data in digital marketing. The purpose of this slide is to assist marketers to effectively measure and understand customer behavior, and preferences.It include all types of data about customers such as identity, descriptive, behavioral data and data sources. Showcasing this set of slides titled Big Data Analytics Framework In Digital Marketing Clipart Pdf. The topics addressed in these templates are Online Data, Office Data, New Data. All the content presented in this PPT design is completely editable. Download it and make adjustments in color, background, font etc. as per your unique business setting. The following slide depicts framework for big data in digital marketing. The purpose of this slide is to assist marketers to effectively measure and understand customer behavior, and preferences.It include all types of data about customers such as identity, descriptive, behavioral data and data sources.
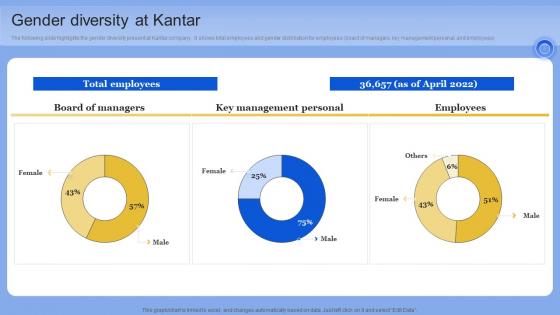
Gender Diversity At Kantar Data Analytics Company Outline Portrait PDF
The following slide highlights the gender diversity present at Kantar company. It shows total employees and gender distribution for employees board of managers, key management personal, and employees. If you are looking for a format to display your unique thoughts, then the professionally designed Gender Diversity At Kantar Data Analytics Company Outline Portrait PDF is the one for you. You can use it as a Google Slides template or a PowerPoint template. Incorporate impressive visuals, symbols, images, and other charts. Modify or reorganize the text boxes as you desire. Experiment with shade schemes and font pairings. Alter, share or cooperate with other people on your work. Download Gender Diversity At Kantar Data Analytics Company Outline Portrait PDF and find out how to give a successful presentation. Present a perfect display to your team and make your presentation unforgettable. The following slide highlights the gender diversity present at Kantar company. It shows total employees and gender distribution for employees board of managers, key management personal, and employees
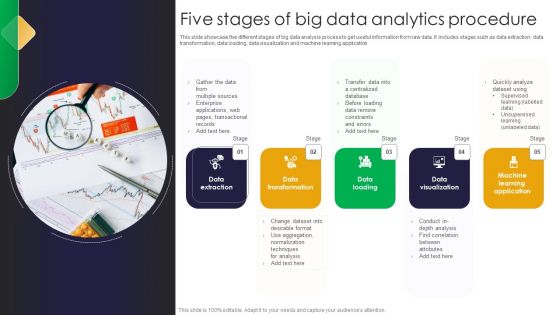
Five Stages Of Big Data Analytics Procedure Brochure PDF
This slide showcase five different stages of big data analysis process to get useful information from raw data. It includes stages such as data extraction, data transformation, data loading, data visualization and machine learning application Persuade your audience using this Five Stages Of Big Data Analytics Procedure Brochure PDF. This PPT design covers six stages, thus making it a great tool to use. It also caters to a variety of topics including Data Extraction, Data Transformation, Data Loading. Download this PPT design now to present a convincing pitch that not only emphasizes the topic but also showcases your presentation skills.
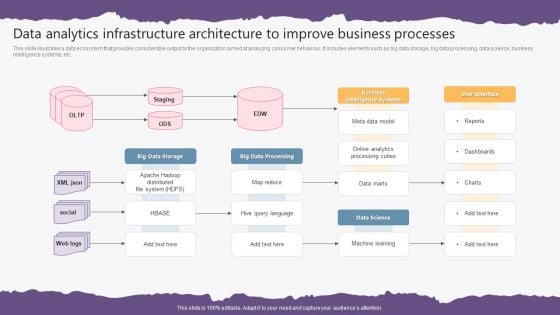
Data Analytics Infrastructure Architecture To Improve Business Processes Formats PDF
This slide illustrates a data ecosystem that provides considerable output to the organization aimed at analyzing consumer behaviour. It includes elements such as big data storage, big data processing, data science, business intelligence systems, etc. Pitch your topic with ease and precision using this Data Analytics Infrastructure Architecture To Improve Business Processes Formats PDF. This layout presents information on Big Data Storage, Big Data Processing, Business Intelligence Systems, Data Science, User Interface. It is also available for immediate download and adjustment. So, changes can be made in the color, design, graphics or any other component to create a unique layout.
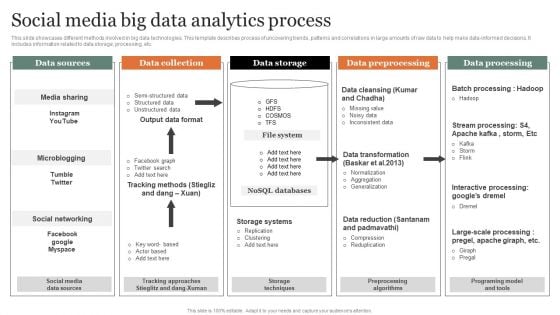
Social Media Big Data Analytics Process Diagrams PDF
This slide showcases different methods involved in big data technologies. This template describes process of uncovering trends, patterns and correlations in large amounts of raw data to help make data informed decisions. It includes information related to data storage, processing, etc. Showcasing this set of slides titled Social Media Big Data Analytics Process Diagrams PDF Microsoft. The topics addressed in these templates are Data Collection, Data Storage, Data Preprocessing. All the content presented in this PPT design is completely editable. Download it and make adjustments in color, background, font etc. as per your unique business setting.
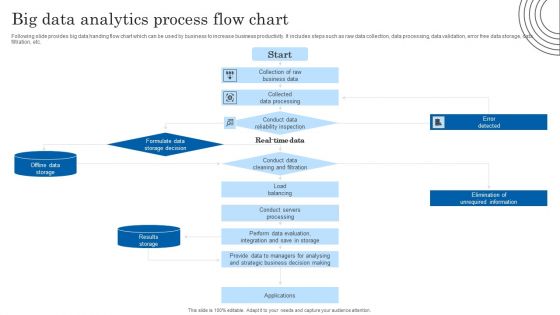
Big Data Analytics Process Flow Chart Topics PDF
Following slide provides big data handing flow chart which can be used by business to increase business productivity. It includes steps such as raw data collection, data processing, data validation, error free data storage, data filtration, etc. Showcasing this set of slides titled Big Data Analytics Process Flow Chart Topics PDF. The topics addressed in these templates are Conduct Data, Information, Evaluation. All the content presented in this PPT design is completely editable. Download it and make adjustments in color, background, font etc. as per your unique business setting.
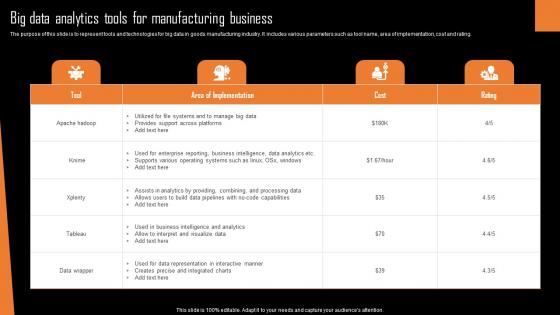
Big Data Analytics Tools For Manufacturing Business Professional Pdf
The purpose of this slide is to represent tools and technologies for big data in goods manufacturing industry. It includes various parameters such as tool name, area of implementation, cost and rating.Showcasing this set of slides titled Big Data Analytics Tools For Manufacturing Business Professional Pdf The topics addressed in these templates are Provides Support, Across Platforms, Analytics Providing All the content presented in this PPT design is completely editable. Download it and make adjustments in color, background, font etc. as per your unique business setting. The purpose of this slide is to represent tools and technologies for big data in goods manufacturing industry. It includes various parameters such as tool name, area of implementation, cost and rating.
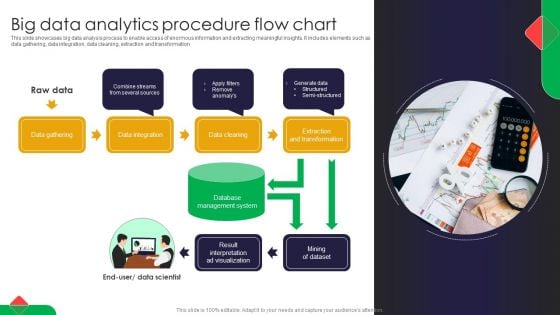
Big Data Analytics Procedure Flow Chart Portrait PDF
This slide showcases big data analysis process to enable access of enormous information and extracting meaningful insights. It includes elements such as data gathering, data integration, data cleaning, extraction and transformation Pitch your topic with ease and precision using this Big Data Analytics Procedure Flow Chart Portrait PDF. This layout presents information on Raw Data, Flow Chart, Big Data. It is also available for immediate download and adjustment. So, changes can be made in the color, design, graphics or any other component to create a unique layout.
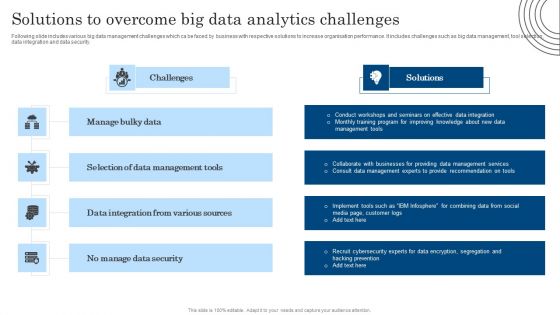
Solutions To Overcome Big Data Analytics Challenges Download PDF
Following slide includes various big data management challenges which ca be faced by business with respective solutions to increase organisation performance. It includes challenges such as big data management, tool selection, data integration and data security. Showcasing this set of slides titled Solutions To Overcome Big Data Analytics Challenges Download PDF. The topics addressed in these templates are Data Management Tools, Data Integration, Various Sources. All the content presented in this PPT design is completely editable. Download it and make adjustments in color, background, font etc. as per your unique business setting.
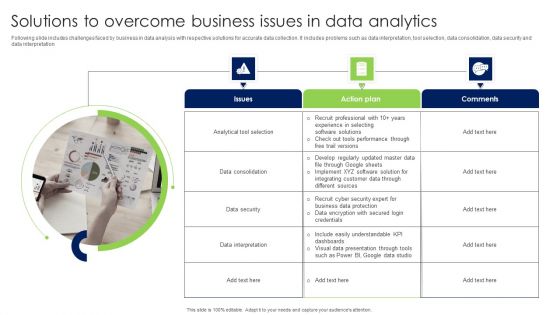
Solutions To Overcome Business Issues In Data Analytics Infographics PDF
Following slide includes challenges faced by business in data analysis with respective solutions for accurate data collection. It includes problems such as data interpretation, tool selection, data consolidation, data security and data interpretation Presenting Solutions To Overcome Business Issues In Data Analytics Infographics PDF to dispense important information. This template comprises Three stages. It also presents valuable insights into the topics including Issues, Action Plan, Comments. This is a completely customizable PowerPoint theme that can be put to use immediately. So, download it and address the topic impactfully.
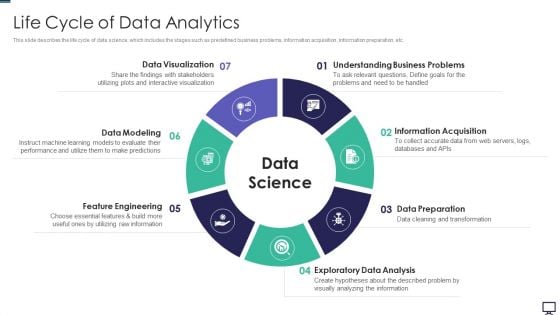
Life Cycle Of Data Analytics Ppt Slides Elements PDF
This slide describes the life cycle of data science, which includes the stages such as predefined business problems, information acquisition, information preparation, etc. This is a life cycle of data analytics ppt slides elements pdf template with various stages. Focus and dispense information on seven stages using this creative set, that comes with editable features. It contains large content boxes to add your information on topics like data visualization, data modeling, feature engineering, exploratory data analysis, data preparation, information acquisition. You can also showcase facts, figures, and other relevant content using this PPT layout. Grab it now.
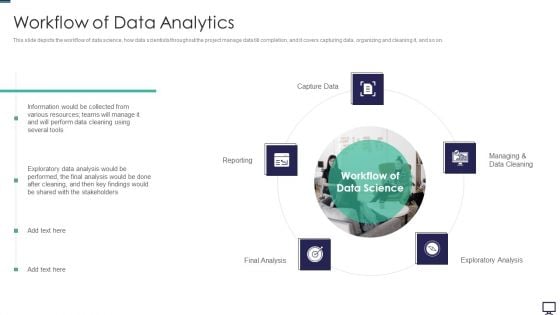
Workflow Of Data Analytics Ppt Styles Graphics Pictures PDF
This slide depicts the workflow of data science, how data scientists throughout the project manage data till completion, and it covers capturing data, organizing and cleaning it, and so on. Presenting workflow of data analytics ppt styles graphics pictures pdf to provide visual cues and insights. Share and navigate important information on five stages that need your due attention. This template can be used to pitch topics like teams, several, capture data, exploratory analysis. In addtion, this PPT design contains high resolution images, graphics, etc, that are easily editable and available for immediate download.
Critical Components Of Data Analytics Ppt Icon Rules PDF
This slide depicts the critical components of data science such as data, programming, statistics and probability, development tools, machine learning, and big data. This is a critical components of data analytics ppt icon rules pdf template with various stages. Focus and dispense information on four stages using this creative set, that comes with editable features. It contains large content boxes to add your information on topics like data, programming, statistics and probability, big data. You can also showcase facts, figures, and other relevant content using this PPT layout. Grab it now.
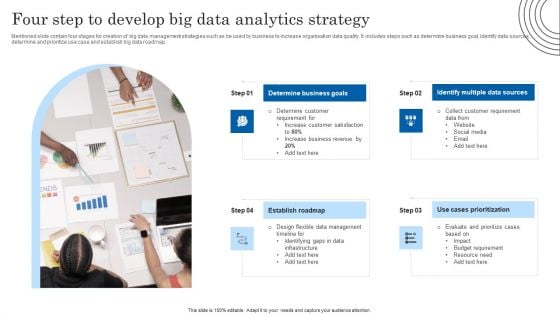
Four Step To Develop Big Data Analytics Strategy Designs PDF
Mentioned slide contain four stages for creation of big data management strategies such as be used by business to increase organisation data quality. It includes steps such as determine business goal, identify data sources, determine and prioritize use case and establish big data roadmap. Presenting Four Step To Develop Big Data Analytics Strategy Designs PDF to dispense important information. This template comprises four stages. It also presents valuable insights into the topics including Determine Business Goals, Multiple Data Sources, Cases Prioritization. This is a completely customizable PowerPoint theme that can be put to use immediately. So, download it and address the topic impactfully.
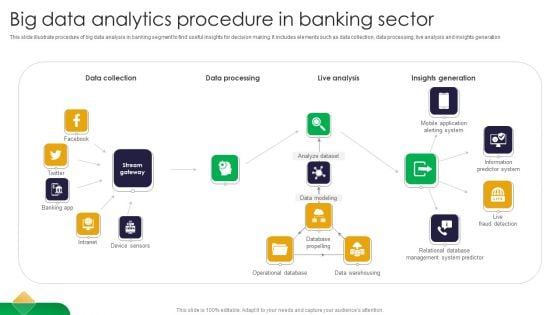
Big Data Analytics Procedure In Banking Sector Guidelines PDF
This slide illustrate procedure of big data analysis in banking segment to find useful insights for decision making. It includes elements such as data collection, data processing, live analysis and insights generation Persuade your audience using this Big Data Analytics Procedure In Banking Sector Guidelines PDF. This PPT design covers three stages, thus making it a great tool to use. It also caters to a variety of topics including Data Collection, Data Processing, Live Analysis. Download this PPT design now to present a convincing pitch that not only emphasizes the topic but also showcases your presentation skills.
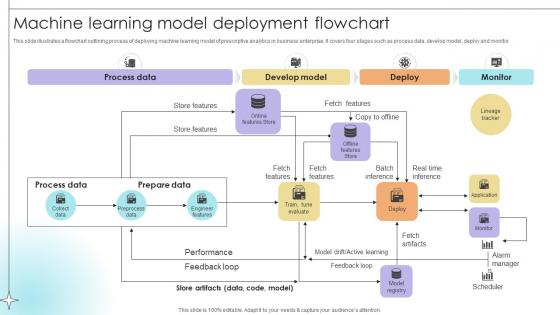
Machine Learning Model Deployment Flowchart Data Analytics SS V
This slide illustrates a flowchart outlining process of deploying machine learning model of prescriptive analytics in business enterprise. It covers four stages such as process data, develop model, deploy and monitor.If your project calls for a presentation, then Slidegeeks is your go-to partner because we have professionally designed, easy-to-edit templates that are perfect for any presentation. After downloading, you can easily edit Machine Learning Model Deployment Flowchart Data Analytics SS V and make the changes accordingly. You can rearrange slides or fill them with different images. Check out all the handy templates This slide illustrates a flowchart outlining process of deploying machine learning model of prescriptive analytics in business enterprise. It covers four stages such as process data, develop model, deploy and monitor.
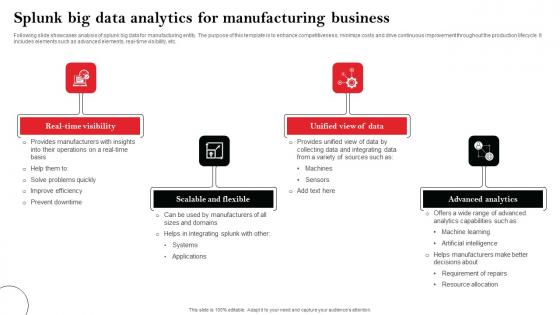
Splunk Big Data Analytics For Manufacturing Business Ideas Pdf
Following slide showcases analysis of splunk big data for manufacturing entity. The purpose of this template is to enhance competitiveness, minimize costs and drive continuous improvement throughout the production lifecycle. It includes elements such as advanced elements, real-time visibility, etc. Pitch your topic with ease and precision using this Splunk Big Data Analytics For Manufacturing Business Ideas Pdf This layout presents information on Real-Time Visibility, Scalable And Flexible, Advanced Analytics It is also available for immediate download and adjustment. So, changes can be made in the color, design, graphics or any other component to create a unique layout. Following slide showcases analysis of splunk big data for manufacturing entity. The purpose of this template is to enhance competitiveness, minimize costs and drive continuous improvement throughout the production lifecycle. It includes elements such as advanced elements, real-time visibility, etc.
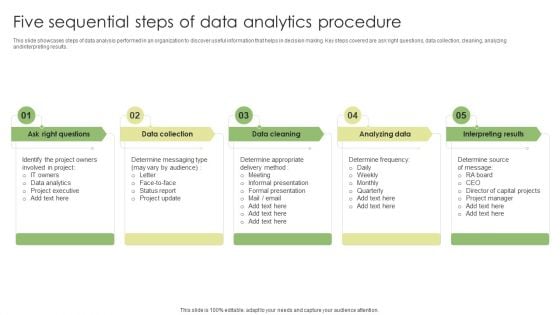
Five Sequential Steps Of Data Analytics Procedure Diagrams PDF
This slide showcases steps of data analysis performed in an organization to discover useful information that helps in decision making. Key steps covered are ask right questions, data collection, cleaning, analyzing and interpreting results. Persuade your audience using this Five Sequential Steps Of Data Analytics Procedure Diagrams PDF. This PPT design covers five stages, thus making it a great tool to use. It also caters to a variety of topics including Data Collection, Analyzing Data, Interpreting Results. Download this PPT design now to present a convincing pitch that not only emphasizes the topic but also showcases your presentation skills.

Key Facts Big Data Analytics Investor Funding Elevator Pitch Deck
This slide includes key facts about the company to monitor and assess the companys performance. It covers data related to securitization, unique page views, platforms and services added, and unique mortgage data points analyzed. If your project calls for a presentation, then Slidegeeks is your go-to partner because we have professionally designed, easy-to-edit templates that are perfect for any presentation. After downloading, you can easily edit Key Facts Big Data Analytics Investor Funding Elevator Pitch Deck and make the changes accordingly. You can rearrange slides or fill them with different images. Check out all the handy templates This slide includes key facts about the company to monitor and assess the companys performance. It covers data related to securitization, unique page views, platforms and services added, and unique mortgage data points analyzed.
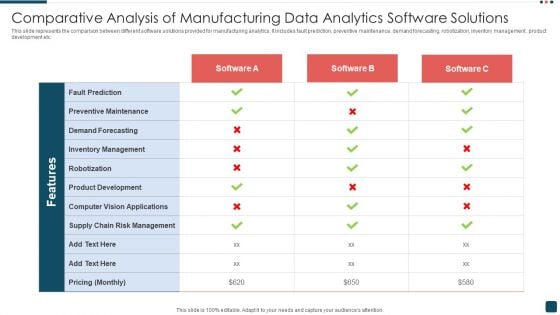
Comparative Analysis Of Manufacturing Data Analytics Software Solutions Elements PDF
This slide represents the comparison between different software solutions provided for manufacturing analytics. It includes fault prediction, preventive maintenance, demand forecasting, robotization, inventory management , product development etc. Showcasing this set of slides titled Comparative Analysis Of Manufacturing Data Analytics Software Solutions Elements PDF. The topics addressed in these templates are Preventive Maintenance, Inventory Management, Risk Management. All the content presented in this PPT design is completely editable. Download it and make adjustments in color, background, font etc. as per your unique business setting.
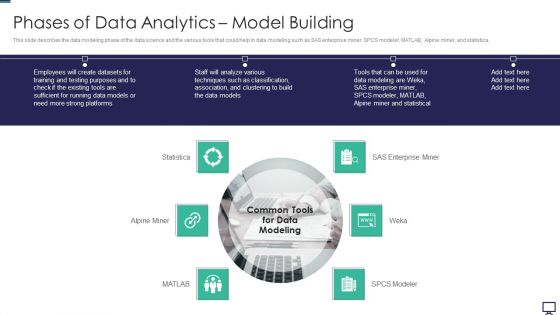
Phases Of Data Analytics Model Building Ppt Portfolio Background PDF
This slide describes the data modeling phase of the data science and the various tools that could help in data modeling such as SAS enterprise miner, SPCS modeler, MATLAB, Alpine miner, and statistica. Presenting phases of data analytics model building ppt portfolio background pdf to provide visual cues and insights. Share and navigate important information on six stages that need your due attention. This template can be used to pitch topics like techniques, analyze, enterprise. In addtion, this PPT design contains high resolution images, graphics, etc, that are easily editable and available for immediate download.
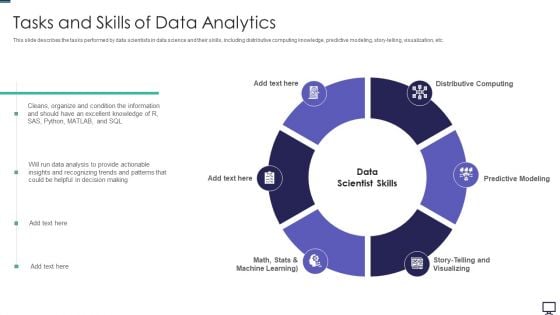
Tasks And Skills Of Data Analytics Ppt Infographics Summary PDF
This slide describes the tasks performed by data scientists in data science and their skills, including distributive computing knowledge, predictive modeling, story-telling, visualization, etc. Presenting tasks and skills of data analytics ppt infographics summary pdf to provide visual cues and insights. Share and navigate important information on six stages that need your due attention. This template can be used to pitch topics like data analysis, information, predictive modeling, distributive computing. In addtion, this PPT design contains high resolution images, graphics, etc, that are easily editable and available for immediate download.
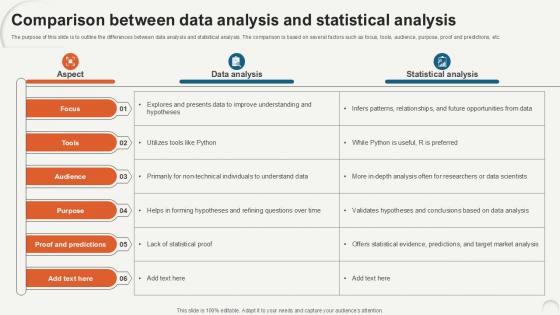
Comparison Between Data Analytics For Informed Decision Ppt Presentation
The purpose of this slide is to outline the differences between data analysis and statistical analysis. The comparison is based on several factors such as focus, tools, audience, purpose, proof and predictions, etc. From laying roadmaps to briefing everything in detail, our templates are perfect for you. You can set the stage with your presentation slides. All you have to do is download these easy-to-edit and customizable templates. Comparison Between Data Analytics For Informed Decision Ppt Presentation will help you deliver an outstanding performance that everyone would remember and praise you for. Do download this presentation today. The purpose of this slide is to outline the differences between data analysis and statistical analysis. The comparison is based on several factors such as focus, tools, audience, purpose, proof and predictions, etc.
What Is Big Data Analytics Ppt Icon Inspiration PDF
This slide represents the meaning of big data and the complete data handling process such as data collection, storage, research, analysis, visualization, volume, and network. Presenting what is big data analytics ppt icon inspiration pdf to provide visual cues and insights. Share and navigate important information on eight stages that need your due attention. This template can be used to pitch topics like cloud technology, visualization, analysis, organizations, applications. In addtion, this PPT design contains high resolution images, graphics, etc, that are easily editable and available for immediate download.
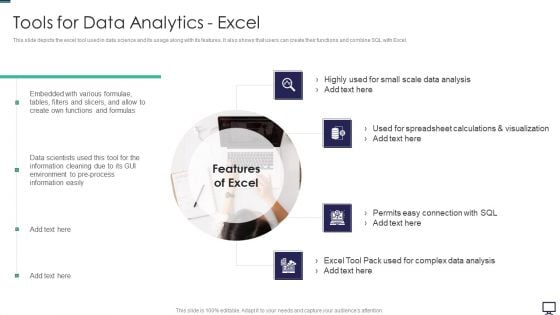
Tools For Data Analytics Excel Ppt Portfolio Brochure PDF
This slide depicts the excel tool used in data science and its usage along with its features. It also shows that users can create their functions and combine SQL with Excel. This is a tools for data analytics excel ppt portfolio brochure pdf template with various stages. Focus and dispense information on four stages using this creative set, that comes with editable features. It contains large content boxes to add your information on topics like environment, information, analysis, data. You can also showcase facts, figures, and other relevant content using this PPT layout. Grab it now.
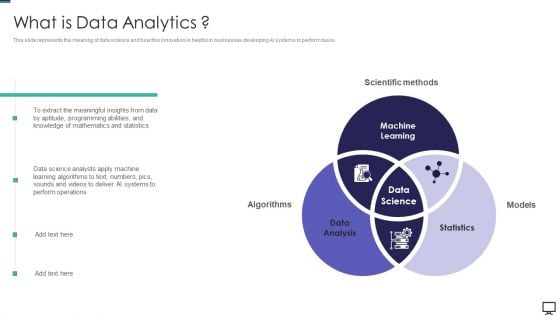
What Is Data Analytics Ppt Professional Slide PDF
This slide represents the meaning of data science and how this innovation is helpful in businesses developing AI systems to perform tasks. Presenting what is data analytics ppt professional slide pdf to provide visual cues and insights. Share and navigate important information on three stages that need your due attention. This template can be used to pitch topics like data analysis, statistics, machine learning. In addtion, this PPT design contains high resolution images, graphics, etc, that are easily editable and available for immediate download.
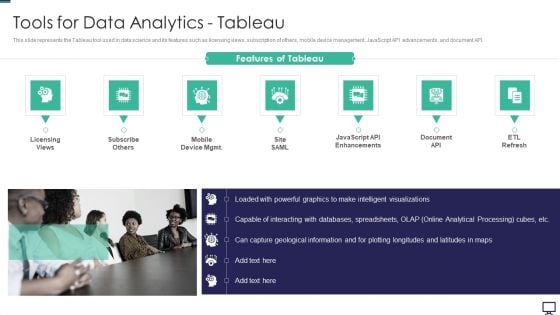
Tools For Data Analytics Tableau Ppt Gallery Layout PDF
This slide represents the Tableau tool used in data science and its features such as licensing views, subscription of others, mobile device management, JavaScript API advancements, and document API. Presenting tools for data analytics tableau ppt gallery layout pdf to provide visual cues and insights. Share and navigate important information on five stages that need your due attention. This template can be used to pitch topics like information, analytical processing, graphics. In addtion, this PPT design contains high resolution images, graphics, etc, that are easily editable and available for immediate download.
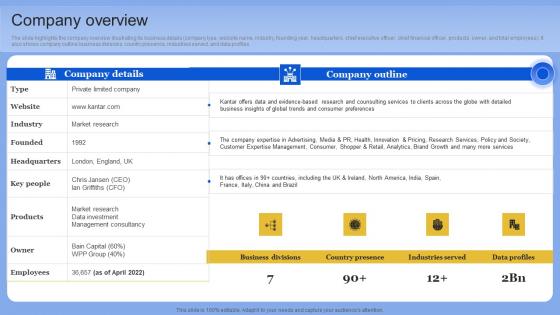
Company Overview Data Analytics Company Outline Demonstration PDF
The slide highlights the company overview illustrating its business details company type, website name, industry, founding year, headquarters, chief executive officer, chief financial officer, products, owner, and total employees. It also shows company outline business divisions, country presence, industries served, and data profiles. Want to ace your presentation in front of a live audience Our Company Overview Data Analytics Company Outline Demonstration PDF can help you do that by engaging all the users towards you. Slidegeeks experts have put their efforts and expertise into creating these impeccable powerpoint presentations so that you can communicate your ideas clearly. Moreover, all the templates are customizable, and easy-to-edit and downloadable. Use these for both personal and commercial use. The slide highlights the company overview illustrating its business details company type, website name, industry, founding year, headquarters, chief executive officer, chief financial officer, products, owner, and total employees. It also shows company outline business divisions, country presence, industries served, and data profiles
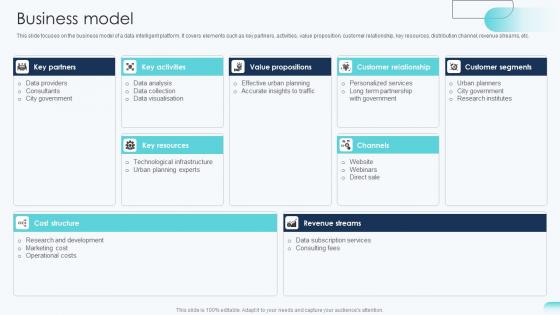
Business Model Big Data Analytics Investor Funding Elevator Pitch Deck
This slide focuses on the business model of a data intelligent platform. It covers elements such as key partners, activities, value proposition, customer relationship, key resources, distribution channel, revenue streams, etc. Boost your pitch with our creative Business Model Big Data Analytics Investor Funding Elevator Pitch Deck. Deliver an awe-inspiring pitch that will mesmerize everyone. Using these presentation templates you will surely catch everyones attention. You can browse the ppts collection on our website. We have researchers who are experts at creating the right content for the templates. So you do not have to invest time in any additional work. Just grab the template now and use them. This slide focuses on the business model of a data intelligent platform. It covers elements such as key partners, activities, value proposition, customer relationship, key resources, distribution channel, revenue streams, etc.
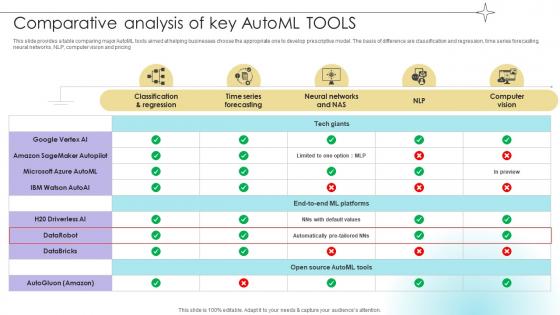
Comparative Analysis Of Key Automl Tools Data Analytics SS V
This slide provides a table comparing major AutoML tools aimed at helping businesses choose the appropriate one to develop prescriptive model. The basis of difference are classification and regression, time series forecasting, neural networks, NLP, computer vision and pricing.The Comparative Analysis Of Key Automl Tools Data Analytics SS V is a compilation of the most recent design trends as a series of slides. It is suitable for any subject or industry presentation, containing attractive visuals and photo spots for businesses to clearly express their messages. This template contains a variety of slides for the user to input data, such as structures to contrast two elements, bullet points, and slides for written information. Slidegeeks is prepared to create an impression. This slide provides a table comparing major AutoML tools aimed at helping businesses choose the appropriate one to develop prescriptive model. The basis of difference are classification and regression, time series forecasting, neural networks, NLP, computer vision and pricing.


 Continue with Email

 Home
Home


