financial management
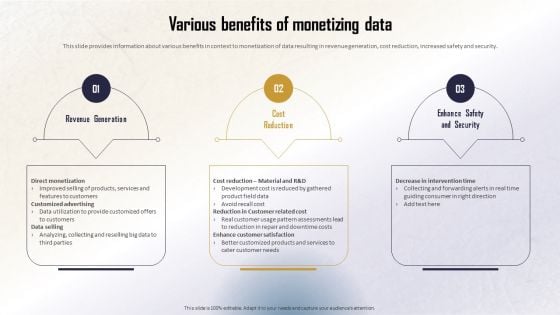
Identifying Direct And Indirect Various Benefits Of Monetizing Data Diagrams PDF
This slide provides information about various benefits in context to monetization of data resulting in revenue generation, cost reduction, increased safety and security. Take your projects to the next level with our ultimate collection of Identifying Direct And Indirect Various Benefits Of Monetizing Data Diagrams PDF. Slidegeeks has designed a range of layouts that are perfect for representing task or activity duration, keeping track of all your deadlines at a glance. Tailor these designs to your exact needs and give them a truly corporate look with your own brand colors theyll make your projects stand out from the rest
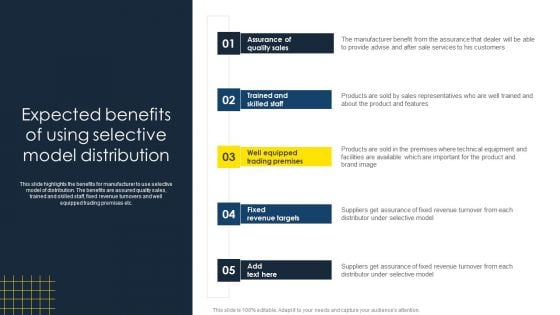
Optimize Business Sales Expected Benefits Of Using Selective Model Distribution Infographics PDF
This slide highlights the benefits for manufacturer to use selective model of distribution. The benefits are assured quality sales, trained and skilled staff, fixed revenue turnovers and well equipped trading premises etc. Find a pre-designed and impeccable Optimize Business Sales Expected Benefits Of Using Selective Model Distribution Infographics PDF. The templates can ace your presentation without additional effort. You can download these easy-to-edit presentation templates to make your presentation stand out from others. So, what are you waiting for Download the template from Slidegeeks today and give a unique touch to your presentation.
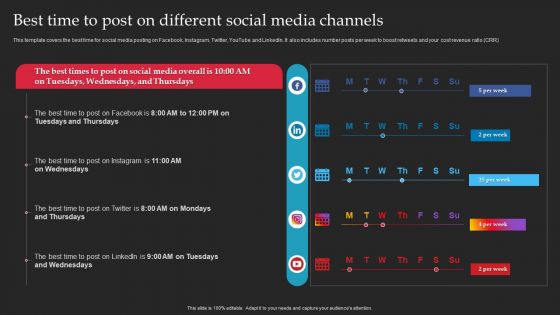
Brand Launch Checklist Best Time To Post On Different Social Media Channels Demonstration PDF
This template covers the best time for social media posting on Facebook, Instagram, Twitter, YouTube and LinkedIn. It also includes number posts per week to boost retweets and your cost revenue ratio CRR. Want to ace your presentation in front of a live audience Our Brand Launch Checklist Best Time To Post On Different Social Media Channels Demonstration PDF can help you do that by engaging all the users towards you.. Slidegeeks experts have put their efforts and expertise into creating these impeccable powerpoint presentations so that you can communicate your ideas clearly. Moreover, all the templates are customizable, and easy-to-edit and downloadable. Use these for both personal and commercial use.
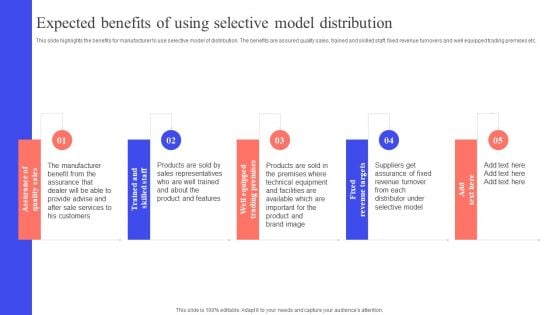
Implementing Effective Distribution Expected Benefits Of Using Selective Model Distribution Download PDF
This slide highlights the benefits for manufacturer to use selective model of distribution. The benefits are assured quality sales, trained and skilled staff, fixed revenue turnovers and well equipped trading premises etc. Retrieve professionally designed Implementing Effective Distribution Expected Benefits Of Using Selective Model Distribution Download PDF to effectively convey your message and captivate your listeners. Save time by selecting pre-made slideshows that are appropriate for various topics, from business to educational purposes. These themes come in many different styles, from creative to corporate, and all of them are easily adjustable and can be edited quickly. Access them as PowerPoint templates or as Google Slides themes. You dont have to go on a hunt for the perfect presentation because Slidegeeks got you covered from everywhere.
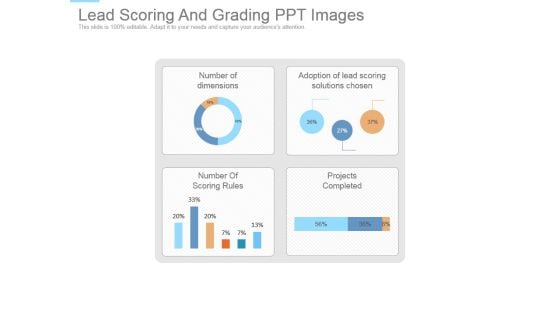
Lead Scoring And Grading Ppt Images
This is a lead scoring and grading ppt images. This is a four stage process. The stages in this process are number of dimensions, adoption of lead scoring solutions chosen, number of scoring rules, projects completed.
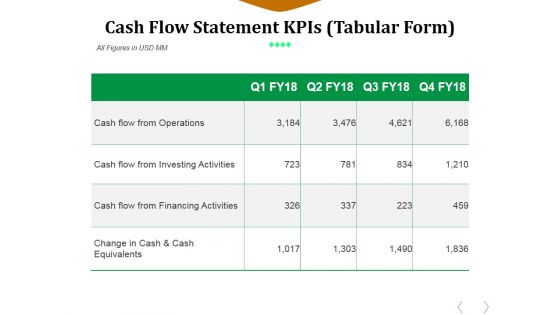
Cash Flow Statement Kpis Template 2 Ppt PowerPoint Presentation Layouts Gridlines
This is a cash flow statement kpis template 2 ppt powerpoint presentation layouts gridlines. This is a four stage process. The stages in this process are cash flow from operations, cash flow from investing activities, cash flow from financing activities, change in cash and cash equivalents.
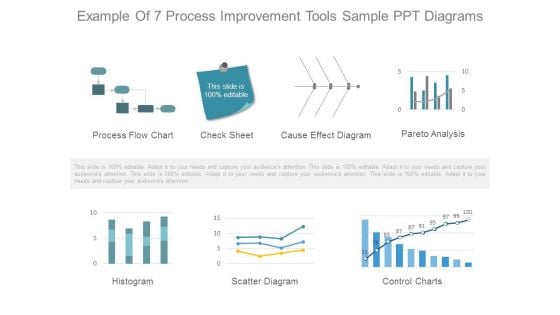
Example Of 7 Process Improvement Tools Sample Ppt Diagrams
This is a example of 7 process improvement tools sample ppt diagrams. This is a seven stage process. The stages in this process are process flow chart, check sheet, cause effect diagram, pareto analysis, histogram, scatter diagram, control charts.
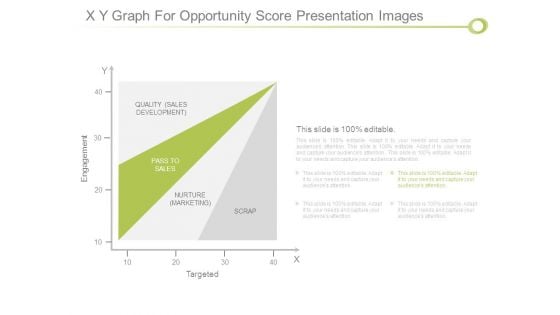
X Y Graph For Opportunity Score Presentation Images
This is a x y graph for opportunity score presentation images. This is a one stage process. The stages in this process are engagement, quality sales development, pass to sales, nurture marketing, scrap, targeted.
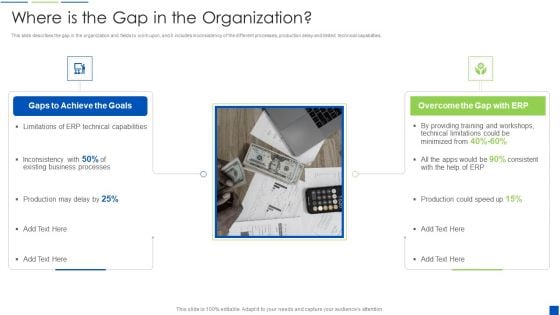
Corporate Resource Planning Where Is The Gap In The Organization Clipart PDF
This slide describes the gap in the organization and fields to work upon, and it includes inconsistency of the different processes, production delay and limited technical capabilities.This is a Corporate Resource Planning Where Is The Gap In The Organization Clipart PDF template with various stages. Focus and dispense information on two stages using this creative set, that comes with editable features. It contains large content boxes to add your information on topics like Technical Capabilities, Existing Business Processes, Providing Training And Workshops You can also showcase facts, figures, and other relevant content using this PPT layout. Grab it now.
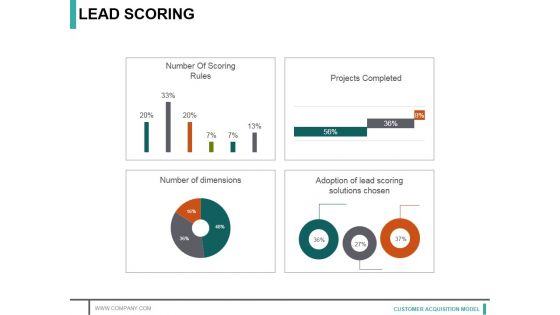
Lead Scoring Template 2 Ppt PowerPoint Presentation Infographic Template Graphics Template
This is a lead scoring template 2 ppt powerpoint presentation infographic template graphics template. This is a four stage process. The stages in this process are number of scoring rules, projects completed, adoption of lead scoring solutions chosen.

Net Promoter Score Nps Template 1 Ppt PowerPoint Presentation Outline Information
This is a net promoter score nps template 1 ppt powerpoint presentation outline information. This is a eight stage process. The stages in this process are detractors, promoters, passives, net promoter score.
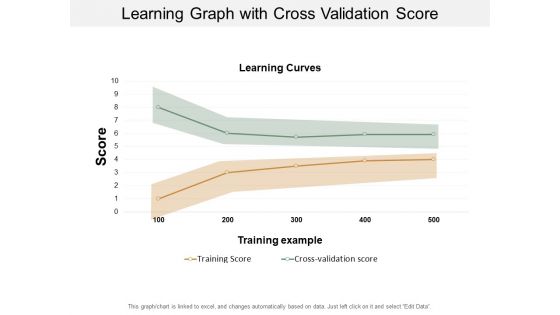
Learning Graph With Cross Validation Score Ppt PowerPoint Presentation Visual Aids Inspiration
This is a learning graph with cross validation score ppt powerpoint presentation visual aids inspiration. This is a two stage process. The stages in this process are experience curve, learning curve.
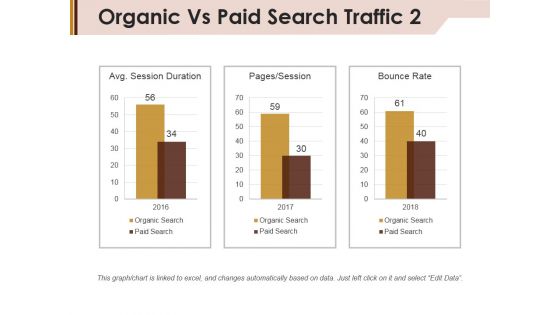
Organic Vs Paid Search Traffic Template 2 Ppt PowerPoint Presentation Pictures Layout Ideas
This is a organic vs paid search traffic template 2 ppt powerpoint presentation pictures layout ideas. This is a three stage process. The stages in this process are session duration, pages session, bounce rate, paid search.
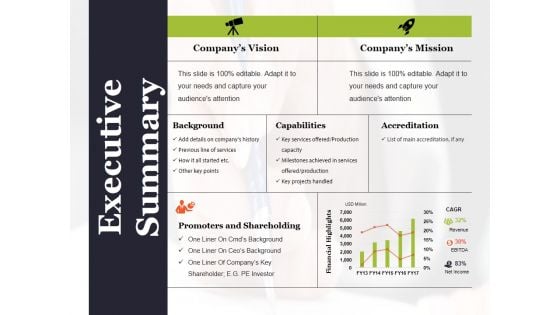
Executive Summary Ppt PowerPoint Presentation Summary Good
This is a executive summary ppt powerpoint presentation summary good. This is a seven stage process. The stages in this process are companys vision, companys mission, background, capabilities, accreditation.
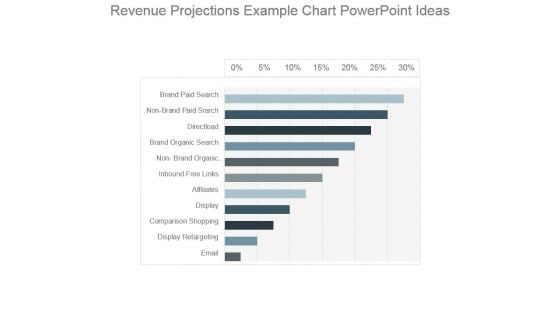
Revenue Projections Example Chart Powerpoint Ideas
This is a revenue projections example chart powerpoint ideas. This is a eleven stage process. The stages in this process are brand paid search, non branded paid search, direct load, brand organic search, non brand organic, inbound free links, affiliates, display, comparison shopping, display retargeting, email.
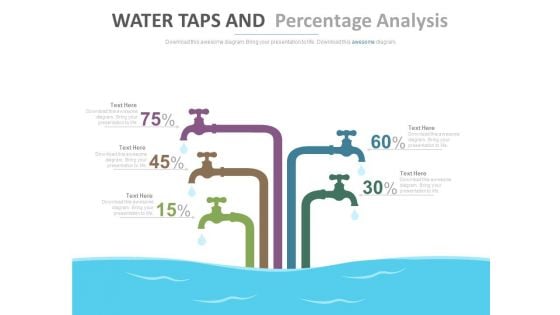
Water Taps For Working Capital Calculation Powerpoint Slides
This PowerPoint template has been designed with graphics of water taps. This PPT slide can be used to display working capital for business. You can download finance PowerPoint template to prepare awesome presentations.
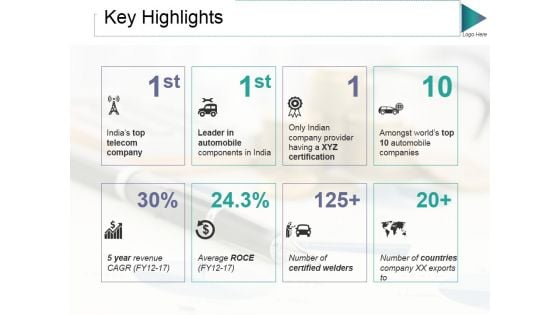
Key Highlights Ppt PowerPoint Presentation Gallery Background Images
This is a key highlights ppt powerpoint presentation gallery background images. This is a eight stage process. The stages in this process are average roce, certified welders, countries, leader in automobile, years.
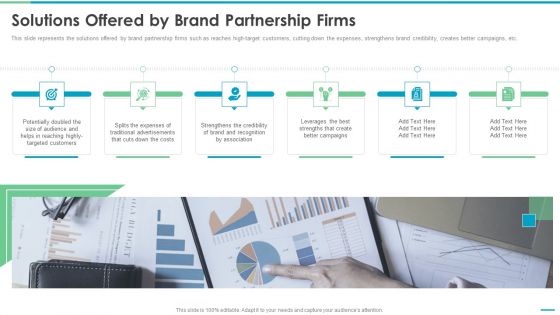
Co Branding Stakeholder Fund Raising Solutions Offered By Brand Partnership Firms Sample PDF
This slide represents the solutions offered by brand partnership firms such as reaches high-target customers, cutting down the expenses, strengthens brand credibility, creates better campaigns, etc. Presenting Co Branding Stakeholder Fund Raising Solutions Offered By Brand Partnership Firms Sample PDF to provide visual cues and insights. Share and navigate important information on six stages that need your due attention. This template can be used to pitch topics like Brand And Recognition Association, Better Campaigns, Highly Targeted Customers. In addtion, this PPT design contains high resolution images, graphics, etc, that are easily editable and available for immediate download.
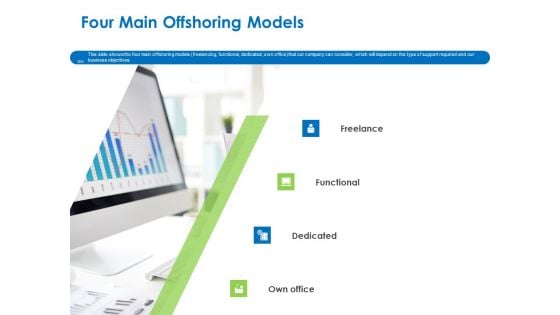
Relocation Of Business Process Offshoring Four Main Offshoring Models Mockup PDF
This slide shows the four main offshoring models freelancing, functional, dedicated, own office that our company can consider, which will depend on the type of support required and our business objectives. Presenting relocation of business process offshoring four main offshoring models mockup pdf to provide visual cues and insights. Share and navigate important information on four stages that need your due attention. This template can be used to pitch topics like freelance, functional, dedicated, own office. In addition, this PPT design contains high-resolution images, graphics, etc, that are easily editable and available for immediate download.
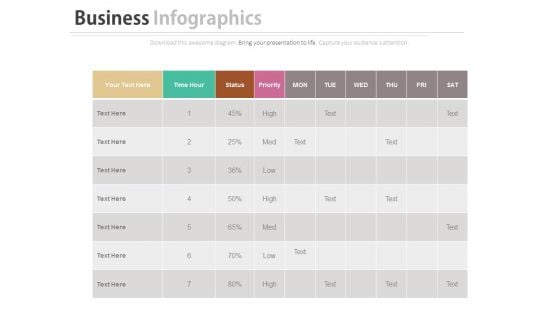
Work Sheet For Daily Activity Plan Schedule Powerpoint Slides
Our above business slide contains graphics of daily worksheet. This PowerPoint slide may be used to exhibit activity plan and schedule. Capture the attention of your audience with this slide.
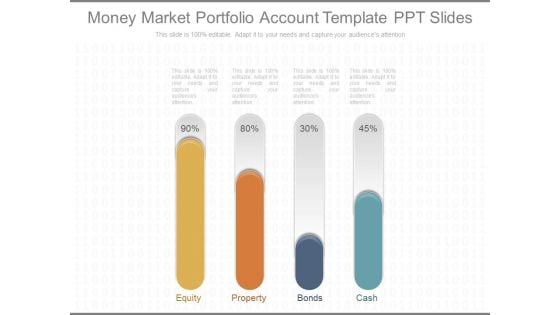
Money Market Portfolio Account Template Ppt Slides
This is a money market portfolio account template ppt slides. This is a four stage process. The stages in this process are equity, property, bonds, cash.
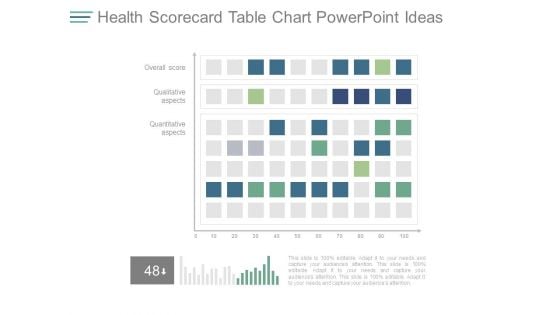
Health Scorecard Table Chart Powerpoint Ideas
This is a health scorecard table chart powerpoint ideas. This is a two stage process. The stages in this process are overall score, qualitative aspects, quantitative aspects.
Human Performance Improvement Technologies Ppt Icon
This is a human performance improvement technologies ppt icon. This is a four stage process. The stages in this process are score, overall territory performance, weight.
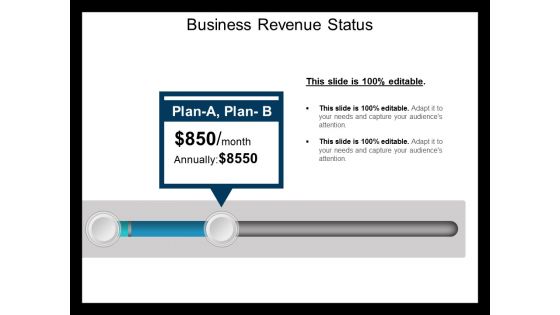
Business Revenue Status Ppt PowerPoint Presentation Portfolio Background Image
This is a business revenue status ppt powerpoint presentation portfolio background image. This is a one stage process. The stages in this process are cost reduction strategies.
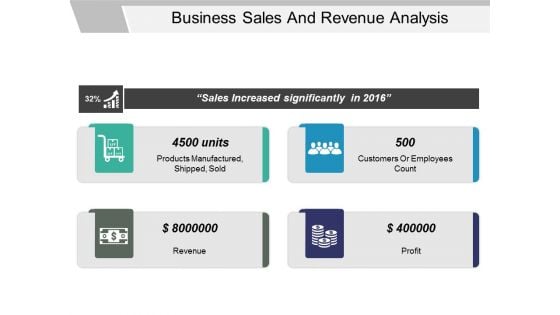
Business Sales And Revenue Analysis Ppt PowerPoint Presentation Layouts Display
This is a business sales and revenue analysis ppt powerpoint presentation layouts display. This is a four stage process. The stages in this process are goals, results, output, deliverables.
Monetary Transaction Vector Icon Ppt PowerPoint Presentation Professional Infographics
This is a monetary transaction vector icon ppt powerpoint presentation professional infographics. This is a four stage process. The stages in this process are payment processing, instalment processing, premium processing.
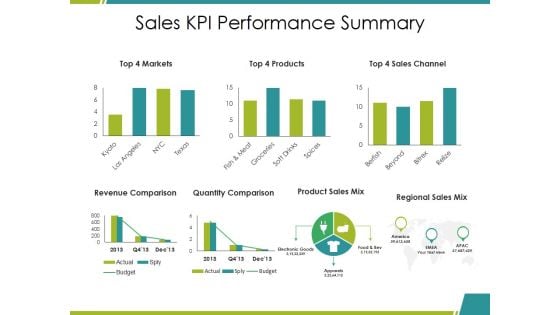
Sales Kpi Performance Summary Ppt PowerPoint Presentation Infographic Template Elements
This is a sales kpi performance summary ppt powerpoint presentation infographic template elements. This is a seven stage process. The stages in this process are revenue comparison, quantity comparison, product sales mix, regional sales mix, budget.
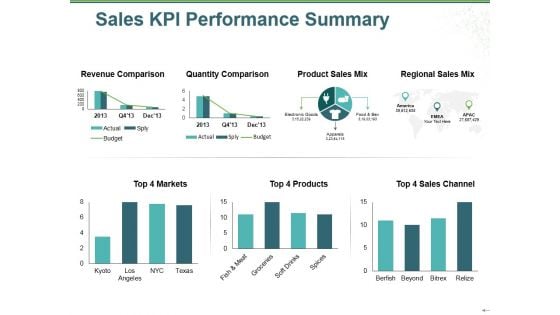
Sales Kpi Performance Summary Ppt PowerPoint Presentation Show Inspiration
This is a sales kpi performance summary ppt powerpoint presentation show inspiration. This is a two stage process. The stages in this process are revenue comparison, quantity comparison, product sales mix, regional sales mix, budget.
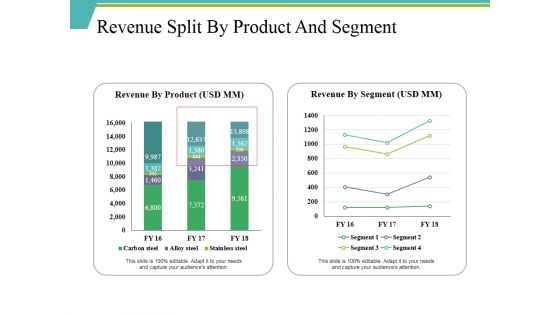
Revenue Split By Product And Segment Ppt PowerPoint Presentation Outline Brochure
This is a revenue split by product and segment ppt powerpoint presentation outline brochure. This is a two stage process. The stages in this process are carbon steel, alloy steel, revenue by product, stainless steel, segment.
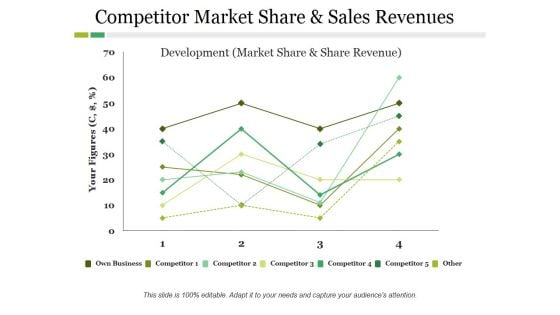
Competitor Market Share And Sales Revenues Ppt PowerPoint Presentation Ideas Slide
This is a competitor market share and sales revenues ppt powerpoint presentation ideas slide. This is a four stage process. The stages in this process are competitor, development, own business, your figures.
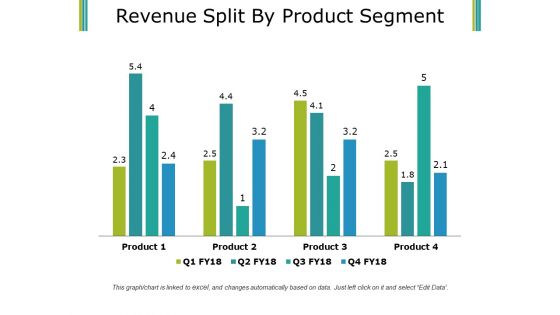
Revenue Split By Product Segment Template 1 Ppt PowerPoint Presentation Infographics Smartart
This is a revenue split by product segment template 1 ppt powerpoint presentation infographics smartart. This is a four stage process. The stages in this process are business, finance, marketing, bar graph, product.
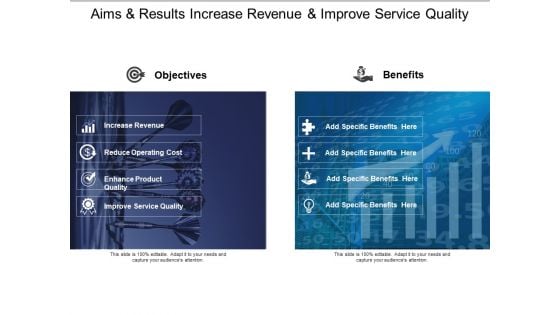
Aims And Results Increase Revenue And Improve Service Quality Ppt PowerPoint Presentation Gallery Design Inspiration
This is a aims and results increase revenue and improve service quality ppt powerpoint presentation gallery design inspiration. This is a two stage process. The stages in this process are objective and benefit, goal and benefit, plan and benefit.
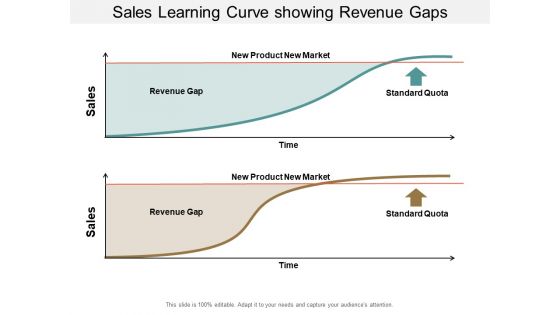
Sales Learning Curve Showing Revenue Gaps Ppt PowerPoint Presentation Infographic Template Master Slide
This is a sales learning curve showing revenue gaps ppt powerpoint presentation infographic template master slide. This is a two stage process. The stages in this process are experience curve, learning curve.
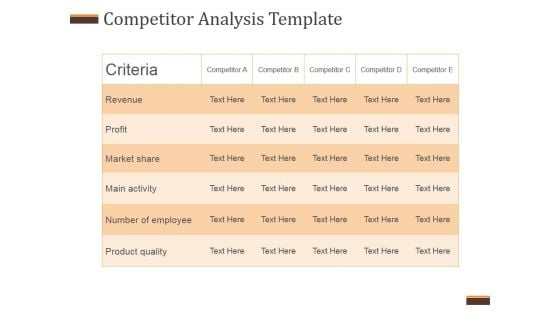
Competitor Analysis Template Ppt PowerPoint Presentation Example File
This is a competitor analysis template ppt powerpoint presentation example file. This is a five stage process. The stages in this process are revenue, profit, market share, main activity, number of employee, product quality.
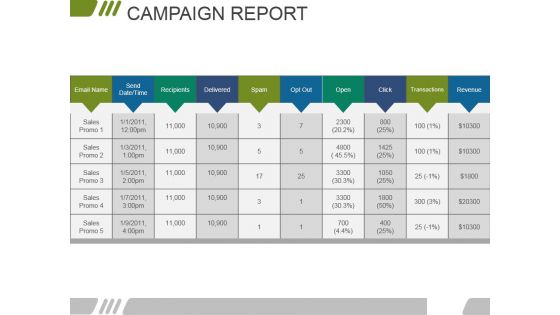
Campaign Report Ppt PowerPoint Presentation Slides Professional
This is a campaign report ppt powerpoint presentation slides professional. This is a five stage process. The stages in this process are email name, send date time, recipients, delivered, spam, opt out, open, click, transactions, revenue.
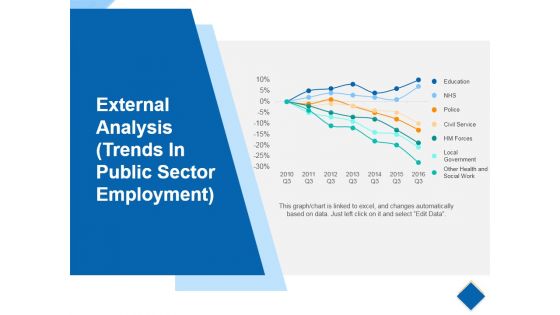
External Analysis Template 4 Ppt PowerPoint Presentation Portfolio Designs
This is a external analysis template 4 ppt powerpoint presentation portfolio designs. This is a seven stage process. The stages in this process are education, police, civil service, hm forces, local government.
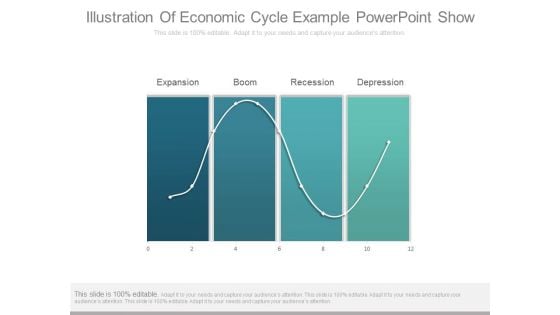
Illustration Of Economic Cycle Example Powerpoint Show
This is a illustration of economic cycle example powerpoint show. This is a four stage process. The stages in this process are expansion, boom, recession, depression.
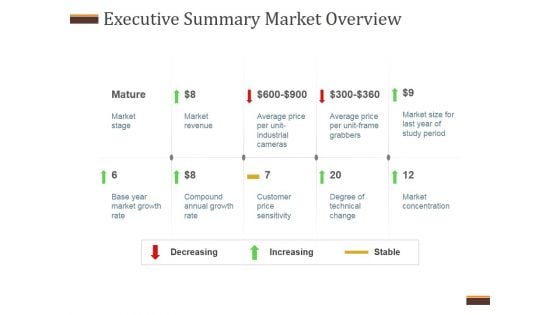
Executive Summary Market Overview Ppt PowerPoint Presentation Background Designs
This is a executive summary market overview ppt powerpoint presentation background designs. This is a ten stage process. The stages in this process are market stage, market revenue, base year market growth rate, compound annual growth rate, customer price sensitivity, degree of technical change, market concentration.
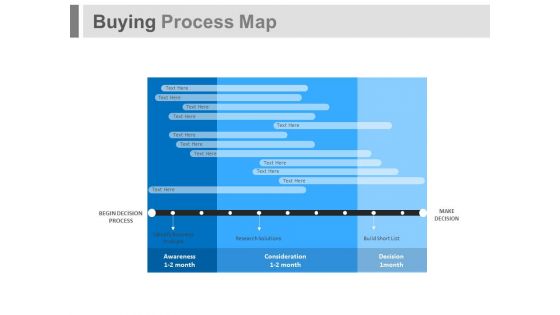
Buying Process Map Ppt Slides
This is a buying process map ppt slides. This is a one stage process. The stages in this process are business, marketing.
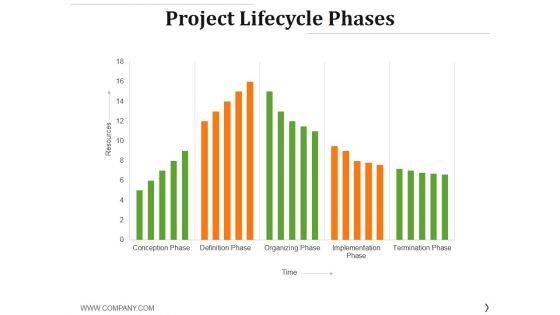
Project Lifecycle Phases Template 2 Ppt PowerPoint Presentation Templates
This is a project lifecycle phases template 2 ppt powerpoint presentation templates. This is a five stage process. The stages in this process are definition phase, organizing phase, resources, time.
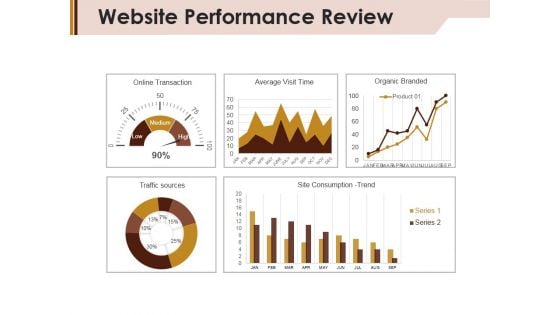
Website Performance Review Template 2 Ppt PowerPoint Presentation Slides Graphics
This is a website performance review template 2 ppt powerpoint presentation slides graphics. This is a five stage process. The stages in this process are online transaction, average visit time, organic branded, traffic sources.
Product Launch Budget Plan Ppt PowerPoint Presentation Icon Slide
This is a product launch budget plan ppt powerpoint presentation icon slide. This is a seven stage process. The stages in this process are bar graph, icons, percentage, finance, business.

Calculating Customer Lifetime Value Clv Ppt PowerPoint Presentation Infographic Template Format
This is a calculating customer lifetime value clv ppt powerpoint presentation infographic template format. This is a five stage process. The stages in this process are average acquisition cost, average customer revenue, average customer costs, average customer profit, customer retention rate, cumulative retention rate.
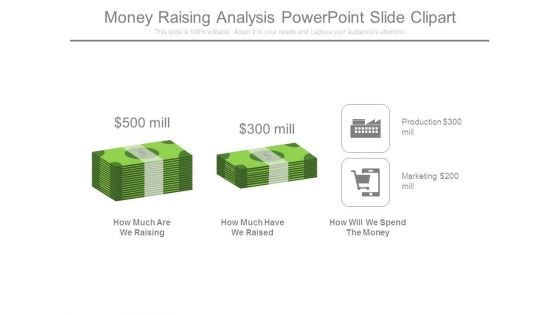
Money Raising Analysis Powerpoint Slide Clipart
This is a money raising analysis powerpoint slide clipart. This is a two stage process. The stages in this process are how much are we raising, how much have we raised, how will we spend the money, production mill, marketing mill.
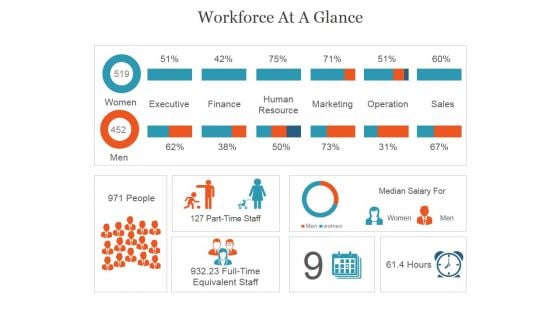
Workforce At A Glance Ppt PowerPoint Presentation Graphics
This is a workforce at a glance ppt powerpoint presentation graphics. This is a two stage process. The stages in this process are women, executive, finance, human resource, marketing, operation, sales.
Essentials Of Statistics For Business And Economics Ppt Powerpoint Presentation Pictures Styles
This is a essentials of statistics for business and economics ppt powerpoint presentation pictures styles. This is a three stage process. The stages in this process are business metrics, business kpi, business dashboard.
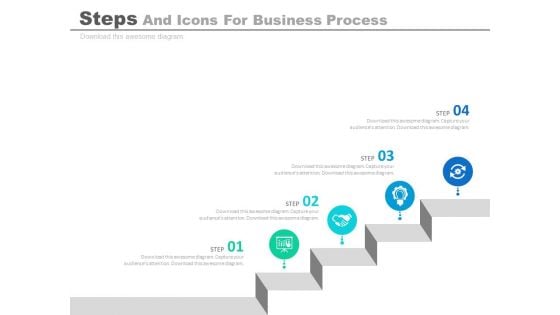
Infographic Diagram For Business Process Analysis Powerpoint Slides
This PowerPoint slide contains business infographic diagram. This professional slide may be used to display business process analysis. Use this business template to make impressive presentations.
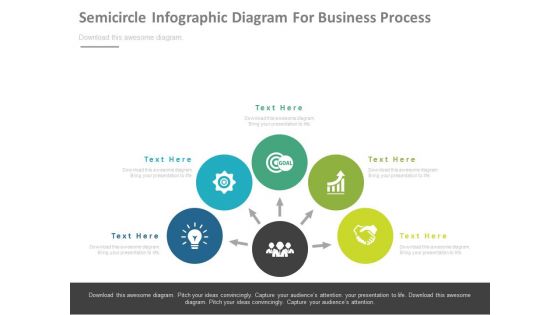
Semicircle Infographic Diagram For Business Process Powerpoint Slides
This PowerPoint template has been designed with semicircle infographic diagram. This PPT slide may be used to display business process flow. Download this slide to build unique presentation.
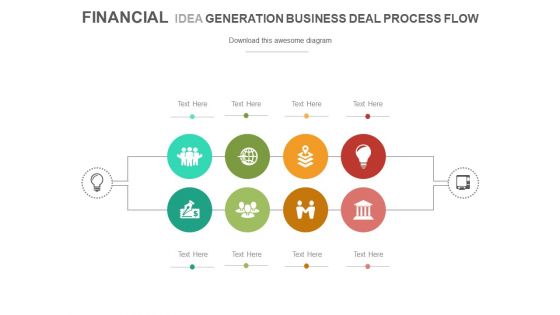
Process Flow Diagram With Business Icons Powerpoint Slides
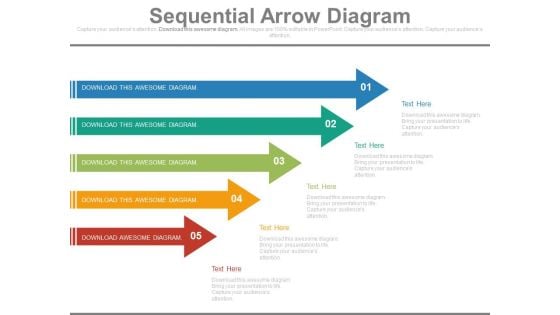
Five Arrows Diagram For Process Flow Powerpoint Slides
This PowerPoint template has been designed with five arrows diagram. The PowerPoint template has a high quality design. You can download this PowerPoint slide for corporate presentations or annual meeting and business plans.
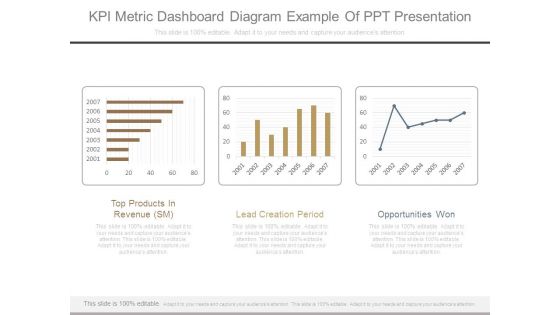
Kpi Metric Dashboard Diagram Example Of Ppt Presentation
This is a kpi metric dashboard diagram example of ppt presentation. This is a three stage process. The stages in this process are top products in revenue sm, lead creation period, opportunities won.
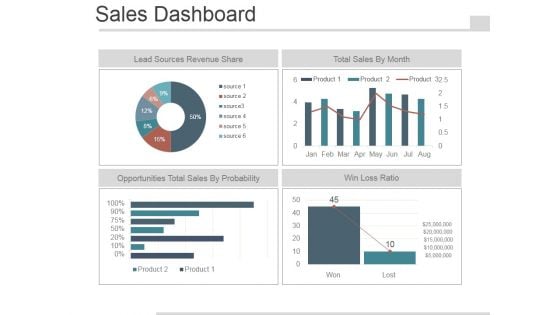
Sales Dashboard Slide Template 2 Ppt PowerPoint Presentation Images
This is a sales dashboard slide template 2 ppt powerpoint presentation images. This is a four stage process. The stages in this process are lead sources revenue share, total sales by month, opportunities total sales by probability, win loss ratio.
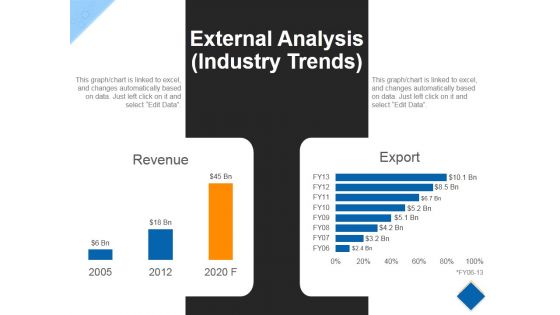
External Analysis Template 2 Ppt PowerPoint Presentation Styles Example File
This is a external analysis template 2 ppt powerpoint presentation styles example file. This is a two stage process. The stages in this process are revenue export, year, growth.
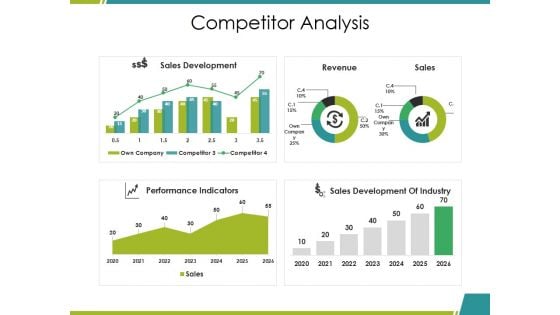
Competitor Analysis Ppt PowerPoint Presentation Inspiration Ideas
This is a competitor analysis ppt powerpoint presentation inspiration ideas. This is a four stage process. The stages in this process are sales development, performance indicators, revenue, sales, sales development of industry.
Sales Kpi Tracker Ppt PowerPoint Presentation Layout
This is a sales kpi tracker ppt powerpoint presentation layout. This is a six stage process. The stages in this process are leads created, sales ratio, opportunities won, top products in revenue, actual.
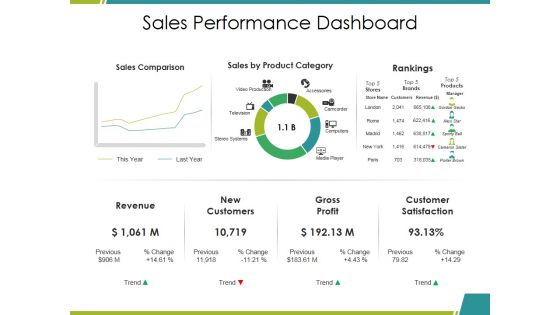
Sales Performance Dashboard Ppt PowerPoint Presentation Infographics Mockup
This is a sales performance dashboard ppt powerpoint presentation infographics mockup. This is a three stage process. The stages in this process are sales comparison, sales by product category, rankings, revenue, gross profit.
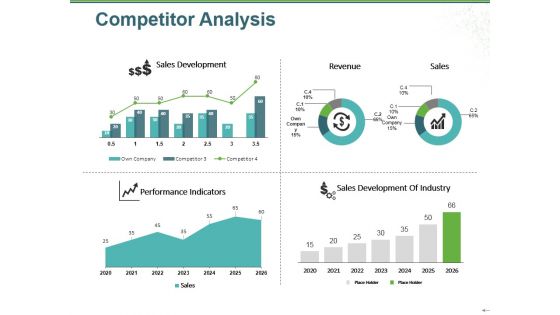
Competitor Analysis Ppt PowerPoint Presentation Pictures Visuals
This is a competitor analysis ppt powerpoint presentation pictures visuals. This is a four stage process. The stages in this process are sales development, performance indicators, sales development of industry, sales, revenue.
Highlights Ppt PowerPoint Presentation Icon Infographics
This is a highlights ppt powerpoint presentation icon infographics. This is a five stage process. The stages in this process are countries, stores worldwide, total revenue, associates, monthly website visitors.
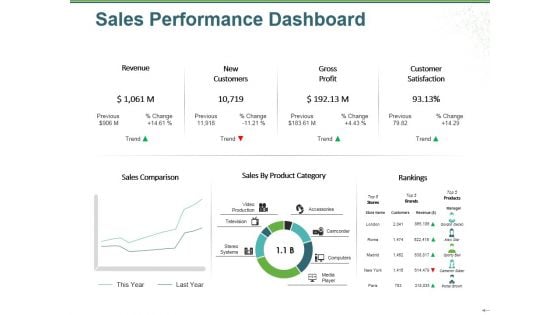
Sales Performance Dashboard Ppt PowerPoint Presentation Outline File Formats
This is a sales performance dashboard ppt powerpoint presentation outline file formats. This is a three stage process. The stages in this process are revenue, new customers, gross profit, customer satisfaction, rankings.
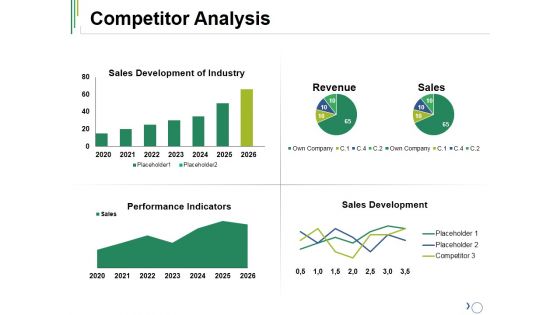
Competitor Analysis Ppt PowerPoint Presentation File Influencers
This is a competitor analysis ppt powerpoint presentation file influencers. This is a four stage process. The stages in this process are revenue, sales, placeholder, performance indicators, sales development.


 Continue with Email

 Home
Home


