financial management

Radar Chart Ppt PowerPoint Presentation Inspiration Infographic Template
This is a radar chart ppt powerpoint presentation inspiration infographic template. This is a two stage process. The stages in this process are radar chart, product, business, finance, marketing.
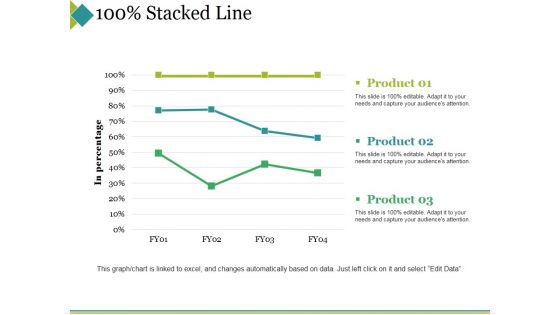
Stacked Line Ppt PowerPoint Presentation Professional Background Designs
This is a stacked line ppt powerpoint presentation professional background designs. This is a three stage process. The stages in this process are product, in percentage, stacked line, finance, business.

Radar Chart Ppt PowerPoint Presentation Infographics Visual Aids
This is a radar chart ppt powerpoint presentation infographics visual aids. This is a two stage process. The stages in this process are radar chart, product, finance, business, marketing.
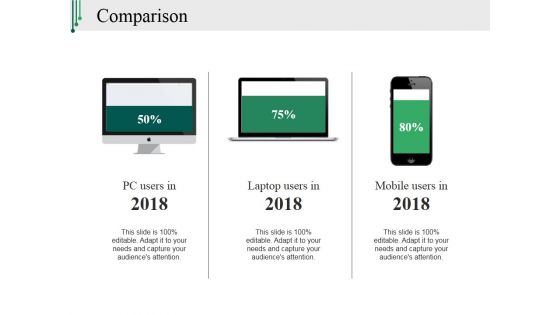
Comparison Ppt PowerPoint Presentation Slides Structure
This is a comparison ppt powerpoint presentation slides structure. This is a three stage process. The stages in this process are pc users in, laptop users in, mobile users in, technology, years.
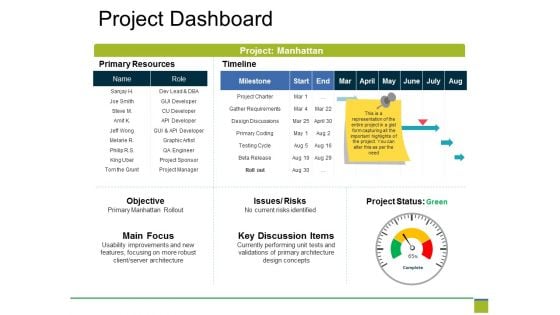
Project Dashboard Ppt PowerPoint Presentation Professional Show
This is a project dashboard ppt powerpoint presentation professional show. This is a six stage process. The stages in this process are primary resources, timeline, objective, main focus, key discussion items.
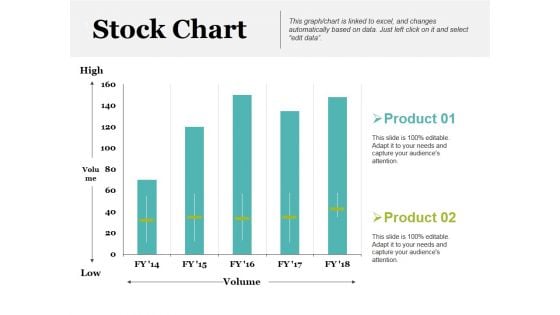
Stock Chart Ppt PowerPoint Presentation Inspiration Example Introduction
This is a stock chart ppt powerpoint presentation inspiration example introduction. This is a two stage process. The stages in this process are product, high, volume, low, stock chart.
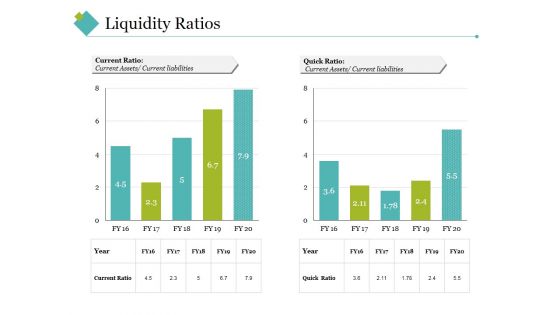
Liquidity Ratios Template 2 Ppt PowerPoint Presentation Gallery Vector
This is a liquidity ratios template 2 ppt powerpoint presentation gallery vector. This is a two stage process. The stages in this process are quick ratio, current ratio, current liabilities, current assets.
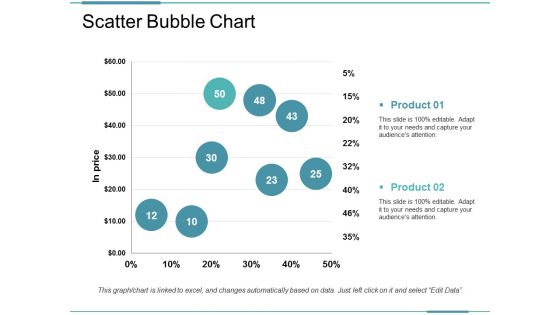
Scatter Bubble Chart Template Ppt PowerPoint Presentation Professional Background
This is a scatter bubble chart template ppt powerpoint presentation professional background. This is a six stage process. The stages in this process are business, marketing, strategy, planning, finance.
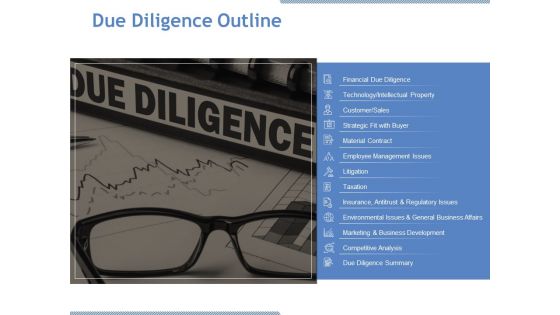
Due Diligence Outline Ppt PowerPoint Presentation Inspiration Gallery
This is a due diligence outline ppt powerpoint presentation inspiration gallery. This is a one stage process. The stages in this process are customer, material contract, litigation, taxation, competitive analysis.
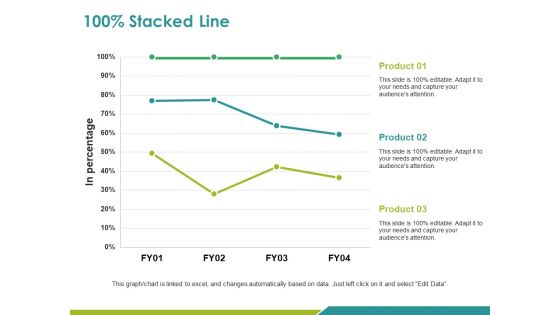
Stacked Line Ppt PowerPoint Presentation Pictures Example Topics
This is a stacked line ppt powerpoint presentation pictures example topics. This is a three stage process. The stages in this process are product, in percentage, stacked line, business, marketing.
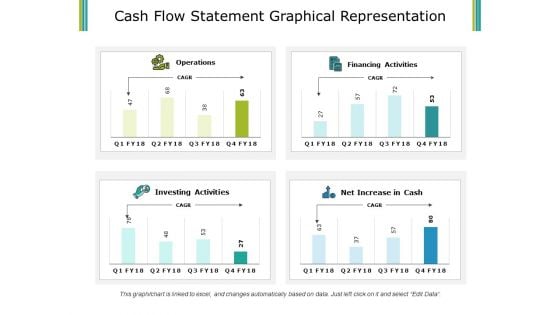
Cash Flow Statement Graphical Representation Ppt PowerPoint Presentation Ideas Graphic Tips
This is a cash flow statement graphical representation ppt powerpoint presentation ideas graphic tips. This is a four stage process. The stages in this process are operations, financing activities, investing activities, net increase in cash.
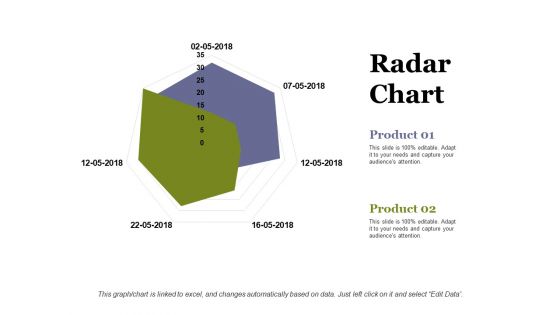
Radar Chart Ppt PowerPoint Presentation Infographic Template Information
This is a radar chart ppt powerpoint presentation infographic template information. This is a two stage process. The stages in this process are radar chart, product, business, marketing, shape.
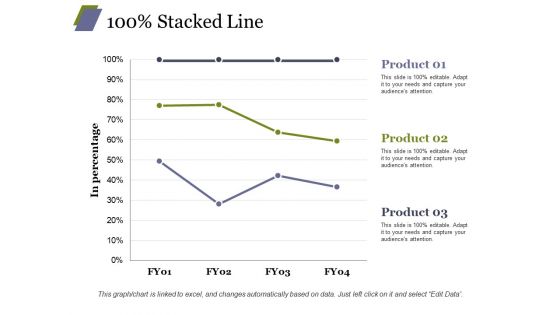
Stacked Line Ppt PowerPoint Presentation Infographics Vector
This is a stacked line ppt powerpoint presentation infographics vector. This is a three stage process. The stages in this process are product, stacked line, business, marketing, in percentage.
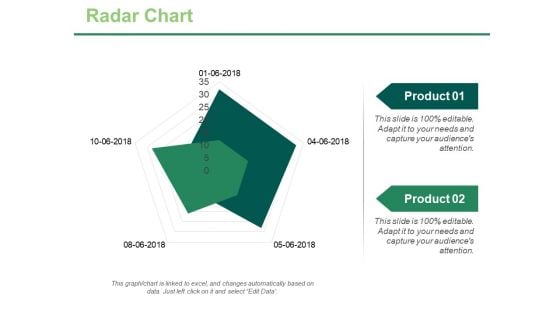
Radar Chart Ppt PowerPoint Presentation Portfolio Graphics Template
This is a radar chart ppt powerpoint presentation portfolio graphics template. This is a two stage process. The stages in this process are product, finance, shape, radar chart, business.
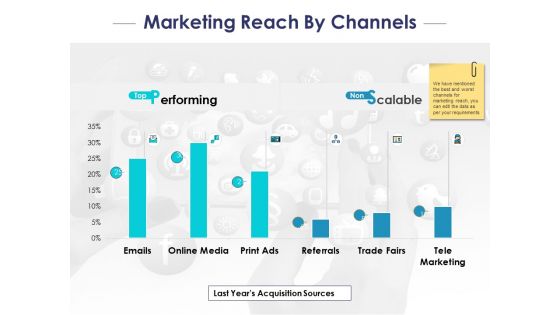
Marketing Reach By Channels Ppt PowerPoint Presentation Styles Professional
This is a marketing reach by channels ppt powerpoint presentation styles professional. This is a six stage process. The stages in this process are top performing, non scalable, emails, print ads, inline media.

Radar Chart Ppt PowerPoint Presentation Professional Infographic Template
This is a radar chart ppt powerpoint presentation professional infographic template. This is a two stage process. The stages in this process are product, finance, shape, radar chart, business.
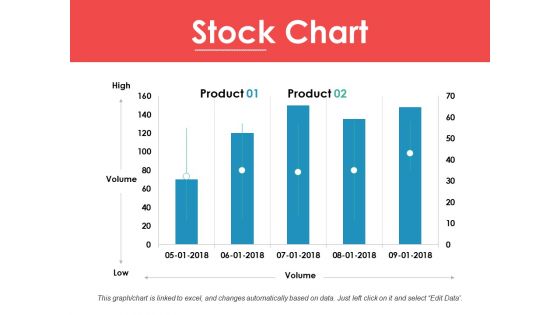
Stock Chart Ppt PowerPoint Presentation Ideas Infographic Template
This is a stock chart ppt powerpoint presentation ideas infographic template. This is a two stage process. The stages in this process are high, volume, low, product, stock chart.
Volume Open High Low Close Chart Ppt PowerPoint Presentation Icon Design Inspiration
This is a volume open high low close chart ppt powerpoint presentation icon design inspiration. This is a three stage process. The stages in this process are close, high, low, volume, open.
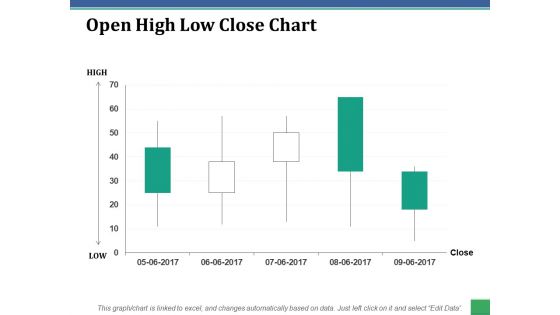
Open High Low Close Chart Ppt PowerPoint Presentation Professional Inspiration
This is a open high low close chart ppt powerpoint presentation professional inspiration. This is a five stage process. The stages in this process are high, low, close, business, finance.
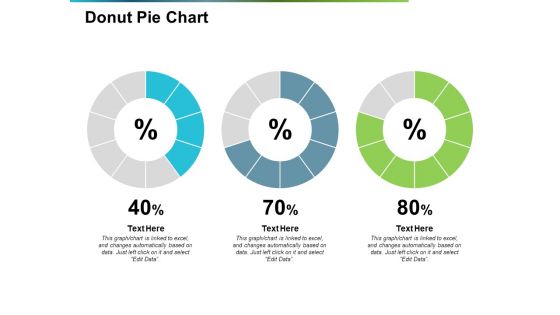
Donut Pie Chart Ppt PowerPoint Presentation Show Graphics Download
This is a donut pie chart ppt powerpoint presentation show graphics download. This is a three stage process. The stages in this process are percentage, finance, donut, business, marketing.
Happy Woman With Dollars In Hand Ppt PowerPoint Presentation Icon Visuals
This is a happy woman with dollars in hand ppt powerpoint presentation icon visuals. This is a one stage process. The stages in this process are mutual funds, funds to buy, investment slide.

Key Performance Indicator Analytics Dashboard Ppt PowerPoint Presentation Model Example Topics
This is a key performance indicator analytics dashboard ppt powerpoint presentation model example topics. This is a five stage process. The stages in this process are kpi proposal, kpi plan, kpi scheme.
KPI Metrics Vector Icon Ppt PowerPoint Presentation Layouts Slide
This is a kpi metrics vector icon ppt powerpoint presentation layouts slide. This is a three stage process. The stages in this process are kpi proposal, kpi plan, kpi scheme.
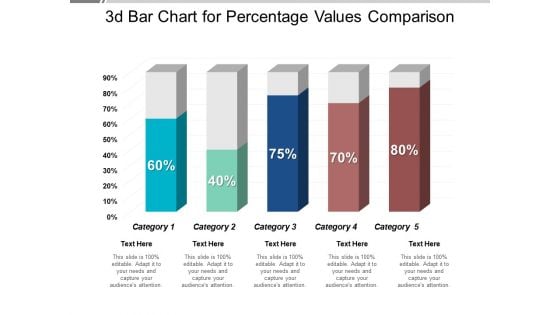
3D Bar Chart For Percentage Values Comparison Ppt PowerPoint Presentation Professional Visual Aids
This is a 3d bar chart for percentage values comparison ppt powerpoint presentation professional visual aids. This is a five stage process. The stages in this process are art, colouring, paint brush.
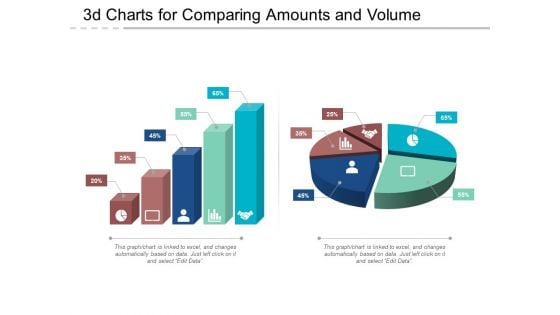
3D Charts For Comparing Amounts And Volume Ppt PowerPoint Presentation Show Deck
This is a 3d charts for comparing amounts and volume ppt powerpoint presentation show deck. This is a five stage process. The stages in this process are art, colouring, paint brush.
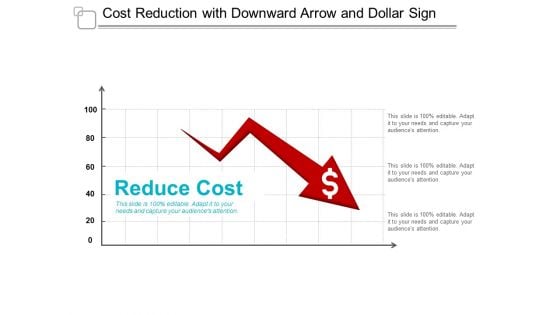
Cost Reduction With Downward Arrow And Dollar Sign Ppt Powerpoint Presentation Infographics Templates
This is a cost reduction with downward arrow and dollar sign ppt powerpoint presentation infographics templates. This is a three stage process. The stages in this process are data analysis, data science, information science.

Learning And Experience Graph With Three Milestones Ppt PowerPoint Presentation Model Introduction
This is a learning and experience graph with three milestones ppt powerpoint presentation model introduction. This is a three stage process. The stages in this process are experience curve, learning curve.

Learning Progress Graph Slow Steep And Plateau Ppt PowerPoint Presentation Professional Gallery
This is a learning progress graph slow steep and plateau ppt powerpoint presentation professional gallery. This is a three stage process. The stages in this process are experience curve, learning curve.
Data Research And Analysis For Mobile Users Ppt PowerPoint Presentation Icon Inspiration
This is a data research and analysis for mobile users ppt powerpoint presentation icon inspiration. This is a four stage process. The stages in this process are mobile analytics, mobile tracking, mobile web analytics.
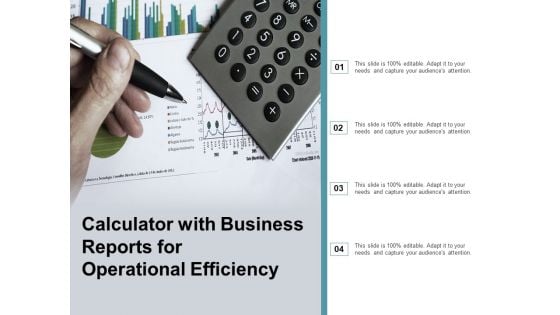
Calculator With Business Reports For Operational Efficiency Ppt Powerpoint Presentation Ideas Infographic Template
This is a calculator with business reports for operational efficiency ppt powerpoint presentation ideas infographic template. This is a four stage process. The stages in this process are business metrics, business kpi, business dashboard.
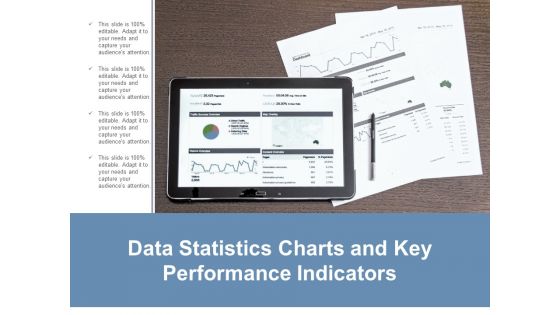
Data Statistics Charts And Key Performance Indicators Ppt Powerpoint Presentation Layouts Guide
This is a data statistics charts and key performance indicators ppt powerpoint presentation layouts guide. This is a four stage process. The stages in this process are business metrics, business kpi, business dashboard.
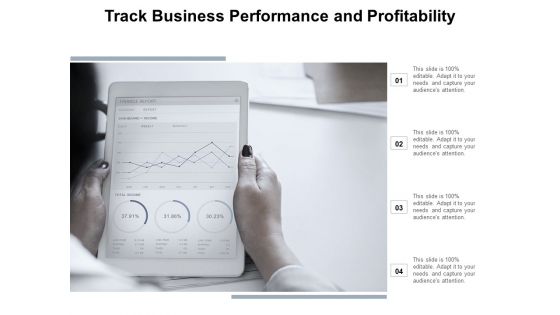
Track Business Performance And Profitability Ppt Powerpoint Presentation File Master Slide
This is a track business performance and profitability ppt powerpoint presentation file master slide. This is a four stage process. The stages in this process are business metrics, business kpi, business dashboard.
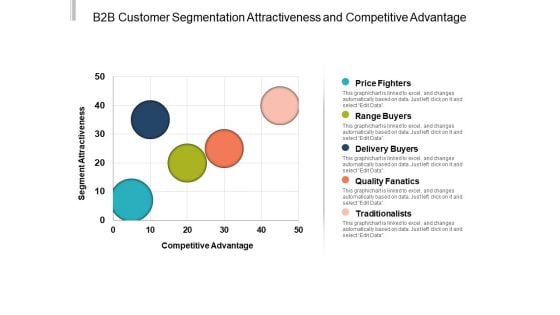
B2b Customer Segmentation Attractiveness And Competitive Advantage Ppt PowerPoint Presentation Background Designs
This is a b2b customer segmentation attractiveness and competitive advantage ppt powerpoint presentation background designs. This is a five stage process. The stages in this process are market segmentation, market mapping, segmenting targeting positioning.

Business Review And Performance Assessment Dashboards Ppt PowerPoint Presentation Infographics Show
This is a business review and performance assessment dashboards ppt powerpoint presentation infographics show. This is a four stage process. The stages in this process are year in review, yearly highlights, countdowns.

Car Dashboard And Speedometer Graphics Ppt PowerPoint Presentation File Graphics Template
This is a car dashboard and speedometer graphics ppt powerpoint presentation file graphics template. This is a four stage process. The stages in this process are fuel gauge, gas gauge, fuel containers.
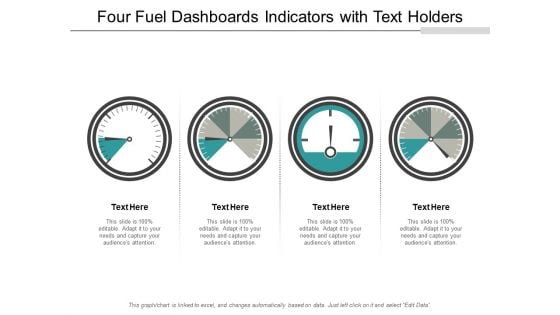
Four Fuel Dashboards Indicators With Text Holders Ppt PowerPoint Presentation File Graphics Design
This is a four fuel dashboards indicators with text holders ppt powerpoint presentation file graphics design. This is a four stage process. The stages in this process are fuel gauge, gas gauge, fuel containers.
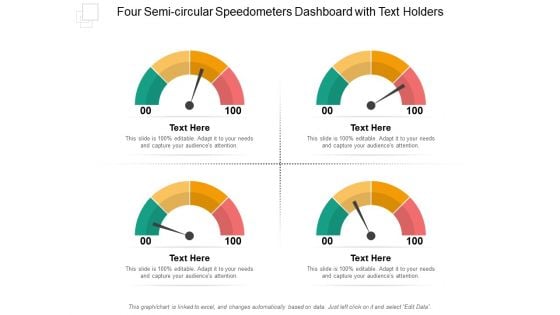
Four Semi Circular Speedometers Dashboard With Text Holders Ppt PowerPoint Presentation File Layouts
This is a four semi circular speedometers dashboard with text holders ppt powerpoint presentation file layouts. This is a four stage process. The stages in this process are fuel gauge, gas gauge, fuel containers.
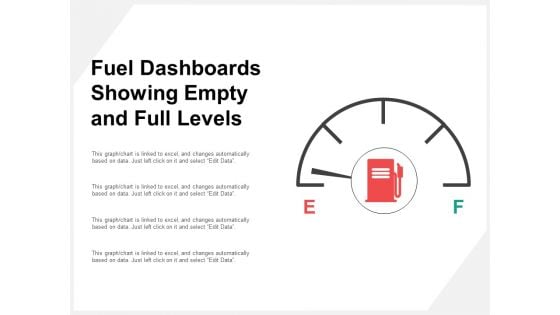
Fuel Dashboards Showing Empty And Full Levels Ppt PowerPoint Presentation Professional Slide Portrait
This is a fuel dashboards showing empty and full levels ppt powerpoint presentation professional slide portrait. This is a four stage process. The stages in this process are fuel gauge, gas gauge, fuel containers.
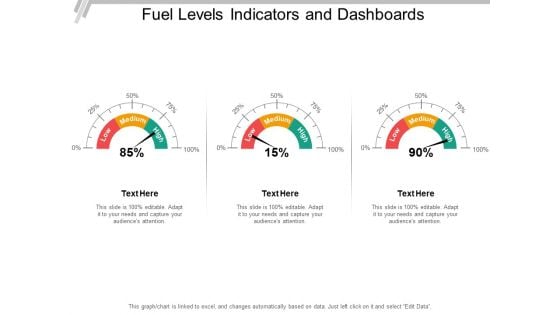
Fuel Levels Indicators And Dashboards Ppt PowerPoint Presentation Outline Skills
This is a fuel levels indicators and dashboards ppt powerpoint presentation outline skills. This is a three stage process. The stages in this process are fuel gauge, gas gauge, fuel containers.
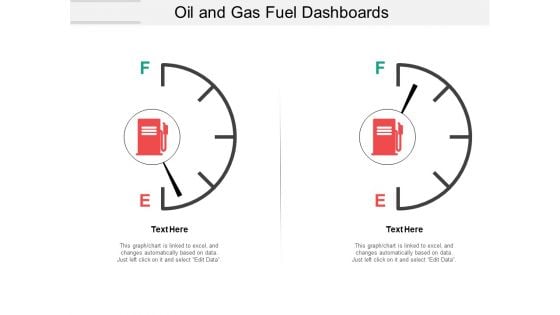
Oil And Gas Fuel Dashboards Ppt PowerPoint Presentation File Introduction
This is a oil and gas fuel dashboards ppt powerpoint presentation file introduction. This is a two stage process. The stages in this process are fuel gauge, gas gauge, fuel containers.
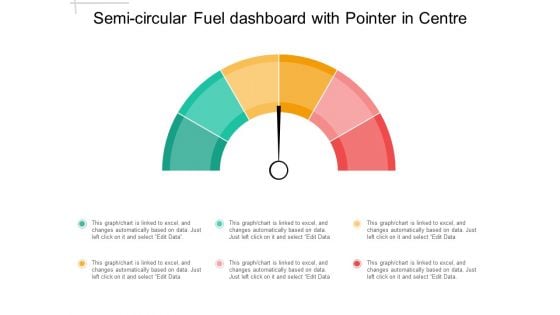
Semi Circular Fuel Dashboard With Pointer In Centre Ppt PowerPoint Presentation Outline Visuals
This is a semi circular fuel dashboard with pointer in centre ppt powerpoint presentation outline visuals. This is a three stage process. The stages in this process are fuel gauge, gas gauge, fuel containers.

Three Dashboard Speed Indicators With Text Holders Ppt PowerPoint Presentation Summary Layout
This is a three dashboard speed indicators with text holders ppt powerpoint presentation summary layout. This is a three stage process. The stages in this process are fuel gauge, gas gauge, fuel containers.
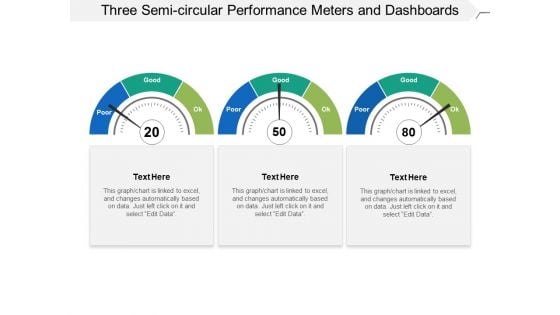
Three Semi Circular Performance Meters And Dashboards Ppt PowerPoint Presentation Slides Influencers
This is a three semi circular performance meters and dashboards ppt powerpoint presentation slides influencers. This is a three stage process. The stages in this process are fuel gauge, gas gauge, fuel containers.
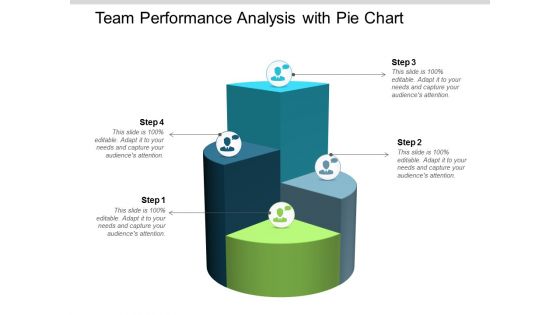
Team Performance Analysis With Pie Chart Ppt Powerpoint Presentation Infographic Template Slideshow
This is a team performance analysis with pie chart ppt powerpoint presentation infographic template slideshow. This is a four stage process. The stages in this process are team performance, member performance, group performance.
Human Hand With Percent Sign Ppt PowerPoint Presentation Icon Clipart Images
This is a human hand with percent sign ppt powerpoint presentation icon clipart images. This is a three stage process. The stages in this process are percentage icon, dividend icon, portion icon.
Percentage Icon In Circle With Text Holders Ppt PowerPoint Presentation Layouts Inspiration
This is a percentage icon in circle with text holders ppt powerpoint presentation layouts inspiration. This is a three stage process. The stages in this process are percentage icon, dividend icon, portion icon.
Percentage Symbol With Text Holders Ppt PowerPoint Presentation Example 2015
This is a percentage symbol with text holders ppt powerpoint presentation example 2015. This is a three stage process. The stages in this process are percentage icon, dividend icon, portion icon.
Percentage Value Comparison Pie Chart Icon Ppt PowerPoint Presentation Model Clipart Images
This is a percentage value comparison pie chart icon ppt powerpoint presentation model clipart images. This is a three stage process. The stages in this process are percentage icon, dividend icon, portion icon.
White Percentage Sign In Green Circle Ppt PowerPoint Presentation Outline Templates
This is a white percentage sign in green circle ppt powerpoint presentation outline templates. This is a three stage process. The stages in this process are percentage icon, dividend icon, portion icon.
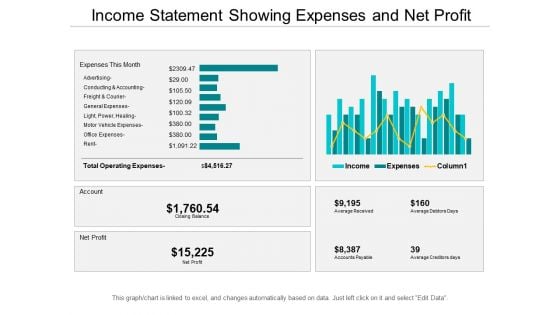
Income Statement Showing Expenses And Net Profit Ppt PowerPoint Presentation Slides Example
This is a income statement showing expenses and net profit ppt powerpoint presentation slides example. This is a five stage process. The stages in this process are accounting review, accounting report, accounting statement.
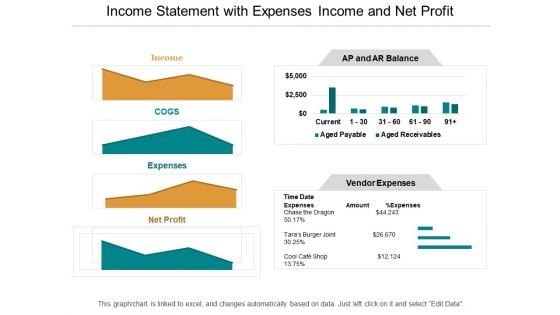
Income Statement With Expenses Income And Net Profit Ppt PowerPoint Presentation Infographic Template Smartart
This is a income statement with expenses income and net profit ppt powerpoint presentation infographic template smartart. This is a four stage process. The stages in this process are accounting review, accounting report, accounting statement.

Pos System Accept Card Payment Ppt PowerPoint Presentation Model Graphics Design
This is a pos system accept card payment ppt powerpoint presentation model graphics design. This is a four stage process. The stages in this process are point of purchase, point of sale system, pos.
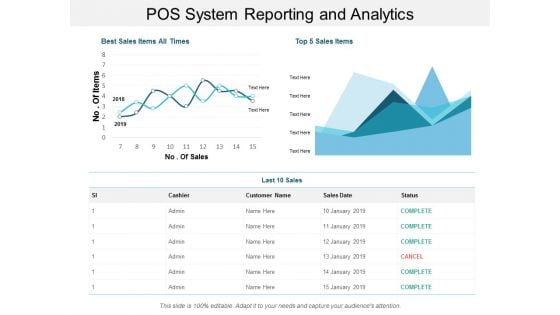
Pos System Reporting And Analytics Ppt PowerPoint Presentation Summary Gallery
This is a pos system reporting and analytics ppt powerpoint presentation summary gallery. This is a two stage process. The stages in this process are point of purchase, point of sale system, pos.
Spinning Wheel With Dollar Sign Vector Icon Ppt PowerPoint Presentation Portfolio Deck Cpb
This is a spinning wheel with dollar sign vector icon ppt powerpoint presentation portfolio deck cpb. This is a four stage process. The stages in this process are wheel of fortune, american game, wheel watchers.

Fixed Assets Classification Diagram Powerpoint Slide Backgrounds
This is a fixed assets classification diagram powerpoint slide backgrounds. This is a four stage process. The stages in this process are current book value by asset type, original cost by asset type, asset count by asset type, current value by department.
Six Steps In Linear Flow With Icons Sales Strategies And Finacial Projections Ppt Powerpoint Presentation Inspiration Guide
This is a six steps in linear flow with icons sales strategies and finacial projections ppt powerpoint presentation inspiration guide. This is a six stage process. The stages in this process are 7 point infographic, 7 steps infographic, 7 stages infographic.
three steps in linear flow with icons sales strategies and finacial projections ppt powerpoint presentation layouts visual aids
This is a three steps in linear flow with icons sales strategies and finacial projections ppt powerpoint presentation layouts visual aids. This is a three stage process. The stages in this process are 7 point infographic, 7 steps infographic, 7 stages infographic.
Bar Graph Icon For Research Analysis Ppt PowerPoint Presentation Summary Portfolio
Presenting this set of slides with name bar graph icon for research analysis ppt powerpoint presentation summary portfolio. This is a three stage process. The stages in this process are data visualization icon, research analysis, business focus. This is a completely editable PowerPoint presentation and is available for immediate download. Download now and impress your audience.
Data Representation Vector Icon Ppt PowerPoint Presentation Infographic Template Samples
Presenting this set of slides with name data representation vector icon ppt powerpoint presentation infographic template samples. This is a one stage process. The stages in this process are data visualization icon, research analysis, business focus. This is a completely editable PowerPoint presentation and is available for immediate download. Download now and impress your audience.

After POS Credit Card Image Ppt PowerPoint Presentation File Vector
Presenting this set of slides with name after pos credit card image ppt powerpoint presentation file vector. This is a one stage process. The stages in this process are business, finance, marketing, strategy, investment. This is a completely editable PowerPoint presentation and is available for immediate download. Download now and impress your audience.


 Continue with Email

 Home
Home


