icons
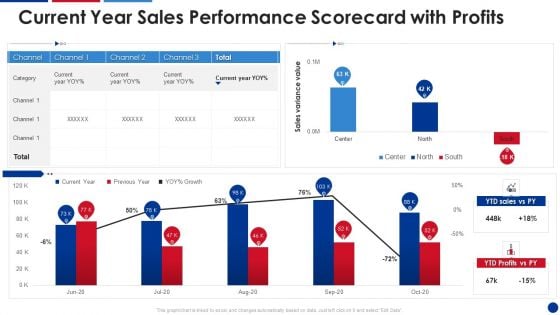
Current Year Sales Performance Scorecard With Profits Structure PDF
This graph or chart is linked to excel, and changes automatically based on data. Just left click on it and select Edit Data. Deliver and pitch your topic in the best possible manner with this Current Year Sales Performance Scorecard With Profits Structure PDF. Use them to share invaluable insights on Current Year, YTD Sales, Previous Year and impress your audience. This template can be altered and modified as per your expectations. So, grab it now.
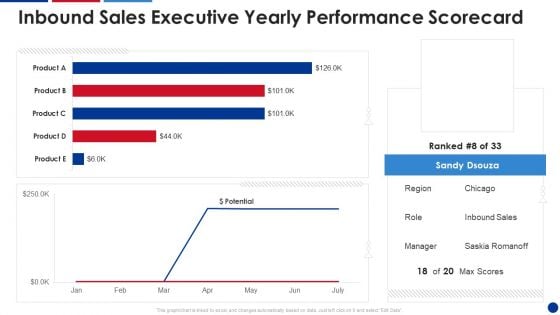
Inbound Sales Executive Yearly Performance Scorecard Information PDF
This graph or chart is linked to excel, and changes automatically based on data. Just left click on it and select Edit Data. Deliver and pitch your topic in the best possible manner with this Inbound Sales Executive Yearly Performance Scorecard Information PDF. Use them to share invaluable insights on Inbound Sales, Executive Yearly, Performance Scorecard and impress your audience. This template can be altered and modified as per your expectations. So, grab it now.
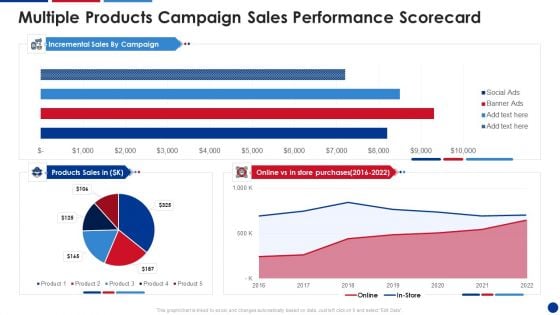
Multiple Products Campaign Sales Performance Scorecard Download PDF
This graph or chart is linked to excel, and changes automatically based on data. Just left click on it and select Edit Data. Deliver an awe inspiring pitch with this creative Multiple Products Campaign Sales Performance Scorecard Download PDF bundle. Topics like Incremental Sales, Products Sales, Store Purchases can be discussed with this completely editable template. It is available for immediate download depending on the needs and requirements of the user.
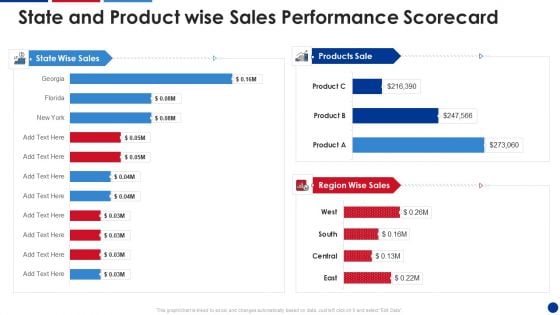
State And Product Wise Sales Performance Scorecard Summary PDF
This graph or chart is linked to excel, and changes automatically based on data. Just left click on it and select Edit Data. Deliver an awe inspiring pitch with this creative State And Product Wise Sales Performance Scorecard Summary PDF bundle. Topics like State Wise Sales, Products Sale, Region Wise Sales can be discussed with this completely editable template. It is available for immediate download depending on the needs and requirements of the user.
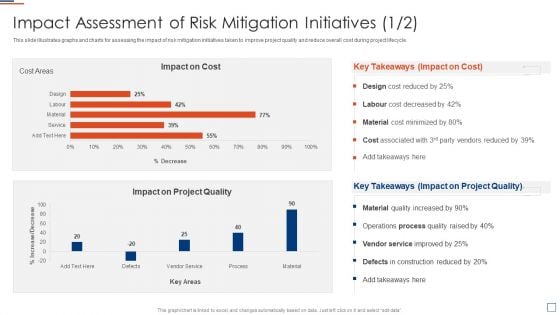
Risk Evaluation And Mitigation Impact Assessment Of Risk Mitigation Initiatives Introduction PDF
This slide illustrates graphs and charts for assessing the impact of risk mitigation initiatives taken to improve project quality and reduce overall cost during project lifecycle. Deliver an awe inspiring pitch with this creative Risk Evaluation And Mitigation Impact Assessment Of Risk Mitigation Initiatives Introduction PDF bundle. Topics like Project Quality, Impact Cost, Material Quality can be discussed with this completely editable template. It is available for immediate download depending on the needs and requirements of the user.
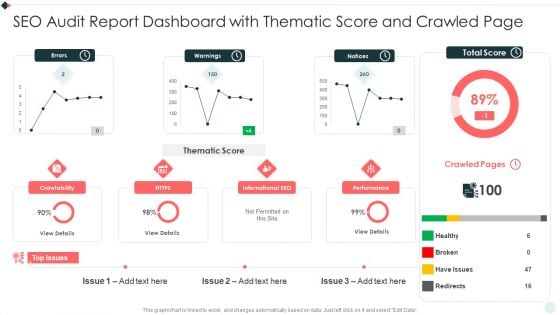
SEO Audit Summary To Increase SEO Audit Report Dashboard With Thematic Score Download PDF
This graph or chart is linked to excel, and changes automatically based on data. Just left click on it and select Edit Data. Deliver an awe inspiring pitch with this creative SEO Audit Summary To Increase SEO Audit Report Dashboard With Thematic Score Download PDF bundle. Topics like Total Score, Crawled Pages, Top Issues can be discussed with this completely editable template. It is available for immediate download depending on the needs and requirements of the user.
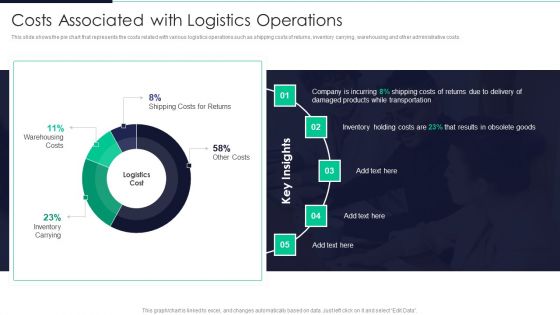
Developing Excellence In Logistics Operations Costs Associated With Logistics Operations Portrait PDF
This slide shows the pie chart that represents the costs related with various logistics operations such as shipping costs of returns, inventory carrying, warehousing and other administrative costs.Deliver and pitch your topic in the best possible manner with this Developing Excellence In Logistics Operations Costs Associated With Logistics Operations Portrait PDF Use them to share invaluable insights on Inventory Carrying, Inventory Carrying, Shipping Costs and impress your audience. This template can be altered and modified as per your expectations. So, grab it now.
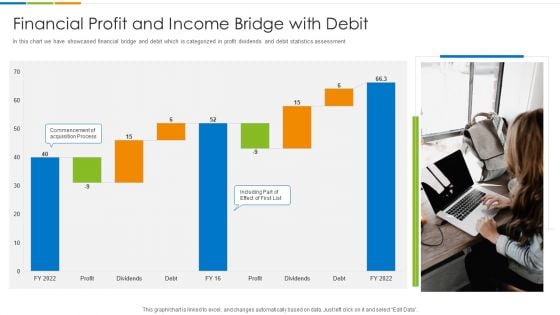
Financial Profit And Income Bridge With Debit Ppt PowerPoint Presentation File Outline PDF
In this chart we have showcased financial bridge and debit which is categorized in profit dividends and debit statistics assessment. Pitch your topic with ease and precision using this Financial Profit And Income Bridge With Debit Ppt PowerPoint Presentation File Outline PDF. This layout presents information on Profit Dividends, Debt Commencement, Acquisition Process. It is also available for immediate download and adjustment. So, changes can be made in the color, design, graphics or any other component to create a unique layout.
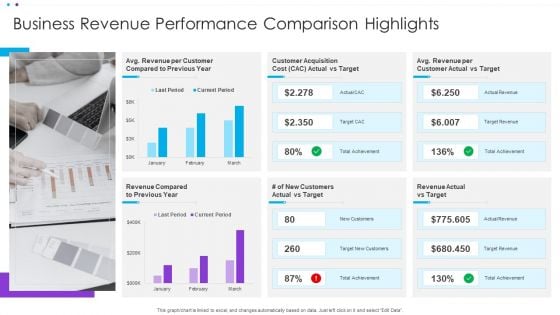
Business Revenue Performance Comparison Highlights Ppt Summary Rules PDF
This graph or chart is linked to excel, and changes automatically based on data. Just left click on it and select Edit Data. Showcasing this set of slides titled Business Revenue Performance Comparison Highlights Ppt Summary Rules PDF. The topics addressed in these templates are Customer Acquisition, Customer Actual, Revenue Compared. All the content presented in this PPT design is completely editable. Download it and make adjustments in color, background, font etc. as per your unique business setting.
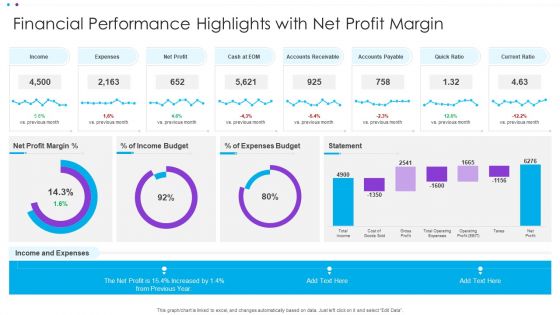
Financial Performance Highlights With Net Profit Margin Ppt Model Ideas PDF
This graph or chart is linked to excel, and changes automatically based on data. Just left click on it and select Edit Data. Pitch your topic with ease and precision using this Financial Performance Highlights With Net Profit Margin Ppt Model Ideas PDF. This layout presents information on Net Profit, Accounts Receivable, Accounts Payable. It is also available for immediate download and adjustment. So, changes can be made in the color, design, graphics or any other component to create a unique layout.
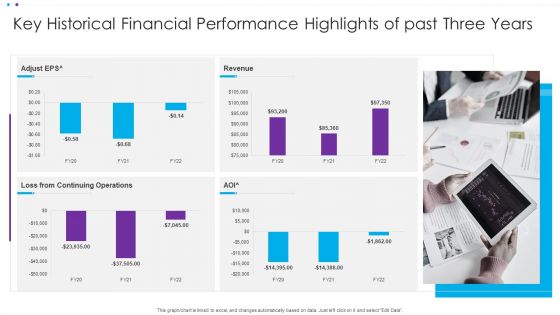
Key Historical Financial Performance Highlights Of Past Three Years Ppt Ideas Background PDF
This graph or chart is linked to excel, and changes automatically based on data. Just left click on it and select Edit Data. Showcasing this set of slides titled Key Historical Financial Performance Highlights Of Past Three Years Ppt Ideas Background PDF. The topics addressed in these templates are Continuing Operations, Adjust EP. All the content presented in this PPT design is completely editable. Download it and make adjustments in color, background, font etc. as per your unique business setting.
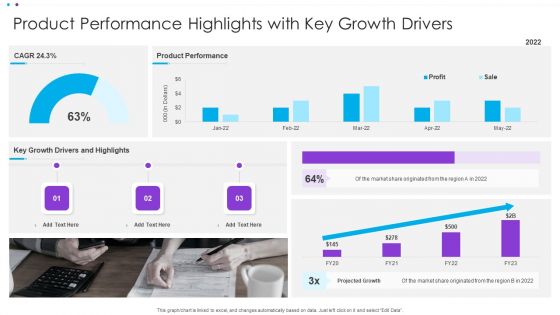
Product Performance Highlights With Key Growth Drivers Ppt Pictures Design Templates PDF
This graph or chart is linked to excel, and changes automatically based on data. Just left click on it and select Edit Data. Pitch your topic with ease and precision using this Product Performance Highlights With Key Growth Drivers Ppt Pictures Design Templates PDF. This layout presents information on Product Performance, Key Growth, Projected Growth. It is also available for immediate download and adjustment. So, changes can be made in the color, design, graphics or any other component to create a unique layout.
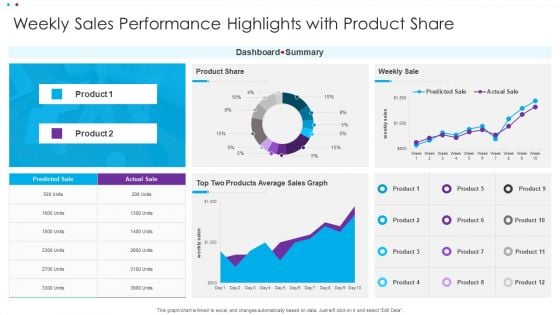
Weekly Sales Performance Highlights With Product Share Ppt File Information PDF
This graph or chart is linked to excel, and changes automatically based on data. Just left click on it and select Edit Data. Pitch your topic with ease and precision using this Weekly Sales Performance Highlights With Product Share Ppt File Information PDF. This layout presents information on Dashboard Summary, Weekly Sale, Product Share. It is also available for immediate download and adjustment. So, changes can be made in the color, design, graphics or any other component to create a unique layout.
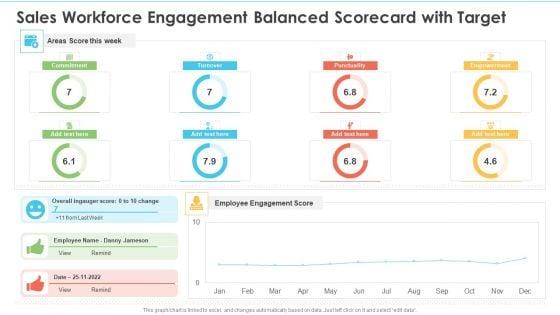
Sales Workforce Engagement Balanced Scorecard With Target Ppt Professional Designs Download PDF
This graph or chart is linked to excel, and changes automatically based on data. Just left click on it and select edit data. Deliver an awe inspiring pitch with this creative Sales Workforce Engagement Balanced Scorecard With Target Ppt Professional Designs Download PDF bundle. Topics like Areas Score Week, Employee Engagement Score, Overall Ingauger Score can be discussed with this completely editable template. It is available for immediate download depending on the needs and requirements of the user.
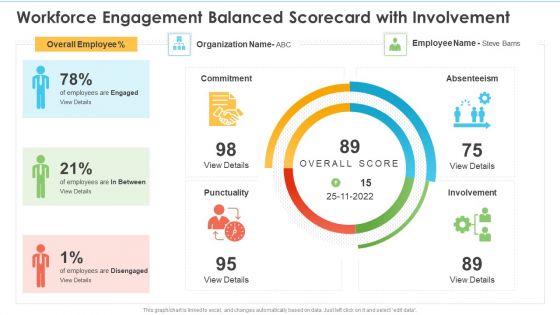
Workforce Engagement Balanced Scorecard With Involvement Ppt Portfolio Background Images PDF
This graph or chart is linked to excel, and changes automatically based on data. Just left click on it and select edit data. Deliver and pitch your topic in the best possible manner with this Workforce Engagement Balanced Scorecard With Involvement Ppt Portfolio Background Images PDF. Use them to share invaluable insights on Employee, Organization, Overall Employee and impress your audience. This template can be altered and modified as per your expectations. So, grab it now.
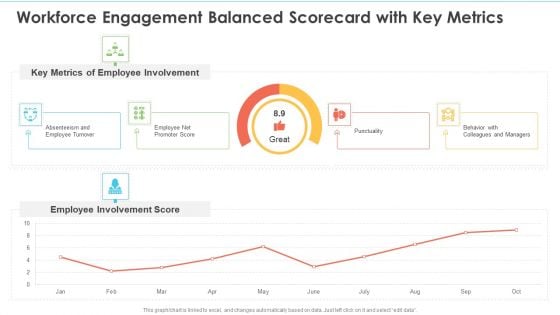
Workforce Engagement Balanced Scorecard With Key Metrics Ppt Inspiration Deck PDF
This graph or chart is linked to excel, and changes automatically based on data. Just left click on it and select edit data. Deliver an awe inspiring pitch with this creative Workforce Engagement Balanced Scorecard With Key Metrics Ppt Inspiration Deck PDF bundle. Topics like Key Metrics, Employee Involvement, Employee Involvement Score can be discussed with this completely editable template. It is available for immediate download depending on the needs and requirements of the user.
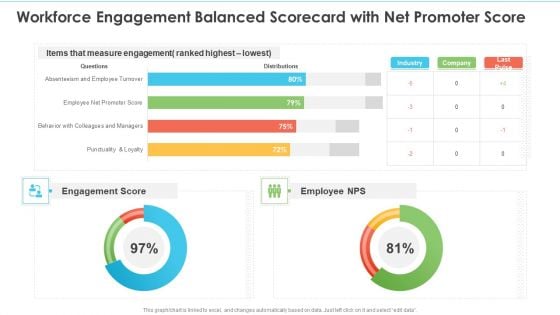
Workforce Engagement Balanced Scorecard With Net Promoter Score Ppt Slides Display PDF
This graph or chart is linked to excel, and changes automatically based on data. Just left click on it and select edit data. Deliver an awe inspiring pitch with this creative Workforce Engagement Balanced Scorecard With Net Promoter Score Ppt Slides Display PDF bundle. Topics like Measure Engagement, Engagement Score, Employee NPS can be discussed with this completely editable template. It is available for immediate download depending on the needs and requirements of the user.
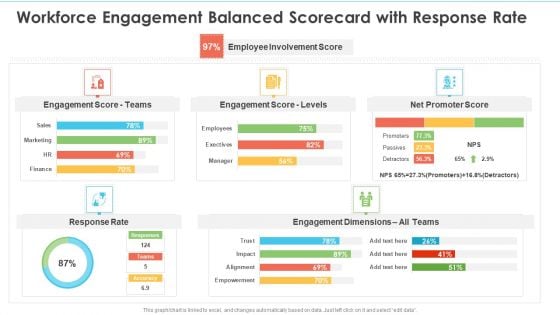
Workforce Engagement Balanced Scorecard With Response Rate Ppt Deck PDF
This graph or chart is linked to excel, and changes automatically based on data. Just left click on it and select edit data. Deliver an awe inspiring pitch with this creative Workforce Engagement Balanced Scorecard With Response Rate Ppt Deck PDF bundle. Topics like Engagement Score Teams, Engagement Score Levels, Net Promoter Score can be discussed with this completely editable template. It is available for immediate download depending on the needs and requirements of the user.
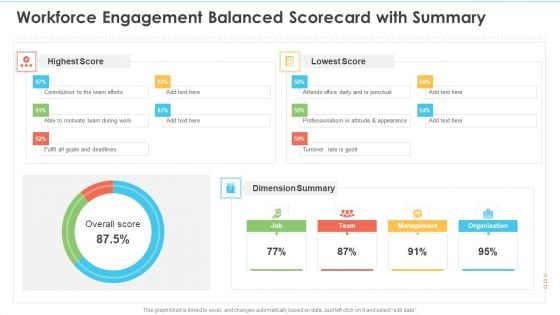
Workforce Engagement Balanced Scorecard With Summary Ppt Layouts Template PDF
This graph or chart is linked to excel, and changes automatically based on data. Just left click on it and select edit data. Deliver and pitch your topic in the best possible manner with this Workforce Engagement Balanced Scorecard With Summary Ppt Layouts Template PDF. Use them to share invaluable insights on Highest Score, Lowest Score, Dimension Summary and impress your audience. This template can be altered and modified as per your expectations. So, grab it now.
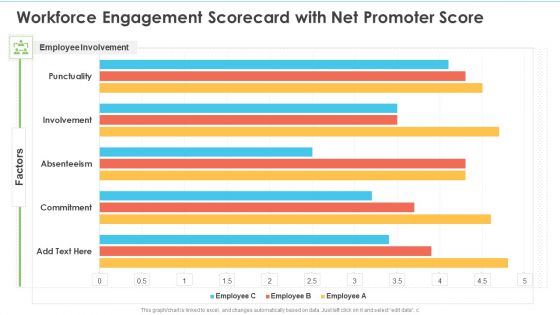
Workforce Engagement Scorecard With Net Promoter Score Ppt Portfolio Images PDF
This graph or chart is linked to excel, and changes automatically based on data. Just left click on it and select edit data. Deliver and pitch your topic in the best possible manner with this Workforce Engagement Scorecard With Net Promoter Score Ppt Portfolio Images PDF. Use them to share invaluable insights on Employee Involvement, Punctuality Involvement, Absenteeism and impress your audience. This template can be altered and modified as per your expectations. So, grab it now.
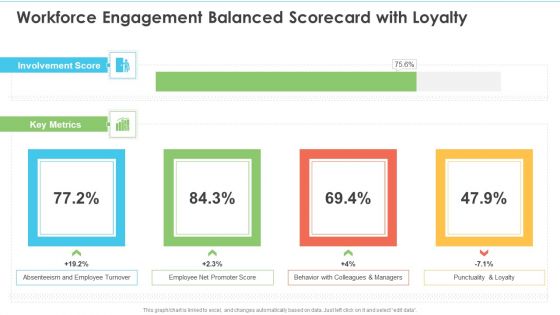
Workforce Engagement Balanced Scorecard With Loyalty Ppt Styles Good PDF
This graph or chart is linked to excel, and changes automatically based on data. Just left click on it and select edit data. Deliver an awe inspiring pitch with this creative Workforce Engagement Balanced Scorecard With Loyalty Ppt Styles Good PDF bundle. Topics like Involvement Score, Key Metrics, Employee Turnover can be discussed with this completely editable template. It is available for immediate download depending on the needs and requirements of the user.
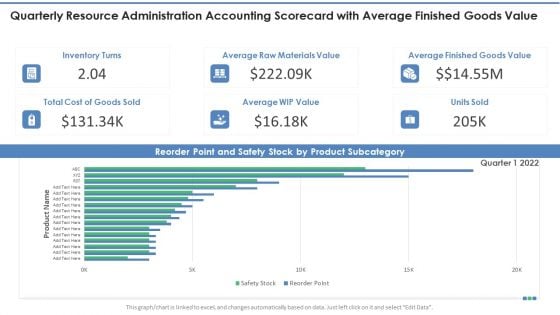
Quarterly Resource Administration Accounting Scorecard With Average Finished Goods Value Introduction PDF
This graph or chart is linked to excel, and changes automatically based on data. Just left click on it and select Edit Data. Deliver an awe inspiring pitch with this creative Quarterly Resource Administration Accounting Scorecard With Average Finished Goods Value Introduction PDF bundle. Topics like Inventory Turns, Average WIP Value, Total Cost Goods can be discussed with this completely editable template. It is available for immediate download depending on the needs and requirements of the user.
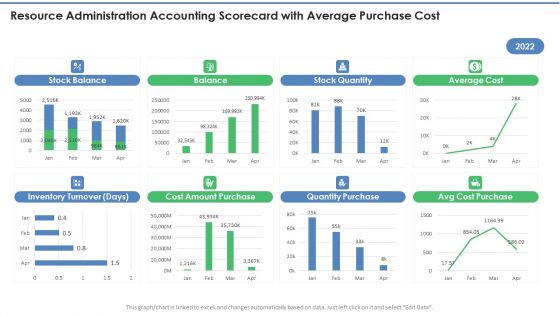
Resource Administration Accounting Scorecard With Average Purchase Cost Structure PDF
This graph or chart is linked to excel, and changes automatically based on data. Just left click on it and select Edit Data. Deliver and pitch your topic in the best possible manner with this Resource Administration Accounting Scorecard With Average Purchase Cost Structure PDF. Use them to share invaluable insights on Stock Balance, Stock Quantity, Average Cost and impress your audience. This template can be altered and modified as per your expectations. So, grab it now.
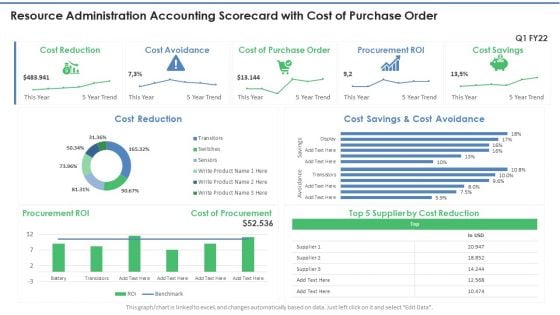
Resource Administration Accounting Scorecard With Cost Of Purchase Order Download PDF
This graph or chart is linked to excel, and changes automatically based on data. Just left click on it and select Edit Data. Deliver an awe inspiring pitch with this creative Resource Administration Accounting Scorecard With Cost Of Purchase Order Download PDF bundle. Topics like Cost Reduction, Cost Avoidance, Procurement ROI can be discussed with this completely editable template. It is available for immediate download depending on the needs and requirements of the user.
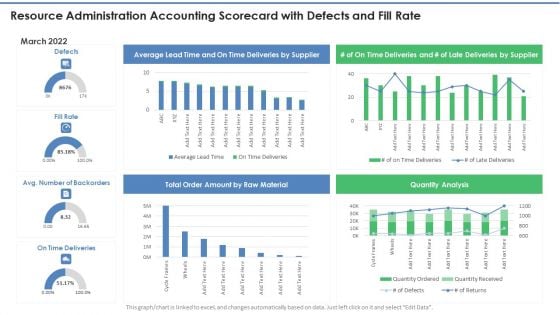
Resource Administration Accounting Scorecard With Defects And Fill Rate Mockup PDF
This graph or chart is linked to excel, and changes automatically based on data. Just left click on it and select Edit Data. Deliver and pitch your topic in the best possible manner with this Resource Administration Accounting Scorecard With Defects And Fill Rate Mockup PDF. Use them to share invaluable insights on Total Order Amount, Raw Material, Quantity Analysis and impress your audience. This template can be altered and modified as per your expectations. So, grab it now.
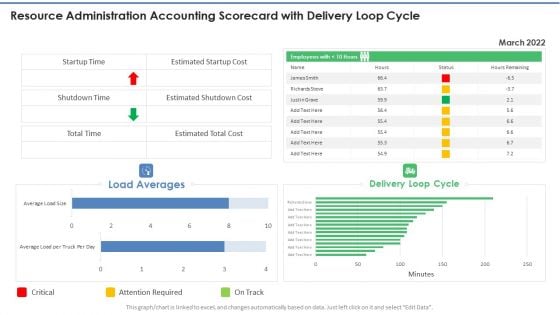
Resource Administration Accounting Scorecard With Delivery Loop Cycle Graphics PDF
This graph or chart is linked to excel, and changes automatically based on data. Just left click on it and select Edit Data. Deliver an awe inspiring pitch with this creative Resource Administration Accounting Scorecard With Delivery Loop Cycle Graphics PDF bundle. Topics like Load Averages, Delivery Loop Cycle, Attention Required can be discussed with this completely editable template. It is available for immediate download depending on the needs and requirements of the user.
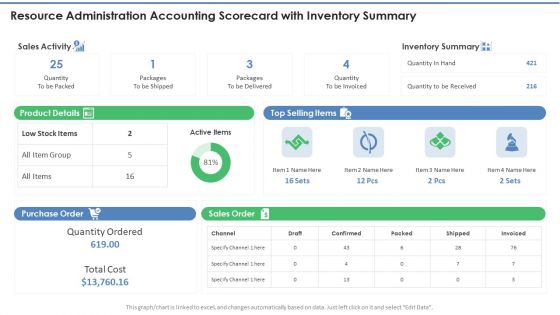
Resource Administration Accounting Scorecard With Inventory Summary Designs PDF
This graph or chart is linked to excel, and changes automatically based on data. Just left click on it and select Edit Data. Deliver and pitch your topic in the best possible manner with this Resource Administration Accounting Scorecard With Inventory Summary Designs PDF. Use them to share invaluable insights on Product Details, Top Selling Item, Purchase Order and impress your audience. This template can be altered and modified as per your expectations. So, grab it now.
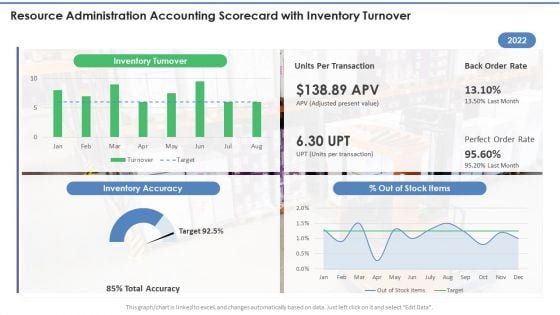
Resource Administration Accounting Scorecard With Inventory Turnover Microsoft PDF
This graph or chart is linked to excel, and changes automatically based on data. Just left click on it and select Edit Data. Deliver an awe inspiring pitch with this creative Resource Administration Accounting Scorecard With Inventory Turnover Microsoft PDF bundle. Topics like Inventory Turnover, Inventory Accuracy, Back Order Rate can be discussed with this completely editable template. It is available for immediate download depending on the needs and requirements of the user.

Resource Administration Accounting Scorecard With Inventory Value Infographics PDF
This graph or chart is linked to excel, and changes automatically based on data. Just left click on it and select Edit Data. Deliver and pitch your topic in the best possible manner with this Resource Administration Accounting Scorecard With Inventory Value Infographics PDF. Use them to share invaluable insights on Current Inventory, Stock Positions, Missing Stock and impress your audience. This template can be altered and modified as per your expectations. So, grab it now.

Resource Administration Accounting Scorecard With Order And Inventory Details Mockup PDF
This graph or chart is linked to excel, and changes automatically based on data. Just left click on it and select Edit Data. Deliver and pitch your topic in the best possible manner with this Resource Administration Accounting Scorecard With Order And Inventory Details Mockup PDF. Use them to share invaluable insights on Volume Today, Financial Performance, State wise and impress your audience. This template can be altered and modified as per your expectations. So, grab it now.
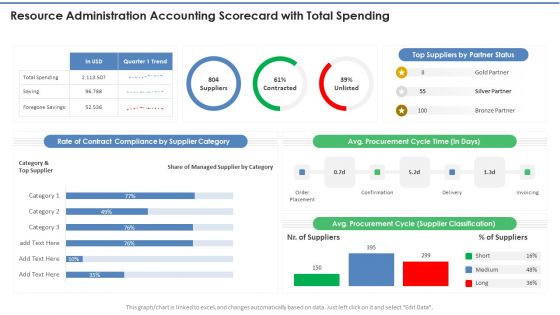
Resource Administration Accounting Scorecard With Total Spending Professional PDF
This graph or chart is linked to excel, and changes automatically based on data. Just left click on it and select Edit Data. Deliver and pitch your topic in the best possible manner with this Resource Administration Accounting Scorecard With Total Spending Professional PDF. Use them to share invaluable insights on Supplier Category, Cycle Time, Top Suppliers and impress your audience. This template can be altered and modified as per your expectations. So, grab it now.
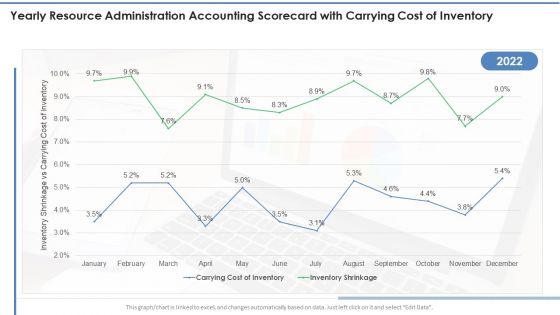
Yearly Resource Administration Accounting Scorecard With Carrying Cost Of Inventory Slides PDF
This graph or chart is linked to excel, and changes automatically based on data. Just left click on it and select Edit Data. Deliver an awe inspiring pitch with this creative Yearly Resource Administration Accounting Scorecard With Carrying Cost Of Inventory Slides PDF bundle. Topics like Carrying Cost Inventory, Inventory Shrinkage can be discussed with this completely editable template. It is available for immediate download depending on the needs and requirements of the user.
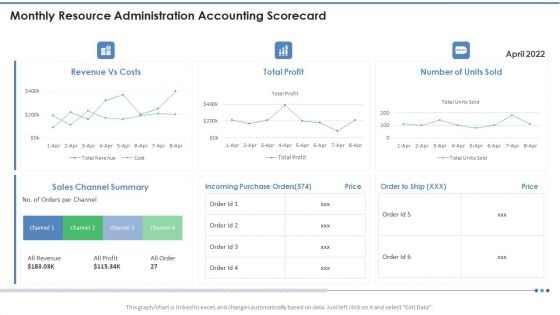
Monthly Resource Administration Accounting Scorecard Template PDF
This graph or chart is linked to excel, and changes automatically based on data. Just left click on it and select Edit Data. Deliver and pitch your topic in the best possible manner with this Monthly Resource Administration Accounting Scorecard Template PDF. Use them to share invaluable insights on Revenue Vs Costs, Total Profit, Number Units Sold and impress your audience. This template can be altered and modified as per your expectations. So, grab it now.
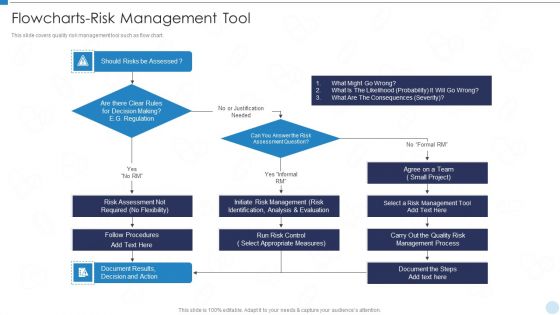
QRM Flowcharts Risk Management Tool Ppt File Slideshow PDF
This slide covers quality risk management tool such as flow chart. Presenting QRM Flowcharts Risk Management Tool Ppt File Slideshow PDF to provide visual cues and insights. Share and navigate important information on one stages that need your due attention. This template can be used to pitch topics like Risk Management, Analysis, Evaluation. In addtion, this PPT design contains high resolution images, graphics, etc, that are easily editable and available for immediate download.
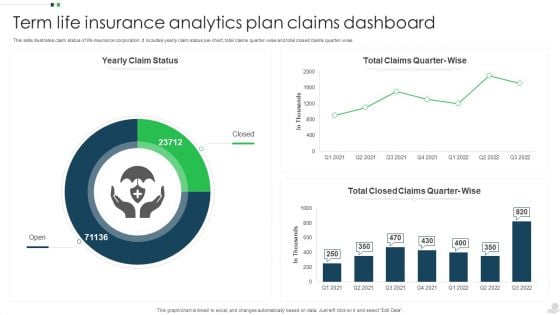
Term Life Insurance Analytics Plan Claims Dashboard Structure PDF
This slide illustrates claim status of life insurance corporation. It includes yearly claim status pie chart, total claims quarter-wise and total closed claims quarter wise. Pitch your topic with ease and precision using this Term Life Insurance Analytics Plan Claims Dashboard Structure PDF. This layout presents information on Insurance Analytics, Plan Claims Dashboard. It is also available for immediate download and adjustment. So, changes can be made in the color, design, graphics or any other component to create a unique layout.

Byjus Investor Capital Financing Pitch Deck Byjus Annual Revenue And Growth Rate Background PDF
This slide provides information about the annual revenue and growth rate of Byjus in terms of graph and line chart for 3 years.Deliver an awe inspiring pitch with this creative Byjus Investor Capital Financing Pitch Deck Byjus Annual Revenue And Growth Rate Background PDF bundle. Topics like Annual Revenue, Annual Growth, Previous Period can be discussed with this completely editable template. It is available for immediate download depending on the needs and requirements of the user.

Implementing Moscow Task Prioritization Model Resolving Chicken And Egg Problem In Organization Pictures PDF
This slide covers the task and priority table with estimated effort and chart for the tasks performed based on Moscow prioritization model.Deliver an awe inspiring pitch with this creative Implementing Moscow Task Prioritization Model Resolving Chicken And Egg Problem In Organization Pictures PDF bundle. Topics like Estimated Effort, Task And Priority, Total Estimated can be discussed with this completely editable template. It is available for immediate download depending on the needs and requirements of the user.
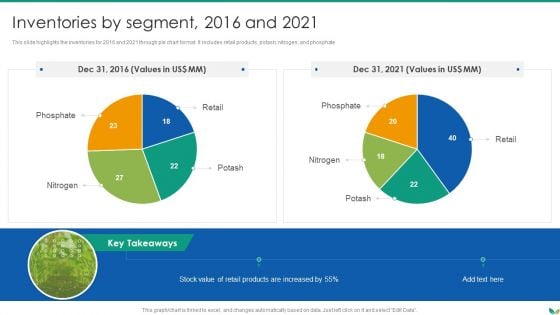
Agricultural Business Company Profile Inventories By Segment 2016 And 2021 Sample PDF
This slide highlights the inventories for 2016 and 2021 through pie chart format. It includes retail products, potash, nitrogen, and phosphate.Deliver and pitch your topic in the best possible manner with this Agricultural Business Company Profile Inventories By Segment 2016 And 2021 Sample PDF Use them to share invaluable insights on Retail Products, Phosphate, Retail and impress your audience. This template can be altered and modified as per your expectations. So, grab it now.
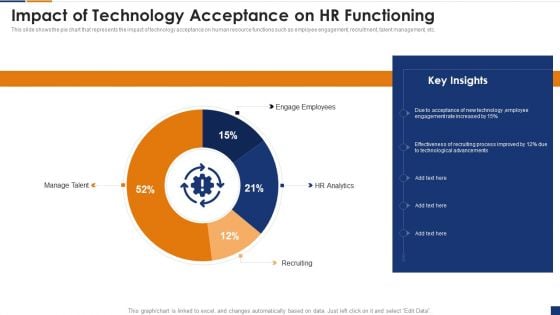
Human Resource Digital Transformation Impact Of Technology Acceptance On HR Download PDF
This slide shows the pie chart that represents the impact of technology acceptance on human resource functions such as employee engagement, recruitment, talent management, etc. Deliver and pitch your topic in the best possible manner with this Human Resource Digital Transformation Impact Of Technology Acceptance On HR Download PDF. Use them to share invaluable insights on Engage Employees, HR Analytics, Manage Talent and impress your audience. This template can be altered and modified as per your expectations. So, grab it now.
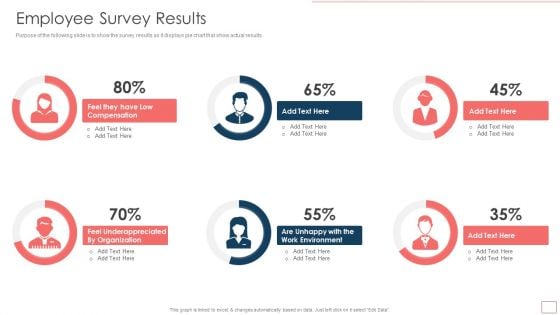
Strategic Human Resource Retention Management Employee Survey Results Template PDF
Purpose of the following slide is to show the survey results as it displays pie chart that show actual results. Deliver and pitch your topic in the best possible manner with this Strategic Human Resource Retention Management Employee Survey Results Template PDF. Use them to share invaluable insights on Compensation, Underappreciated, Work Environment and impress your audience. This template can be altered and modified as per your expectations. So, grab it now.
Managing Employee Turnover Employee Survey Results Microsoft PDF
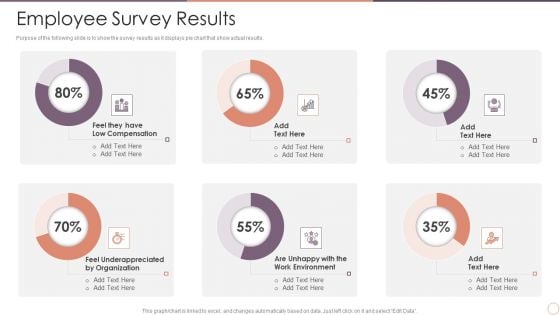
Purpose of the following slide is to show the survey results as it displays pie chart that show actual results. Deliver an awe inspiring pitch with this creative Managing Employee Turnover Employee Survey Results Microsoft PDF bundle. Topics like Low Compensation, Underappreciated, Work Environment can be discussed with this completely editable template. It is available for immediate download depending on the needs and requirements of the user.
Security And Surveillance Company Profile Security Company Sales Revenue Clipart PDF
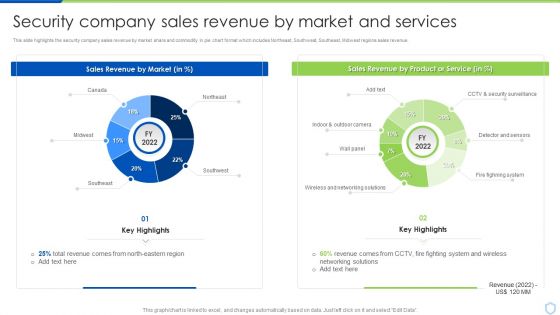
This slide highlights the security company sales revenue by market share and commodity in pie chart format which includes Northeast, Southwest, Southeast, Midwest regions sales revenue.Deliver an awe inspiring pitch with this creative Security And Surveillance Company Profile Security Company Sales Revenue Clipart PDF bundle. Topics like Sales Revenue, Security Surveillance, Networking Solutions can be discussed with this completely editable template. It is available for immediate download depending on the needs and requirements of the user.
Security Camera System Company Profile Security Company Sales Revenue Template PDF
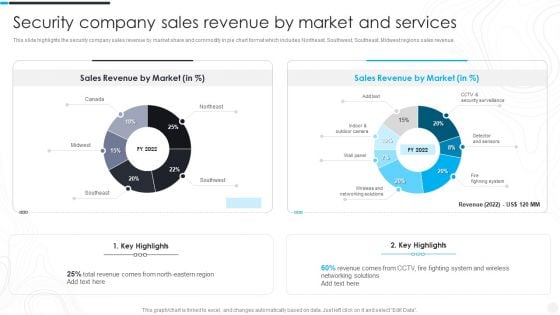
This slide highlights the security company sales revenue by market share and commodity in pie chart format which includes Northeast, Southwest, Southeast, Midwest regions sales revenue.Deliver an awe inspiring pitch with this creative Security Camera System Company Profile Security Company Sales Revenue Template PDF bundle. Topics like Detector And Sensors, Fighning System, Security Surveillance can be discussed with this completely editable template. It is available for immediate download depending on the needs and requirements of the user.
Legal Advisory Company Description Total Revenue And Headcount Graphics PDF
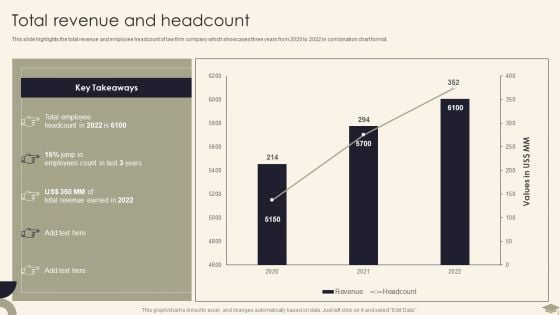
This slide highlights the total revenue and employee headcount of law firm company which showcases three years from 2020 to 2022 in combination chart format.Deliver and pitch your topic in the best possible manner with this Legal Advisory Company Description Total Revenue And Headcount Graphics PDF. Use them to share invaluable insights on Total Employee, Revenue Earned, Employees Count and impress your audience. This template can be altered and modified as per your expectations. So, grab it now.
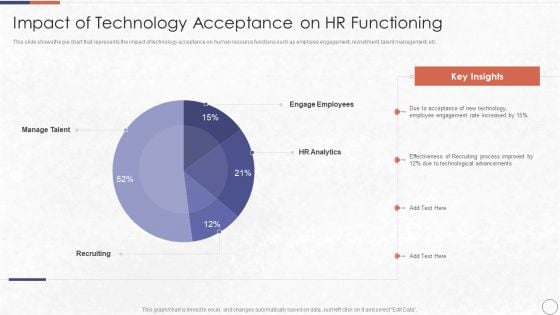
RPA In HR Operations Impact Of Technology Acceptance On HR Functioning Infographics PDF
This slide shows the pie chart that represents the impact of technology acceptance on human resource functions such as employee engagement, recruitment, talent management, etc.Deliver and pitch your topic in the best possible manner with this RPA In HR Operations Impact Of Technology Acceptance On HR Functioning Infographics PDF. Use them to share invaluable insights on Engage Employees, Manage Talent, Employee Engagement and impress your audience. This template can be altered and modified as per your expectations. So, grab it now.
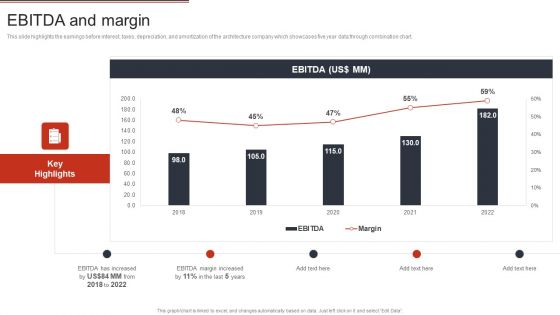
Building Design Firm Details Ebitda And Margin Ppt Professional Shapes PDF
This slide highlights the earnings before interest, taxes, depreciation, and amortization of the architecture company which showcases five year data through combination chart. Deliver and pitch your topic in the best possible manner with this Building Design Firm Details Ebitda And Margin Ppt Professional Shapes PDF. Use them to share invaluable insights on EBITDA Margin Increased, 2018 To 2020 and impress your audience. This template can be altered and modified as per your expectations. So, grab it now.
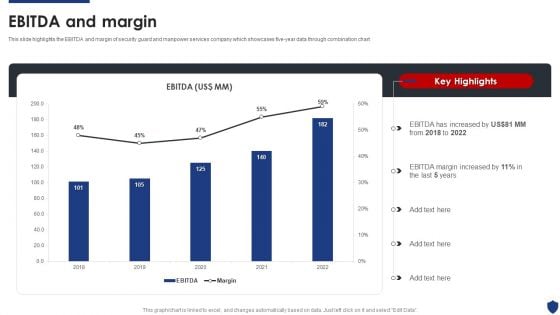
Security Officer Service Company Profile Ebitda And Margin Ppt PowerPoint Presentation File Deck PDF
This slide highlights the EBITDA and margin of security guard and manpower services company which showcases five-year data through combination chart. Deliver and pitch your topic in the best possible manner with this Security Officer Service Company Profile Ebitda And Margin Ppt PowerPoint Presentation File Deck PDF. Use them to share invaluable insights on EBITDA Increased, 2018 To 2022, EBITDA Margin Increased and impress your audience. This template can be altered and modified as per your expectations. So, grab it now.
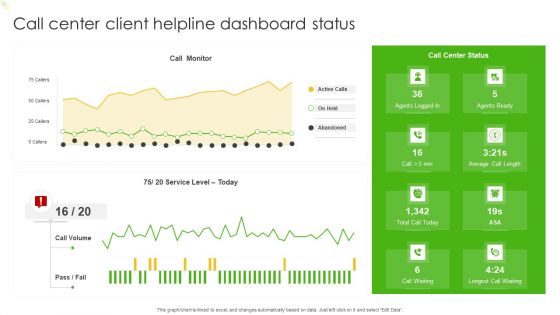
Call Center Client Helpline Dashboard Status Ppt Show Graphics Design PDF
This graph or chart is linked to excel, and changes automatically based on data. Just left click on it and select Edit Data. Showcasing this set of slides titled Call Center Client Helpline Dashboard Status Ppt Show Graphics Design PDF. The topics addressed in these templates are Call Monitor, Active Calls, Abandoned, Agents Ready. All the content presented in this PPT design is completely editable. Download it and make adjustments in color, background, font etc. as per your unique business setting.
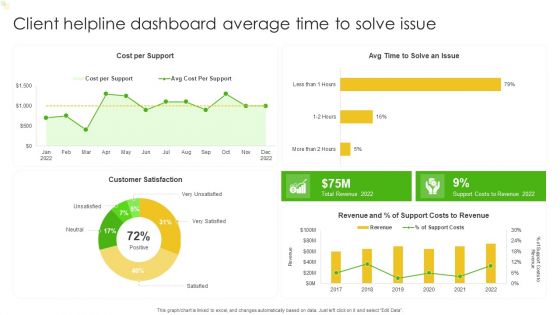
Client Helpline Dashboard Average Time To Solve Issue Ppt Portfolio Visuals PDF
This graph or chart is linked to excel, and changes automatically based on data. Just left click on it and select Edit Data. Showcasing this set of slides titled Client Helpline Dashboard Average Time To Solve Issue Ppt Portfolio Visuals PDF. The topics addressed in these templates are Cost Per Support, Customer Satisfaction, Costs To Revenue. All the content presented in this PPT design is completely editable. Download it and make adjustments in color, background, font etc. as per your unique business setting.
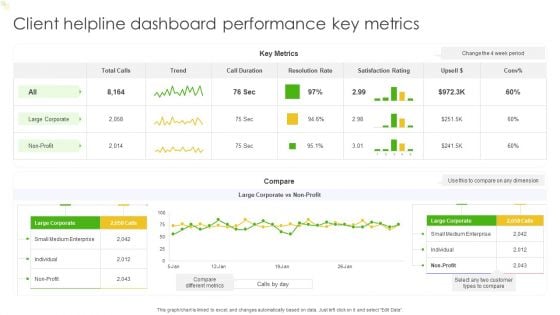
Client Helpline Dashboard Performance Key Metrics Ppt Outline Deck PDF
This graph or chart is linked to excel, and changes automatically based on data. Just left click on it and select Edit Data. Pitch your topic with ease and precision using this Client Helpline Dashboard Performance Key Metrics Ppt Outline Deck PDF. This layout presents information on Key Metrics, Trend, Compare. It is also available for immediate download and adjustment. So, changes can be made in the color, design, graphics or any other component to create a unique layout.
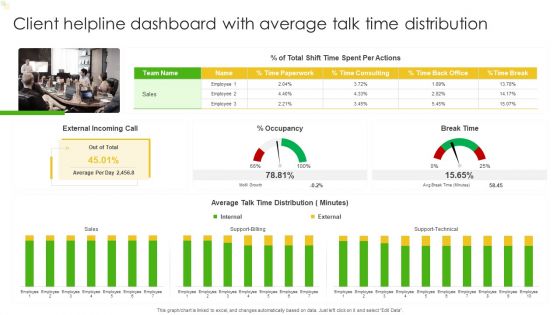
Client Helpline Dashboard With Average Talk Time Distribution Ppt Gallery Backgrounds PDF
This graph or chart is linked to excel, and changes automatically based on data. Just left click on it and select Edit Data. Showcasing this set of slides titled Client Helpline Dashboard With Average Talk Time Distribution Ppt Gallery Backgrounds PDF. The topics addressed in these templates are External Incoming Call, Occupancy, Break Time, Sales. All the content presented in this PPT design is completely editable. Download it and make adjustments in color, background, font etc. as per your unique business setting.
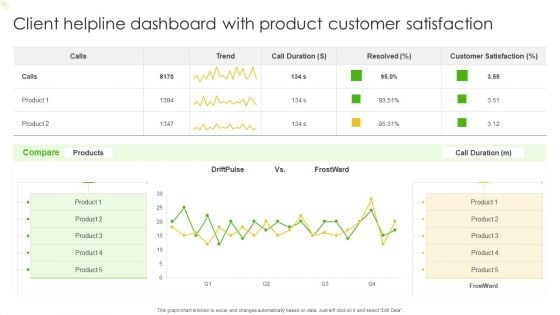
Client Helpline Dashboard With Product Customer Satisfaction Ppt Slides Graphics Template PDF
This graph or chart is linked to excel, and changes automatically based on data. Just left click on it and select Edit Data. Pitch your topic with ease and precision using this Client Helpline Dashboard With Product Customer Satisfaction Ppt Slides Graphics Template PDF. This layout presents information on Customer Satisfaction, Product, Compare. It is also available for immediate download and adjustment. So, changes can be made in the color, design, graphics or any other component to create a unique layout.
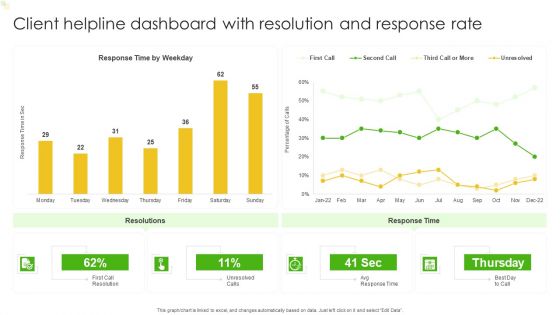
Client Helpline Dashboard With Resolution And Response Rate Ppt File Example Topics PDF
This graph or chart is linked to excel, and changes automatically based on data. Just left click on it and select Edit Data. Showcasing this set of slides titled Client Helpline Dashboard With Resolution And Response Rate Ppt File Example Topics PDF. The topics addressed in these templates are Resolutions, Response Time, Response Time Weekday. All the content presented in this PPT design is completely editable. Download it and make adjustments in color, background, font etc. as per your unique business setting.
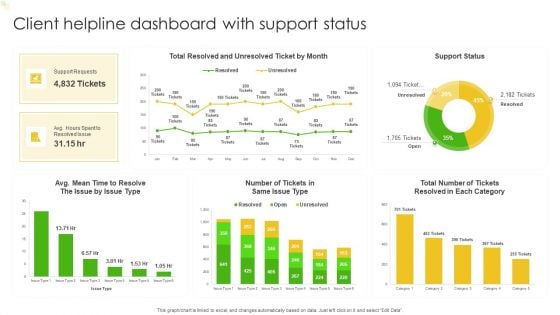
Client Helpline Dashboard With Support Status Ppt Portfolio Rules PDF
This graph or chart is linked to excel, and changes automatically based on data. Just left click on it and select Edit Data. Showcasing this set of slides titled Client Helpline Dashboard With Support Status Ppt Portfolio Rules PDF. The topics addressed in these templates are Total Number, Support Requests, Total Resolved, Support Status. All the content presented in this PPT design is completely editable. Download it and make adjustments in color, background, font etc. as per your unique business setting.
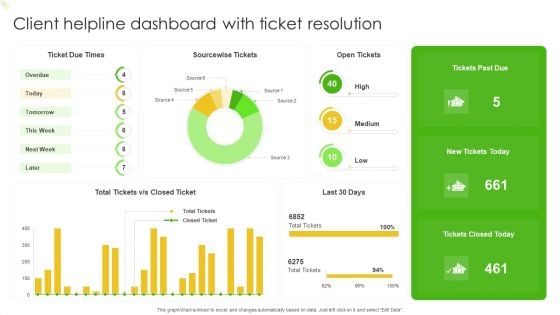
Client Helpline Dashboard With Ticket Resolution Ppt Model Graphics Design PDF
This graph or chart is linked to excel, and changes automatically based on data. Just left click on it and select Edit Data. Pitch your topic with ease and precision using this Client Helpline Dashboard With Ticket Resolution Ppt Model Graphics Design PDF. This layout presents information on Ticket Due Times, Sourcewise Tickets, Open Tickets. It is also available for immediate download and adjustment. So, changes can be made in the color, design, graphics or any other component to create a unique layout.
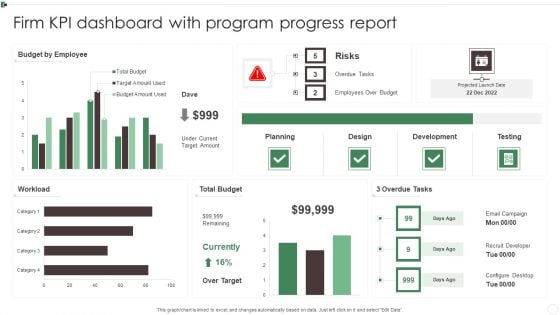
Firm KPI Dashboard With Program Progress Report Ppt Pictures Deck PDF
This graph or chart is linked to excel, and changes automatically based on data. Just left click on it and select Edit Data. Showcasing this set of slides titled Firm KPI Dashboard With Program Progress Report Ppt Pictures Deck PDF. The topics addressed in these templates are Budget By Employee, Total Budget, 3 Overdue Tasks, Workload. All the content presented in this PPT design is completely editable. Download it and make adjustments in color, background, font etc. as per your unique business setting.
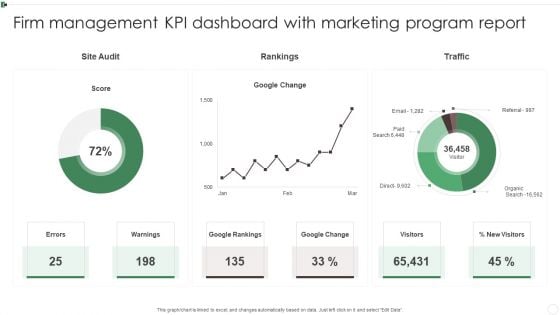
Firm Management KPI Dashboard With Marketing Program Report Ppt Styles Introduction PDF
This graph or chart is linked to excel, and changes automatically based on data. Just left click on it and select Edit Data. Showcasing this set of slides titled Firm Management KPI Dashboard With Marketing Program Report Ppt Styles Introduction PDF. The topics addressed in these templates are Google Rankings, Google Change, Warnings, Visitors. All the content presented in this PPT design is completely editable. Download it and make adjustments in color, background, font etc. as per your unique business setting.
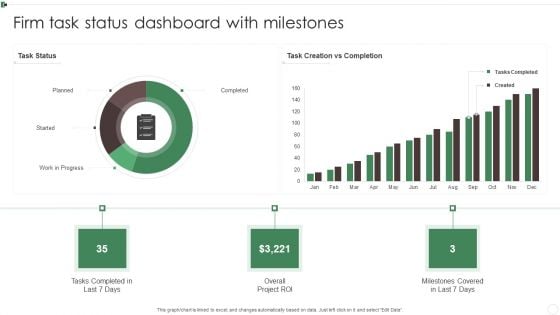
Firm Task Status Dashboard With Milestones Ppt Show Sample PDF
This graph or chart is linked to excel, and changes automatically based on data. Just left click on it and select Edit Data. Showcasing this set of slides titled Firm Task Status Dashboard With Milestones Ppt Show Sample PDF. The topics addressed in these templates are Tasks Completed, Planned, Work Progress, Overall Project ROI. All the content presented in this PPT design is completely editable. Download it and make adjustments in color, background, font etc. as per your unique business setting.
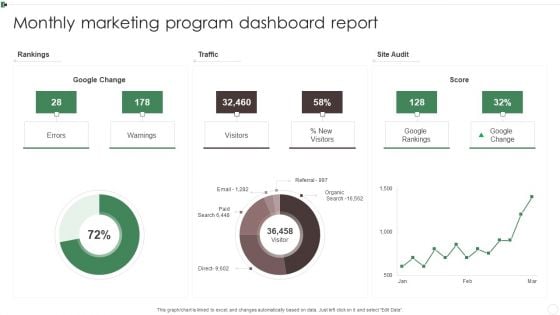
Monthly Marketing Program Dashboard Report Ppt Inspiration Information PDF
This graph or chart is linked to excel, and changes automatically based on data. Just left click on it and select Edit Data. Pitch your topic with ease and precision using this Monthly Marketing Program Dashboard Report Ppt Inspiration Information PDF. This layout presents information on Rankings, Traffic, Site Audit, Warnings. It is also available for immediate download and adjustment. So, changes can be made in the color, design, graphics or any other component to create a unique layout.
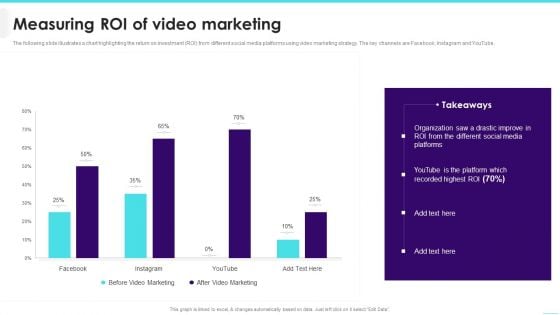
Measuring ROI Of Video Marketing Graphics PDF
The following slide illustrates a chart highlighting the return on investment ROI from different social media platforms using video marketing strategy. The key channels are Facebook, Instagram and YouTube.Deliver an awe inspiring pitch with this creative Measuring ROI Of Video Marketing Graphics PDF bundle. Topics like Organization Saw, Different Social, Recorded Highest can be discussed with this completely editable template. It is available for immediate download depending on the needs and requirements of the user.


 Continue with Email

 Home
Home


