icons
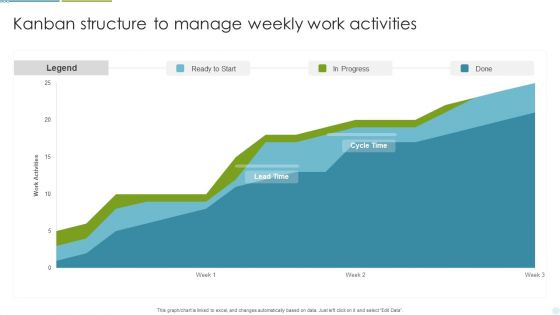
Kanban Structure To Manage Weekly Work Activities Ppt Professional Aids PDF
This graph or chart is linked to excel, and changes automatically based on data. Just left click on it and select Edit Data. Pitch your topic with ease and precision using this Kanban Structure To Manage Weekly Work Activities Ppt Professional Aids PDF. This layout presents information on Legend, Ready To Start, In Progress. It is also available for immediate download and adjustment. So, changes can be made in the color, design, graphics or any other component to create a unique layout.
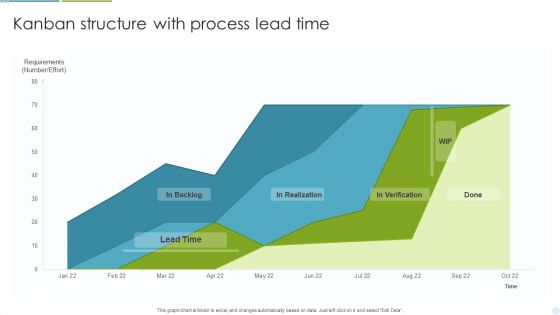
Kanban Structure With Process Lead Time Ppt Gallery Template PDF
This graph or chart is linked to excel, and changes automatically based on data. Just left click on it and select Edit Data. Showcasing this set of slides titled Kanban Structure With Process Lead Time Ppt Gallery Template PDF. The topics addressed in these templates are Lead Time, In Realization, Requirements. All the content presented in this PPT design is completely editable. Download it and make adjustments in color, background, font etc. as per your unique business setting.
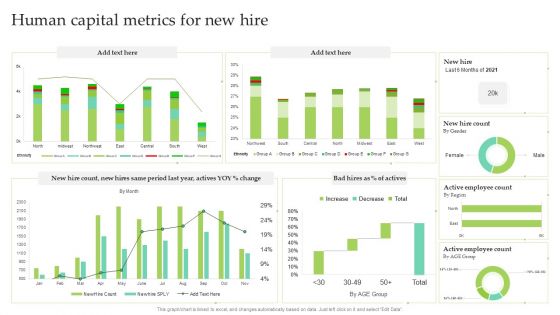
Human Capital Metrics For New Hire Ppt Pictures Brochure PDF
This graph or chart is linked to excel, and changes automatically based on data. Just left click on it and select Edit Data. Pitch your topic with ease and precision using this Human Capital Metrics For New Hire Ppt Pictures Brochure PDF. This layout presents information on Active Employee Count, New Hire Count, New Hire. It is also available for immediate download and adjustment. So, changes can be made in the color, design, graphics or any other component to create a unique layout.
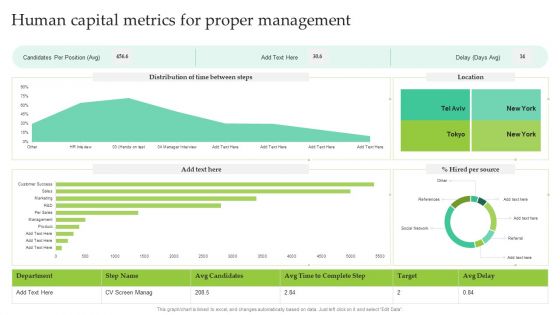
Human Capital Metrics For Proper Management Ppt Show Inspiration PDF
This graph or chart is linked to excel, and changes automatically based on data. Just left click on it and select Edit Data. Showcasing this set of slides titled Human Capital Metrics For Proper Management Ppt Show Inspiration PDF. The topics addressed in these templates are Candidates Per Position, Hired Per Source, Location. All the content presented in this PPT design is completely editable. Download it and make adjustments in color, background, font etc. as per your unique business setting.
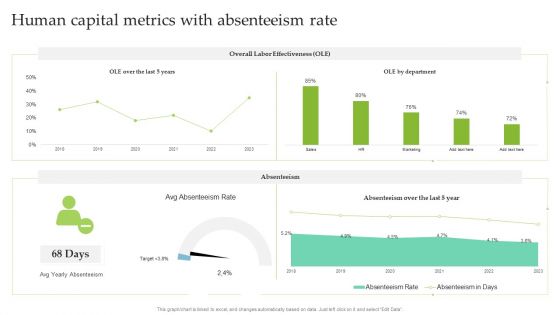
Human Capital Metrics With Absenteeism Rate Ppt Infographic Template Ideas PDF
This graph or chart is linked to excel, and changes automatically based on data. Just left click on it and select Edit Data. Pitch your topic with ease and precision using this Human Capital Metrics With Absenteeism Rate Ppt Infographic Template Ideas PDF. This layout presents information on Overall Labor Effectiveness, OLE Department, Absenteeism. It is also available for immediate download and adjustment. So, changes can be made in the color, design, graphics or any other component to create a unique layout.
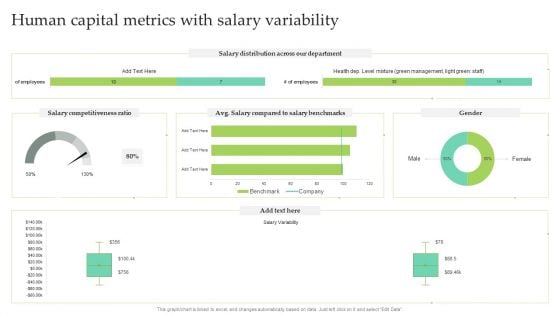
Human Capital Metrics With Salary Variability Ppt Infographic Template Designs PDF
This graph or chart is linked to excel, and changes automatically based on data. Just left click on it and select Edit Data. Pitch your topic with ease and precision using this Human Capital Metrics With Salary Variability Ppt Infographic Template Designs PDF. This layout presents information on Salary Distribution, Salary Competitiveness Ratio, Male. It is also available for immediate download and adjustment. So, changes can be made in the color, design, graphics or any other component to create a unique layout.
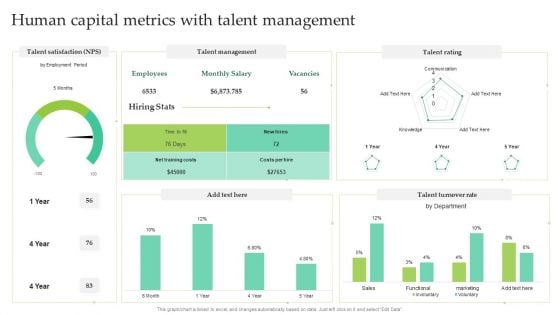
Human Capital Metrics With Talent Management Ppt Layouts Mockup PDF
This graph or chart is linked to excel, and changes automatically based on data. Just left click on it and select Edit Data. Showcasing this set of slides titled Human Capital Metrics With Talent Management Ppt Layouts Mockup PDF. The topics addressed in these templates are Talent Management, Talent Rating, Talent Turnover Rate. All the content presented in this PPT design is completely editable. Download it and make adjustments in color, background, font etc. as per your unique business setting.
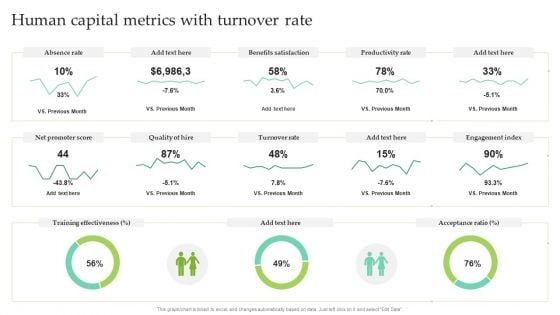
Human Capital Metrics With Turnover Rate Ppt Pictures Outline PDF
This graph or chart is linked to excel, and changes automatically based on data. Just left click on it and select Edit Data. Pitch your topic with ease and precision using this Human Capital Metrics With Turnover Rate Ppt Pictures Outline PDF. This layout presents information on Absence Rate, Benefits Satisfaction, Productivity Rate. It is also available for immediate download and adjustment. So, changes can be made in the color, design, graphics or any other component to create a unique layout.
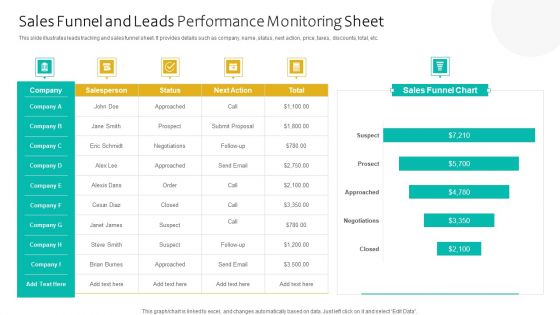
Sales Funnel And Leads Performance Monitoring Sheet Ppt Professional Tips PDF
This slide illustrates leads tracking and sales funnel sheet. It provides details such as company, name, status, next action, price, taxes, discounts, total, etc. Showcasing this set of slides titled Sales Funnel And Leads Performance Monitoring Sheet Ppt Professional Tips PDF. The topics addressed in these templates are Sales Funnel Chart, Salesperson, Next Action. All the content presented in this PPT design is completely editable. Download it and make adjustments in color, background, font etc. as per your unique business setting.
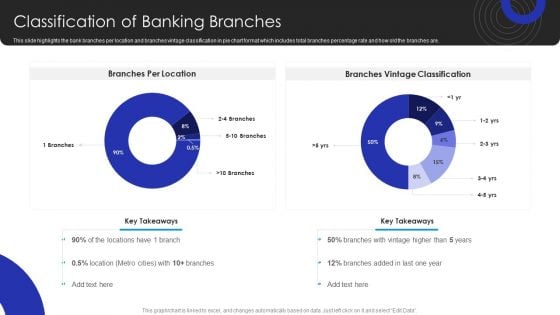
Operational Innovation In Banking Classification Of Banking Branches Rules PDF
This slide highlights the bank branches per location and branches vintage classification in pie chart format which includes total branches percentage rate and how old the branches are. There are so many reasons you need a Operational Innovation In Banking Classification Of Banking Branches Rules PDF. The first reason is you cant spend time making everything from scratch, Thus, Slidegeeks has made presentation templates for you too. You can easily download these templates from our website easily.
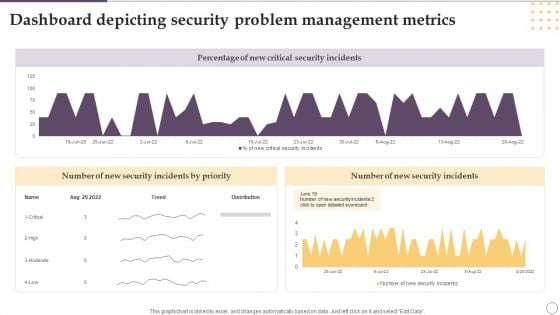
Dashboard Depicting Security Problem Management Metrics Ppt Gallery Designs PDF
This graph or chart is linked to excel, and changes automatically based on data. Just left click on it and select Edit Data. Showcasing this set of slides titled Dashboard Depicting Security Problem Management Metrics Ppt Gallery Designs PDF. The topics addressed in these templates are Percentage, New Critical, Security Incidents. All the content presented in this PPT design is completely editable. Download it and make adjustments in color, background, font etc. as per your unique business setting.
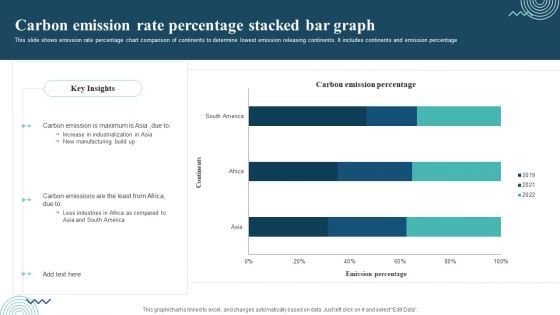
Carbon Emission Rate Percentage Stacked Bar Graph Rules PDF
This slide shows emission rate percentage chart comparison of continents to determine lowest emission releasing continents. It includes continents and emission percentage Showcasing this set of slides titled Carbon Emission Rate Percentage Stacked Bar Graph Rules PDF. The topics addressed in these templates are Carbon Emission, Increase In Industrialization, New Manufacturing. All the content presented in this PPT design is completely editable. Download it and make adjustments in color, background, font etc. as per your unique business setting.

Carbon Emissions Of Countries Bar Graph Professional PDF
This slide depicts emissions chart of various countries to avoid the worst impacts of climate change. It includes countries and carbon emissions in million metric tons. Pitch your topic with ease and precision using this Carbon Emissions Of Countries Bar Graph Professional PDF. This layout presents information on Maximum Production, Consumer Goods, Carbon Emissions. It is also available for immediate download and adjustment. So, changes can be made in the color, design, graphics or any other component to create a unique layout.
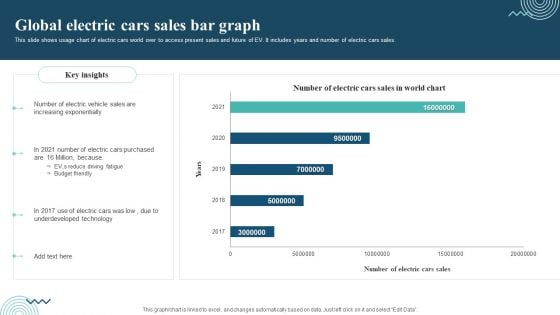
Global Electric Cars Sales Bar Graph Graphics PDF
This slide shows usage chart of electric cars world over to access present sales and future of EV. It includes years and number of electric cars sales. Showcasing this set of slides titled Global Electric Cars Sales Bar Graph Graphics PDF. The topics addressed in these templates are Electric Vehicle Sales, Electric Cars Purchased, Underdeveloped Technology. All the content presented in this PPT design is completely editable. Download it and make adjustments in color, background, font etc. as per your unique business setting.
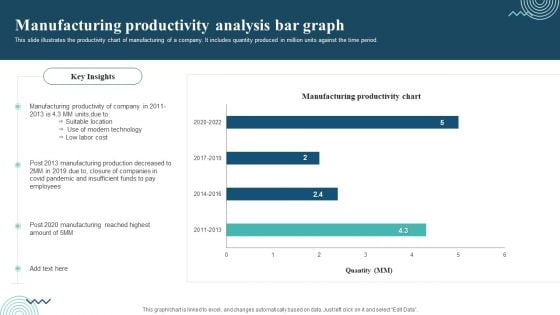
Manufacturing Productivity Analysis Bar Graph Introduction PDF
This slide illustrates the productivity chart of manufacturing of a company. It includes quantity produced in million units against the time period. Pitch your topic with ease and precision using this Manufacturing Productivity Analysis Bar Graph Introduction PDF. This layout presents information on Manufacturing Productivity, Production Decreased, Closure Of Companies. It is also available for immediate download and adjustment. So, changes can be made in the color, design, graphics or any other component to create a unique layout.
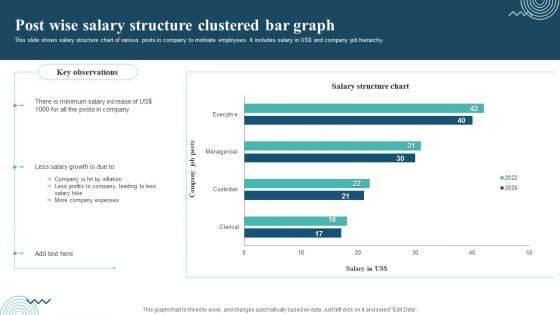
Post Wise Salary Structure Clustered Bar Graph Professional PDF
This slide shows salary structure chart of various posts in company to motivate employees. It includes salary in US dollar and company job hierarchy. Showcasing this set of slides titled Post Wise Salary Structure Clustered Bar Graph Professional PDF. The topics addressed in these templates are Minimum Salary Increase, Less Salary Growth, Company Expenses. All the content presented in this PPT design is completely editable. Download it and make adjustments in color, background, font etc. as per your unique business setting.
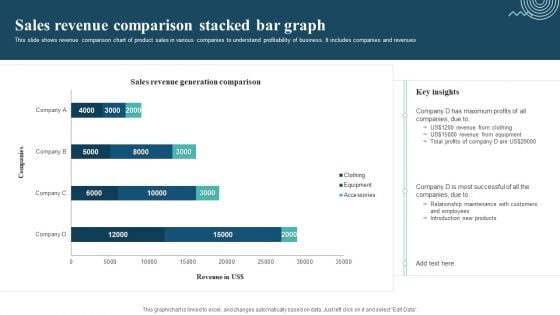
Sales Revenue Comparison Stacked Bar Graph Mockup PDF
This slide shows revenue comparison chart of product sales in various companies to understand profitability of business. It includes companies and revenues. Showcasing this set of slides titled Sales Revenue Comparison Stacked Bar Graph Mockup PDF. The topics addressed in these templates are Sales Revenue Comparison, Revenue From Clothing, Revenue From Equipment. All the content presented in this PPT design is completely editable. Download it and make adjustments in color, background, font etc. as per your unique business setting.
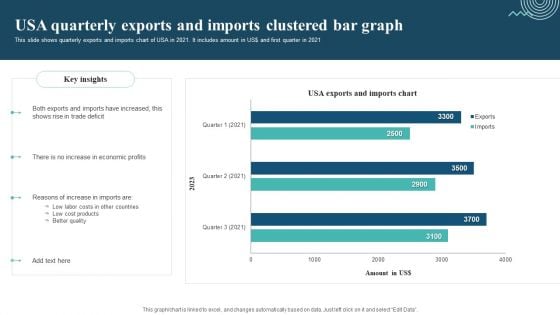
Usa Quarterly Exports And Imports Clustered Bar Graph Designs PDF
This slide shows quarterly exports and imports chart of USA in 2021. It includes amount in US dollar and first quarter in 2021. Pitch your topic with ease and precision using this Usa Quarterly Exports And Imports Clustered Bar Graph Designs PDF. This layout presents information on Exports And Imports, Trade Deficit, Economic Profits. It is also available for immediate download and adjustment. So, changes can be made in the color, design, graphics or any other component to create a unique layout.
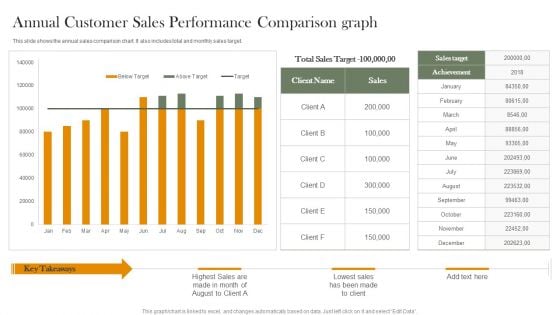
Annual Customer Sales Performance Comparison Graph Portrait PDF
This slide shows the annual sales comparison chart. It also includes total and monthly sales target. Pitch your topic with ease and precision using this Annual Customer Sales Performance Comparison Graph Portrait PDF. This layout presents information on Total Sales Target, Sales Target, Achievement. It is also available for immediate download and adjustment. So, changes can be made in the color, design, graphics or any other component to create a unique layout.
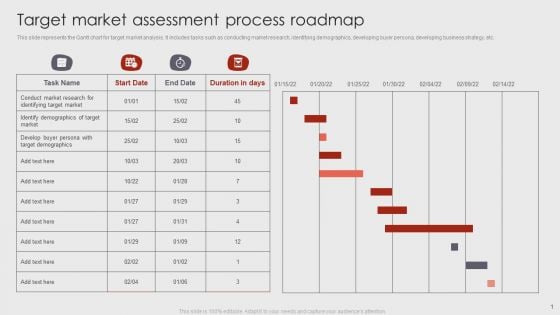
Target Market Assessment Process Roadmap Demonstration PDF
This slide represents the Gantt chart for target market analysis. It includes tasks such as conducting market research, identifying demographics, developing buyer persona, developing business strategy, etc. Showcasing this set of slides titled Target Market Assessment Process Roadmap Demonstration PDF. The topics addressed in these templates are Develop, Target Demographics, Target Market. All the content presented in this PPT design is completely editable. Download it and make adjustments in color, background, font etc. as per your unique business setting.
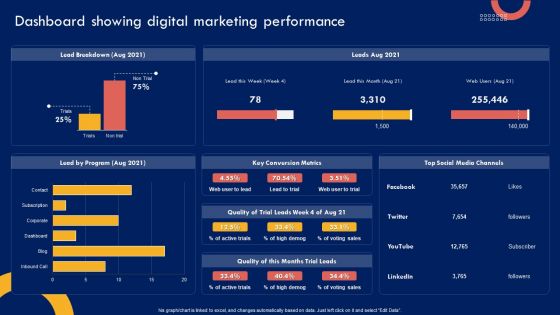
Product Marketing Leadership Dashboard Showing Digital Marketing Performance Download PDF
This graph OR chart is linked to excel, and changes automatically based on data. Just left click on it and select Edit Data. There are so many reasons you need a Product Marketing Leadership Dashboard Showing Digital Marketing Performance Download PDF. The first reason is you cant spend time making everything from scratch, Thus, Slidegeeks has made presentation templates for you too. You can easily download these templates from our website easily.
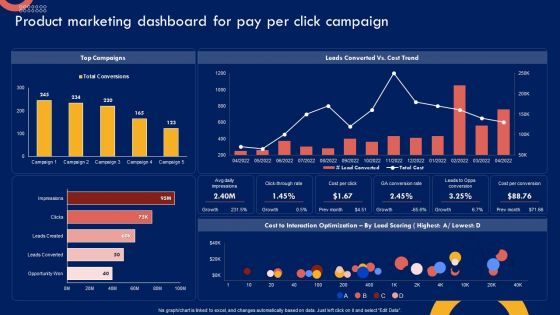
Product Marketing Leadership Product Marketing Dashboard For Pay Per Microsoft PDF
This graph or chart is linked to excel, and changes automatically based on data. Just left click on it and select Edit Data. Find a pre-designed and impeccable Product Marketing Leadership Product Marketing Dashboard For Pay Per Microsoft PDF. The templates can ace your presentation without additional effort. You can download these easy-to-edit presentation templates to make your presentation stand out from others. So, what are you waiting for Download the template from Slidegeeks today and give a unique touch to your presentation.
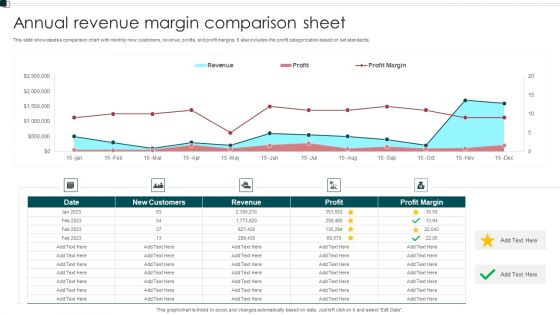
Annual Revenue Margin Comparison Sheet Information PDF
This slide showcases a comparison chart with monthly new customers, revenue, profits, and profit margins. It also includes the profit categorization based on set standards. Showcasing this set of slides titled Annual Revenue Margin Comparison Sheet Information PDF. The topics addressed in these templates are Customers, Revenue, Profit Margin. All the content presented in this PPT design is completely editable. Download it and make adjustments in color, background, font etc. as per your unique business setting.

Two Consecutive Years Revenue Comparison Topics PDF
This slide showcases profitability comparison with the help of a trend chart. It represents revenue, cost of goods sold, gross profit, net profit, etc. Pitch your topic with ease and precision using this Two Consecutive Years Revenue Comparison Topics PDF. This layout presents information on Revenue, Gross Profit, Net Income. It is also available for immediate download and adjustment. So, changes can be made in the color, design, graphics or any other component to create a unique layout.
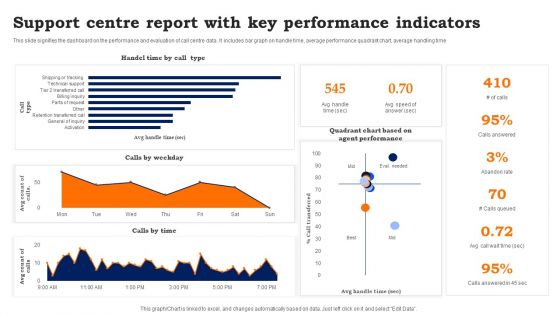
Support Centre Report With Key Performance Indicators Information PDF
This slide signifies the dashboard on the performance and evaluation of call centre data. It includes bar graph on handle time, average performance quadrant chart, average handling time. Showcasing this set of slides titled Support Centre Report With Key Performance Indicators Information PDF. The topics addressed in these templates are Support Centre Report, Key Performance Indicators. All the content presented in this PPT design is completely editable. Download it and make adjustments in color, background, font etc. as per your unique business setting.
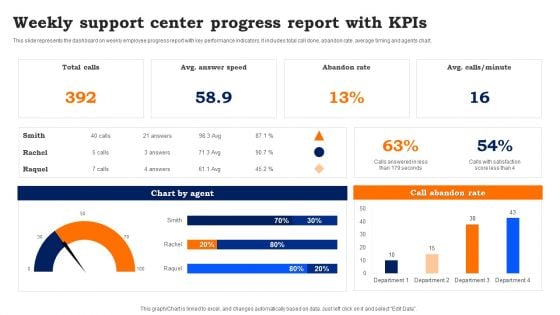
Weekly Support Center Progress Report With Kpis Template PDF
This slide represents the dashboard on weekly employee progress report with key performance indicators. It includes total call done, abandon rate, average timing and agents chart. Pitch your topic with ease and precision using this Weekly Support Center Progress Report With Kpis Template PDF. This layout presents information on Weekly Support, Center Progress Report. It is also available for immediate download and adjustment. So, changes can be made in the color, design, graphics or any other component to create a unique layout.

Prevention Of Information Major Statistics Of Cyber Security Awareness Pictures PDF
This graph or chart is linked to excel, and changes automatically based on data. Just left click on it and select Edit Data. There are so many reasons you need a Prevention Of Information Major Statistics Of Cyber Security Awareness Pictures PDF. The first reason is you cant spend time making everything from scratch, Thus, Slidegeeks has made presentation templates for you too. You can easily download these templates from our website easily.
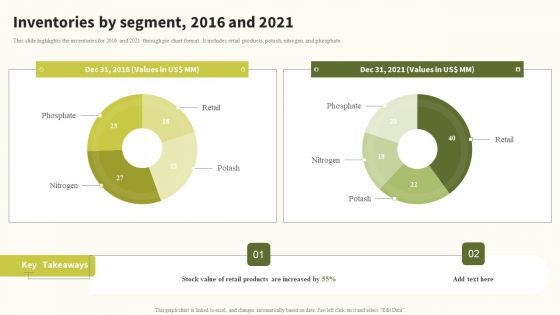
Inventories By Segment 2016 And 2021 Global Food Products Company Profile Summary PDF
This slide highlights the inventories for 2016 and 2021 through pie chart format. It includes retail products, potash, nitrogen, and phosphateFind a pre-designed and impeccable Inventories By Segment 2016 And 2021 Global Food Products Company Profile Summary PDF. The templates can ace your presentation without additional effort. You can download these easy-to-edit presentation templates to make your presentation stand out from others. So, what are you waiting for Download the template from Slidegeeks today and give a unique touch to your presentation.
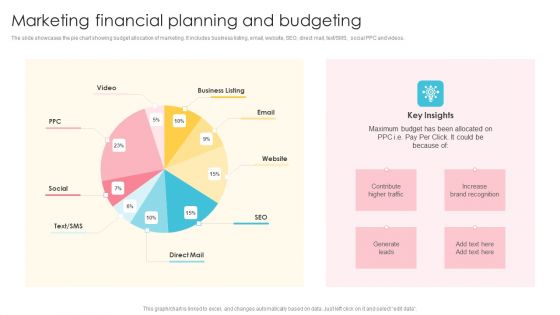
Marketing Financial Planning And Budgeting Ideas PDF
The slide showcases the pie chart showing budget allocation of marketing. It includes business listing, email, website, SEO, direct mail, text SMS, social PPC and videos. Showcasing this set of slides titled Marketing Financial Planning And Budgeting Ideas PDF. The topics addressed in these templates are Business Listing, Social, Direct Mail. All the content presented in this PPT design is completely editable. Download it and make adjustments in color, background, font etc. as per your unique business setting.
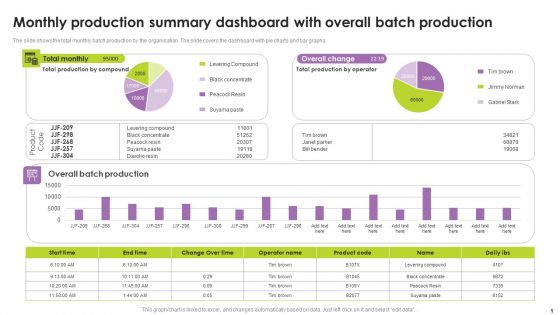
Monthly Production Summary Dashboard With Overall Batch Production Portrait PDF
The slide shows the total monthly batch production by the organisation. The slide covers the dashboard with pie charts and bar graphs. Showcasing this set of slides titled Monthly Production Summary Dashboard With Overall Batch Production Portrait PDF. The topics addressed in these templates are Monthly Production Summary Dashboard, Overall Batch Production. All the content presented in this PPT design is completely editable. Download it and make adjustments in color, background, font etc. as per your unique business setting.

Project Evaluation And Estimated Results Dashboard Ideas PDF
This slide illustrates graphical representation and facts and figures relating to project management data. It includes budget by employee, overdue tasks, workload charts etc. Showcasing this set of slides titled Project Evaluation And Estimated Results Dashboard Ideas PDF. The topics addressed in these templates are Overdue Tasks, Project Budget, Project Evaluation. All the content presented in this PPT design is completely editable. Download it and make adjustments in color, background, font etc. as per your unique business setting.
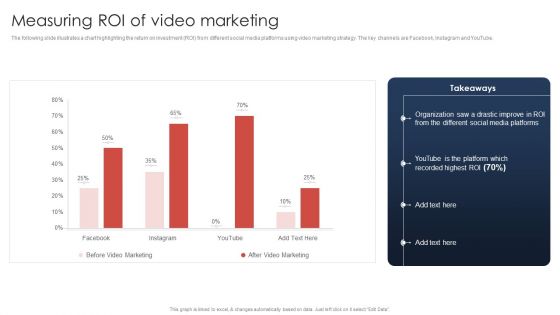
Effective Video Promotional Strategies For Brand Awareness Measuring ROI Of Video Marketing Demonstration PDF
The following slide illustrates a chart highlighting the return on investment ROI from different social media platforms using video marketing strategy. The key channels are Facebook, Instagram and YouTube. There are so many reasons you need a Effective Video Promotional Strategies For Brand Awareness Measuring ROI Of Video Marketing Demonstration PDF. The first reason is you can not spend time making everything from scratch, Thus, Slidegeeks has made presentation templates for you too. You can easily download these templates from our website easily.
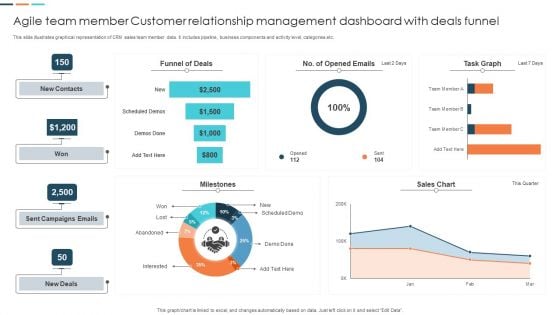
Agile Team Member Customer Relationship Management Dashboard With Deals Funnel Mockup PDF
This slide illustrates graphical representation of CRM sales team member data. It includes pipeline, business components and activity level, categories etc. Pitch your topic with ease and precision using this Agile Team Member Customer Relationship Management Dashboard With Deals Funnel Mockup PDF. This layout presents information on Funnel Of Deals, Sent Campaigns Emails, Sales Chart. It is also available for immediate download and adjustment. So, changes can be made in the color, design, graphics or any other component to create a unique layout.
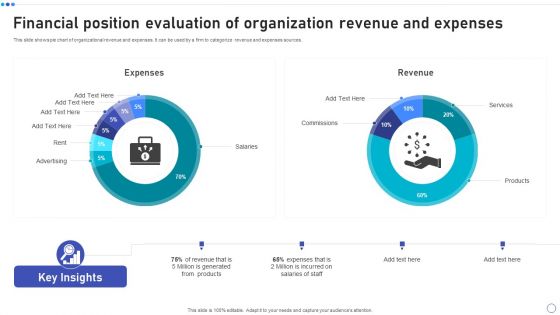
Financial Position Evaluation Of Organization Revenue And Expenses Slides PDF
This slide shows pie chart of organizational revenue and expenses. It can be used by a firm to categorize revenue and expenses sources. Showcasing this set of slides titled Financial Position Evaluation Of Organization Revenue And Expenses Slides PDF. The topics addressed in these templates are Expenses, Revenue, Commissions, Services, Products. All the content presented in this PPT design is completely editable. Download it and make adjustments in color, background, font etc. as per your unique business setting.
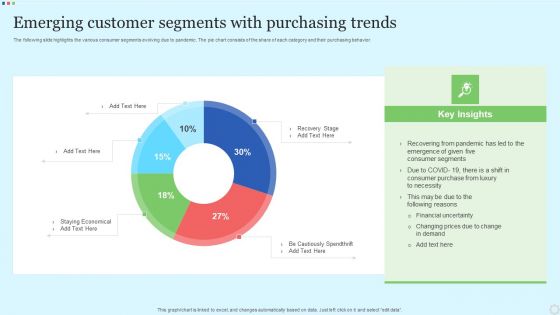
Emerging Customer Segments With Purchasing Trends Infographics PDF
The following slide highlights the various consumer segments evolving due to pandemic. The pie chart consists of the share of each category and their purchasing behavior. Showcasing this set of slides titled Emerging Customer Segments With Purchasing Trends Infographics PDF. The topics addressed in these templates are Recovery Stage, Cautiously Spendthrift, Staying Economical. All the content presented in this PPT design is completely editable. Download it and make adjustments in color, background, font etc. as per your unique business setting.
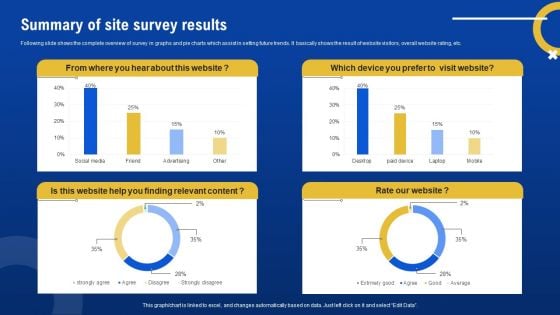
Summary Of Site Survey Results Survey SS
Following slide shows the complete overview of survey in graphs and pie charts which assist in setting future trends. It basically shows the result of website visitors, overall website rating, etc. Showcasing this set of slides titled Summary Of Site Survey Results Survey SS. The topics addressed in these templates are Summary, Site Survey Results. All the content presented in this PPT design is completely editable. Download it and make adjustments in color, background, font etc. as per your unique business setting.
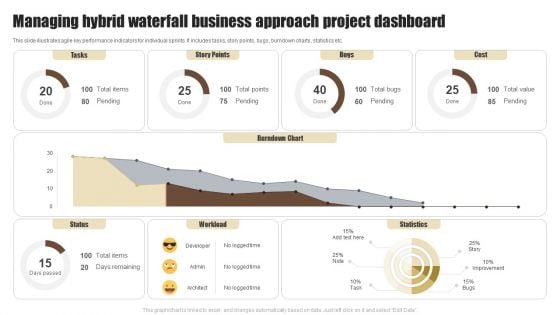
Managing Hybrid Waterfall Business Approach Project Dashboard Summary PDF
This slide illustrates agile key performance indicators for individual sprints. It includes tasks, story points, bugs, burndown charts, statistics etc. Showcasing this set of slides titled Managing Hybrid Waterfall Business Approach Project Dashboard Summary PDF. The topics addressed in these templates are Tasks, Story Points, Bugs. All the content presented in this PPT design is completely editable. Download it and make adjustments in color, background, font etc. as per your unique business setting.
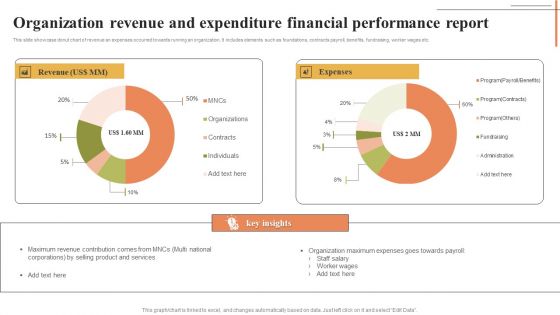
Organization Revenue And Expenditure Financial Performance Report Inspiration PDF
This slide showcase donut chart of revenue an expenses occurred towards running an organization. It includes elements such as foundations, contracts payroll, benefits, fundraising, worker wages etc. Showcasing this set of slides titled Organization Revenue And Expenditure Financial Performance Report Inspiration PDF. The topics addressed in these templates are Expenses, Revenue Worker Wages. All the content presented in this PPT design is completely editable. Download it and make adjustments in color, background, font etc. as per your unique business setting.
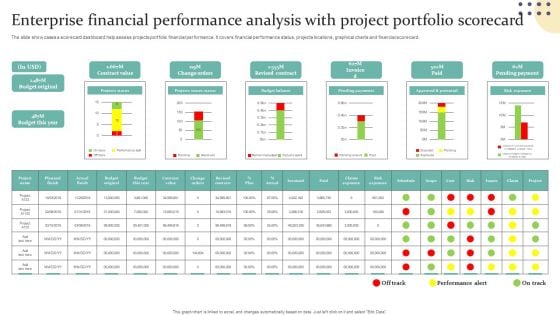
Enterprise Financial Performance Analysis With Project Portfolio Scorecard Guidelines PDF
The slide showcases a scorecard dashboard help assess projects portfolio financial performance. It covers financial performance status, projects locations, graphical charts and financial scorecard. Showcasing this set of slides titled Enterprise Financial Performance Analysis With Project Portfolio Scorecard Guidelines PDF. The topics addressed in these templates are Projects Status, Projects Issues Status, Budget Balance. All the content presented in this PPT design is completely editable. Download it and make adjustments in color, background, font etc. as per your unique business setting.
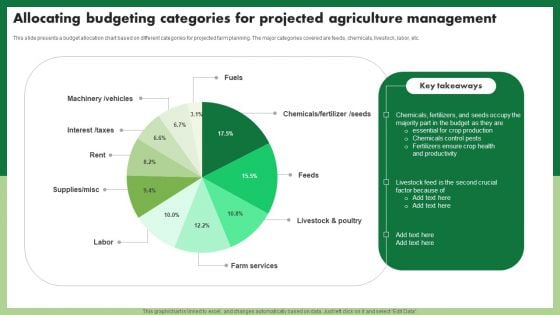
Allocating Budgeting Categories For Projected Agriculture Management Infographics PDF
This slide presents a budget allocation chart based on different categories for projected farm planning. The major categories covered are feeds, chemicals, livestock, labor, etc. Showcasing this set of slides titled Allocating Budgeting Categories For Projected Agriculture Management Infographics PDF. The topics addressed in these templates are Machinery Vehicles, Interest Taxes. All the content presented in this PPT design is completely editable. Download it and make adjustments in color, background, font etc. as per your unique business setting.
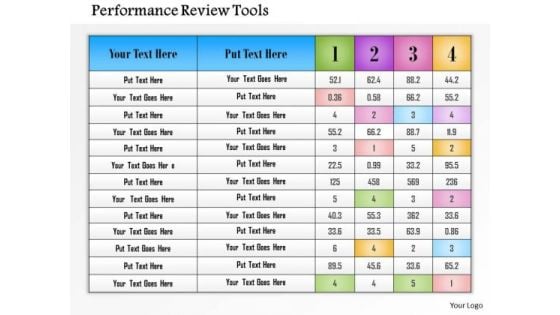
Business Framework Performance Review Tools PowerPoint Presentation
This Power Point template slide has been designed with graphic of text box chart. This text box chart contains the performance tools and ratings. This PPT slide can be used for business and individual performance judgment techniques with these tools.
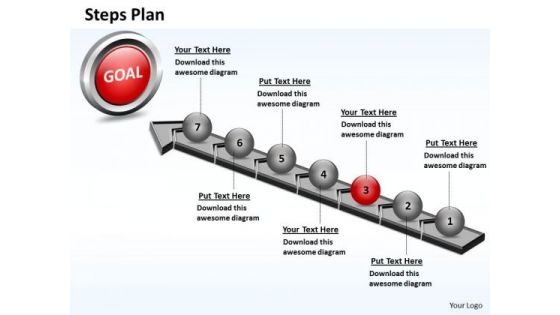
PowerPoint Slides Diagram Steps Plan 7 Stages Style 4 Ppt Design
PowerPoint Slides Diagram Steps Plan 7 Stages Style 4 PPT Design-This Business Powerpoint Template Shows the one step which consists of seven stages to achieve the goal by using numbers. Use this another graphic design to represent a continuing sequence of stages, tasks, or events and emphasize the connection between all components.-PowerPoint Slides Diagram Steps Plan 7 Stages Style 4 PPT Design Calculate your growing success with our PowerPoint Slides Diagram Steps Plan 7 Stages Style 4 Ppt Design. You will come out on top.
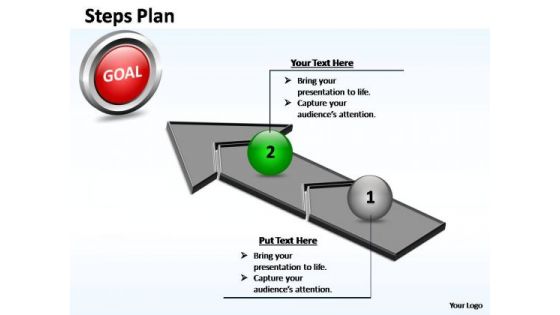
PowerPoint Layout Diagram Steps Plan 2 Stages Style 4 Ppt Slide Designs
PowerPoint Layout Diagram Steps Plan 2 Stages Style 4 PPT Slide Designs-This Business Powerpoint Template Shows the one step which consists of two stages to achieve the goal by using numbers. Use this another graphic design to represent a continuing sequence of stages, tasks, or events and emphasize the connection between all components.-PowerPoint Layout Diagram Steps Plan 2 Stages Style 4 PPT Slide Designs Exhilirate your audience with our PowerPoint Layout Diagram Steps Plan 2 Stages Style 4 Ppt Slide Designs. Entertain them in your characteristic way.
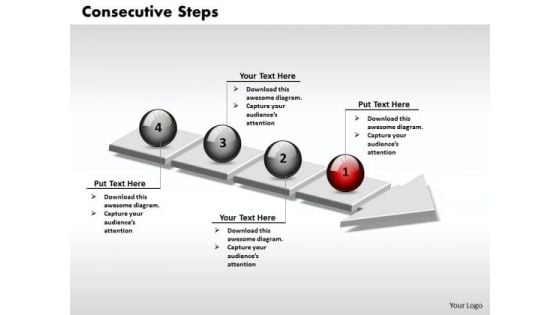
Ppt 3d Consecutive Explanation Using Arrow Of 4 State Diagram PowerPoint Templates
PPT 3d consecutive explanation using arrow of 4 state diagram PowerPoint Templates-This PPT is suitable to present a progression or sequential steps in a task, process, or workflow that move toward a common goal-PPT 3d consecutive explanation using arrow of 4 state diagram PowerPoint Templates-3d, Abstract, Arrows, Background, Ball, Business, Communication, Corporate, Decision, Determination, Follow, Illustration, Individuality, Leadership, Line, Many, Object, Path, Reflection, Row, Shine, Sphere, Success, Symbol Go on the lookout for something new. Explore away with our Ppt 3d Consecutive Explanation Using Arrow Of 4 State Diagram PowerPoint Templates.
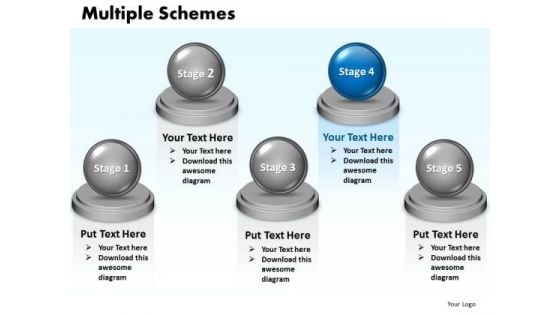
Ppt Multiple Schemes Diagram 5 Stages Presentation PowerPoint Tips 0812 Templates
PPT multiple schemes diagram 5 stages presentation powerpoint tips 0812 Templates-Use this circular implementation PPT slide to represent a series of interconnected ideas. Use this circular PPT abstraction to establish a link between your personal methodology and action research possibilities. -PPT multiple schemes diagram 5 stages presentation powerpoint tips 0812 Templates-3d, Abstract, Backgrounds, Ball, Business, Choice, Comparison, Concept, Descriptive, Equilibrium, Grow, Illustrations, Instrument, Measurement, Metallic, Part, Partnership, Pattern, Progress, Reflections, Scales, Several, Sphere, Strategy, Success Underline your erudition with our Ppt Multiple Schemes Diagram 5 Stages Presentation PowerPoint Tips 0812 Templates. They will project your considerable expertise.
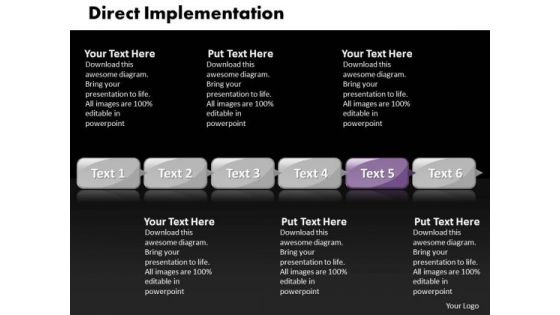
Ppt Direct Description Of Banking Process Using 6 State Diagram PowerPoint Templates
PPT direct description of banking process using 6 state diagram PowerPoint Templates-Impress your audience with this professional and pre-designed PowerPoint graphics showing various segmented in rectangular shape you only have to insert your texts. Accentuate a special element of a process by inserting the respective content.-PPT direct description of banking process using 6 state diagram PowerPoint Templates-Accent, Advertisement, Arrow, Badge, Banner, Blank, Business, Collection, Decoration, Design, Direction, Element, Empty, Financial, Flow, Graph, Horizontal, Instruction, Isolated, Label, Manual, Menu, Message, Placard, Process, Promo, Promotion, Sale, Set, Shape Our Ppt Direct Description Of Banking Process Using 6 State Diagram PowerPoint Templates are very enticing. Get your audience craving for more.
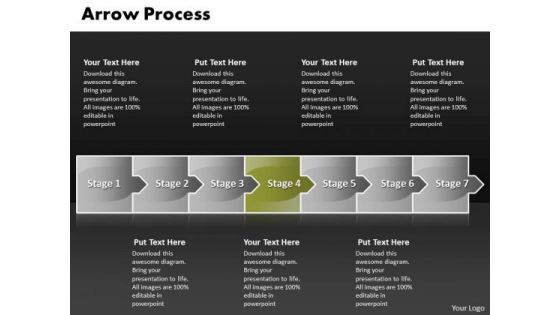
Flow PowerPoint Template Arrow Process 7 States Diagram Ppt Time Management 5 Design
flow PowerPoint template arrow process 7 states diagram ppt time management 5 design-Visually support your ideas and define your message with our above template. This attractive image makes your presentations professional and interactive. Deliver amazing presentations to mesmerize your audience.-flow PowerPoint template arrow process 7 states diagram ppt time management 5 design-Advertising, Arrow, Concept, Corporate, Creative, Design, Direction, Flow, Illustration, Info, Graphic, Instruction, Label, Layout, Manual, Modern, Number, Offer, Order, Pointer, Product, Progress, Promotion, Sequence, Special, Step, Symbol Get fascinated by our Flow PowerPoint Template Arrow Process 7 States Diagram Ppt Time Management 5 Design. They will keep attracting your attention.
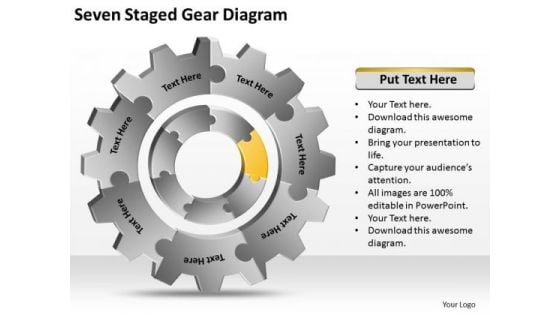
Seven Staged Gear Diagram Ppt Sample Of Small Business Plan PowerPoint Slides
Knock on the door to success with our seven staged gear diagram ppt sample of small business plan PowerPoint Slides. Be assured of gaining entry. Give them a dose of your ability. It will go down well with our seven staged gear diagram ppt sample of small business plan PowerPoint Slides. Make interesting presentations no matter what the topic with our Seven Staged Gear Diagram Ppt Sample Of Small Business Plan PowerPoint Slides. Dont waste time struggling with PowerPoint. Let us do it for you.
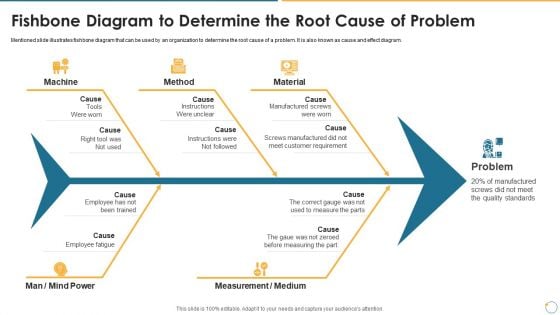
Collection Of Quality Assurance PPT Fishbone Diagram To Determine The Root Cause Of Problem Formats PDF
Mentioned slide illustrates fishbone diagram that can be used by an organization to determine the root cause of a problem. It is also known as cause and effect diagram. This is a collection of quality assurance ppt fishbone diagram to determine the root cause of problem formats pdf template with various stages. Focus and dispense information on five stages using this creative set, that comes with editable features. It contains large content boxes to add your information on topics like quality standards, manufactured, measure, requirement. You can also showcase facts, figures, and other relevant content using this PPT layout. Grab it now.
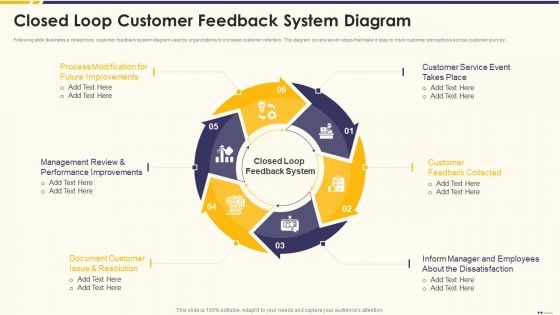
Promotion Standard Practices Tools And Templates Closed Loop Customer Feedback System Diagram Portrait PDF
Following slide illustrates a closed loop customer feedback system diagram used by organizations to increase customer retention. The diagram covers seven steps that make it easy to track customer perceptions across customer journey.Presenting promotion standard practices tools and templates closed loop customer feedback system diagram portrait pdf to provide visual cues and insights. Share and navigate important information on six stages that need your due attention. This template can be used to pitch topics like process modification, future improvements, management review In addtion, this PPT design contains high resolution images, graphics, etc, that are easily editable and available for immediate download.

Deploying Cloud Technology With Project Management For Table Of Contents Ppt Model Diagrams PDF
Are you searching for a Deploying Cloud Technology With Project Management For Table Of Contents Ppt Model Diagrams PDF that is uncluttered, straightforward, and original Its easy to edit, and you can change the colors to suit your personal or business branding. For a presentation that expresses how much effort you have put in, this template is ideal With all of its features, including tables, diagrams, statistics, and lists, its perfect for a business plan presentation. Make your ideas more appealing with these professional slides. Download Deploying Cloud Technology With Project Management For Table Of Contents Ppt Model Diagrams PDF from Slidegeeks today.
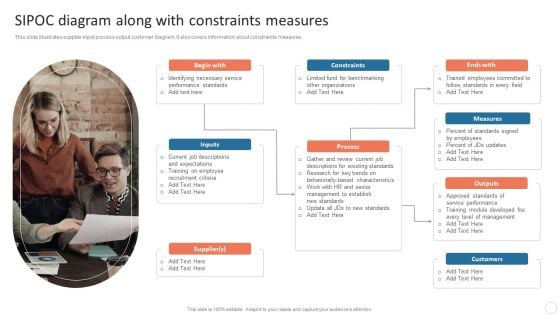
Quality Control Plan Sipoc Diagram Along With Constraints Measures Formats PDF
This slide illustrates supplier input process output customer diagram. It also covers information about constraints measures. This Quality Control Plan Sipoc Diagram Along With Constraints Measures Formats PDF is perfect for any presentation, be it in front of clients or colleagues. It is a versatile and stylish solution for organizing your meetings. The Quality Control Plan Sipoc Diagram Along With Constraints Measures Formats PDF features a modern design for your presentation meetings. The adjustable and customizable slides provide unlimited possibilities for acing up your presentation. Slidegeeks has done all the homework before launching the product for you. So, dont wait, grab the presentation templates today.
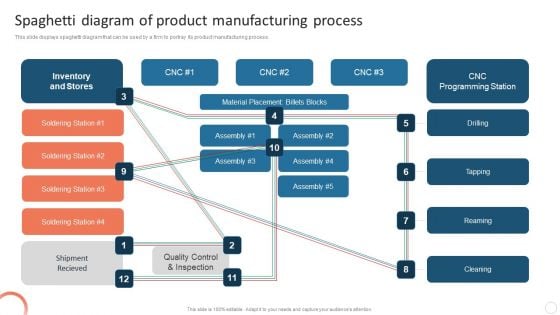
Quality Control Plan Spaghetti Diagram Of Product Manufacturing Process Graphics PDF
This slide displays spaghetti diagram that can be used by a firm to portray its product manufacturing process. Explore a selection of the finest Quality Control Plan Spaghetti Diagram Of Product Manufacturing Process Graphics PDF here. With a plethora of professionally designed and pre-made slide templates, you can quickly and easily find the right one for your upcoming presentation. You can use our Quality Control Plan Spaghetti Diagram Of Product Manufacturing Process Graphics PDF to effectively convey your message to a wider audience. Slidegeeks has done a lot of research before preparing these presentation templates. The content can be personalized and the slides are highly editable. Grab templates today from Slidegeeks.

Table Of Contents B2B And B2C Startups Marketing Mix Strategies Impact Diagrams PDF
Are you searching for a Table Of Contents B2B And B2C Startups Marketing Mix Strategies Impact Diagrams PDF that is uncluttered, straightforward, and original Its easy to edit, and you can change the colors to suit your personal or business branding. For a presentation that expresses how much effort you have put in, this template is ideal With all of its features, including tables, diagrams, statistics, and lists, its perfect for a business plan presentation. Make your ideas more appealing with these professional slides. Download Table Of Contents B2B And B2C Startups Marketing Mix Strategies Impact Diagrams PDF from Slidegeeks today.
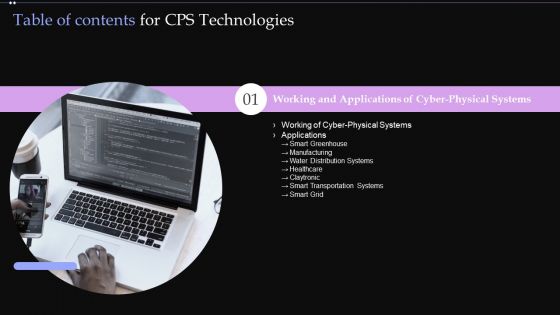
Table Of Contents For CPS Technologies Grid Ppt PowerPoint Presentation Diagram Templates PDF
Are you searching for a Table Of Contents For CPS Technologies Grid Ppt PowerPoint Presentation Diagram Templates PDF that is uncluttered, straightforward, and original Its easy to edit, and you can change the colors to suit your personal or business branding. For a presentation that expresses how much effort you have put in, this template is ideal With all of its features, including tables, diagrams, statistics, and lists, its perfect for a business plan presentation. Make your ideas more appealing with these professional slides. Download Table Of Contents For CPS Technologies Grid Ppt PowerPoint Presentation Diagram Templates PDF from Slidegeeks today.
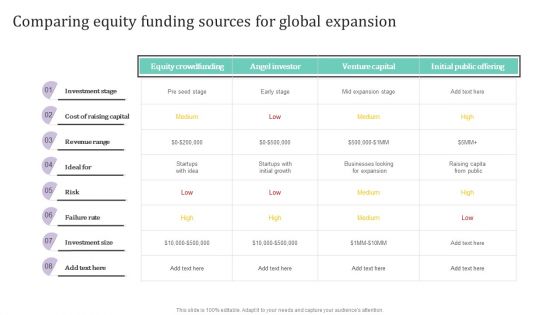
Comparing Equity Funding Sources For Global Expansion Ppt PowerPoint Presentation Diagram Images PDF
Are you searching for a Comparing Equity Funding Sources For Global Expansion Ppt PowerPoint Presentation Diagram Images PDF that is uncluttered, straightforward, and original Its easy to edit, and you can change the colors to suit your personal or business branding. For a presentation that expresses how much effort you have put in, this template is ideal With all of its features, including tables, diagrams, statistics, and lists, its perfect for a business plan presentation. Make your ideas more appealing with these professional slides. Download Comparing Equity Funding Sources For Global Expansion Ppt PowerPoint Presentation Diagram Images PDF from Slidegeeks today.
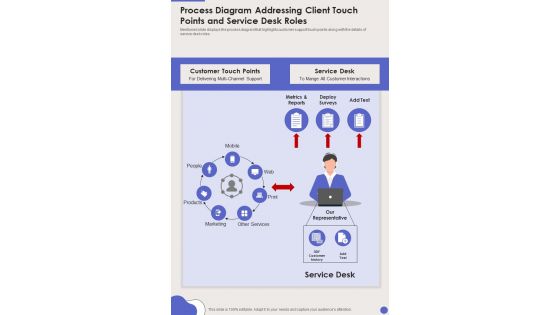
Process Diagram Addressing Client Touch Points And Service Desk Roles One Pager Sample Example Document
Mentioned slide displays the process diagram that highlights customer support touch points along with the details of service desk roles. Presenting you an exemplary Process Diagram Addressing Client Touch Points And Service Desk Roles One Pager Sample Example Document. Our one-pager comprises all the must-have essentials of an inclusive document. You can edit it with ease, as its layout is completely editable. With such freedom, you can tweak its design and other elements to your requirements. Download this Process Diagram Addressing Client Touch Points And Service Desk Roles One Pager Sample Example Document brilliant piece now.
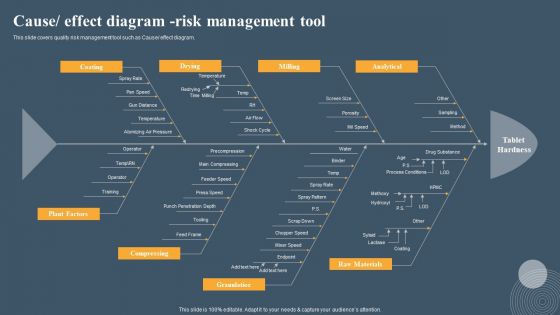
Risk Based Methodology Cause Effect Diagram Risk Management Tool Brochure PDF
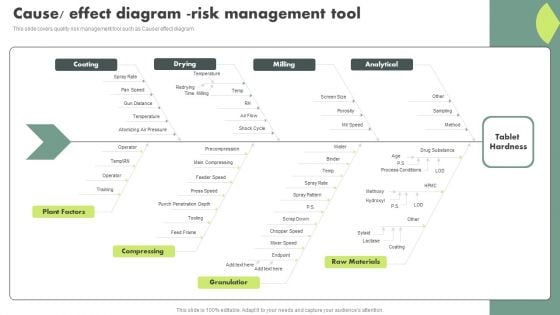
This slide covers quality risk management tool such as Cause or effect diagram. Do you have an important presentation coming up Are you looking for something that will make your presentation stand out from the rest Look no further than Risk Based Methodology Cause Effect Diagram Risk Management Tool Brochure PDF. With our professional designs, you can trust that your presentation will pop and make delivering it a smooth process. And with Slidegeeks, you can trust that your presentation will be unique and memorable. So why wait Grab Risk Based Methodology Cause Effect Diagram Risk Management Tool Brochure PDF today and make your presentation stand out from the rest
Intelligent Manufacturing Meet Our Team Ppt PowerPoint Presentation Diagram Images PDF
Are you searching for a Intelligent Manufacturing Meet Our Team Ppt PowerPoint Presentation Diagram Images PDF that is uncluttered, straightforward, and original Its easy to edit, and you can change the colors to suit your personal or business branding. For a presentation that expresses how much effort you have put in, this template is ideal. With all of its features, including tables, diagrams, statistics, and lists, its perfect for a business plan presentation. Make your ideas more appealing with these professional slides. Download Intelligent Manufacturing Meet Our Team Ppt PowerPoint Presentation Diagram Images PDF from Slidegeeks today.
Operational Quality Assurance Cause Effect Diagram Risk Management Tool Graphics PDF
This slide covers quality risk management tool such as Cause or effect diagram. Create an editable Operational Quality Assurance Cause Effect Diagram Risk Management Tool Graphics PDF that communicates your idea and engages your audience. Whether you are presenting a business or an educational presentation, pre designed presentation templates help save time. Operational Quality Assurance Cause Effect Diagram Risk Management Tool Graphics PDF is highly customizable and very easy to edit, covering many different styles from creative to business presentations. Slidegeeks has creative team members who have crafted amazing templates. So, go and get them without any delay.


 Continue with Email

 Home
Home


