icons
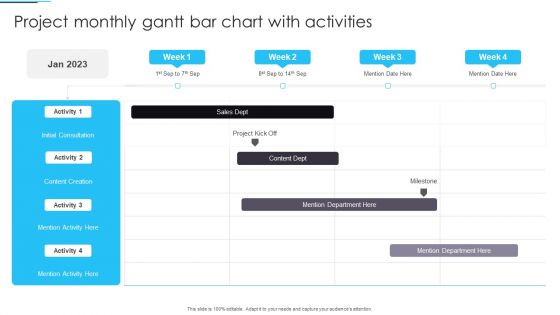
Project Monthly Gantt Bar Chart With Activities Structure PDF
Showcasing this set of slides titled Project Monthly Gantt Bar Chart With Activities Structure PDF. The topics addressed in these templates are Project, Monthly Gantt Bar Chart. All the content presented in this PPT design is completely editable. Download it and make adjustments in color, background, font etc. as per your unique business setting.
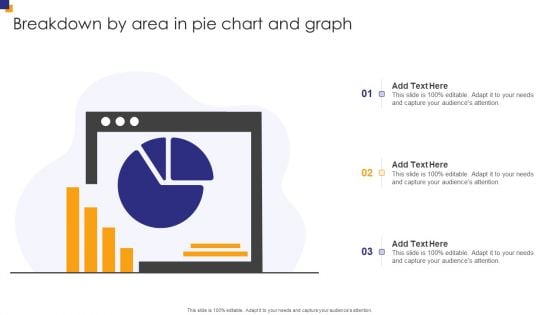
Breakdown By Area In Pie Chart And Graph Introduction PDF
Showcasing this set of slides titled Breakdown By Area In Pie Chart And Graph Introduction PDF. The topics addressed in these templates are Break Down, Area Pie, Chart Graph. All the content presented in this PPT design is completely editable. Download it and make adjustments in color, background, font etc. as per your unique business setting.
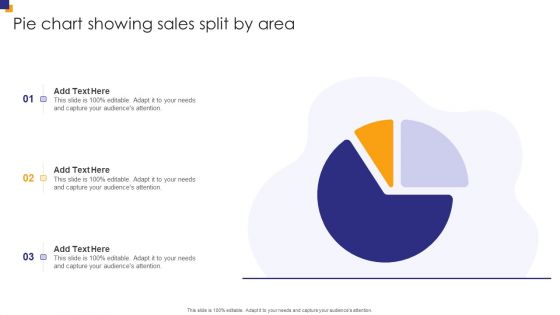
Pie Chart Showing Sales Split By Area Infographics PDF
Pitch your topic with ease and precision using this Pie Chart Showing Sales Split By Area Infographics PDF. This layout presents information on Pie Chart Showing, Sales Split Area. It is also available for immediate download and adjustment. So, changes can be made in the color, design, graphics or any other component to create a unique layout.
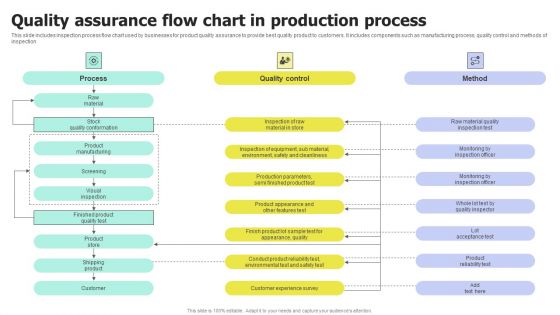
Quality Assurance Flow Chart In Production Process Guidelines PDF
Pitch your topic with ease and precision using this Quality Assurance Flow Chart In Production Process Guidelines PDF. This layout presents information on Quality Assurance, Flow Chart, Production Process. It is also available for immediate download and adjustment. So, changes can be made in the color, design, graphics or any other component to create a unique layout.
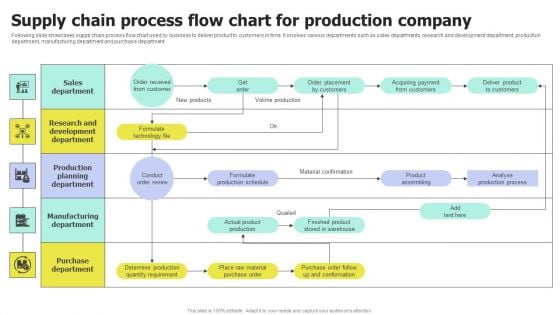
Supply Chain Process Flow Chart For Production Company Sample PDF
Pitch your topic with ease and precision using this Supply Chain Process Flow Chart For Production Company Sample PDF. This layout presents information on Chain Process, Flow Chart, Production Company. It is also available for immediate download and adjustment. So, changes can be made in the color, design, graphics or any other component to create a unique layout.
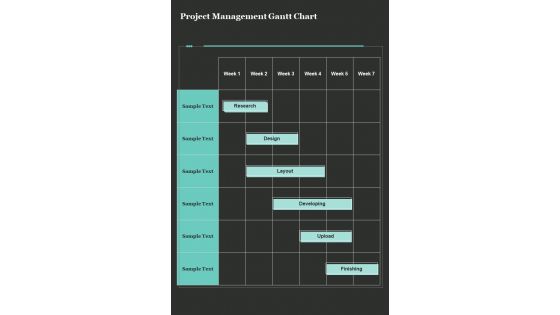
Project Management Gantt Chart One Pager Sample Example Document
Presenting you an exemplary Project Management Gantt Chart One Pager Sample Example Document. Our one-pager comprises all the must-have essentials of an inclusive document. You can edit it with ease, as its layout is completely editable. With such freedom, you can tweak its design and other elements to your requirements. Download this Project Management Gantt Chart One Pager Sample Example Document brilliant piece now.
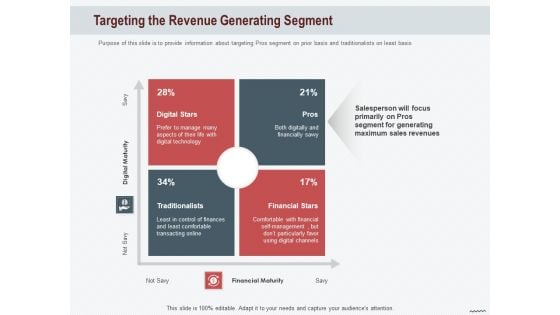
Cross Sell In Banking Industry Targeting The Revenue Generating Segment Ppt Layouts Information PDF
This is a cross sell in banking industry targeting the revenue generating segment ppt layouts information pdf template with various stages. Focus and dispense information on four stages using this creative set, that comes with editable features. It contains large content boxes to add your information on topics like digital stars, pros, financial stars, traditionalists. You can also showcase facts, figures, and other relevant content using this PPT layout. Grab it now.
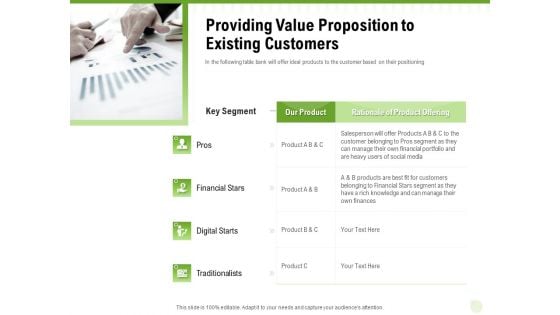
Cross Selling Of Retail Banking Products Providing Value Proposition To Existing Customers Ppt Slides Graphics PDF
This is a cross selling of retail banking products providing value proposition to existing customers ppt slides graphics pdf template with various stages. Focus and dispense information on four stages using this creative set, that comes with editable features. It contains large content boxes to add your information on topics like pros, financial stars, digital stars, traditionalists. You can also showcase facts, figures, and other relevant content using this PPT layout. Grab it now.
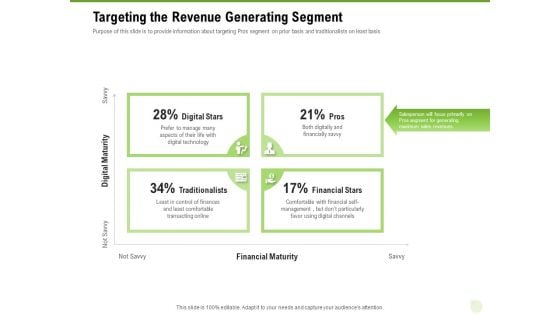
Cross Selling Of Retail Banking Products Targeting The Revenue Generating Segment Ppt Templates PDF
This is a cross selling of retail banking products targeting the revenue generating segment ppt templates pdf template with various stages. Focus and dispense information on four stages using this creative set, that comes with editable features. It contains large content boxes to add your information on topics like digital stars, pros, financial stars, traditionalists. You can also showcase facts, figures, and other relevant content using this PPT layout. Grab it now.
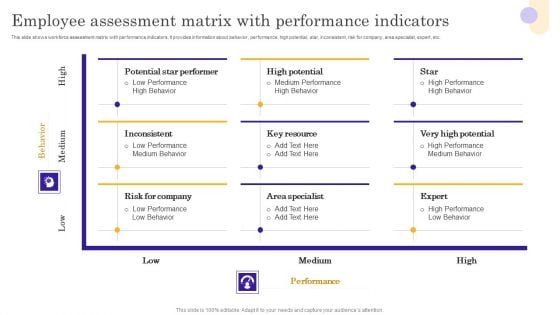
Vendor Performance Assessment Matrix With Scoring Metrics Infographics PDF
This slide shows workforce assessment matrix with performance indicators. It provides information about behavior, performance, high potential, star, inconsistent, risk for company, area specialist, expert, etc. Showcasing this set of slides titled Vendor Performance Assessment Matrix With Scoring Metrics Infographics PDF. The topics addressed in these templates are Potential Star Performer, High Potential, Inconsistent. All the content presented in this PPT design is completely editable. Download it and make adjustments in color, background, font etc. as per your unique business setting.
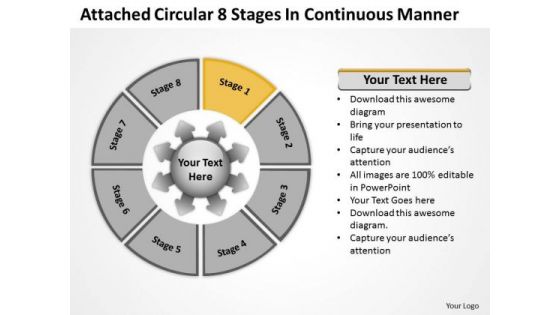
Circular 8 Stages In Continuous Manner Ppt Relative Cycle Arrow Chart PowerPoint Templates
We present our circular 8 stages in continuous manner ppt Relative Cycle Arrow Chart PowerPoint templates.Present our Ring charts PowerPoint Templates because this diagram helps to reaffirm to your team your faith in maintaining the highest ethical standards. Use our Process and flows PowerPoint Templates because brilliant ideas are your forte. Present our Business PowerPoint Templates because this template helps you to grab the attention of your listeners. Download and present our Marketing PowerPoint Templates because they represent the proress in our lives. Present our Flow charts PowerPoint Templates because you can asked to strive to give true form to your great dream.Use these PowerPoint slides for presentations relating to Arrow, art, blank, business, chart, circular, clip, clipart, clockwise, colorful, corporate, curving, cycle, diagram, directional, financial, flow, graph, graphic, illustration, info graphic, modern, pie, process, round, segments, seven, shape, slices, stages, steps. The prominent colors used in the PowerPoint template are Gray, Black, White. People tell us our circular 8 stages in continuous manner ppt Relative Cycle Arrow Chart PowerPoint templates are Romantic. We assure you our circular PowerPoint templates and PPT Slides help you meet deadlines which are an element of today's workplace. Just browse and pick the slides that appeal to your intuitive senses. PowerPoint presentation experts tell us our circular 8 stages in continuous manner ppt Relative Cycle Arrow Chart PowerPoint templates are Adorable. You can be sure our business PowerPoint templates and PPT Slides are Exuberant. Professionals tell us our circular 8 stages in continuous manner ppt Relative Cycle Arrow Chart PowerPoint templates are aesthetically designed to attract attention. We guarantee that they will grab all the eyeballs you need. Use our circular PowerPoint templates and PPT Slides are Versatile. Erect a solid structure for your thoughts to build on. Put every layer in place with our Circular 8 Stages In Continuous Manner Ppt Relative Cycle Arrow Chart PowerPoint Templates.
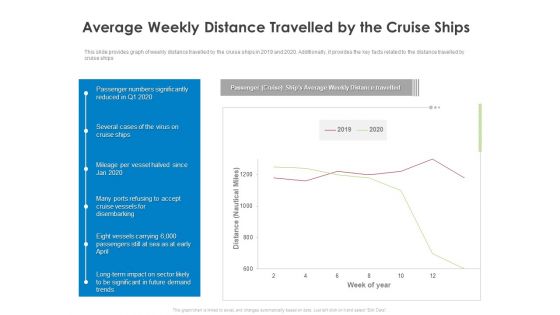
COVID 19 Risk Analysis Mitigation Policies Ocean Liner Sector Average Weekly Distance Travelled By The Cruise Ships Diagrams PDF
This slide provides graph of weekly distance travelled by the cruise ships in 2019 and 2020. Additionally, it provides the key facts related to the distance travelled by cruise ships. Deliver an awe inspiring pitch with this creative covid 19 risk analysis mitigation policies ocean liner sector average weekly distance travelled by the cruise ships diagrams pdf bundle. Topics like average weekly distance travelled by the cruise ships can be discussed with this completely editable template. It is available for immediate download depending on the needs and requirements of the user.
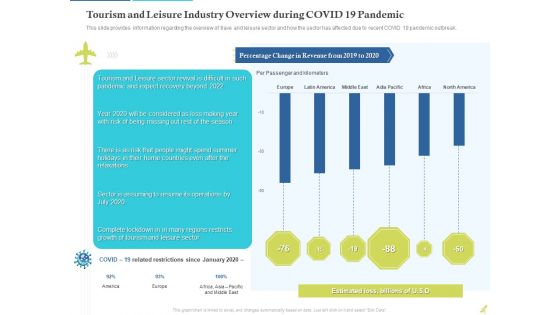
Rebuilding Travel Industry After COVID 19 Tourism And Leisure Industry Overview During COVID 19 Pandemic Diagrams PDF
This slide provides information regarding the overview of trave and leisure sector and how the sector has affected due to recent COVID 19 pandemic outbreak.Deliver an awe inspiring pitch with this creative rebuilding travel industry after COVID 19 tourism and leisure industry overview during covid 19 pandemic diagrams pdf. bundle. Topics like percentage change in revenue from 2019 to 2020, estimated loss, billions can be discussed with this completely editable template. It is available for immediate download depending on the needs and requirements of the user.
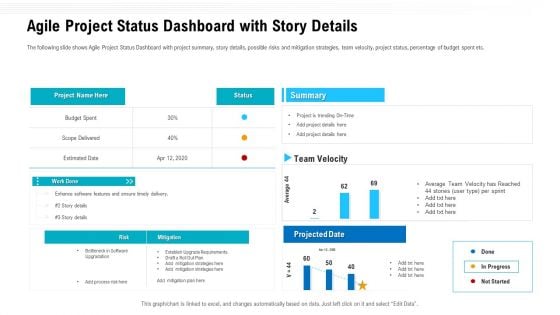
Team Performance Improvement Functional Optimization Through Agile Methodologies Agile Project Status Dashboard With Story Details Diagrams PDF
The following slide shows Agile Project Status Dashboard with project summary, story details, possible risks and mitigation strategies, team velocity, project status, percentage of budget spent etc. Deliver and pitch your topic in the best possible manner with this team performance improvement functional optimization through agile methodologies agile project status dashboard with story details diagrams pdf. Use them to share invaluable insights on agile project status dashboard with story details and impress your audience. This template can be altered and modified as per your expectations. So, grab it now.
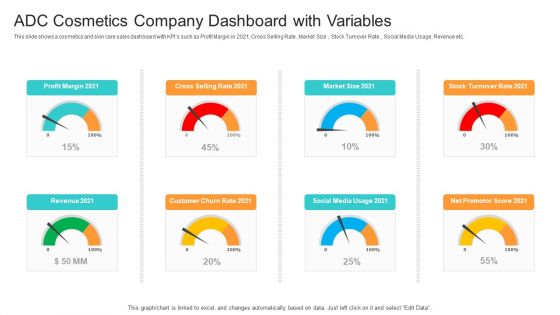
Utilization Of Current Techniques To Improve Efficiency Case Competition ADC Cosmetics Company Dashboard With Variables Diagrams PDF
This slide shows a cosmetics and skin care sales dashboard with KPIs such as Profit Margin in 2021, Cross Selling Rate , Market Size , Stock Turnover Rate , Social Media Usage, Revenue etc.Deliver and pitch your topic in the best possible manner with this utilization of current techniques to improve efficiency case competition adc cosmetics company dashboard with variables diagrams pdf. Use them to share invaluable insights on profit margin 2021, cross selling rate 2021, social media usage 2021 and impress your audience. This template can be altered and modified as per your expectations. So, grab it now.
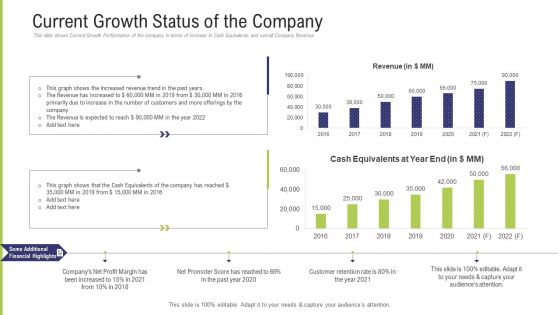
Funding Pitch Deck To Obtain Long Term Debt From Banks Current Growth Status Of The Company Diagrams PDF
This slide shows Current Growth Performance of the company in terms of increase in Cash Equivalents and overall Company Revenue. Deliver and pitch your topic in the best possible manner with this funding pitch deck to obtain long term debt from banks current growth status of the company diagrams pdf. Use them to share invaluable insights on revenue, cash equivalents, financial highlights, profit margin, customer retention rate and impress your audience. This template can be altered and modified as per your expectations. So, grab it now.
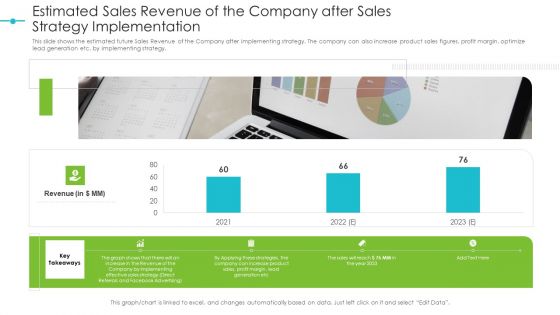
Tools For Improving Sales Plan Effectiveness Estimated Sales Revenue Of The Company After Sales Strategy Implementation Diagrams PDF
This slide shows the estimated future Sales Revenue of the Company after implementing strategy. The company can also increase product sales figures, profit margin, optimize lead generation etc. by implementing strategy. Deliver an awe inspiring pitch with this creative tools for improving sales plan effectiveness estimated sales revenue of the company after sales strategy implementation diagrams pdf bundle. Topics like strategy, implementing, effective, sales, revenue can be discussed with this completely editable template. It is available for immediate download depending on the needs and requirements of the user.
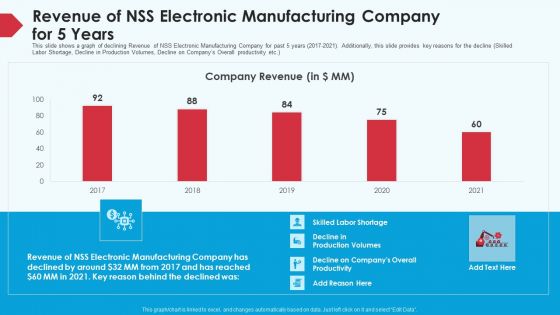
Skill Shortage In A Production Firm Case Study Solution Revenue Of NSS Electronic Manufacturing Company For 5 Years Diagrams PDF
This slide shows a graph of declining Revenue of NSS Electronic Manufacturing Company for past 5 years 2017-2021. Additionally, this slide provides key reasons for the decline Skilled Labor Shortage, Decline in Production Volumes, Decline on Companys Overall productivity etc. Deliver an awe inspiring pitch with this creative skill shortage in a production firm case study solution revenue of NSS electronic manufacturing company for 5 years diagrams pdf bundle. Topics like revenue, manufacturing, companys overall productivity, 2017 to 2021 can be discussed with this completely editable template. It is available for immediate download depending on the needs and requirements of the user.
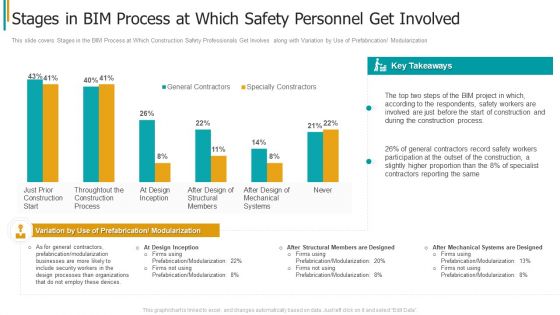
Construction Sector Project Risk Management Stages In Bim Process At Which Safety Personnel Get Involved Diagrams PDF
This slide covers Stages in the BIM Process at Which Construction Safety Professionals Get Involves along with Variation by Use of Prefabrication or Modularization. Deliver and pitch your topic in the best possible manner with this construction sector project risk management stages in bim process at which safety personnel get involved diagrams pdf. Use them to share invaluable insights on process, mechanical, organizations, businesses, modularization and impress your audience. This template can be altered and modified as per your expectations. So, grab it now.
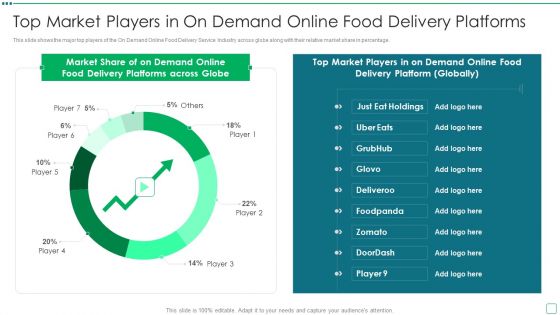
Digital Edibles Distribution Capital Funding Pitch Deck Top Market Players In On Demand Online Food Delivery Platforms Diagrams PDF
This slide shows the major top players of the On Demand Online Food Delivery Service Industry across globe along with their relative market share in percentage. Deliver and pitch your topic in the best possible manner with this digital edibles distribution capital funding pitch deck top market players in on demand online food delivery platforms diagrams pdf. Use them to share invaluable insights on top market players in on demand online food delivery platforms and impress your audience. This template can be altered and modified as per your expectations. So, grab it now.
Improving Brand Awareness Through WOM Marketing Dashboard For Tracking Marketing Activities At Social Media Platform Diagrams PDF
This slide covers information regarding the dashboard for tracking essential marketing activities at social media platform in terms of social traffic and conversion, referral traffic by site, key social media metrics. Deliver an awe inspiring pitch with this creative improving brand awareness through wom marketing dashboard for tracking marketing activities at social media platform diagrams pdf bundle. Topics like dashboard for tracking marketing activities at social media platform can be discussed with this completely editable template. It is available for immediate download depending on the needs and requirements of the user.
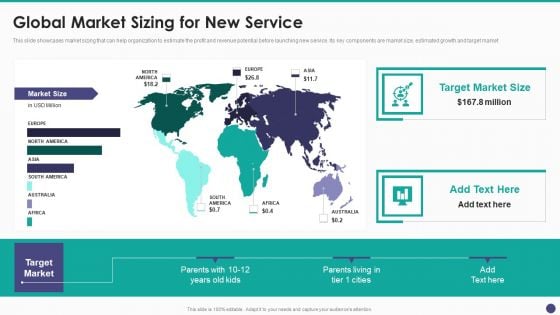
New Service Launch And Development Strategy To Gain Market Share Global Market Sizing For New Service Diagrams PDF
This slide showcases market sizing that can help organization to estimate the profit and revenue potential before launching new service. Its key components are market size, estimated growth and target market.Deliver and pitch your topic in the best possible manner with this New Service Launch And Development Strategy To Gain Market Share Global Market Sizing For New Service Diagrams PDF Use them to share invaluable insights on Global Market, Sizing, New Service and impress your audience. This template can be altered and modified as per your expectations. So, grab it now.
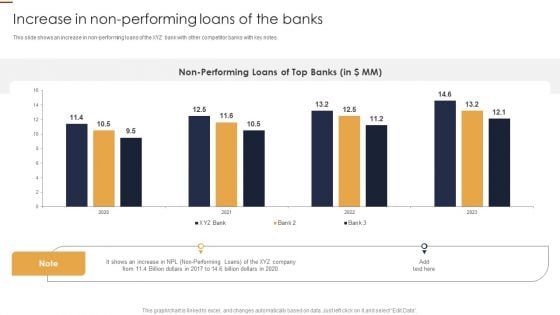
Increase In Non Performing Loans Of The Banks Credit Risk Analysis Model For Banking Institutions Diagrams PDF
This slide shows an increase in non-performing loans of the XYZ bank with other competitor banks with key notes.Want to ace your presentation in front of a live audience Our Increase In Non Performing Loans Of The Banks Credit Risk Analysis Model For Banking Institutions Diagrams PDF can help you do that by engaging all the users towards you.. Slidegeeks experts have put their efforts and expertise into creating these impeccable powerpoint presentations so that you can communicate your ideas clearly. Moreover, all the templates are customizable, and easy-to-edit and downloadable. Use these for both personal and commercial use.
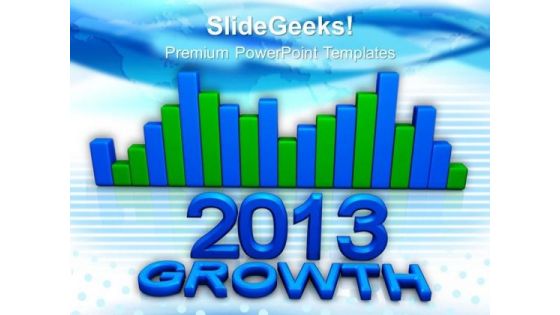
Growth Concept Marketing PowerPoint Templates And PowerPoint Themes 1012
Growth Concept Marketing PowerPoint Templates And PowerPoint Themes 1012-Create stunning Microsoft office PPT Presentations with our professional templates containing a graphic of year 2013 growth chart. This image has been professionally designed to emphasize the concept of business growth. The structure of our templates allows you to effectively highlight the key issues concerning the growth of your business. This image has been conceived to enable you to emphatically communicate your ideas in your Marketing and Financial PPT presentations.-Growth Concept Marketing PowerPoint Templates And PowerPoint Themes 1012-This PowerPoint template can be used for presentations relating to-Growth concept marketing, business, success, finance, new year, marketing Crack the code with our Growth Concept Marketing PowerPoint Templates And PowerPoint Themes 1012. Your thoughts will decipher it for the audience.
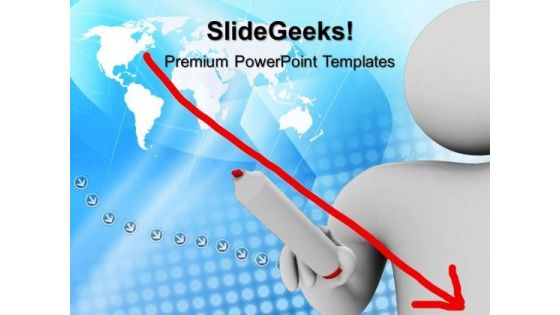
3d Man Global Business PowerPoint Templates And PowerPoint Themes 1012
3d Man Global Business PowerPoint Templates And PowerPoint Themes 1012-This template with an image of 3d man drawing a down bar graph helps you chart the course of your presentation. This image represents the downfall of the business or financial crisis. Our stunning and unique image makes your presentations simpler and professional showing that you care about even the smallest details. This template signifies global business, finance, marketing, statistics, strategy and success.-3d Man Global Business PowerPoint Templates And PowerPoint Themes 1012-This PowerPoint template can be used for presentations relating to-Global business man, earth, business, glabe, technology, success Claim your prize with our 3d Man Global Business PowerPoint Templates And PowerPoint Themes 1012. You will come out on top.
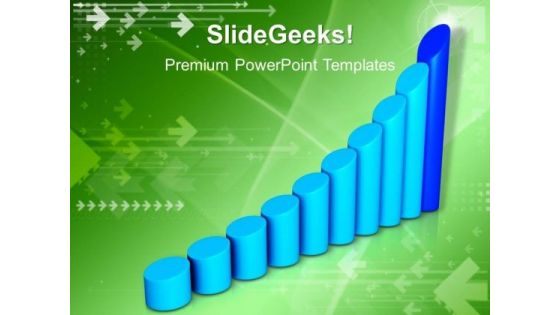
Bar Graph Business PowerPoint Templates And PowerPoint Themes 1012
Bar Graph Business PowerPoint Templates And PowerPoint Themes 1012-This PowerPoint Template shows the Bar Graph with increasing percentage which signifies the Financial Growth. The Template signifies the concept of business growth. The structure of our templates allows you to effectively highlight the key issues concerning the growth of your business. Our PPT images are so ideally designed that it reveals the very basis of our PPT template are an effective tool to make your clients understand.-Bar Graph Business PowerPoint Templates And PowerPoint Themes 1012-This PowerPoint template can be used for presentations relating to-Financial bar graph chart, technology, money, business, finance, marketing Handle a delicate situation with our Bar Graph Business PowerPoint Templates And PowerPoint Themes 1012. Just download, type and present.
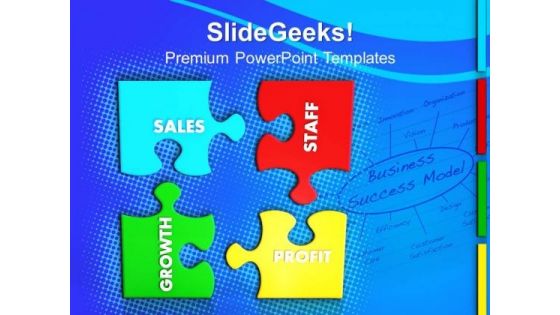
Business Jigsaw Puzzles PowerPoint Templates And PowerPoint Themes 1012
Business Jigsaw Puzzles PowerPoint Templates And PowerPoint Themes 1012-This template with an image of four jigsaw pieces showing business metaphor for communication helps you chart the course of your presentation. Our PPT images are so ideally designed that it reveals the very basis of our PPT template are an effective tool to make your clients understand. The structure of our templates allows you to effectively highlight the key issues concerning the growth of your business.-Business Jigsaw Puzzles PowerPoint Templates And PowerPoint Themes 1012-This PowerPoint template can be used for presentations relating to-Business puzzle in pieces, business, metaphor, success, teamwork, leadership Our Business Jigsaw Puzzles PowerPoint Templates And PowerPoint Themes 1012 ensure you never fall short. They have much more than you can want.
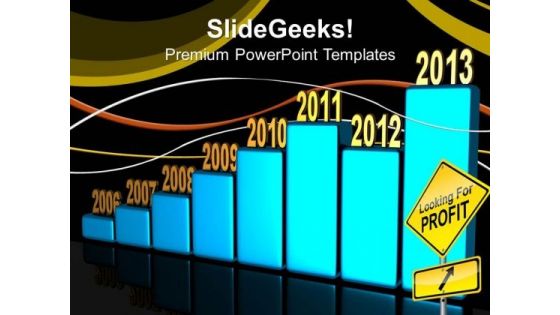
Increase In Profit Business PowerPoint Templates And PowerPoint Themes 1012
Increase In Profit Business PowerPoint Templates And PowerPoint Themes 1012-Use this template containing a blue bar graph with years in staircase manner showing increase in profits yearly to highlight the key issues of your presentation. The development in business is due to working in team and leadership. This image has been conceived to enable you to emphatically communicate your ideas in your Business and Teamwork PPT presentations. Create captivating presentations to deliver comparative and weighted arguments.-Increase In Profit Business PowerPoint Templates And PowerPoint Themes 1012-This PowerPoint template can be used for presentations relating to-Chart graph profit increase, finance, success, marketing, business, communication Be bold and dramatic with our Increase In Profit Business PowerPoint Templates And PowerPoint Themes 1012. State the facts with elan.

Dollar Sign Business PowerPoint Templates And PowerPoint Themes 1012
Dollar Sign Business PowerPoint Templates And PowerPoint Themes 1012-Emphatically define your message with our above Template which contains a graphic of 3D dollar symbol and businessman showing thumbs up expressing victory or success. This image signifies the concept of successful business. Adjust the above image in your PPT presentations to visually support your content in your Business and Financial PPT slideshows. Deliver amazing presentations to mesmerize your audience with our template.-Dollar Sign Business PowerPoint Templates And PowerPoint Themes 1012-This PowerPoint template can be used for presentations relating to-Dollar sign, Business, Symbol, Signs, Success, Metaphor Be far sighted with our Dollar Sign Business PowerPoint Templates And PowerPoint Themes 1012. They help you chart out a credible course.

Home Loan Money Business PowerPoint Templates And PowerPoint Themes 1012
Home Loan Money Business PowerPoint Templates And PowerPoint Themes 1012-This template with an image of Dollar Bills under the house illustrated in the Aligned manner helps you chart the course of your presentation. This Template signifies the investment Concept. The Dollar Bills are placed in 3D manner. You have what it takes to grow. Take your team along by explaining your plans.-Home Loan Money Business PowerPoint Templates And PowerPoint Themes 1012-This PowerPoint template can be used for presentations relating to-House On Money Stack, Business, Sales, Real Estate, Finance, Money Our Home Loan Money Business PowerPoint Templates And PowerPoint Themes 1012 will ensure your ideas are approved. You will be glad you tried us out.

Online Exam Concept Internet PowerPoint Templates And PowerPoint Themes 1012
Online Exam Concept Internet PowerPoint Templates And PowerPoint Themes 1012-Use this Template to illustrate the strategy used in Online Examination. Internet, Computer, practice are its main component. Reaffirm to your team your faith in maintaining the highest ethical standards. Drive home your reasons and chart the path ahead to arrive at tour destination and achieve the goal. Your foot is on the pedal and your company is purring along smoothly.-Online Exam Concept Internet PowerPoint Templates And PowerPoint Themes 1012-This PowerPoint template can be used for presentations relating to-Online Exam Concept, Education, Internet, Techonology, Shapes, Computer Our Online Exam Concept Internet PowerPoint Templates And PowerPoint Themes 1012 will ensure you get an A. You will be glad you tried us out.
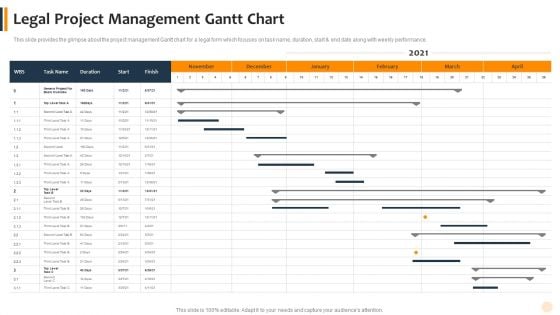
Agile Technique To Lawful Pitch And Proposals IT Legal Project Management Gantt Chart Slides PDF
Design a highly optimized project management report using this well-researched agile technique to lawful pitch and proposals it legal project management gantt chart slides pdf. This layout can be used to present the professional details of a task or activity. Showcase the activities allocated to the business executives with this Gantt Chart PowerPoint theme. List down the column tasks in various timeframes and allocate time for each. In addition, also monitor the actual time and make comparisons to interpret the final progress using this innovative Gantt Chart Template. Showcase the work breakdown structure to attract your audience. Download and share it using Google Slides, if it suits your requirement.

PowerPoint Design Slides Chart Rectangular Jigsaw Puzzle Ppt Designs
PowerPoint Design Slides Chart Rectangular Jigsaw Puzzle PPT Designs- It is all there in bits and pieces. Individual components well researched and understood in their place. Now you need to get it all together to form the complete picture and reach the goal. You have the ideas and plans on how to go about it. Use this template to illustrate your method, piece by piece, and interlock the whole process in the minds of your audience.-PowerPoint Design Slides Chart Rectangular Jigsaw Puzzle PPT Designs Electrify your audience with our PowerPoint Design Slides Chart Rectangular Jigsaw Puzzle Ppt Designs. Just download, type and present.
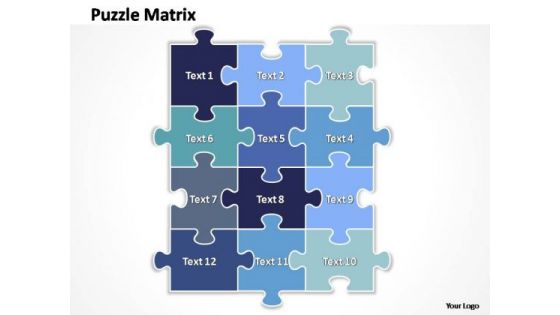
PowerPoint Slide Layout Chart Rectangular Jigsaw Puzzle Ppt Template
PowerPoint Slide layout Chart Rectangular Jigsaw Puzzle PPT Template- It is all there in bits and pieces. Individual components well researched and understood in their place. Now you need to get it all together to form the complete picture and reach the goal. You have the ideas and plans on how to go about it. Use this template to illustrate your method, piece by piece, and interlock the whole process in the minds of your audience.-PowerPoint Slide layout Chart Rectangular Jigsaw Puzzle PPT Template Address eco-clubs with our PowerPoint Slide Layout Chart Rectangular Jigsaw Puzzle Ppt Template. Advocate curbing of carbon emissions.

Business Circle Charts PowerPoint Templates Business Comb Process Ppt Slides
Business Circle Charts PowerPoint Templates Business Comb Process PPT Slides-The business process network are responsible for the total worth of services and products. This amazing comb diagarm best describes a value business process network -Business Circle Charts PowerPoint Templates Business Comb Process PPT Slides-This template can be used for presentations relating to Abstract, Backdrop, Background, Biology, Cell, Chemistry, Computer, Connections, Construction, Design, Digital, Futuristic, Geometric, Graphic, Grid, Hexagon, Holes, Honeycomb, Illustration, Mesh, Modern, Network, Organization, Pattern, Rows, Science, Shape, Structure Fill out your thoughts with our Business Circle Charts PowerPoint Templates Business Comb Process Ppt Slides. They will get bigger and better.

Business Circle Charts PowerPoint Templates Business Globes Ppt Slides
Business Circle Charts PowerPoint Templates Business Globes PPT Slides-This template portrays the concepts of globes, globe, global, earth, planets, global and business-Business Circle Charts PowerPoint Templates Business Globes PPT Slides-This template can be used for presentations relating to Accurate, Africa, Altitude, America, Asia, Australia, Bright, Brightly, Business, Canada, Cartography, Collection, Communication, Continent, Destination, Detailed, Earth, Europe, Global, Globe, Group, Illustration, Image, Land, Latitude, Lit, Longitude, Map, Mexico, North, Ocean, Planet Your thoughts demand approval. Win the favour of the audience with our Business Circle Charts PowerPoint Templates Business Globes Ppt Slides.
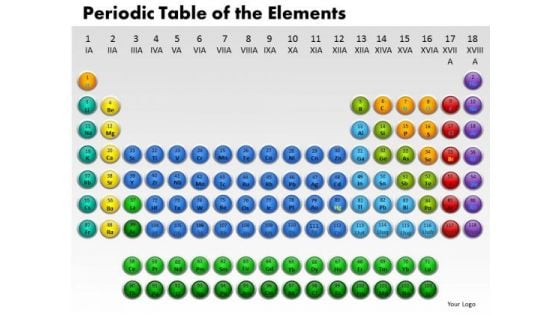
Business Circle Charts PowerPoint Templates Business Periodic Table Ppt Slides
Business Circle Charts PowerPoint Templates Business periodic table PPT Slides-Use this graphics to represent a continuing sequence of stages, tasks, or events in a circular flow and emphasize the connection between all components. -Business Circle Charts PowerPoint Templates Business periodic table PPT Slides-This template can be used for presentations relating to Actinoids, Atom, Atomic, Chemistry, Electrons, Element, Helium, Hydrogen, Lanthanoids, Liquid, Molecule, Noble, Periodic, Physics, Plutonium, Quantum, Radium, Science, Scientific, Solid, Symbol, Table Our Business Circle Charts PowerPoint Templates Business Periodic Table Ppt Slides are academically capable. They make learning a lot more fun.

Business Circle Charts PowerPoint Templates Finance Comb Process Ppt Slides
Business Circle Charts PowerPoint Templates Finance Comb Process PPT Slides-There are certain key areas on which the internal value networks concentrate. Use this Finance Comb Process Design to explain these prime activities and other associations and methods that cross over the internal boundaries. -Business Circle Charts PowerPoint Templates Finance Comb Process PPT Slides-This template can be used for presentations relating to Abstract, Backdrop, Background, Biology, Cell, Chemistry, Computer, Connections, Construction, Design, Digital, Futuristic, Geometric, Graphic, Grid, Hexagon, Holes, Honeycomb, Illustration, Mesh, Modern, Network, Organization, Pattern, Rows, Science, Shape, Structure Manage expectations with our Business Circle Charts PowerPoint Templates Finance Comb Process Ppt Slides. You will be at the top of your game.
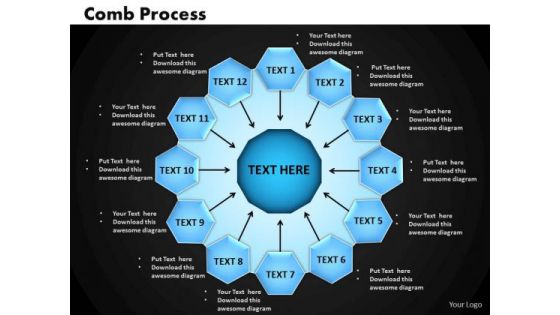
Business Circle Charts PowerPoint Templates Process Comb Process Ppt Slides
Business Circle Charts PowerPoint Templates Process Comb Process PPT Slides-The business process network are responsible for the total worth of services and products. This amazing comb diagarm best describes a value business process network -Business Circle Charts PowerPoint Templates Process Comb Process PPT Slides-This template can be used for presentations relating to Abstract, Backdrop, Background, Biology, Cell, Chemistry, Computer, Connections, Construction, Design, Digital, Futuristic, Geometric, Graphic, Grid, Hexagon, Holes, Honeycomb, Illustration, Mesh, Modern, Network, Organization, Pattern, Rows, Science, Shape, Structure Adopt adventure with our Business Circle Charts PowerPoint Templates Process Comb Process Ppt Slides. Discover new avenues for your thoughts.
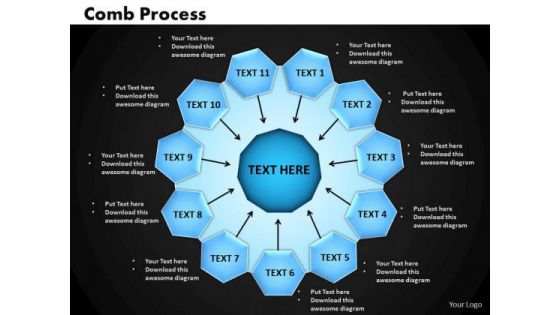
Business Circle Charts PowerPoint Templates Success Comb Process Ppt Slides
Business Circle Charts PowerPoint Templates Success Comb Process PPT Slides-Use this graphics to organize major factors like business methods, relevant inputs, business association and networking, quality services that will ascertain the height of achievement and can lead to success-Business Circle Charts PowerPoint Templates Success Comb Process PPT Slides-This template can be used for presentations relating to Abstract, Backdrop, Background, Biology, Cell, Chemistry, Computer, Connections, Construction, Design, Digital, Futuristic, Geometric, Graphic, Grid, Hexagon, Holes, Honeycomb, Illustration, Mesh, Modern, Network, Organization, Pattern, Rows, Science, Shape, Structure Never fail to impress with our Business Circle Charts PowerPoint Templates Success Comb Process Ppt Slides. You will be at the top of your game.
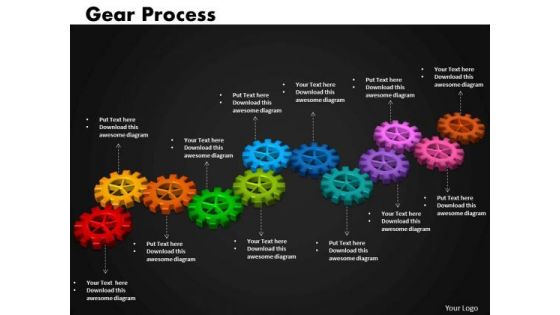
Business Cycle Charts PowerPoint Templates Success Gears Process Ppt Slides
Business Cycle Charts PowerPoint Templates Success Gears Process PPT Slides-Use this graphics for most important events during the event identification and analysis stage.-Business Cycle Charts PowerPoint Templates Success Gears Process PPT Slides-This template can be used for presentations relating to 3d, Business, Circle, Circular, Clockwork, Cogs, Cogwheel, Colorful, Colors, Community, Component, Concept, Cooperate, Cooperation, Cycle, Cyclical, Different, Diverse, Diversity, Gear, Geometric, Hi-Tech, Idea, Industrial, Industry, Machine, Machinery, Mechanical, Mechanics, Round, Process,Progress Attempt great targets with our Business Cycle Charts PowerPoint Templates Success Gears Process Ppt Slides. You will come out on top.
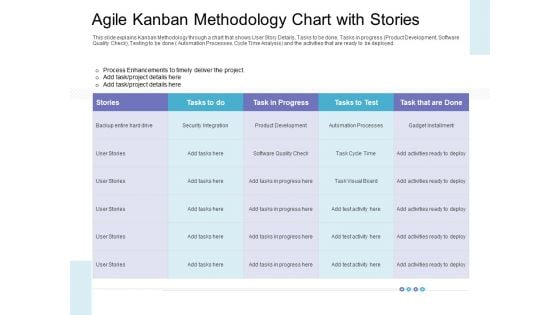
Agile Kanban Methodology Chart With Stories Formats PDF
This slide explains Kanban Methodology through a chart that shows User Story Details, Tasks to be done, Tasks in progress Product Development, Software Quality Check, Testing to be done Automation Processes, Cycle Time Analysis and the activities that are ready to be deployed. Deliver an awe-inspiring pitch with this creative agile kanban methodology chart with stories formats pdf bundle. Topics like agile kanban methodology chart with stories can be discussed with this completely editable template. It is available for immediate download depending on the needs and requirements of the user.
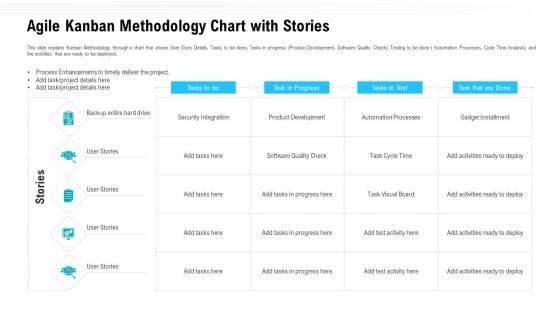
Agile Kanban Methodology Chart With Stories Ppt Model Show PDF
This slide explains Kanban Methodology through a chart that shows User Story Details, Tasks to be done, Tasks in progress Product Development, Software Quality Check, Testing to be done Automation Processes, Cycle Time Analysis and the activities that are ready to be deployed. Deliver an awe inspiring pitch with this creative agile kanban methodology chart with stories ppt model show pdf bundle. Topics like product development, process enhancements to timely deliver the project, agile kanban methodology chart with stories can be discussed with this completely editable template. It is available for immediate download depending on the needs and requirements of the user.
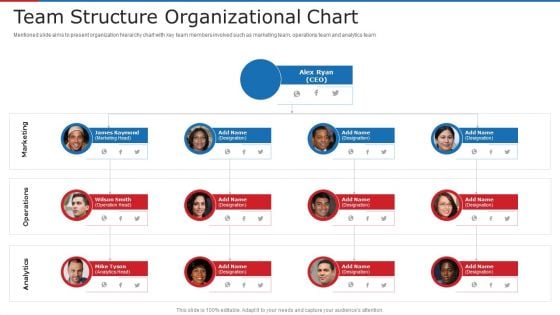
Team Structure Organizational Chart Ppt Infographics Example Introduction PDF
Mentioned slide aims to present organization hierarchy chart with key team members involved such as marketing team, operations team and analytics team. This is a team structure organizational chart ppt infographics example introduction pdf template with various stages. Focus and dispense information on four stages using this creative set, that comes with editable features. It contains large content boxes to add your information on topics like team structure organizational chart. You can also showcase facts, figures, and other relevant content using this PPT layout. Grab it now.

Comprehensive Solution Analysis Solution Assessment Criteria Analysis Chart Mockup PDF
This slide shows the solution assessment criteria analysis chart whose purpose is to evaluate the options available for a particular solution based on management receptivity, degree of risk and feasibility, solution cost etc.. along with the total score of each solution. This is a comprehensive solution analysis solution assessment criteria analysis chart mockup pdf template with various stages. Focus and dispense information on one stage using this creative set, that comes with editable features. It contains large content boxes to add your information on topics like solution assessment criteria analysis chart. You can also showcase facts, figures, and other relevant content using this PPT layout. Grab it now.
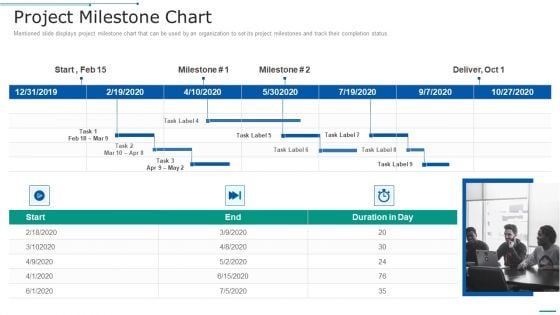
PMP Toolkit Project Milestone Chart Ppt Layouts Templates PDF
Mentioned slide displays project milestone chart that can be used by an organization to set its project milestones and track their completion status. This is a pmp toolkit project milestone chart ppt layouts templates pdf template with various stages. Focus and dispense information on one stages using this creative set, that comes with editable features. It contains large content boxes to add your information on topics like project milestone chart. You can also showcase facts, figures, and other relevant content using this PPT layout. Grab it now.
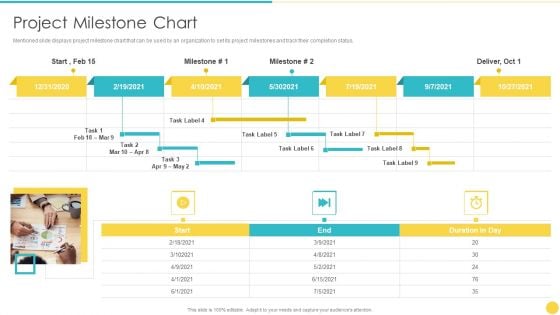
Project Management Professional Toolset IT Project Milestone Chart Download PDF
Mentioned slide displays project milestone chart that can be used by an organization to set its project milestones and track their completion status. This is a project management professional toolset it project milestone chart download pdf template with various stages. Focus and dispense information on one stages using this creative set, that comes with editable features. It contains large content boxes to add your information on topics like project milestone chart. You can also showcase facts, figures, and other relevant content using this PPT layout. Grab it now.
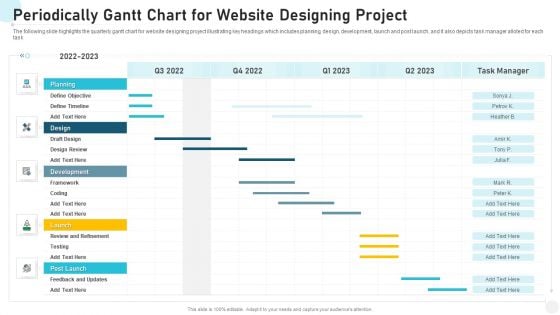
Periodically Gantt Chart For Website Designing Project Portrait PDF
The following slide highlights the quarterly gantt chart for website designing project illustrating key headings which includes planning, design, development, launch and post launch, and it also depicts task manager alloted for each task Showcasing this set of slides titled periodically gantt chart for website designing project portrait pdf. The topics addressed in these templates are periodically gantt chart for website designing project. All the content presented in this PPT design is completely editable. Download it and make adjustments in color, background, font etc. as per your unique business setting.
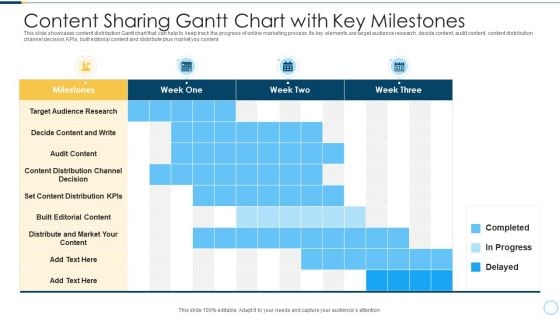
Content Sharing Gantt Chart With Key Milestones Elements PDF
This slide showcases content distribution Gantt chart that can help to keep track the progress of online marketing process. Its key elements are target audience research, decide content, audit content, content distribution channel decision, KPIs, built editorial content and distribute plus market you content Showcasing this set of slides titled content sharing gantt chart with key milestones elements pdf. The topics addressed in these templates are content sharing gantt chart with key milestones. All the content presented in this PPT design is completely editable. Download it and make adjustments in color, background, font etc. as per your unique business setting.

Price Catalogue Chart For Supplier Services Assessment Inspiration PDF
This slide showcases price catalogue chart that can help organization to make comparative assessment of transportation and warehousing costs of different suppliers. It also outlines cost per unit comparison of raw materials of Showcasing this set of slides titled price catalogue chart for supplier services assessment inspiration pdf. The topics addressed in these templates are price catalogue chart for supplier services assessment. All the content presented in this PPT design is completely editable. Download it and make adjustments in color, background, font etc. as per your unique business setting.

Price Catalogue Chart With Bulk Cost And Deviation Background PDF
This slide showcases list chart that can help consumer to compare the price per unit offered by organization in marketplace. It also showcases pricing for bulk purchase of product and deviation in prices Showcasing this set of slides titled price catalogue chart with bulk cost and deviation background pdf. The topics addressed in these templates are price catalogue chart with bulk cost and deviation. All the content presented in this PPT design is completely editable. Download it and make adjustments in color, background, font etc. as per your unique business setting.
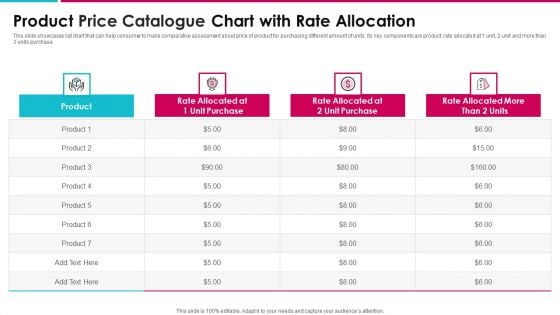
Product Price Catalogue Chart With Rate Allocation Infographics PDF
This slide showcases list chart that can help consumer to make comparative assessment about price of product for purchasing different amount of units. Its key components are product, rate allocated at 1 unit, 2 unit and more than 3 units purchase Pitch your topic with ease and precision using this product price catalogue chart with rate allocation infographics pdf. This layout presents information on product price catalogue chart with rate allocation. It is also available for immediate download and adjustment. So, changes can be made in the color, design, graphics or any other component to create a unique layout.
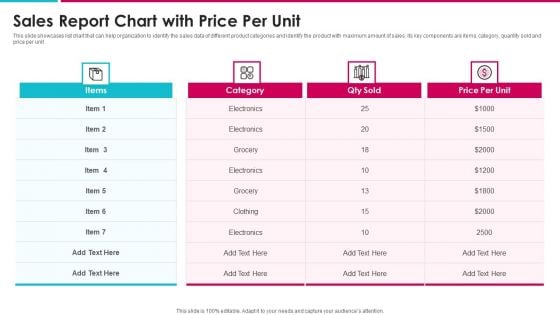
Sales Report Chart With Price Per Unit Information PDF
This slide showcases list chart that can help organization to identify the sales data of different product categories and identify the product with maximum amount of sales. Its key components are items, category, quantity sold and price per unit Showcasing this set of slides titled sales report chart with price per unit information pdf. The topics addressed in these templates are sales report chart with price per unit. All the content presented in this PPT design is completely editable. Download it and make adjustments in color, background, font etc. as per your unique business setting.
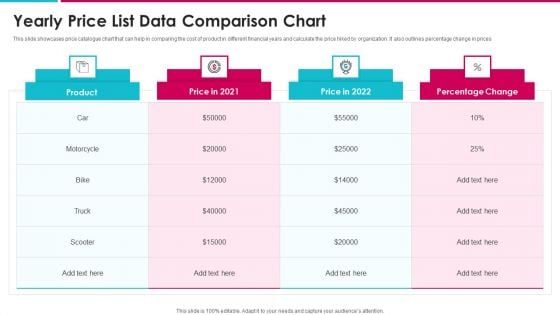
Yearly Price List Data Comparison Chart Structure PDF
This slide showcases price catalogue chart that can help in comparing the cost of product in different financial years and calculate the price hiked by organization. It also outlines percentage change in prices Showcasing this set of slides titled yearly price list data comparison chart structure pdf. The topics addressed in these templates are yearly price list data comparison chart. All the content presented in this PPT design is completely editable. Download it and make adjustments in color, background, font etc. as per your unique business setting.
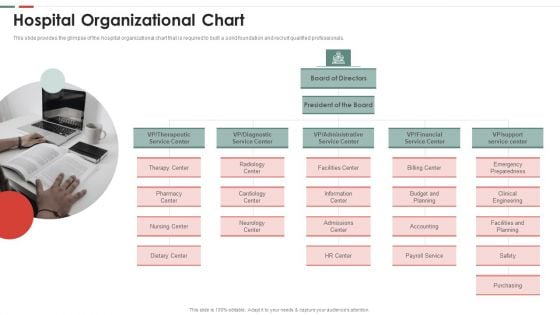
Feasibility Analysis Template Different Projects Hospital Organizational Chart Download PDF
This slide provides the glimpse of the hospital organizational chart that is required to built a solid foundation and recruit qualified professionals. Presenting feasibility analysis template different projects hospital organizational chart download pdf to provide visual cues and insights. Share and navigate important information on one stages that need your due attention. This template can be used to pitch topics like hospital organizational chart. In addtion, this PPT design contains high resolution images, graphics, etc, that are easily editable and available for immediate download.
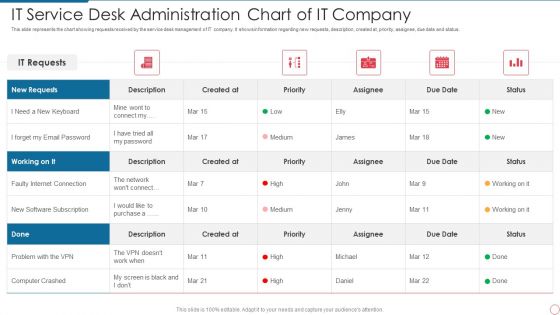
IT Service Desk Administration Chart Of IT Company Infographics PDF
This slide represents the chart showing requests received by the service desk management of IT company. It shows information regarding new requests, description, created at, priority, assignee, due date and status. Showcasing this set of slides titled IT Service Desk Administration Chart Of IT Company Infographics PDF. The topics addressed in these templates are It Service Desk Administration Chart Of It Company. All the content presented in this PPT design is completely editable. Download it and make adjustments in color, background, font etc. as per your unique business setting.
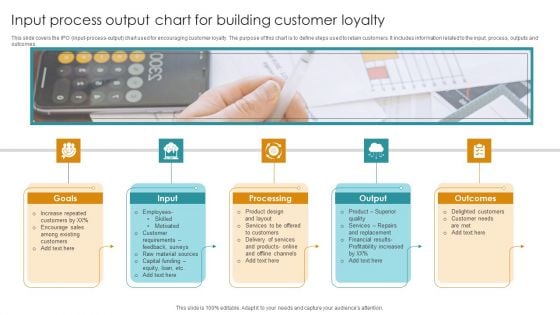
Input Process Output Chart For Building Customer Loyalty Formats PDF
This slide covers the IPO input-process-output chart used for encouraging customer loyalty. The purpose of this chart is to define steps used to retain customers. It includes information related to the input, process, outputs and outcomes. Persuade your audience using this Input Process Output Chart For Building Customer Loyalty Formats PDF. This PPT design covers Five stages, thus making it a great tool to use. It also caters to a variety of topics including Goals, Input, Processing. Download this PPT design now to present a convincing pitch that not only emphasizes the topic but also showcases your presentation skills.
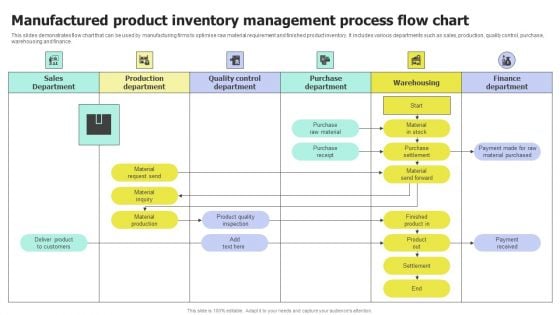
Manufactured Product Inventory Management Process Flow Chart Microsoft PDF
This slide demonstrates flow chart that can be used by manufacturing firms to optimise raw material requirement and finished product inventory. It includes various departments such as sales, production, quality control, purchase, warehousing and finance. Pitch your topic with ease and precision using this Manufactured Product Inventory Management Process Flow Chart Microsoft PDF. This layout presents information on Manufactured Product, Inventory Management, Process Flow Chart. It is also available for immediate download and adjustment. So, changes can be made in the color, design, graphics or any other component to create a unique layout.
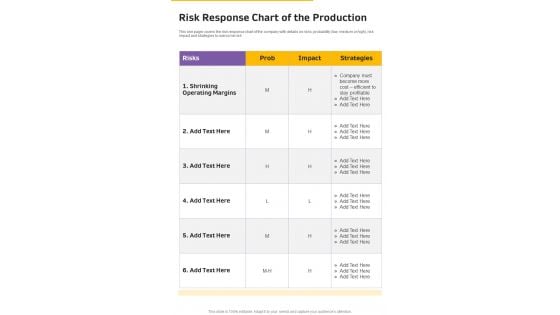
Risk Response Chart Of The Production One Pager Documents
This one pager covers the risk response chart of the company with details on risks, probability low, medium or high, risk impact and strategies to overcome risk. Presenting you a fantastic Risk Response Chart Of The Production One Pager Documents. This piece is crafted on hours of research and professional design efforts to ensure you have the best resource. It is completely editable and its design allow you to rehash its elements to suit your needs. Get this Risk Response Chart Of The Production One Pager Documents A4 One-pager now.
Risk Tracker Chart Of The Production One Pager Documents
This one pager covers the risk tracker chart of the company that can be used to track the risk factors and how the company is planning to overcome the same. Presenting you an exemplary Risk Tracker Chart Of The Production One Pager Documents. Our one-pager comprises all the must-have essentials of an inclusive document. You can edit it with ease, as its layout is completely editable. With such freedom, you can tweak its design and other elements to your requirements. Download this Risk Tracker Chart Of The Production One Pager Documents brilliant piece now.


 Continue with Email

 Home
Home


