icons

Hexagonal Chart For Market Research Management Powerpoint Template
This PowerPoint template has been designed with hexagonal chart. This PowerPoint template may be used to display market research management. Prove the viability of your ideas using this impressive slide.
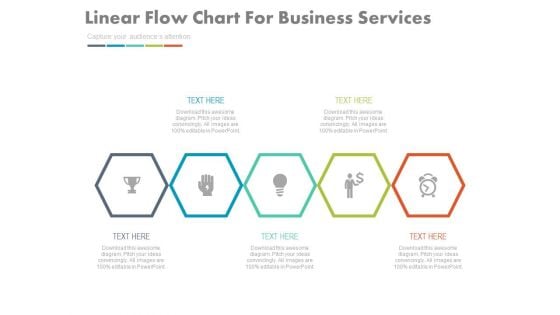
Linear Infographic Chart For Quick Business Plan Powerpoint Template
This PowerPoint template has been designed with linear infographic chart. Use this PPT slide to display quick business plan. Download this template to leave permanent impression on your audience.
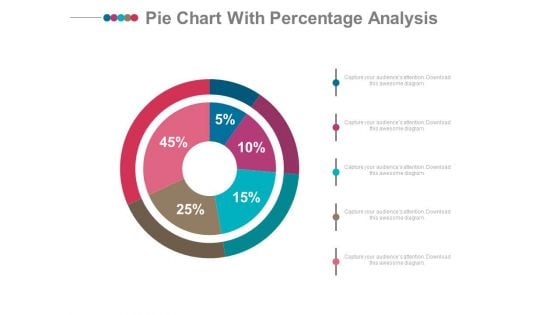
Pie Chart With Financial Data Comparison Powerpoint Slides
Emphatically define your message with our above template which contains graphics of pie chart. This PowerPoint template may be used to display financial data comparison. Grab the attention of your listeners with this slide.
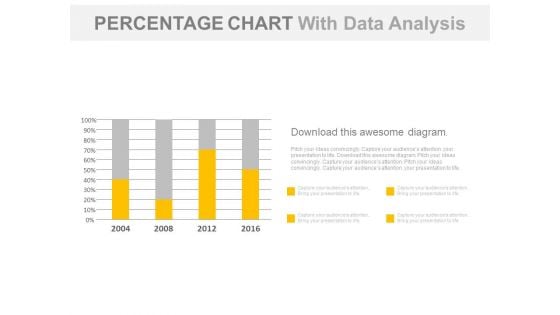
Year Based Chart With Percentage Data Analysis Powerpoint Slides
Our above business slide contains year based statistical chart. This PowerPoint template can be used to display percentage data analysis. Capture the attention of your audience with this slide.
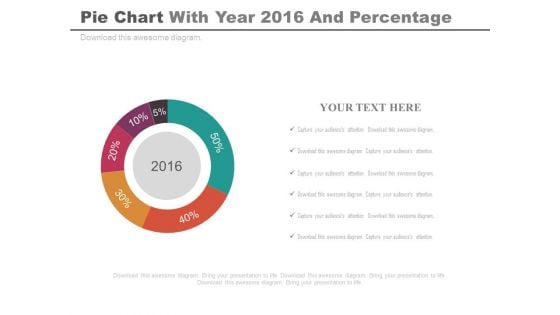
Pie Chart For Projected Profit Of 2016 Powerpoint Slides
Our above PPT slide displays graphics of Pie chart. This PowerPoint template may be used to display projected profit report of 2016. Download this template to leave permanent impression on your audience.
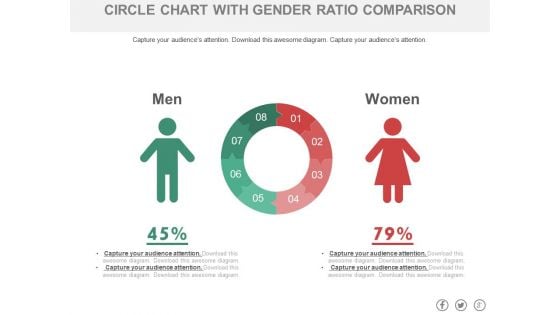
Circle Chart With Man And Woman Ratio Comparison Powerpoint Slides
This PowerPoint template has been designed with graphics of circle chart. You may download this PPT slide to depict man and woman ratio analysis. Add this slide to your presentation and impress your superiors.
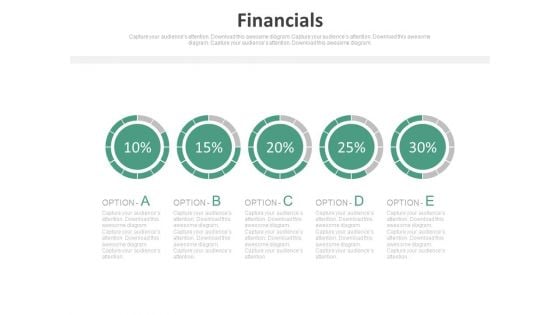
Pie Charts For Percentage Value Analysis Powerpoint Slides
Our above PPT slide displays graphics of Pie charts. This PowerPoint template may be used to display percentage value analysis. Download this template to leave permanent impression on your audience.
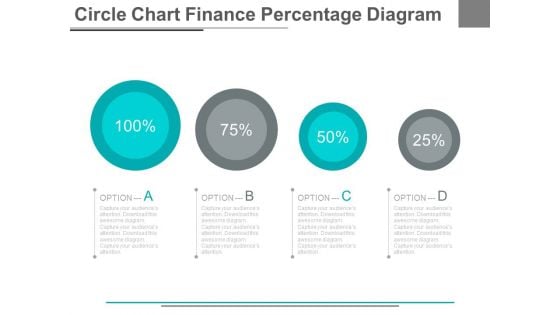
Four Options Circle Chart With Percentage Powerpoint Slides
This PowerPoint template has been designed with graphics of four options circle chart. This PowerPoint template may be used to display four steps of financial analysis. Prove the viability of your ideas using this impressive slide.
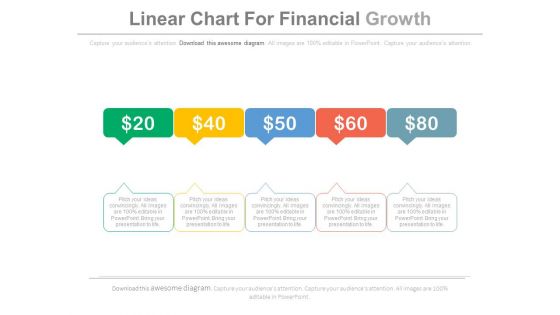
Five Steps Linear Chart For Financial Growth Powerpoint Slides
This PowerPoint template has been designed with five steps linear chart. This PPT slide may be used to display financial planning and growth. Download this slide to build unique presentation.
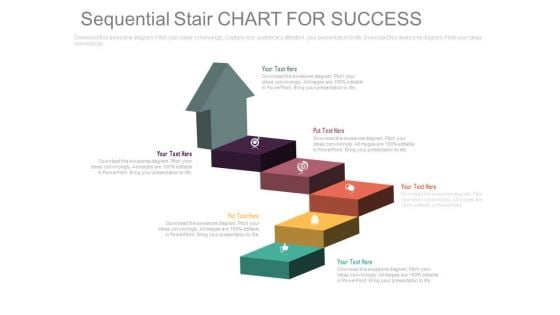
Arrow Steps Chart For Business Success Powerpoint Template
This PowerPoint template has been designed with graphics of arrow steps chart. Download this slide for planning of financial targets. Grab the attention of your listeners with this PPT slide.
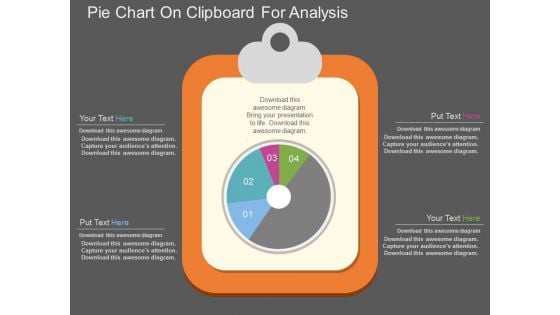
Pie Chart On Clipboard For Analysis Powerpoint Template
This PowerPoint template has been designed with graphics of pie chart on clipboard. Download this PPT slide for business and financial analysis. You may also use this professional template to depict statistical analysis.
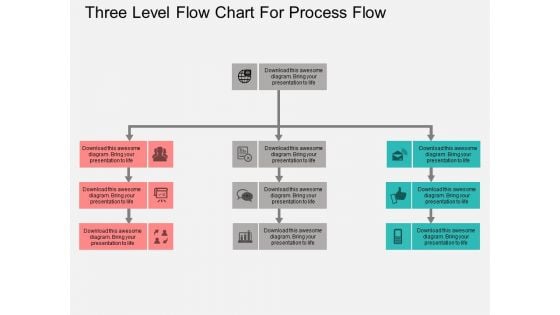
Three Level Flow Chart For Process Flow Powerpoint Template
Visually support your presentation with our above template of three level flow chart. This slide has been professionally designed to display business process flow. This template offers an excellent background to build impressive presentation.
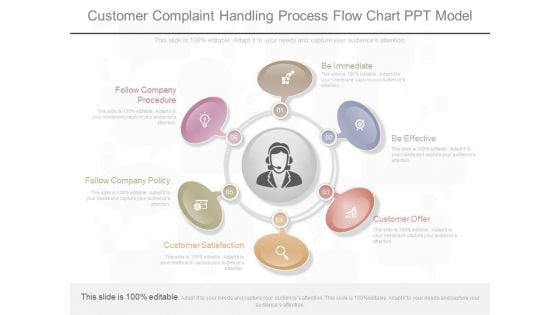
Customer Complaint Handling Process Flow Chart Ppt Model
This is a customer complaint handling process flow chart ppt model. This is a six stage process. The stages in this process are follow company procedure, follow company policy, customer satisfaction, be immediate, be effective, customer offer.
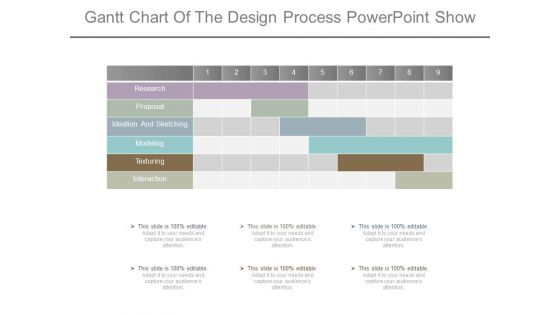
Gantt Chart Of The Design Process Powerpoint Show
This is a gantt chart of the design process powerpoint show. This is a one stage process. The stages in this process are research, proposal, ideation and sketching, modeling, texturing, interaction.
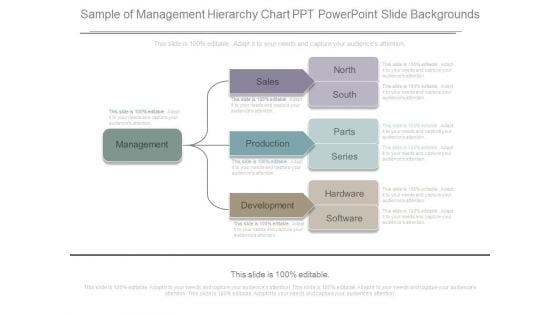
Sample Of Management Hierarchy Chart Ppt Powerpoint Slide Backgrounds
This is a sample of management hierarchy chart ppt powerpoint slide backgrounds. This is a one stage process. The stages in this process are management, sales, production, development, north, south, parts, series, hardware, software.
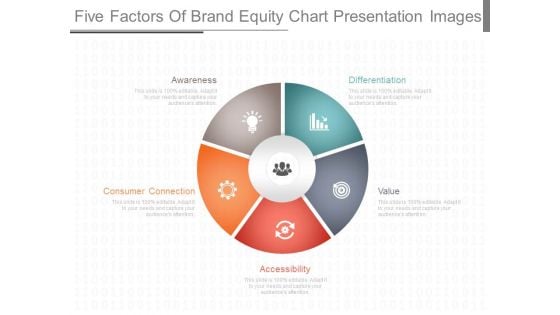
Five Factors Of Brand Equity Chart Presentation Images
This is a five factors of brand equity chart presentation images. This is a five stage process. The stages in this process are awareness, differentiation, consumer connection, accessibility, value. \n \n \n \n \n \n \n \n \n \n
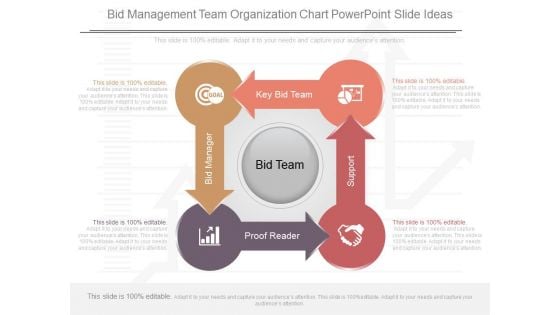
Bid Management Team Organization Chart Powerpoint Slide Ideas
This is a bid management team organization chart powerpoint slide ideas. This is a four stage process. The stages in this process are bid team, key bid team, bid manager, proof reader, support.
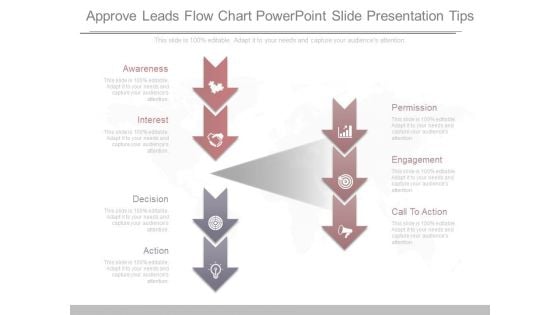
Approve Leads Flow Chart Powerpoint Slide Presentation Tips
This is a approve leads flow chart powerpoint slide presentation tips. This is a seven stage process. The stages in this process are awareness, interest, decision, action, permission, engagement, call to action.
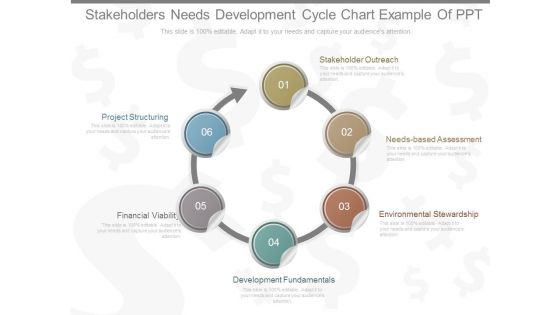
Stakeholders Needs Development Cycle Chart Example Of Ppt
This is a stakeholders needs development cycle chart example of ppt. This is a six stage process. The stages in this process are stakeholder outreach, needs based assessment, environmental stewardship,, development fundamentals, financial viability, project structuring.
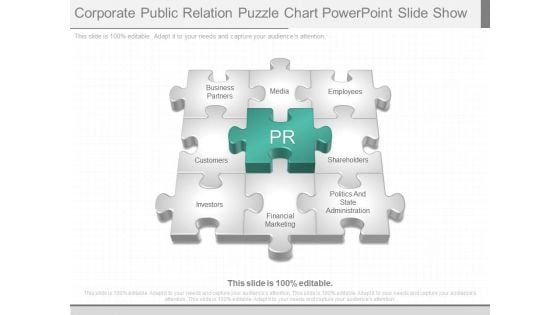
Corporate Public Relation Puzzle Chart Powerpoint Slide Show
This is a corporate public relation puzzle chart powerpoint slide show. This is a nine stage process. The stages in this process are business partners, media, employees, customers, shareholders, investors, financial marketing, politics and state administration, pr.
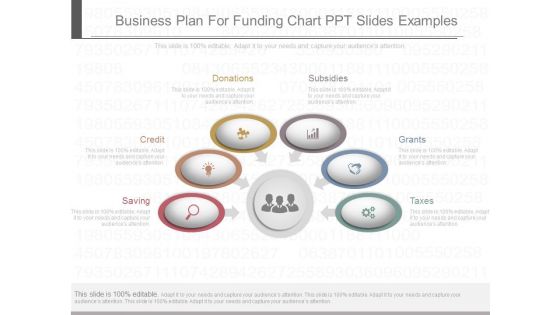
Business Plan For Funding Chart Ppt Slides Examples
This is a business plan for funding chart ppt slides examples. This is a five stage process. The stages in this process are saving, credit, donations, subsidies, grants, taxes.
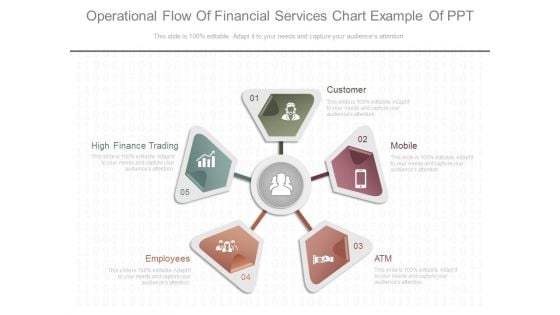
Operational Flow Of Financial Services Chart Example Of Ppt
This is a operational flow of financial services chart example of ppt. This is a five stage process. The stages in this process are customer, mobile, atm, employees, high finance trading.
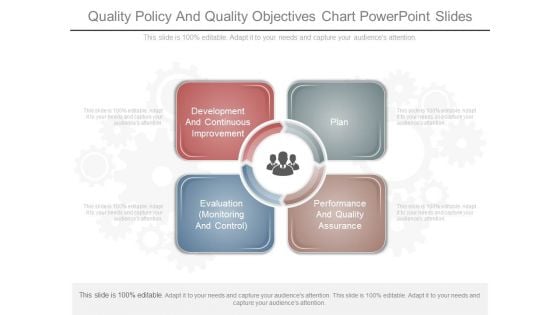
Quality Policy And Quality Objectives Chart Powerpoint Slides
This is a quality policy and quality objectives chart powerpoint slides. This is a four stage process. The stages in this process are development and continuous improvement, plan, evaluation monitoring and control, performance and quality assurance.
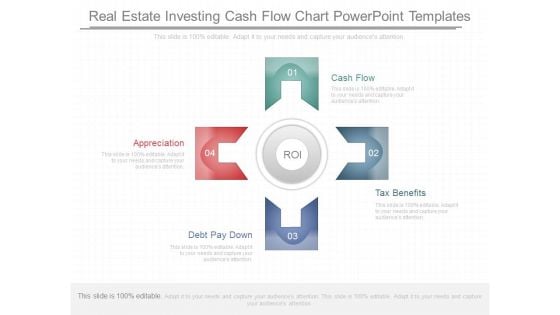
Real Estate Investing Cash Flow Chart Powerpoint Templates
This is a real estate investing cash flow chart powerpoint templates. This is a four stage process. The stages in this process are cash flow, tax benefits, debt pay down, appreciation.
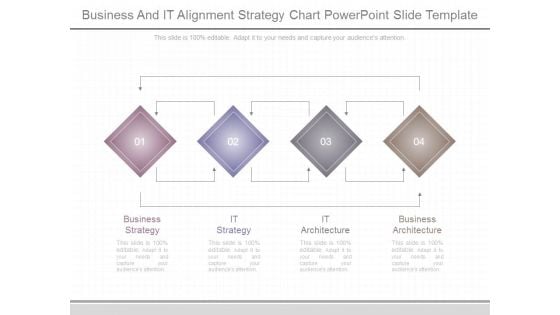
Business And It Alignment Strategy Chart Powerpoint Slide Template
This is a business and it alignment strategy chart powerpoint slide template. This is a four stage process. The stages in this process are business strategy, it strategy, it architecture, business architecture.
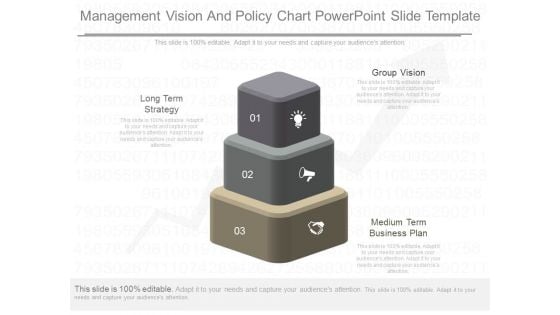
Management Vision And Policy Chart Powerpoint Slide Template
This is a management vision and policy chart powerpoint slide template. This is a three stage process. The stages in this process are long term strategy, group vision, medium term business plan.
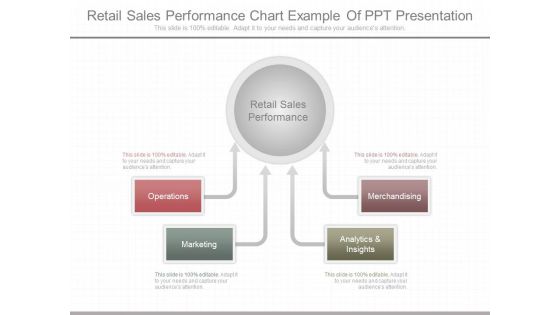
Retail Sales Performance Chart Example Of Ppt Presentation
This is a retail sales performance chart example of ppt presentation. This is a four stage process. The stages in this process are operations, marketing, analytics and insights, merchandising, retail sales performance.
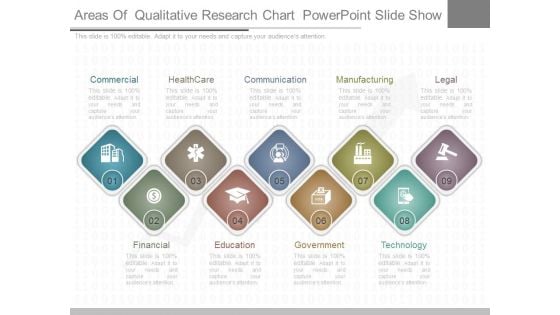
Areas Of Qualitative Research Chart Powerpoint Slide Show
This is a areas of qualitative research chart powerpoint slide show. This is a nine stage process. The stages in this process are commercial, healthcare, communication, manufacturing, legal, financial,, education, government, technology.

Competence Cycle For Business Excellence Chart Powerpoint Layout
This is a competence cycle for business excellence chart powerpoint layout. This is a four stage process. The stages in this process are confidence competence cycle, competence, comfort, control, confidence.
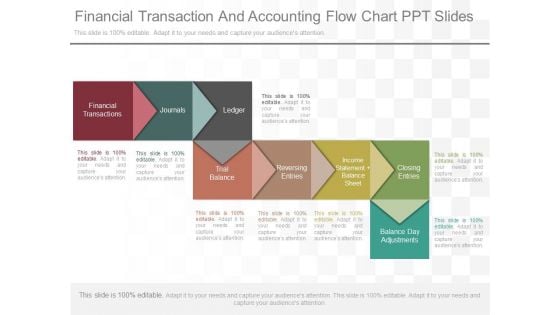
Financial Transaction And Accounting Flow Chart Ppt Slides
This is a financial transaction and accounting flow chart ppt slides. This is a eight stage process. The stages in this process are financial transactions, journals, ledger, trial balance, reversing entries, income statement balance sheet, closing entries, balance day adjustments.
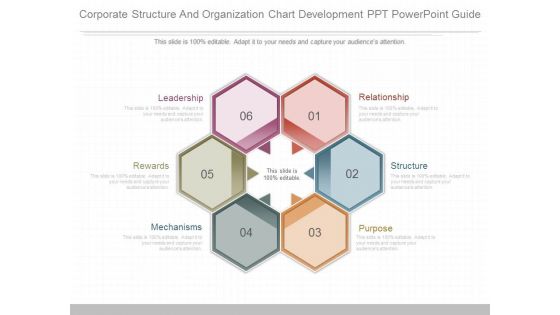
Corporate Structure And Organization Chart Development Ppt Powerpoint Guide
This is a corporate structure and organization chart development ppt powerpoint guide. This is a six stage process. The stages in this process are relationship, structure, purpose, mechanisms, rewards, leadership.
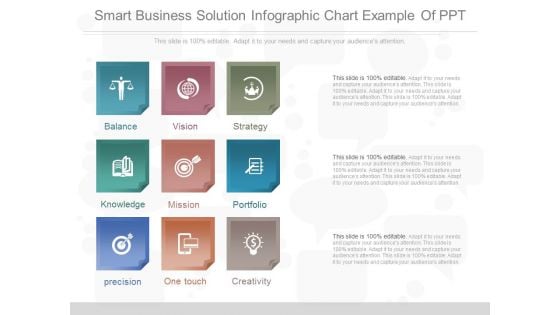
Smart Business Solution Infographic Chart Example Of Ppt
This is a smart business solution infographic chart example of ppt. This is a nine stage process. The stages in this process are balance, vision, strategy, knowledge, mission, portfolio, precision, one touch, creativity.
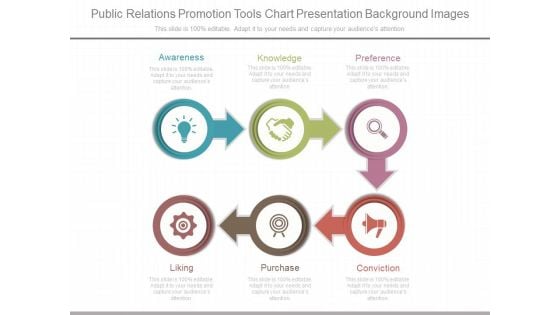
Public Relations Promotion Tools Chart Presentation Background Images
This is a public relations promotion tools chart presentation background images. This is a six stage process. The stages in this process are awareness, knowledge, preference, conviction, purchase, liking.
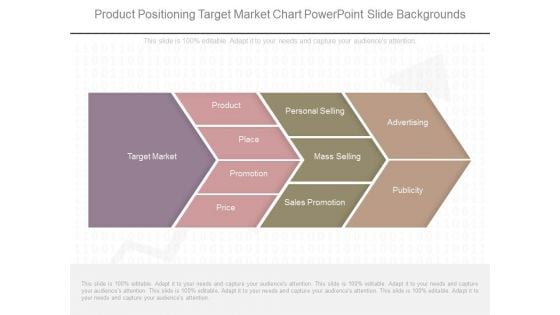
Product Positioning Target Market Chart Powerpoint Slide Backgrounds
This is a product positioning target market chart powerpoint slide backgrounds. This is a four stage process. The stages in this process are target market, product, place, promotion, price, personal selling, mass selling, sales promotion, advertising, publicity.
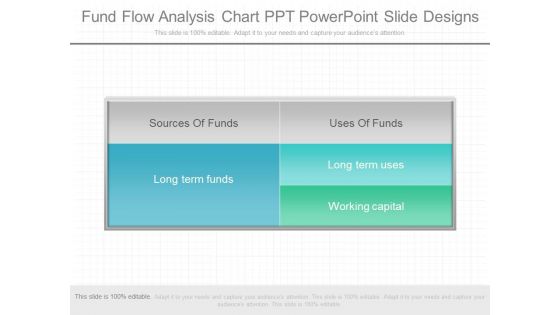
Fund Flow Analysis Chart Ppt Powerpoint Slide Designs
This is a fund flow analysis chart ppt powerpoint slide designs. This is a five stage process. The stages in this process are sources of funds, long term funds, uses of funds, long term uses, working capital.
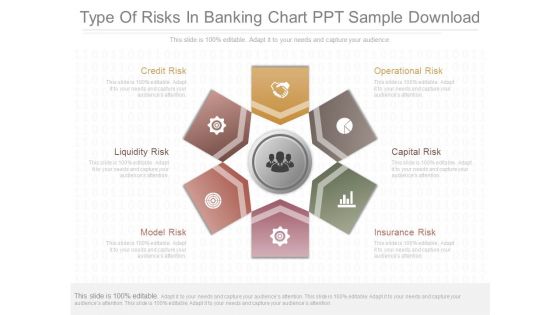
Type Of Risks In Banking Chart Ppt Sample Download
This is a type of risks in banking chart ppt sample download. This is a six stage process. The stages in this process are credit risk, liquidity risk, model risk, operational risk, capital risk, insurance risk.
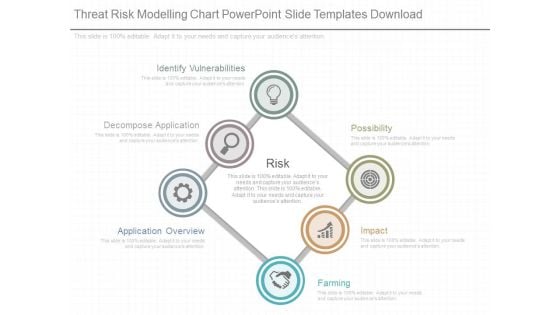
Threat Risk Modelling Chart Powerpoint Slide Templates Download
This is a threat risk modelling chart powerpoint slide templates download. This is a six stage process. The stages in this process are identify vulnerabilities, decompose application, application overview, possibility, impact, farming, risk.
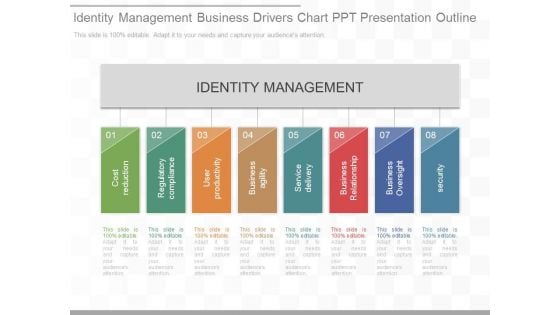
Identity Management Business Drivers Chart Ppt Presentation Outline
This is a identity management business drivers chart ppt presentation outline. This is a eight stage process. The stages in this process are identity management, cost reduction, regulatory compliance, user productivity, business agility, service delivery, business relationship, business oversight, security.
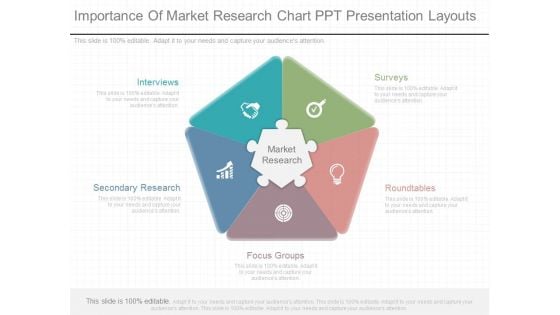
Importance Of Market Research Chart Ppt Presentation Layouts
This is a importance of market research chart ppt presentation layouts. This is a five stage process. The stages in this process are interviews, secondary research, market research, focus groups, surveys, roundtables.

Business Development Skills Business Development Skills Chart Slides
This is a business development skills business development skills chart slides. This is a eleven stage process. The stages in this process are entrepreneur, strategies, commercial, project, leadership, marketing, international, innovation, gestation, management, developer.
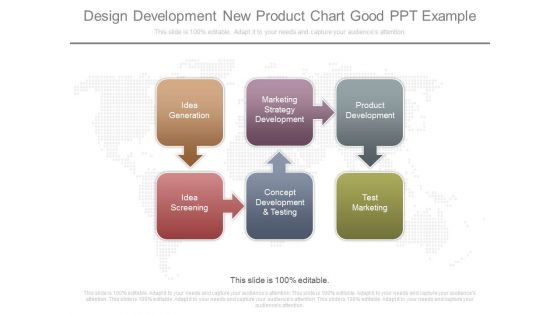
Design Development New Product Chart Good Ppt Example
This is a design development new product chart good ppt example. This is a six stage process. The stages in this process are idea generation, marketing strategy development, product development, idea screening, concept development and testing, test marketing.
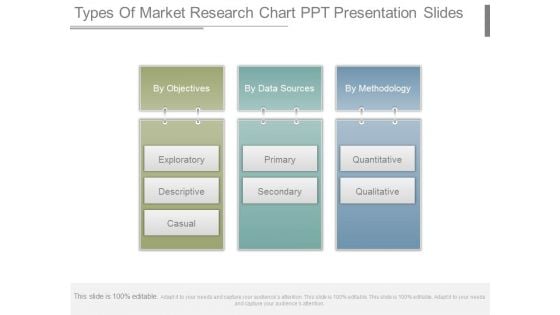
Types Of Market Research Chart Ppt Presentation Slides
This is a types of market research chart ppt presentation slides. This is a three stage process. The stages in this process are by objectives, exploratory, descriptive, causal, by data sources, primary, secondary, by methodology, quantitative, qualitative.
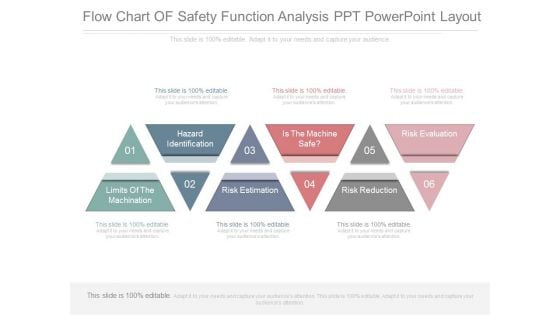
Flow Chart Of Safety Function Analysis Ppt Powerpoint Layout
This is a flow chart of safety function analysis ppt powerpoint layout. This is a six stage process. The stages in this process are hazard identification, limits of the machination, risk estimation, is the machine safe, risk reduction, risk evaluation.
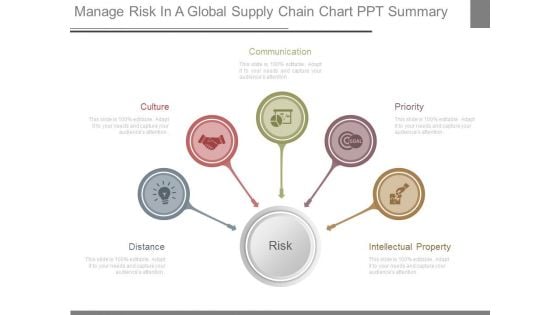
Manage Risk In A Global Supply Chain Chart Ppt Summary
This is a Manage Risk In A Global Supply Chain Chart Ppt Summary. This is a five stage process. The stages in this process are distance, culture, communication, priority, intellectual property, risk.
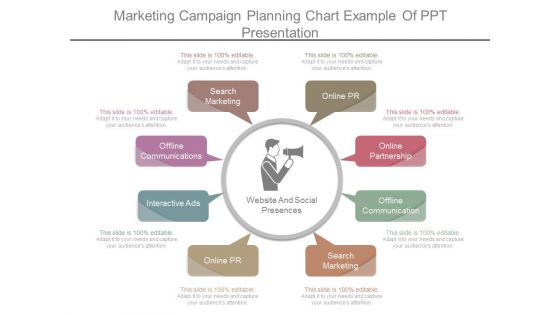
Marketing Campaign Planning Chart Example Of Ppt Presentation
This is a marketing campaign planning chart example of ppt presentation. This is a eight stage process. The stages in this process are search marketing, offline communications, interactive ads, online pr, online partnership, offline communication, search marketing.
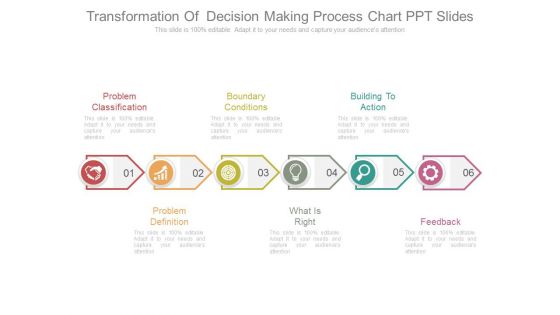
Transformation Of Decision Making Process Chart Ppt Slides
This is a transformation of decision making process chart ppt slides. This is a six stage process. The stages in this process are problem classification, boundary conditions, building to action, problem definition, what is right, feedback.
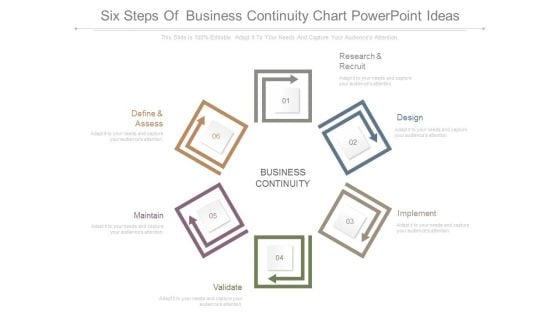
Six Steps Of Business Continuity Chart Powerpoint Ideas
This is a six steps of business continuity chart powerpoint ideas. This is a six stage process. The stages in this process are define and assess, research and recruit, design, implement, validate, maintain, business continuity.
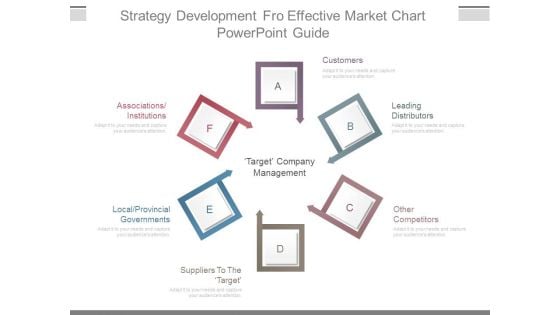
Strategy Development Fro Effective Market Chart Powerpoint Guide
This is a strategy development fro effective market chart powerpoint guide. This is a six stage process. The stages in this process are customers, leading distributors, other competitors, suppliers to the target, local provincial governments, associations institutions, target company management.
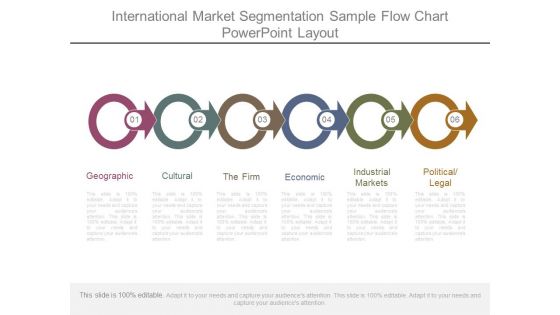
International Market Segmentation Sample Flow Chart Powerpoint Layout
This is a international market segmentation sample flow chart powerpoint layout. This is a six stage process. The stages in this process are geographic, cultural, the firm, economic, industrial markets, political legal.
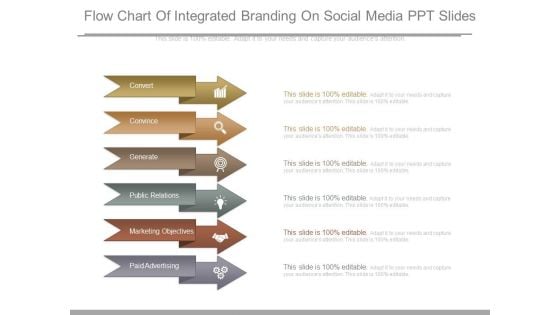
Flow Chart Of Integrated Branding On Social Media Ppt Slides
This is a flow chart of integrated branding on social media ppt slides. This is a six stage process. The stages in this process are convert, convince, generate, public relations, marketing objectives, paid advertising.
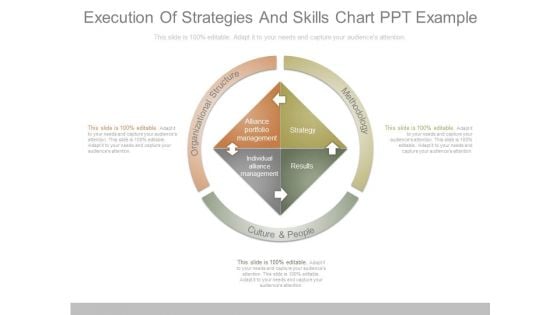
Execution Of Strategies And Skills Chart Ppt Example
This is a execution of strategies and skills chart ppt example. This is a three stage process. The stages in this process are methodology, culture and people, organizational structure, alliance portfolio management, strategy, individual alliance management, results.
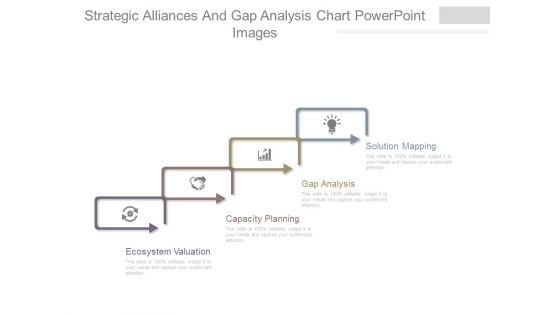
Strategic Alliances And Gap Analysis Chart Powerpoint Images
This is a strategic alliances and gap analysis chart powerpoint images. This is a four stage process. The stages in this process are solution mapping, gap analysis, capacity planning, ecosystem valuation.
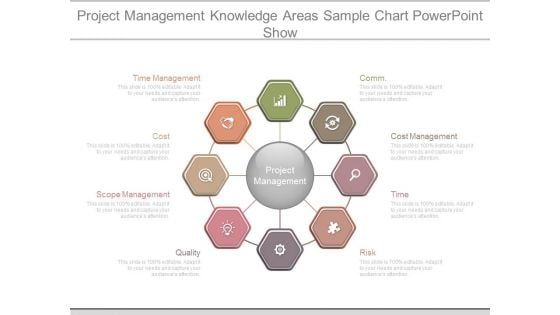
Project Management Knowledge Areas Sample Chart Powerpoint Show
This is a project management knowledge areas sample chart powerpoint show. This is a eight stage process. The stages in this process are comm, cost management, time, risk, quality, scope management, cost, time management, project management.
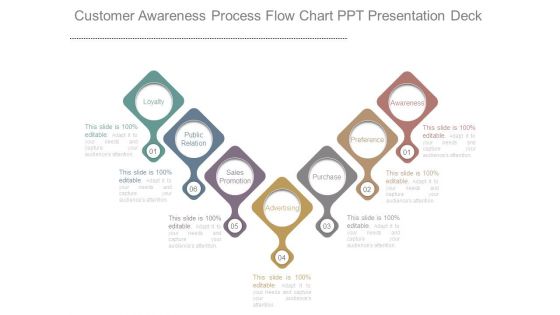
Customer Awareness Process Flow Chart Ppt Presentation Deck
This is a customer awareness process flow chart ppt presentation deck. This is a seven stage process. The stages in this process are loyalty, public relation, sales promotion, advertising, purchase, preference, awareness.
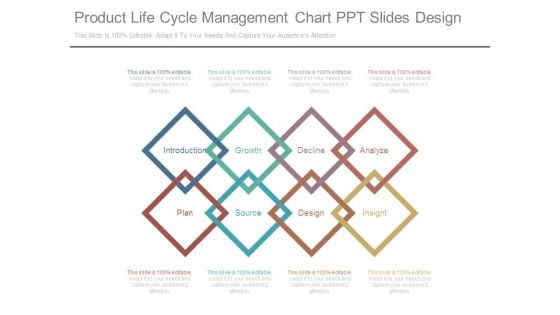
Product Life Cycle Management Chart Ppt Slides Design
This is a product life cycle management chart ppt slides design. This is a eight stage process. The stages in this process are introduction, growth, decline, analyze, plan, source, design, insight.
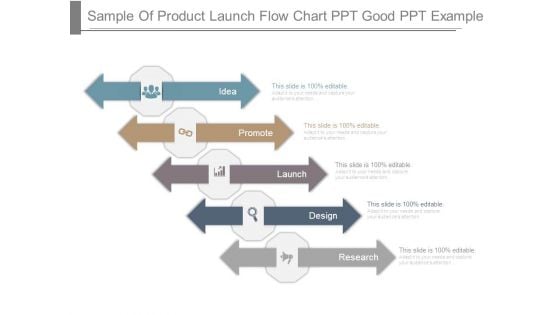
Sample Of Product Launch Flow Chart Ppt Good Ppt Example
This is a sample of product launch flow chart ppt good ppt example. This is a five stage process. The stages in this process are idea, promote, launch, design, research.
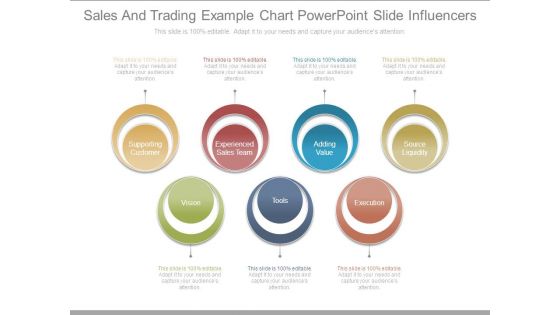
Sales And Trading Example Chart Powerpoint Slide Influencers
This is a sales and trading example chart powerpoint slide influencers. This is a seven stage process. The stages in this process are supporting customer, experienced sales team, adding value, source liquidity, vision, tools, execution.
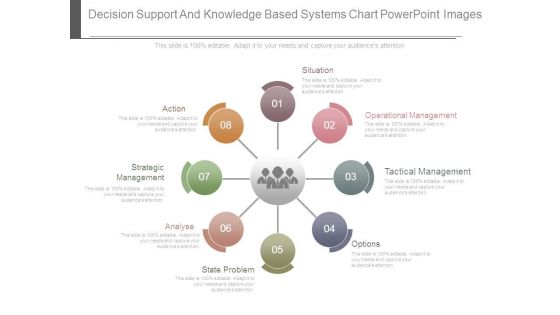
Decision Support And Knowledge Based Systems Chart Powerpoint Images
This is a decision support and knowledge based systems chart powerpoint images. This is a eight stage process. The stages in this process are situation, operational management, tactical management, options, state problem, analyse, strategic management, action.
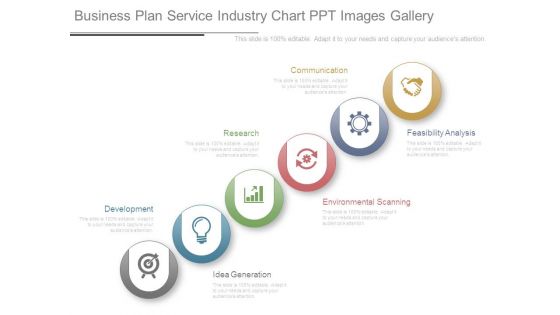
Business Plan Service Industry Chart Ppt Images Gallery
This is a business plan service industry chart ppt images gallery. This is a six stage process. The stages in this process are development, research, communication, idea generation, environmental scanning, feasibility analysis.
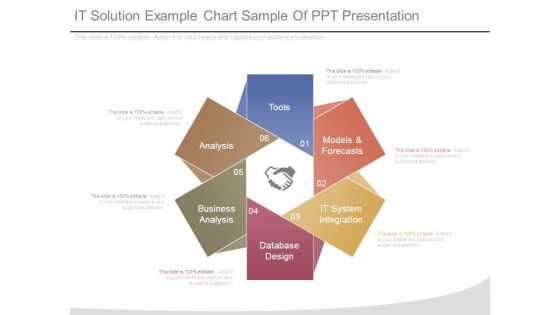
It Solution Example Chart Sample Of Ppt Presentation
This is a it solution example chart sample of ppt presentation. This is a six stage process. The stages in this process are tools, models and forecasts, it system integration, database design, business analysis, analysis.


 Continue with Email

 Home
Home


