key performance indicators
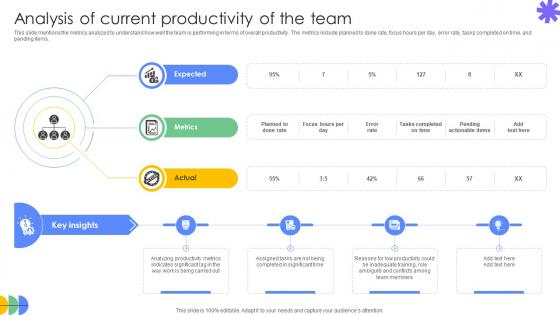
Driving Results Designing A Team Analysis Of Current Productivity Of The Team
This slide mentions the metrics analyzed to understand how well the team is performing in terms of overall productivity. The metrics include planned to done rate, focus hours per day, error rate, tasks completed on time, and pending items. Create an editable Driving Results Designing A Team Analysis Of Current Productivity Of The Team that communicates your idea and engages your audience. Whether you are presenting a business or an educational presentation, pre-designed presentation templates help save time. Driving Results Designing A Team Analysis Of Current Productivity Of The Team is highly customizable and very easy to edit, covering many different styles from creative to business presentations. Slidegeeks has creative team members who have crafted amazing templates. So, go and get them without any delay. This slide mentions the metrics analyzed to understand how well the team is performing in terms of overall productivity. The metrics include planned to done rate, focus hours per day, error rate, tasks completed on time, and pending items.
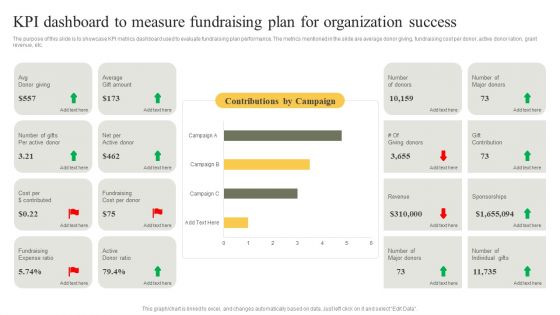
KPI Dashboard To Measure Fundraising Plan For Organization Success Infographics PDF
The purpose of this slide is to showcase KPI metrics dashboard used to evaluate fundraising plan performance. The metrics mentioned in the slide are average donor giving, fundraising cost per donor, active donor ration, grant revenue, etc. Showcasing this set of slides titled KPI Dashboard To Measure Fundraising Plan For Organization Success Infographics PDF. The topics addressed in these templates are Fundraising Cost, Average, Ratio. All the content presented in this PPT design is completely editable. Download it and make adjustments in color, background, font etc. as per your unique business setting.
KPI Dashboard For Tracking Customer Retention Elements PDF
This slide covers the dashboard for analyzing customer loyalty with metrics such as NPS, loyal customer rate, premium users, CLV, customer churn, revenue churn, net retention, MRR growth, etc. Presenting this PowerPoint presentation, titled KPI Dashboard For Tracking Customer Retention Elements PDF, with topics curated by our researchers after extensive research. This editable presentation is available for immediate download and provides attractive features when used. Download now and captivate your audience. Presenting this KPI Dashboard For Tracking Customer Retention Elements PDF. Our researchers have carefully researched and created these slides with all aspects taken into consideration. This is a completely customizable KPI Dashboard For Tracking Customer Retention Elements PDF that is available for immediate downloading. Download now and make an impact on your audience. Highlight the attractive features available with our PPTs.
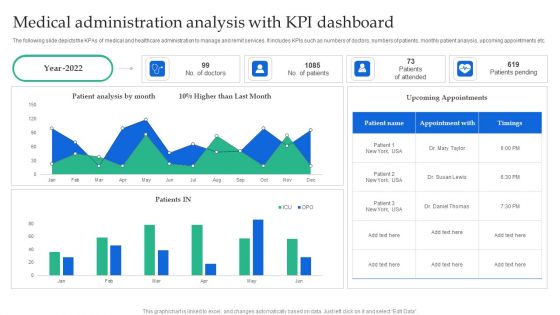
Medical Administration Analysis With KPI Dashboard Clipart PDF
The following slide depicts the KPAs of medical and healthcare administration to manage and remit services. It includes KPIs such as numbers of doctors, numbers of patients, monthly patient analysis, upcoming appointments etc. Showcasing this set of slides titled Medical Administration Analysis With KPI Dashboard Clipart PDF. The topics addressed in these templates are Patient Analysis, Higher Than, Upcoming Appointments. All the content presented in this PPT design is completely editable. Download it and make adjustments in color, background, font etc. as per your unique business setting.
Workforce Productivity Tracking Report Kpi Dashboard Icons PDF
The following slide presents the KPAs of project work stream for transparency and better decision making. It includes KPIs such as work stream status, priority check, planned vs actual budget etc. Showcasing this set of slides titled Workforce Productivity Tracking Report Kpi Dashboard Icons PDF. The topics addressed in these templates are Initiation Meeting, Resource Assessment, Technological Analysis. All the content presented in this PPT design is completely editable. Download it and make adjustments in color, background, font etc. as per your unique business setting.
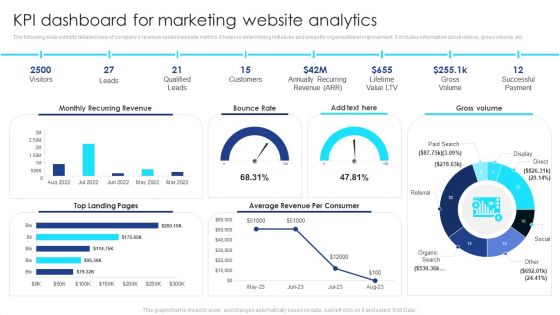
KPI Dashboard For Marketing Website Analytics Summary PDF
The following slide exhibits detailed view of companys revenue-related website metrics. It helps in determining initiatives and areas for organisational improvement. It includes information about visitors, gross volume, etc. Pitch your topic with ease and precision using this KPI Dashboard For Marketing Website Analytics Summary PDF. This layout presents information on Visitors, Leads, Qualified Leads, Customers, Gross Volume, Successful Payment. It is also available for immediate download and adjustment. So, changes can be made in the color, design, graphics or any other component to create a unique layout.
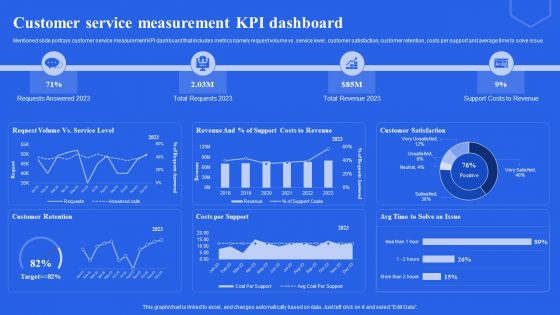
Customer Service Measurement KPI Dashboard Ppt File Portfolio PDF
Mentioned slide portrays customer service measurement KPI dashboard that includes metrics namely request volume vs. service level, customer satisfaction, customer retention, costs per support and average time to solve issue. Do you have to make sure that everyone on your team knows about any specific topic I yes, then you should give Customer Service Measurement KPI Dashboard Ppt File Portfolio PDF a try. Our experts have put a lot of knowledge and effort into creating this impeccable Customer Service Measurement KPI Dashboard Ppt File Portfolio PDF. You can use this template for your upcoming presentations, as the slides are perfect to represent even the tiniest detail. You can download these templates from the Slidegeeks website and these are easy to edit. So grab these today.
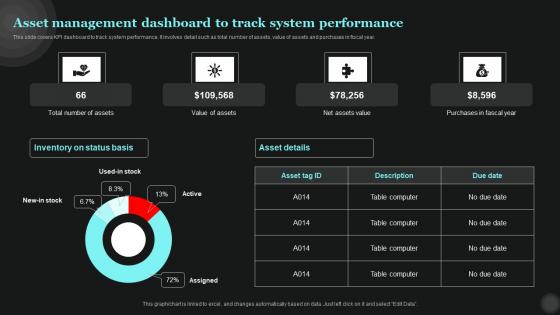
Asset Management Dashboard To Track Tech Asset Management Diagrams Pdf
This slide covers KPI dashboard to track system performance. It involves detail such as total number of assets, value of assets and purchases in fiscal year. Slidegeeks has constructed Asset Management Dashboard To Track Tech Asset Management Diagrams Pdf after conducting extensive research and examination. These presentation templates are constantly being generated and modified based on user preferences and critiques from editors. Here, you will find the most attractive templates for a range of purposes while taking into account ratings and remarks from users regarding the content. This is an excellent jumping-off point to explore our content and will give new users an insight into our top-notch PowerPoint Templates. This slide covers KPI dashboard to track system performance. It involves detail such as total number of assets, value of assets and purchases in fiscal year.
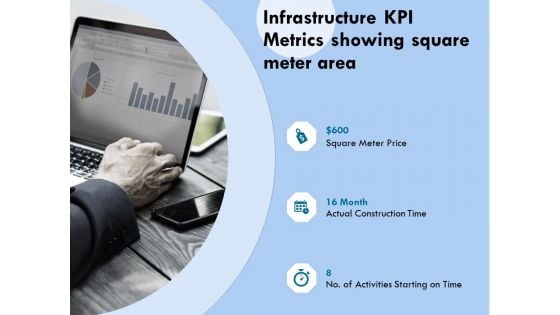
Functional Analysis Of Business Operations Infrastructure KPI Metrics Showing Square Meter Area Mockup PDF
Presenting this set of slides with name functional analysis of business operations infrastructure kpi metrics showing square meter area mockup pdf. This is a three stage process. The stages in this process are square meter price, construction time, activities starting. This is a completely editable PowerPoint presentation and is available for immediate download. Download now and impress your audience.
KPI Dashboard To Monitor Project Status Real Estate Project Funding Icons PDF
Following slide illustrates KPI dashboard for monitoring the project performance. Kips covered in the dashboard are project progress and task status, project health and project timeline.Deliver and pitch your topic in the best possible manner with this KPI Dashboard To Monitor Project Status Real Estate Project Funding Icons PDF. Use them to share invaluable insights on Project Management, Dashboard, Project Progress and impress your audience. This template can be altered and modified as per your expectations. So, grab it now.
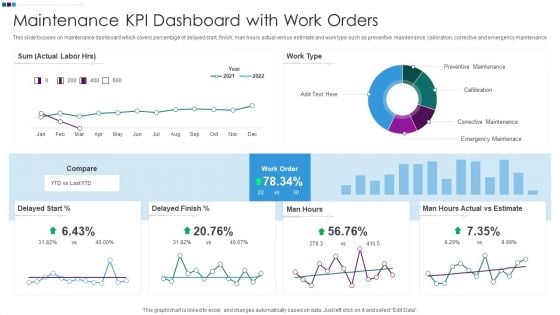
Maintenance KPI Dashboard With Work Orders Ppt Gallery Model PDF
This slide focuses on maintenance dashboard which covers percentage of delayed start, finish, man hours actual versus estimate and work type such as preventive maintenance, calibration, corrective and emergency maintenance. Showcasing this set of slides titled Maintenance KPI Dashboard With Work Orders Ppt Gallery Model PDF. The topics addressed in these templates are Preventive Maintenance Callibration, Man Hours Actual, Delayed Finish Percent. All the content presented in this PPT design is completely editable. Download it and make adjustments in color, background, font etc. as per your unique business setting.
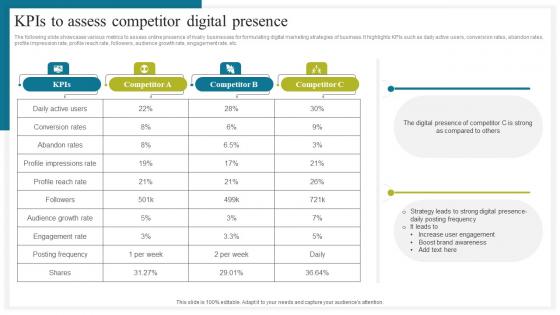
KPIs To Assess Competitor Digital How To Conduct Competitive Assessment Summary Pdf
The following slide showcases various metrics to assess online presence of rivalry businesses for formulating digital marketing strategies of business. It highlights KPIs such as daily active users, conversion rates, abandon rates, profile impression rate, profile reach rate, followers, audience growth rate, engagement rate, etc. Boost your pitch with our creative KPIs To Assess Competitor Digital How To Conduct Competitive Assessment Summary Pdf. Deliver an awe inspiring pitch that will mesmerize everyone. Using these presentation templates you will surely catch everyones attention. You can browse the ppts collection on our website. We have researchers who are experts at creating the right content for the templates. So you do not have to invest time in any additional work. Just grab the template now and use them. The following slide showcases various metrics to assess online presence of rivalry businesses for formulating digital marketing strategies of business. It highlights KPIs such as daily active users, conversion rates, abandon rates, profile impression rate, profile reach rate, followers, audience growth rate, engagement rate, etc.
Dashboard For Tracking Sales Team Sales Techniques For Achieving Guidelines Pdf
This slide covers the KPI dashboard for tracking sales rep performance. It includes metrics such as sales, target, percent of target, sales, and target for each salesperson. Find highly impressive Dashboard For Tracking Sales Team Sales Techniques For Achieving Guidelines Pdfon Slidegeeks to deliver a meaningful presentation. You can save an ample amount of time using these presentation templates. No need to worry to prepare everything from scratch because Slidegeeks experts have already done a huge research and work for you. You need to download Dashboard For Tracking Sales Team Sales Techniques For Achieving Guidelines Pdf for your upcoming presentation. All the presentation templates are 100 percent editable and you can change the color and personalize the content accordingly. Download now This slide covers the KPI dashboard for tracking sales rep performance. It includes metrics such as sales, target, percent of target, sales, and target for each salesperson.
Asset Management Dashboard Maximizing Efficiency With Asset Tracking Solutions Clipart Pdf
This slide covers KPI dashboard to track system performance. It involves detail such as total number of assets, value of assets and purchases in fiscal year. Slidegeeks is one of the best resources for PowerPoint templates. You can download easily and regulate Asset Management Dashboard Maximizing Efficiency With Asset Tracking Solutions Clipart Pdf for your personal presentations from our wonderful collection. A few clicks is all it takes to discover and get the most relevant and appropriate templates. Use our Templates to add a unique zing and appeal to your presentation and meetings. All the slides are easy to edit and you can use them even for advertisement purposes. This slide covers KPI dashboard to track system performance. It involves detail such as total number of assets, value of assets and purchases in fiscal year.
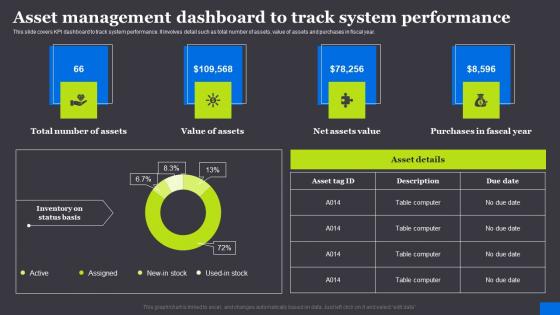
Asset Management Dashboard To Track RFID Solutions For Asset Traceability Mockup Pdf
This slide covers KPI dashboard to track system performance. It involves detail such as total number of assets, value of assets and purchases in fiscal year. Slidegeeks is one of the best resources for PowerPoint templates. You can download easily and regulate Asset Management Dashboard To Track RFID Solutions For Asset Traceability Mockup Pdf for your personal presentations from our wonderful collection. A few clicks is all it takes to discover and get the most relevant and appropriate templates. Use our Templates to add a unique zing and appeal to your presentation and meetings. All the slides are easy to edit and you can use them even for advertisement purposes. This slide covers KPI dashboard to track system performance. It involves detail such as total number of assets, value of assets and purchases in fiscal year.
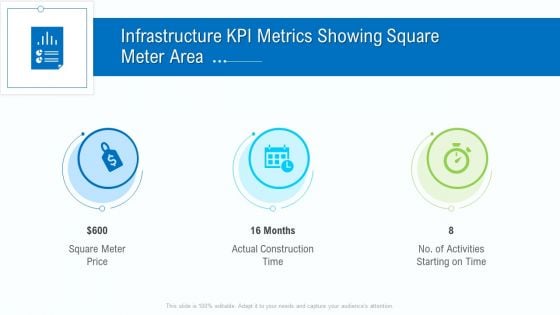
Business Activities Assessment Examples Infrastructure KPI Metrics Showing Square Meter Area Elements PDF
Presenting business activities assessment examples infrastructure kpi metrics showing square meter area elements pdf to provide visual cues and insights. Share and navigate important information on three stages that need your due attention. This template can be used to pitch topics like square meter price, actual construction time, activities starting on time. In addtion, this PPT design contains high resolution images, graphics, etc, that are easily editable and available for immediate download.
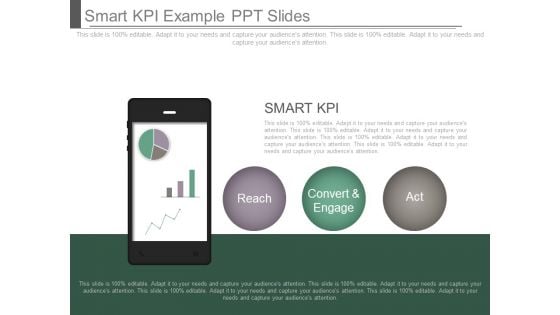
Smart Kpi Example Ppt Slides

Engineering Kpi Examples Ppt Slides
This is an engineering kpi examples ppt slides. This is a four stage process. The stages in this process are strategize, innovate, measure, propagate.
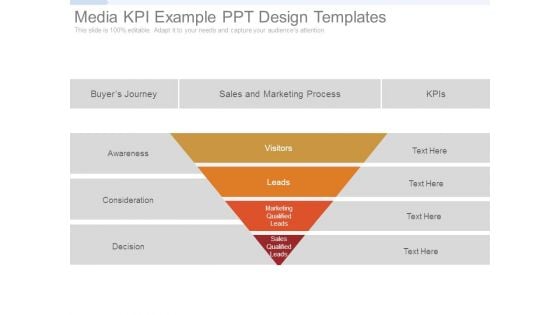
Media Kpi Example Ppt Design Templates
This is a media kpi example ppt design templates. This is a four stage process. The stages in this process are awareness, consideration, decision, visitors, leads, buyer journey, sales and marketing process, kpis, marketing qualified leads, sales qualified leads.
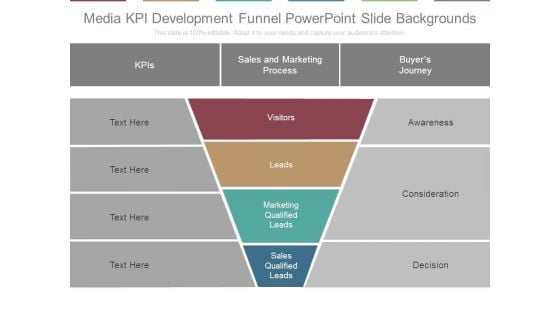
Media Kpi Development Funnel Powerpoint Slide Backgrounds
This is a media kpi development funnel powerpoint slide backgrounds. This is a four stage process. The stages in this process are kpis, sales and marketing process, buyers journey, awareness, consideration, decision, visitors, leads, marketing qualified leads, sales qualified leads.
Kpi Dashboard To Analyze Customer Satisfaction Ppt Icon Graphics PDF
The following slide outlines a comprehensive visual representation of customer satisfaction CSAT that can assist companies to measure how happy are customers wit the brand. The KPIs covered are net promoter score NPS, customer effort score CES, product quality, pricing, etc. Get a simple yet stunning designed Kpi Dashboard To Analyze Customer Satisfaction Ppt Icon Graphics PDF. It is the best one to establish the tone in your meetings. It is an excellent way to make your presentations highly effective. So, download this PPT today from Slidegeeks and see the positive impacts. Our easy to edit Kpi Dashboard To Analyze Customer Satisfaction Ppt Icon Graphics PDF can be your go to option for all upcoming conferences and meetings. So, what are you waiting for Grab this template today.
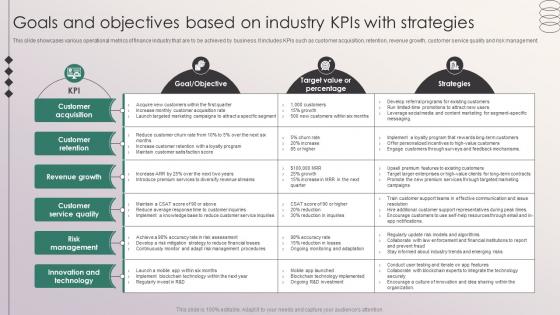
Goals And Objectives Based On Industry KPIs With Strategies Penetrating Markets With Financial Strategy SS V
This slide showcases various operational metrics of finance industry that are to be achieved by business. It includes KPIs such as customer acquisition, retention, revenue growth, customer service quality and risk management. Are you in need of a template that can accommodate all of your creative concepts This one is crafted professionally and can be altered to fit any style. Use it with Google Slides or PowerPoint. Include striking photographs, symbols, depictions, and other visuals. Fill, move around, or remove text boxes as desired. Test out color palettes and font mixtures. Edit and save your work, or work with colleagues. Download Goals And Objectives Based On Industry KPIs With Strategies Penetrating Markets With Financial Strategy SS V and observe how to make your presentation outstanding. Give an impeccable presentation to your group and make your presentation unforgettable. This slide showcases various operational metrics of finance industry that are to be achieved by business. It includes KPIs such as customer acquisition, retention, revenue growth, customer service quality and risk management.

Sales Optimization Best Practices To Close More Deals Sales KPI Dashboard Accumulated Topics PDF
The sales dashboard is an effective tool that helps in monitoring various sales KPIs in order to aid sales teams in reaching sales goals by analyzing the sales performance. Deliver and pitch your topic in the best possible manner with this sales optimization best practices to close more deals sales kpi dashboard accumulated topics pdf. Use them to share invaluable insights on incremental sales, sales revenue, cost breakdown, accumulated revenue and impress your audience. This template can be altered and modified as per your expectations. So, grab it now.
Sales Department Strategies Increase Revenues Sales KPI Dashboard Ppt Icon Visual Aids PDF
The sales dashboard is an effective tool that helps in monitoring various sales KPIs in order to aid sales teams in reaching sales goals by analyzing the sales performance. Deliver and pitch your topic in the best possible manner with this sales department strategies increase revenues sales kpi dashboard ppt icon visual aids pdf. Use them to share invaluable insights on average revenue, customer lifetime value, customer acquisition cost and impress your audience. This template can be altered and modified as per your expectations. So, grab it now.
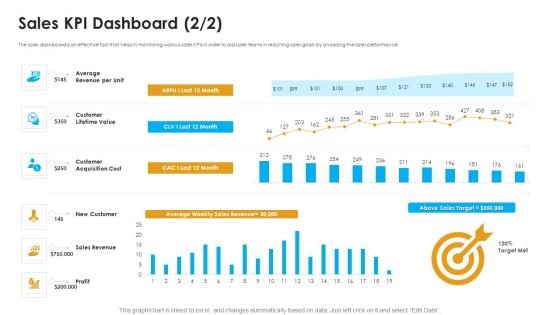
Sales Assistance Boost Overall Efficiency Sales KPI Dashboard New Topics PDF
The sales dashboard is an effective tool that helps in monitoring various sales KPIs in order to aid sales teams in reaching sales goals by analyzing the sales performance. Deliver and pitch your topic in the best possible manner with this sales assistance boost overall efficiency sales kpi dashboard new topics pdf. Use them to share invaluable insights on customer acquisition cost, customer lifetime value, average revenue and impress your audience. This template can be altered and modified as per your expectations. So, grab it now.
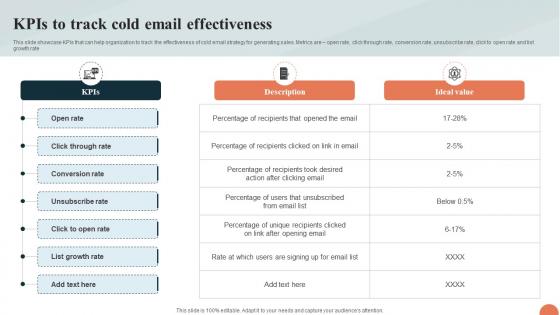
Telesales Strategy For Targeting Kpis To Track Cold Email Effectiveness Strategy SS V
This slide showcase KPIs that can help organization to track the effectiveness of cold email strategy for generating sales. Metrics are open rate, click through rate, conversion rate, unsubscribe rate, click to open rate and list growth rate. Welcome to our selection of the Telesales Strategy For Targeting Kpis To Track Cold Email Effectiveness Strategy SS V. These are designed to help you showcase your creativity and bring your sphere to life. Planning and Innovation are essential for any business that is just starting out. This collection contains the designs that you need for your everyday presentations. All of our PowerPoints are 100Percent editable, so you can customize them to suit your needs. This multi-purpose template can be used in various situations. Grab these presentation templates today. This slide showcase KPIs that can help organization to track the effectiveness of cold email strategy for generating sales. Metrics are open rate, click through rate, conversion rate, unsubscribe rate, click to open rate and list growth rate
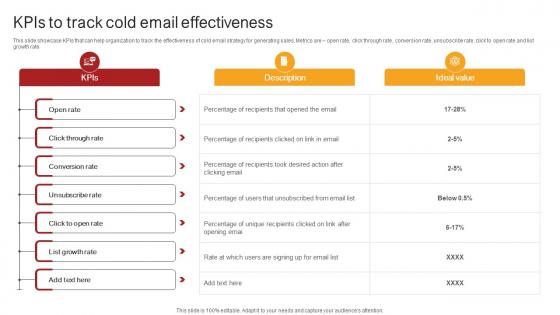
Remote Sales Plan For Kpis To Track Cold Email Effectiveness Strategy SS V
This slide showcase KPIs that can help organization to track the effectiveness of cold email strategy for generating sales. Metrics are open rate, click through rate, conversion rate, unsubscribe rate, click to open rate and list growth rate. Welcome to our selection of the Remote Sales Plan For Kpis To Track Cold Email Effectiveness Strategy SS V. These are designed to help you showcase your creativity and bring your sphere to life. Planning and Innovation are essential for any business that is just starting out. This collection contains the designs that you need for your everyday presentations. All of our PowerPoints are 100Percent editable, so you can customize them to suit your needs. This multi-purpose template can be used in various situations. Grab these presentation templates today. This slide showcase KPIs that can help organization to track the effectiveness of cold email strategy for generating sales. Metrics are open rate, click through rate, conversion rate, unsubscribe rate, click to open rate and list growth rate.
Primary And Secondary Shipping Tracking Metrics Profile Rules PDF
This slide covers the KPI profile for defining measures to evaluate KPI performance. It also includes the details for enlisted KPIs such as ID, name, value, unit and rating. Showcasing this set of slides titled Primary And Secondary Shipping Tracking Metrics Profile Rules PDF. The topics addressed in these templates are Secondary, Primary, Metrics Profile. All the content presented in this PPT design is completely editable. Download it and make adjustments in color, background, font etc. as per your unique business setting.
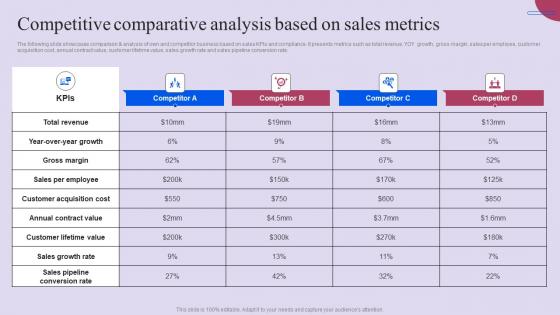
Competitive Comparative Analysis Based On Sales Metrics Ppt File Designs Pdf
The following slide showcases comparison and analysis of own and competitor business based on sales KPIs and compliance. It presents metrics such as total revenue, YOY growth, gross margin, sales per employee, customer acquisition cost, annual contract value, customer lifetime value, sales growth rate and sales pipeline conversion rate. There are so many reasons you need a Competitive Comparative Analysis Based On Sales Metrics Ppt File Designs Pdf. The first reason is you can not spend time making everything from scratch, Thus, Slidegeeks has made presentation templates for you too. You can easily download these templates from our website easily. The following slide showcases comparison and analysis of own and competitor business based on sales KPIs and compliance. It presents metrics such as total revenue, YOY growth, gross margin, sales per employee, customer acquisition cost, annual contract value, customer lifetime value, sales growth rate and sales pipeline conversion rate.
Marketing Business Operational Excellence Plan KPI Dashboard Ppt Icon Design Ideas PDF
This slide shows marketing KPIs dashboard for operational excellence strategy of an organization. It includes metrics such as total spending, total clicks, cost per acquisition, and campaigns. Showcasing this set of slides titled Marketing Business Operational Excellence Plan KPI Dashboard Ppt Icon Design Ideas PDF. The topics addressed in these templates are Daily Impressions, Acquisitions Campaign. All the content presented in this PPT design is completely editable. Download it and make adjustments in color, background, font etc. as per your unique business setting.
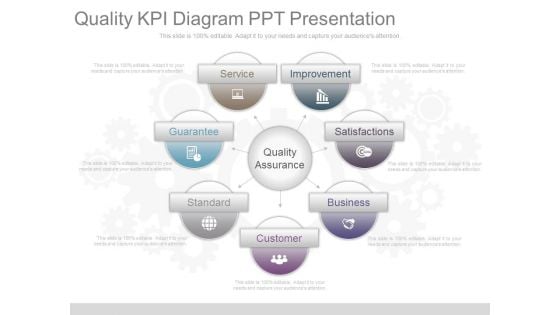
Quality Kpi Diagram Ppt Presentation
This is a quality kpi diagram ppt presentation. This is a seven stage process. The stages in this process are improvement, satisfactions, business, customer, standard, guarantee, service, quality assurance.
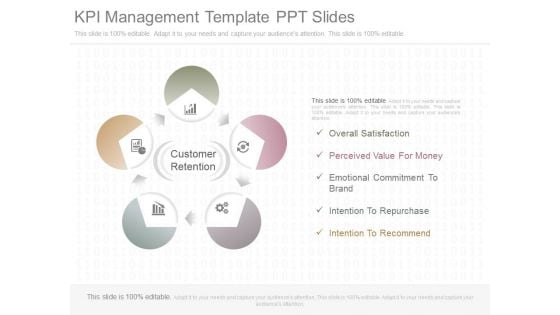
Kpi Management Template Ppt Slides
This is a kpi management template ppt slides. This is a five stage process. The stages in this process are overall satisfaction, perceived value for money, emotional commitment to brand, intention to repurchase, intention to recommend, customer retention.
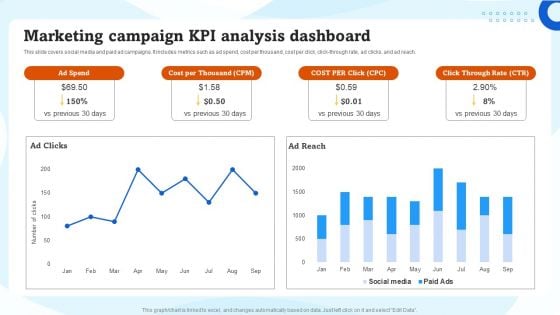
Marketing Campaign KPI Analysis Dashboard Ppt Inspiration Example File PDF
This slide covers social media and paid ad campaigns. It includes metrics such as ad spend, cost per thousand, cost per click, click-through rate, ad clicks, and ad reach. Coming up with a presentation necessitates that the majority of the effort goes into the content and the message you intend to convey. The visuals of a PowerPoint presentation can only be effective if it supplements and supports the story that is being told. Keeping this in mind our experts created Marketing Campaign KPI Analysis Dashboard Ppt Inspiration Example File PDF to reduce the time that goes into designing the presentation. This way, you can concentrate on the message while our designers take care of providing you with the right template for the situation.
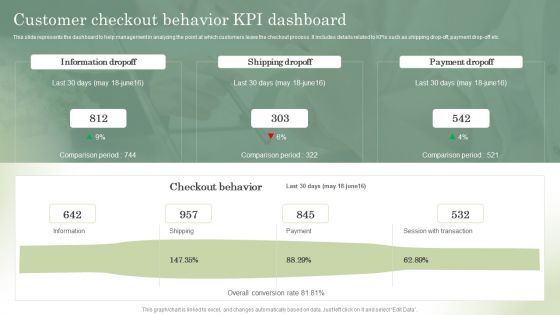
Optimizing Online Stores Customer Checkout Behavior KPI Dashboard Brochure PDF
This slide represents the dashboard to help management in analyzing the point at which customers leave the checkout process. It includes details related to KPIs such as shipping drop-off, payment drop-off etc. Slidegeeks is here to make your presentations a breeze with Optimizing Online Stores Customer Checkout Behavior KPI Dashboard Brochure PDF With our easy-to-use and customizable templates, you can focus on delivering your ideas rather than worrying about formatting. With a variety of designs to choose from, youre sure to find one that suits your needs. And with animations and unique photos, illustrations, and fonts, you can make your presentation pop. So whether youre giving a sales pitch or presenting to the board, make sure to check out Slidegeeks first.
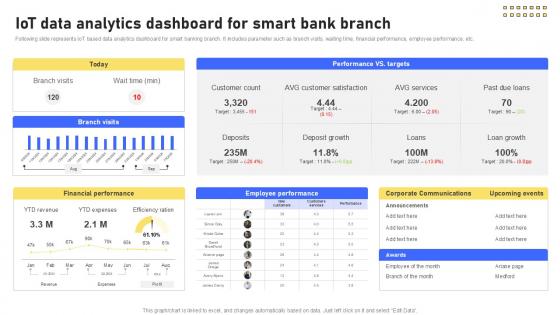
IoT Data Analytics Dashboard For Banking Future With IoT Ppt Powerpoint IoT SS V
Following slide represents IoT based data analytics dashboard for smart banking branch. It includes parameter such as branch visits, waiting time, financial performance, employee performance, etc. Slidegeeks is here to make your presentations a breeze with IoT Data Analytics Dashboard For Banking Future With IoT Ppt Powerpoint IoT SS V With our easy-to-use and customizable templates, you can focus on delivering your ideas rather than worrying about formatting. With a variety of designs to choose from, you are sure to find one that suits your needs. And with animations and unique photos, illustrations, and fonts, you can make your presentation pop. So whether you are giving a sales pitch or presenting to the board, make sure to check out Slidegeeks first Following slide represents IoT based data analytics dashboard for smart banking branch. It includes parameter such as branch visits, waiting time, financial performance, employee performance, etc.
Google Keyword Assessment KPI Dashboard For Tracking Improvement In Website Traffic Infographics PDF
Following slide demonstrates keyword analysis dashboard which can be used by business to track website traffic performance. It includes metrics such as average keyword position, keyword ranking distribution, keyword ranking, keyword in top 3, top 10, top 20 and top 100. Showcasing this set of slides titled Google Keyword Assessment KPI Dashboard For Tracking Improvement In Website Traffic Infographics PDF. The topics addressed in these templates are Keyword Ranking, Keyword Ranking Distribution, Average Keyword Position. All the content presented in this PPT design is completely editable. Download it and make adjustments in color, background, font etc. as per your unique business setting.
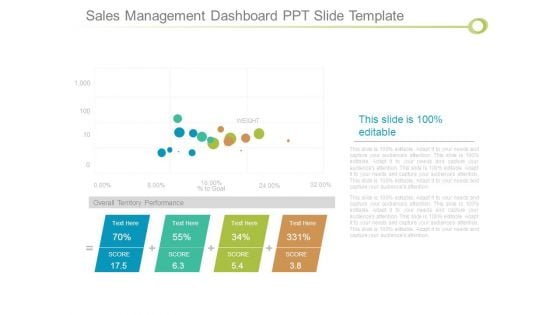
Sales Management Dashboard Ppt Slide Template
This is a sales management dashboard ppt slide template. This is a four stage process. The stages in this process are weight, goal, overall territory performance, score.
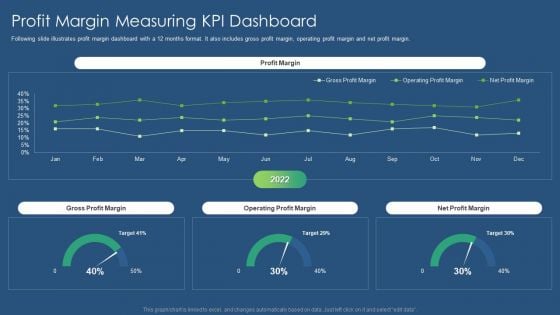
Sustainability Calculation With KPI Profit Margin Measuring Kpi Dashboard Inspiration PDF Topics PDF
Following slide illustrates profit margin dashboard with a 12 months format. It also includes gross profit margin, operating profit margin and net profit margin. Deliver and pitch your topic in the best possible manner with this sustainability calculation with kpi profit margin measuring kpi dashboard inspiration pdf. Use them to share invaluable insights on net profit margin, operating profit margin, gross profit margin and impress your audience. This template can be altered and modified as per your expectations. So, grab it now.
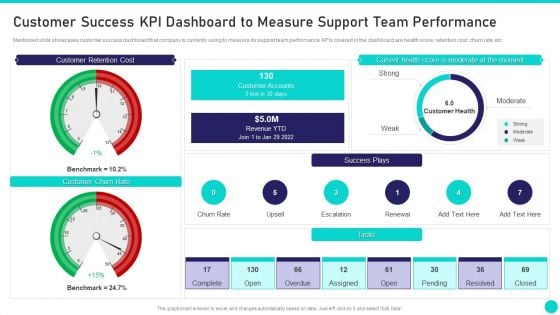
Client Achievements Playbook Customer Success KPI Dashboard To Measure Support Brochure PDF
Mentioned slide showcases customer success dashboard that company is currently using to measure its support team performance. KPIs covered in the dashboard are health score, retention cost, churn rate etc. Deliver an awe inspiring pitch with this creative client achievements playbook customer success kpi dashboard to measure support brochure pdf bundle. Topics like customer retention cost, current health score, customer churn rate, customer accounts, customer health can be discussed with this completely editable template. It is available for immediate download depending on the needs and requirements of the user.
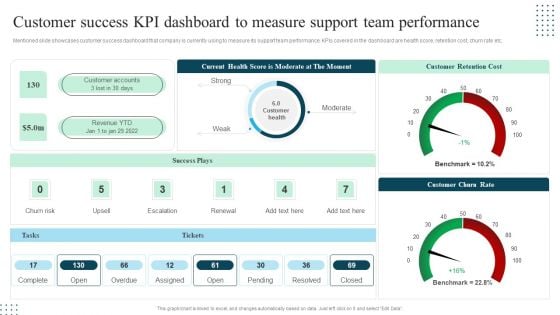
Client Success Playbook Customer Success KPI Dashboard To Measure Support Team Background PDF
Mentioned slide showcases customer success dashboard that company is currently using to measure its support team performance. KPIs covered in the dashboard are health score, retention cost, churn rate etc. Deliver an awe inspiring pitch with this creative Client Success Playbook Customer Success KPI Dashboard To Measure Support Team Background PDF bundle. Topics like Customer Retention Cost, Customer Churn Rate, Success Plays can be discussed with this completely editable template. It is available for immediate download depending on the needs and requirements of the user.
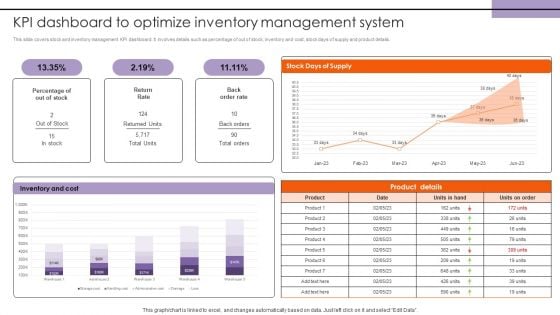
KPI Dashboard To Optimize Inventory Management System Structure PDF
This slide covers stock and inventory management KPI dashboard. It involves details such as percentage of out of stock, inventory and cost, stock days of supply and product details. This KPI Dashboard To Optimize Inventory Management System Structure PDF from Slidegeeks makes it easy to present information on your topic with precision. It provides customization options, so you can make changes to the colors, design, graphics, or any other component to create a unique layout. It is also available for immediate download, so you can begin using it right away. Slidegeeks has done good research to ensure that you have everything you need to make your presentation stand out. Make a name out there for a brilliant performance.

KPI Dashboard To Assess Training Program Effectiveness Background PDF
This slide covers KPI dashboard to assess training program effectiveness. It involves details such as overall responses on monthly basis, employee satisfaction rate, net promoter score and major training courses. This KPI Dashboard To Assess Training Program Effectiveness Background PDF from Slidegeeks makes it easy to present information on your topic with precision. It provides customization options, so you can make changes to the colors, design, graphics, or any other component to create a unique layout. It is also available for immediate download, so you can begin using it right away. Slidegeeks has done good research to ensure that you have everything you need to make your presentation stand out. Make a name out there for a brilliant performance.
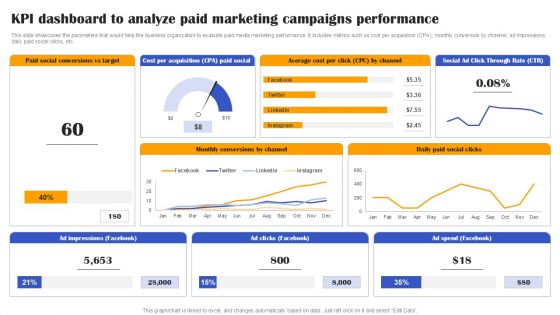
Execution Of Effective Paid Media Advertising Strategies Kpi Dashboard To Analyze Paid Marketing Campaigns Formats PDF
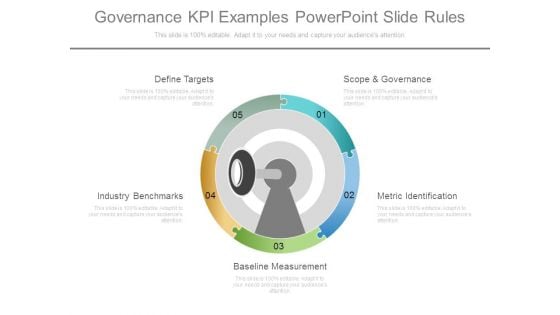
Governance Kpi Examples Powerpoint Slide Rules
This is a governance kpi examples powerpoint slide rules. This is a five stage process. The stages in this process are define targets, scope and governance, industry benchmarks, metric identification, baseline measurement.
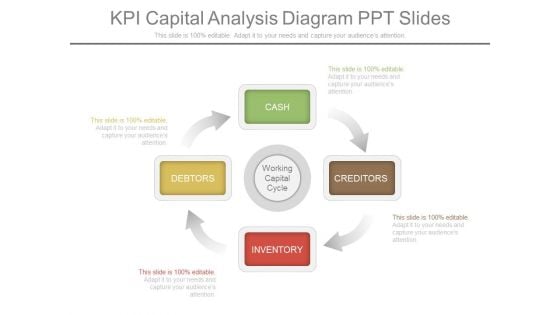
Kpi Capital Analysis Diagram Ppt Slides
This is a kpi capital dashboard ppt slides. This is a four stage process. The stages in this process are cash, creditors, inventory, debtors.
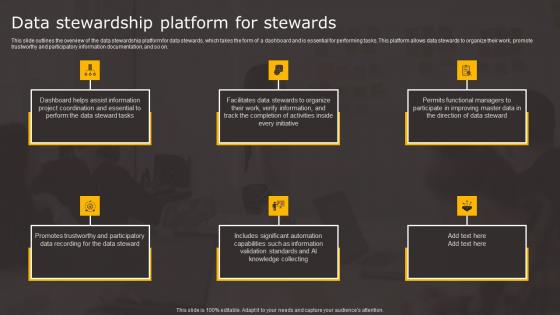
Data Stewardship Platform For Stewards Data Stewardship In Business Processes Professional Pdf
This slide outlines the overview of the data stewardship platform for data stewards, which takes the form of a dashboard and is essential for performing tasks. This platform allows data stewards to organize their work, promote trustworthy and participatory information documentation, and so on. Slidegeeks has constructed Data Stewardship Platform For Stewards Data Stewardship In Business Processes Professional Pdf after conducting extensive research and examination. These presentation templates are constantly being generated and modified based on user preferences and critiques from editors. Here, you will find the most attractive templates for a range of purposes while taking into account ratings and remarks from users regarding the content. This is an excellent jumping off point to explore our content and will give new users an insight into our top notch PowerPoint Templates. This slide outlines the overview of the data stewardship platform for data stewards, which takes the form of a dashboard and is essential for performing tasks. This platform allows data stewards to organize their work, promote trustworthy and participatory information documentation, and so on.
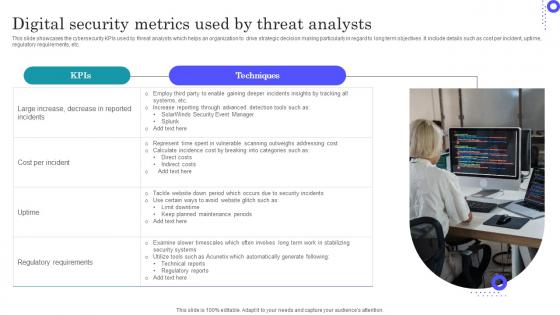
Digital Security Metrics Used By Threat Analysts Graphics Pdf
Showcasing this set of slides titled Digital Security Metrics Used By Threat Analysts Graphics Pdf The topics addressed in these templates are Regulatory Requirements, Large Increase, Scanning Outweighs All the content presented in this PPT design is completely editable. Download it and make adjustments in color, background, font etc. as per your unique business setting. This slide showcases the cybersecurity KPIs used by threat analysts which helps an organization to drive strategic decision making particularly in regard to long term objectives. It include details such as cost per incident, uptime, regulatory requirements, etc.
Data Stewardship Platform For Stewards Data Custodianship Icons Pdf
This slide outlines the overview of the data stewardship platform for data stewards, which takes the form of a dashboard and is essential for performing tasks. This platform allows data stewards to organize their work, promote trustworthy and participatory information documentation, and so on. Slidegeeks is one of the best resources for PowerPoint templates. You can download easily and regulate Data Stewardship Platform For Stewards Data Custodianship Icons Pdf for your personal presentations from our wonderful collection. A few clicks is all it takes to discover and get the most relevant and appropriate templates. Use our Templates to add a unique zing and appeal to your presentation and meetings. All the slides are easy to edit and you can use them even for advertisement purposes. This slide outlines the overview of the data stewardship platform for data stewards, which takes the form of a dashboard and is essential for performing tasks. This platform allows data stewards to organize their work, promote trustworthy and participatory information documentation, and so on.
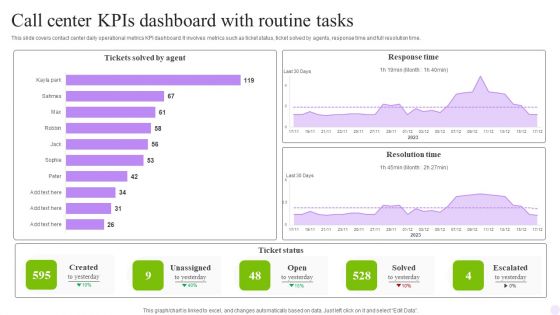
Call Center Kpis Dashboard With Routine Tasks Structure PDF
This slide covers contact center daily operational metrics KPI dashboard. It involves metrics such as ticket status, ticket solved by agents, response time and full resolution time. Pitch your topic with ease and precision using this Call Center Kpis Dashboard With Routine Tasks Structure PDF. This layout presents information on Agent, Response Time, Routine Tasks. It is also available for immediate download and adjustment. So, changes can be made in the color, design, graphics or any other component to create a unique layout.

Development And Operations KPI Dashboard IT Post It Notes Inspiration PDF
Presenting development and operations kpi dashboard it post it notes inspiration pdf to provide visual cues and insights. Share and navigate important information on four stages that need your due attention. This template can be used to pitch topics like post it notes. In addtion, this PPT design contains high resolution images, graphics, etc, that are easily editable and available for immediate download.
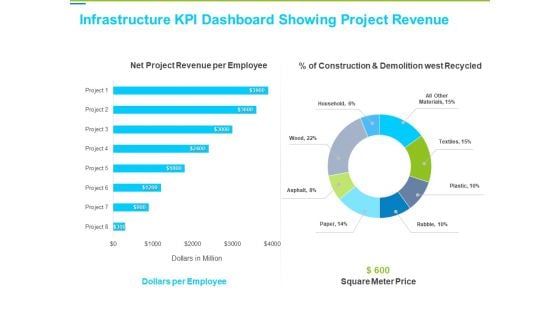
Framework Administration Infrastructure KPI Dashboard Showing Project Revenue Background PDF
Deliver an awe-inspiring pitch with this creative framework administration infrastructure kpi dashboard showing project revenue background pdf bundle. Topics like net project revenue per employee, dollars per employee, square meter price can be discussed with this completely editable template. It is available for immediate download depending on the needs and requirements of the user.
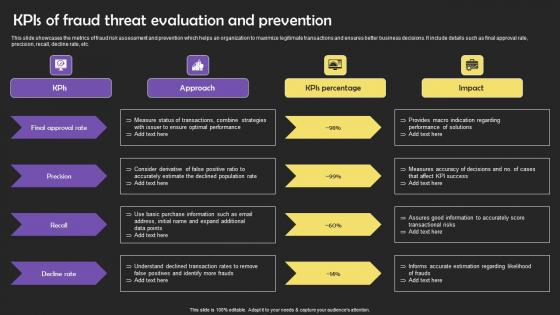
KPIS Of Fraud Threat Evaluation And Prevention Formats Pdf
This slide showcases the metrics of fraud risk assessment and prevention which helps an organization to maximize legitimate transactions and ensures better business decisions. It include details such as final approval rate, precision, recall, decline rate, etc. Pitch your topic with ease and precision using this KPIS Of Fraud Threat Evaluation And Prevention Formats Pdf This layout presents information on Final Approval Rate, Optimal Performance, Decline Rate It is also available for immediate download and adjustment. So, changes can be made in the color, design, graphics or any other component to create a unique layout. This slide showcases the metrics of fraud risk assessment and prevention which helps an organization to maximize legitimate transactions and ensures better business decisions. It include details such as final approval rate, precision, recall, decline rate, etc.
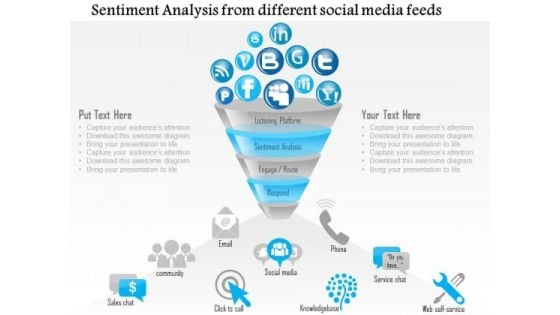
Business Diagram Sentiment Analysis From Different Social Media Feeds Ppt Slide
This diagram has been designed with graphic of funnel diagram displaying multiple icons of social media. These icons may be used to display social media sentiment analysis. Use this diagram slide for social media related presentations.
Competitive Comparative Analysis Based On Product Metrics Ppt Icon Slide Pdf
The following slide showcases comparison and analysis of own and competitor business based on production KPIs and compliance. It presents metrics such as units produced per hour, scrap rate, manufacturing cycle time, first pass yield, downtime, overall equipment effectiveness and on time delivery rate. Want to ace your presentation in front of a live audience Our Competitive Comparative Analysis Based On Product Metrics Ppt Icon Slide Pdf can help you do that by engaging all the users towards you. Slidegeeks experts have put their efforts and expertise into creating these impeccable powerpoint presentations so that you can communicate your ideas clearly. Moreover, all the templates are customizable, and easy to edit and downloadable. Use these for both personal and commercial use. The following slide showcases comparison and analysis of own and competitor business based on production KPIs and compliance. It presents metrics such as units produced per hour, scrap rate, manufacturing cycle time, first pass yield, downtime, overall equipment effectiveness and on time delivery rate.
Business KPI Dashboard Ppt PowerPoint Presentation Styles Deck Cpb
This is a business kpi dashboard ppt powerpoint presentation styles deck cpb. This is a four stage process. The stages in this process are business kpi dashboard.
Network KPI Dashboard Ppt PowerPoint Presentation Summary Design Ideas Cpb
This is a network kpi dashboard ppt powerpoint presentation summary design ideas cpb. This is a three stage process. The stages in this process are network kpi dashboard.
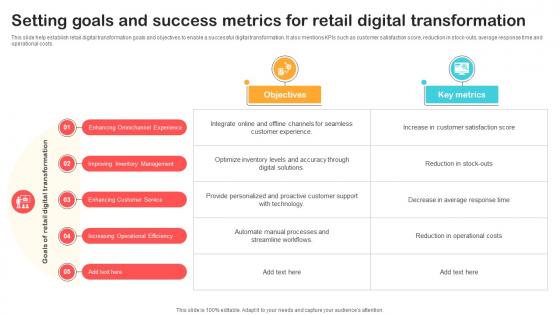
Setting Goals And Success Metrics For Retail Digital Optimizing Retail Operations With Digital DT SS V
This slide help establish retail digital transformation goals and objectives to enable a successful digital transformation. It also mentions KPIs such as customer satisfaction score, reduction in stock-outs, average response time and operational costs.Are you searching for a Setting Goals And Success Metrics For Retail Digital Optimizing Retail Operations With Digital DT SS V that is uncluttered, straightforward, and original Its easy to edit, and you can change the colors to suit your personal or business branding. For a presentation that expresses how much effort you have put in, this template is ideal With all of its features, including tables, diagrams, statistics, and lists, its perfect for a business plan presentation. Make your ideas more appealing with these professional slides. Download Setting Goals And Success Metrics For Retail Digital Optimizing Retail Operations With Digital DT SS V from Slidegeeks today. This slide help establish retail digital transformation goals and objectives to enable a successful digital transformation. It also mentions KPIs such as customer satisfaction score, reduction in stock-outs, average response time and operational costs.
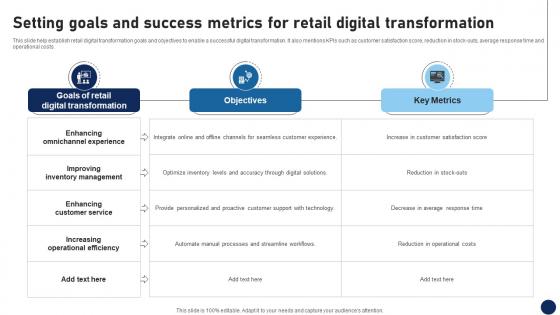
Setting Goals And Success Metrics For Retail Digital Transformation DT SS V
This slide help establish retail digital transformation goals and objectives to enable a successful digital transformation. It also mentions KPIs such as customer satisfaction score, reduction in stock-outs, average response time and operational costs.Are you searching for a Setting Goals And Success Metrics For Retail Digital Transformation DT SS V that is uncluttered, straightforward, and original Its easy to edit, and you can change the colors to suit your personal or business branding. For a presentation that expresses how much effort you have put in, this template is ideal With all of its features, including tables, diagrams, statistics, and lists, its perfect for a business plan presentation. Make your ideas more appealing with these professional slides. Download Setting Goals And Success Metrics For Retail Digital Transformation DT SS V from Slidegeeks today. This slide help establish retail digital transformation goals and objectives to enable a successful digital transformation. It also mentions KPIs such as customer satisfaction score, reduction in stock-outs, average response time and operational costs.
Online Product Planning Ecommerce Management KPIS And Dashboard Ppt Professional Example PDF
Presenting this set of slides with name online product planning ecommerce management kpis and dashboard ppt professional example pdf. This is a two stage process. The stages in this process are kpi metrics, kpi dashboards. This is a completely editable PowerPoint presentation and is available for immediate download. Download now and impress your audience.
Ecommerce Management Kpis And Dashboard Ppt PowerPoint Presentation Show Layouts PDF
Presenting this set of slides with name ecommerce management kpis and dashboard ppt powerpoint presentation show layouts pdf. This is a two stage process. The stages in this process are kpi metrics, kpi dashboards. This is a completely editable PowerPoint presentation and is available for immediate download. Download now and impress your audience.


 Continue with Email

 Home
Home


