key performance indicators
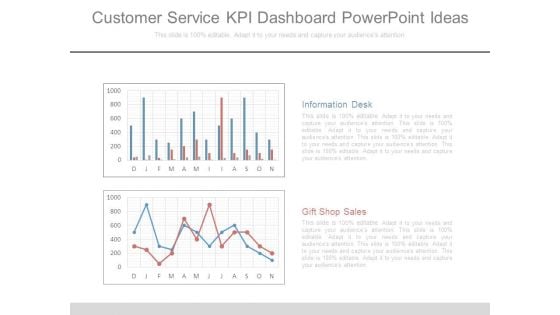
Customer Service Kpi Dashboard Powerpoint Ideas
This is a customer service kpi dashboard powerpoint ideas. This is a two stage process. The stages in this process are information desk, gift shop sales.
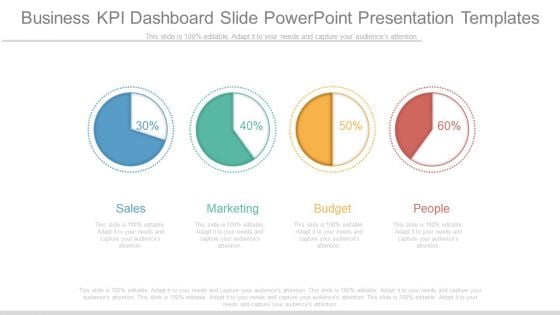
Business Kpi Dashboard Slide Powerpoint Presentation Templates
This is a business kpi dashboard slide powerpoint presentation templates. This is a four stage process. The stages in this process are sales, marketing, budget, people.

ITIL Incident Regulation Kpi Dashboard Background PDF
This slide covers ITIL problem management KPI dashboard to track status of problems. It involves KPI such as total number of incidents, problems, requests, average time to solve incidents.Pitch your topic with ease and precision using this ITIL Incident Regulation Kpi Dashboard Background PDF. This layout presents information on Active Problems, Average Incidents, Opened Problems. It is also available for immediate download and adjustment. So, changes can be made in the color, design, graphics or any other component to create a unique layout.
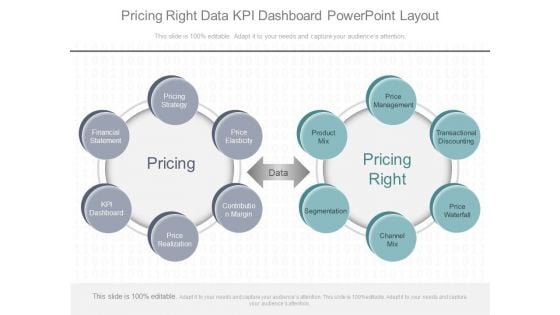
Pricing Right Data Kpi Dashboard Powerpoint Layout
This is a pricing right data kpi dashboard powerpoint layout. This is a two stage process. The stages in this process are price management, transactional discounting, price waterfall, channel mix, segmentation, product mix, price elasticity, contribution margin, price realization, kpi dashboard, financial statement, pricing, data, pricing right.
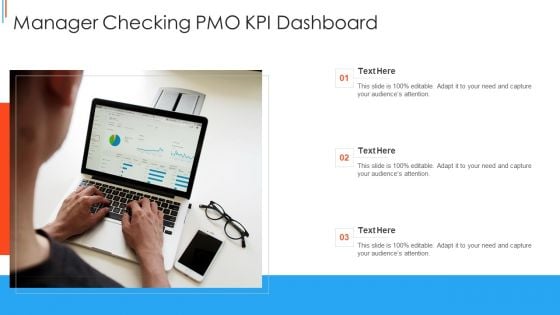
Manager Checking PMO KPI Dashboard Mockup PDF
Persuade your audience using this Manager Checking PMO KPI Dashboard Mockup PDF This PPT design covers three stages, thus making it a great tool to use. It also caters to a variety of topics including Manager Checking, Pmo Kpi Dashboard Download this PPT design now to present a convincing pitch that not only emphasizes the topic but also showcases your presentation skills.
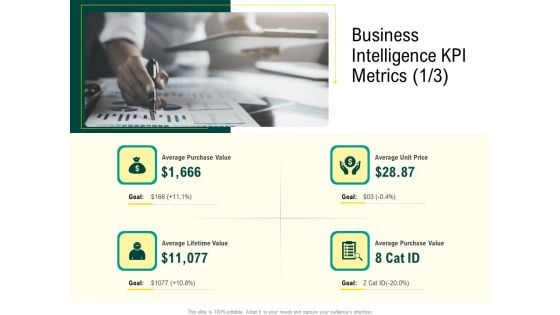
Expert Systems Business Intelligence KPI Metrics Average Rules PDF
Presenting expert systems business intelligence kpi metrics average rules pdf to provide visual cues and insights. Share and navigate important information on four stages that need your due attention. This template can be used to pitch topics like business intelligence kpi metrics. In addtion, this PPT design contains high-resolution images, graphics, etc, that are easily editable and available for immediate download.
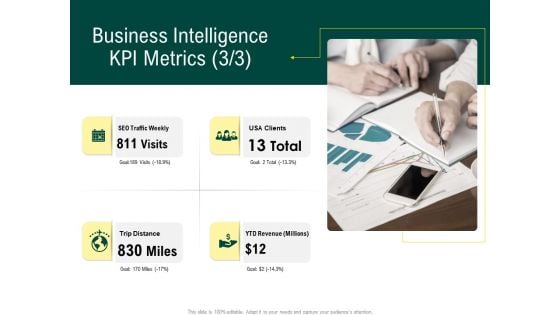
Expert Systems Business Intelligence KPI Metrics Usa Clients Pictures PDF
Presenting expert systems business intelligence kpi metrics usa clients pictures pdf to provide visual cues and insights. Share and navigate important information on four stages that need your due attention. This template can be used to pitch topics like business intelligence, kpi metrics. In addtion, this PPT design contains high-resolution images, graphics, etc, that are easily editable and available for immediate download.
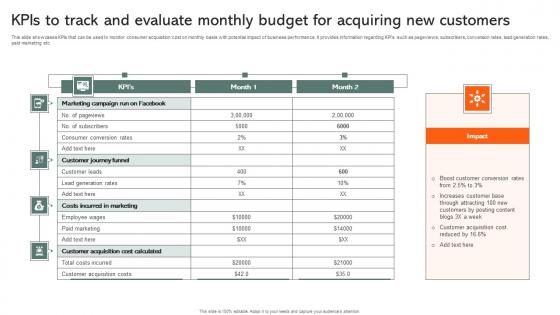
KPIs To Track And Evaluate Monthly Budget For Acquiring New Customers Microsoft Pdf
This slide showcases KPIs that can be used to monitor consumer acquisition cost on monthly basis with potential impact of business performance. It provides information regarding KPIs such as pageviews, subscribers, conversion rates, lead generation rates, paid marketing etc. Pitch your topic with ease and precision using this KPIs To Track And Evaluate Monthly Budget For Acquiring New Customers Microsoft Pdf. This layout presents information on Customer Journey Funnel, Costs Incurred In Marketing. It is also available for immediate download and adjustment. So, changes can be made in the color, design, graphics or any other component to create a unique layout. This slide showcases KPIs that can be used to monitor consumer acquisition cost on monthly basis with potential impact of business performance. It provides information regarding KPIs such as pageviews, subscribers, conversion rates, lead generation rates, paid marketing etc.

Our Recent Work For Video Production Service Proposal One Pager Sample Example Document
This slide shows the snapshot of recent work performed by the company of various wedding events at multiple locations. Presenting you an exemplary Our Recent Work For Video Production Service Proposal One Pager Sample Example Document. Our one-pager comprises all the must-have essentials of an inclusive document. You can edit it with ease, as its layout is completely editable. With such freedom, you can tweak its design and other elements to your requirements. Download this Our Recent Work For Video Production Service Proposal One Pager Sample Example Document brilliant piece now.

Erp Management Dashboard To Optimize Marketing Erp And Digital Transformation For Maximizing DT SS V
This slide present an ERP management dashboard to help monitor the sales and marketing initiatives and boost business performance. It tracks sales overview, visitors, and campaign performance.This Erp Management Dashboard To Optimize Marketing Erp And Digital Transformation For Maximizing DT SS V from Slidegeeks makes it easy to present information on your topic with precision. It provides customization options, so you can make changes to the colors, design, graphics, or any other component to create a unique layout. It is also available for immediate download, so you can begin using it right away. Slidegeeks has done good research to ensure that you have everything you need to make your presentation stand out. Make a name out there for a brilliant performance. This slide present an ERP management dashboard to help monitor the sales and marketing initiatives and boost business performance. It tracks sales overview, visitors, and campaign performance.
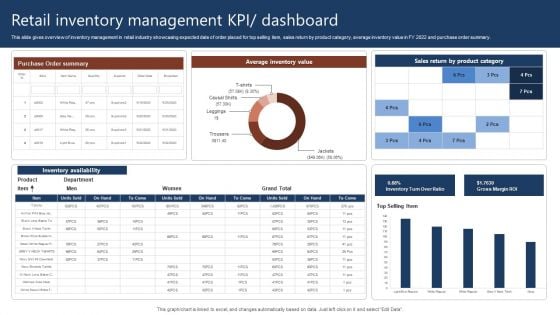
Retail Inventory Management Kpi Dashboard Rules PDF
This slide gives overview of inventory management in retail industry showcasing expected date of order placed for top selling item, sales return by product category, average inventory value in FY 2022 and purchase order summary. Pitch your topic with ease and precision using this Retail Inventory Management Kpi Dashboard Rules PDF. This layout presents information on Retail Inventory Management, Dashboard. It is also available for immediate download and adjustment. So, changes can be made in the color, design, graphics or any other component to create a unique layout.
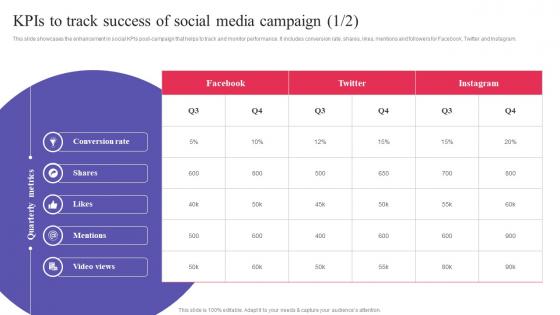
KPIs To Track Success Of Social Media Campaign Digital Promotional Campaign Ideas Pdf
This slide showcases the enhancement in social KPIs post-campaign that helps to track and monitor performance. It includes conversion rate, shares, likes, mentions and followers for Facebook, Twitter and Instagram. The best PPT templates are a great way to save time, energy, and resources. Slidegeeks have 100 percent editable powerpoint slides making them incredibly versatile. With these quality presentation templates, you can create a captivating and memorable presentation by combining visually appealing slides and effectively communicating your message. Download KPIs To Track Success Of Social Media Campaign Digital Promotional Campaign Ideas Pdf from Slidegeeks and deliver a wonderful presentation. This slide showcases the enhancement in social KPIs post-campaign that helps to track and monitor performance. It includes conversion rate, shares, likes, mentions and followers for Facebook, Twitter and Instagram.
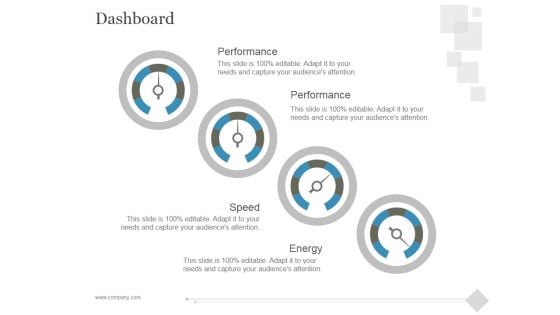
Dashboard Ppt PowerPoint Presentation Diagrams
This is a dashboard ppt powerpoint presentation diagrams. This is a four stage process. The stages in this process are performance, energy, speed.
KPI Dashboard With Pen Vector Icon Ppt PowerPoint Presentation Professional Infographics PDF
Persuade your audience using this kpi dashboard with pen vector icon ppt powerpoint presentation professional infographics pdf. This PPT design covers three stages, thus making it a great tool to use. It also caters to a variety of topics including kpi dashboard with pen vector icon. Download this PPT design now to present a convincing pitch that not only emphasizes the topic but also showcases your presentation skills.
Comparative Analysis Of Digital Security Metrics For Small Businesses Icons Pdf
Pitch your topic with ease and precision using this Comparative Analysis Of Digital Security Metrics For Small Businesses Icons Pdf This layout presents information on Futuristic Approach, Data Driven Decisions, Exposed Assets It is also available for immediate download and adjustment. So, changes can be made in the color, design, graphics or any other component to create a unique layout. This slide showcases the comparative analysis of cybersecurity KPIs for small businesses which helps an organization to carefully choose, select the best metric to track performance. It include details such as goal oriented, actionable, easy to understand, etc.
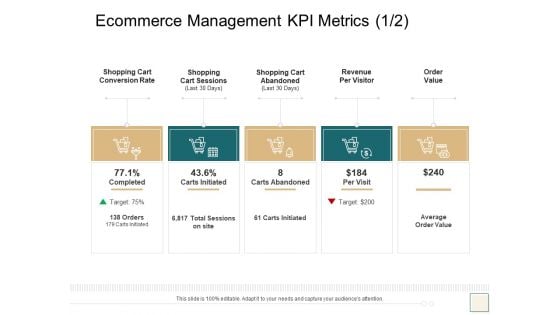
B2B Trade Management Ecommerce Management KPI Metrics Order Elements PDF
Presenting b2b trade management ecommerce management kpi metrics order elements pdf to provide visual cues and insights. Share and navigate important information on five stages that need your due attention. This template can be used to pitch topics like shopping cart conversion rate, shopping cart sessions, shopping cart abandoned, revenue per visitor, order value. In addtion, this PPT design contains high-resolution images, graphics, etc, that are easily editable and available for immediate download.
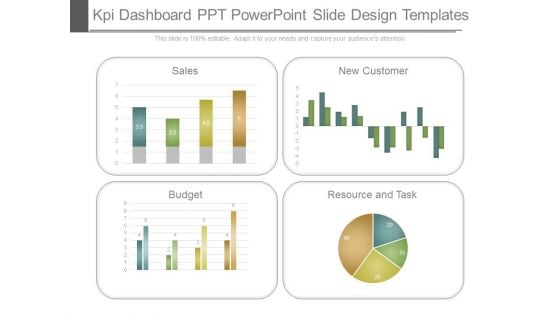
Kpi Dashboard Ppt Powerpoint Slide Design Templates
This is a kpi dashboard ppt powerpoint slide design templates. This is a four stage process. The stages in this process are sales, new customer, budget, resource and task.
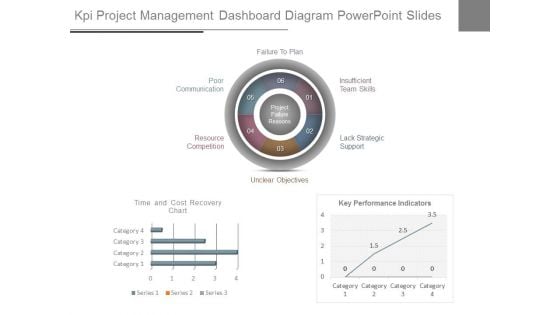
Kpi Project Management Dashboard Diagram Powerpoint Slides
This is a kpi project management dashboard diagram powerpoint slides. This is a three stage process. The stages in this process are unclear objectives, resource competition, poor communication, failure to plan, insufficient team skills, lack strategic support.
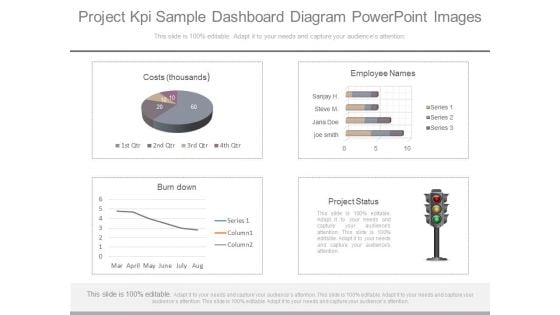
Project Kpi Sample Dashboard Diagram Powerpoint Images
This is a project kpi sample dashboard diagram powerpoint images. This is a four stage process. The stages in this process are costs thousands, employee names, burndown, project status.
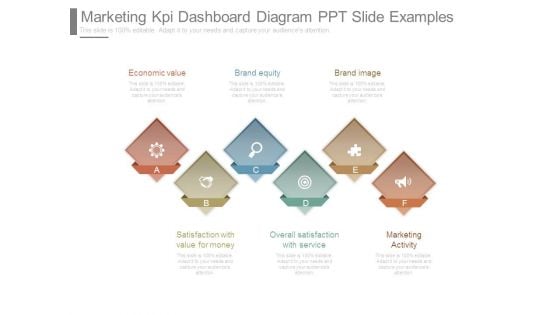
Marketing Kpi Dashboard Diagram Ppt Slide Examples
This is a marketing kpi dashboard diagram ppt slide examples. This is a six stage process. The stages in this process are economic value, satisfaction with value for money, brand equity, overall satisfaction with service, brand image, marketing activity.
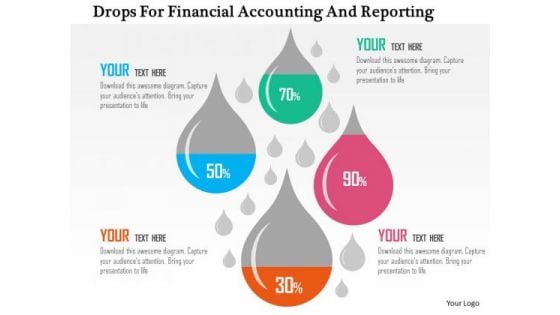
Business Diagram Drops For Financial Accounting And Reporting Presentation Template
This business diagram has been designed with drops displaying financial ratios. Download this diagram to depict financial and accounting ratios. Use this slide to build quality presentations for your viewers.
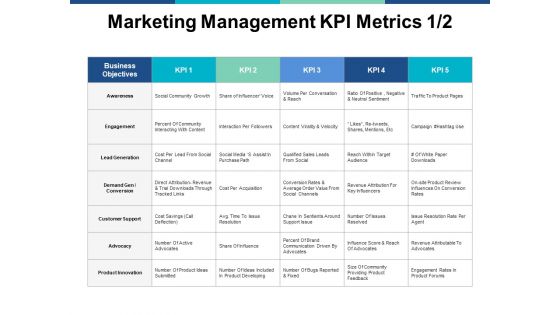
Marketing Management Kpi Metrics Business Ppt PowerPoint Presentation Show Shapes
This is a marketing management kpi metrics business ppt powerpoint presentation show shapes. This is a four stage process. The stages in this process are compare, marketing, business, management, planning.

Customer Need Assessment Kpi Dashboard Infographics PDF
The following slide highlights the spas to assess customers changing needs and make strategies to improve. It consists of NPS, responses, weekly variations in needs, positive and negative feedback etc. Showcasing this set of slides titled customer need assessment kpi dashboard infographics pdf. The topics addressed in these templates are customer need assessment kpi dashboard. All the content presented in this PPT design is completely editable. Download it and make adjustments in color, background, font etc. as per your unique business setting.
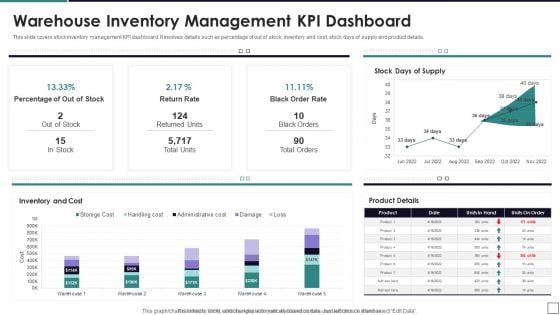
Warehouse Inventory Management KPI Dashboard Information PDF
This slide covers stock inventory management KPI dashboard. It involves details such as percentage of out of stock, inventory and cost, stock days of supply and product details. Showcasing this set of slides titled Warehouse Inventory Management KPI Dashboard Information PDF. The topics addressed in these templates are Inventory And Cost, Return Rate, Out Of Stock. All the content presented in this PPT design is completely editable. Download it and make adjustments in color, background, font etc. as per your unique business setting.
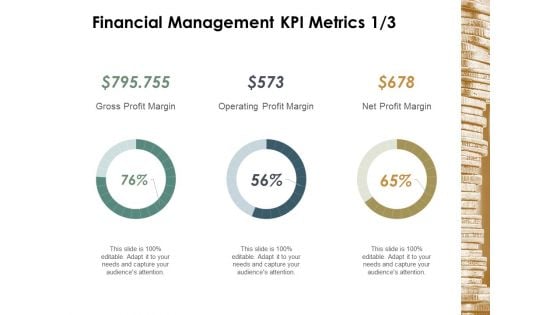
Financial Management Kpi Metrics Business Ppt Powerpoint Presentation Model Example
This is a financial management kpi metrics business ppt powerpoint presentation model example. This is a three stage process. The stages in this process are finance, marketing, management, investment, analysis.
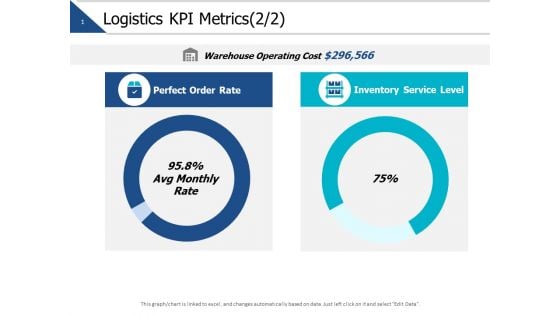
Logistics Kpi Metrics Business Ppt PowerPoint Presentation Layouts Microsoft
This is a logistics kpi metrics business ppt powerpoint presentation layouts microsoft. This is a two stage process. The stages in this process are finance, marketing, management, investment, analysis.
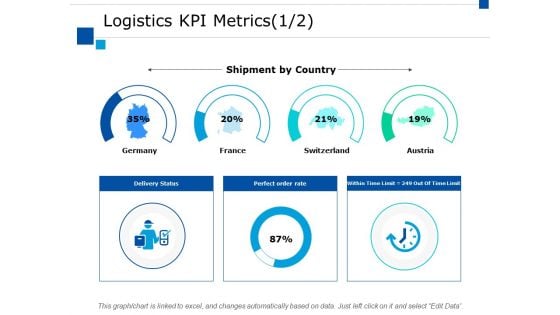
Logistics Kpi Metrics Business Ppt PowerPoint Presentation Ideas Infographics
This is a logistics kpi metrics business ppt powerpoint presentation ideas infographics. This is a four stage process. The stages in this process are finance, marketing, management, investment, analysis.
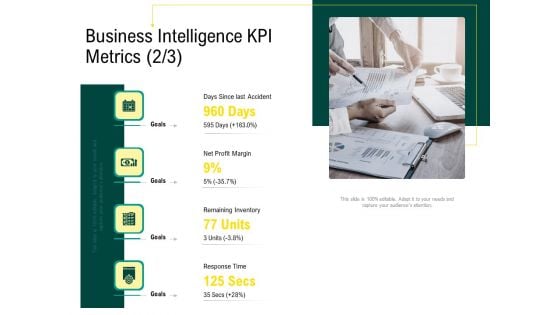
Expert Systems Business Intelligence KPI Metrics Goals Mockup PDF
This is a expert systems business intelligence kpi metrics goals mockup pdf template with various stages. Focus and dispense information on four stages using this creative set, that comes with editable features. It contains large content boxes to add your information on topics like business intelligence, kpi metrics. You can also showcase facts, figures, and other relevant content using this PPT layout. Grab it now.
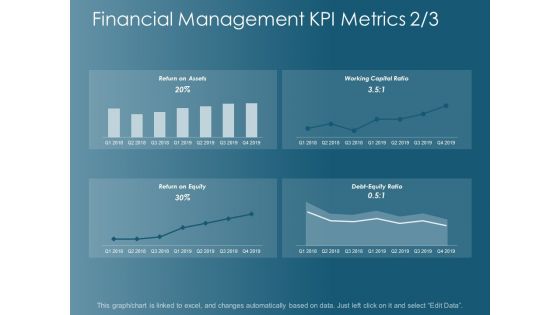
Financial Management Kpi Metrics Business Ppt Powerpoint Presentation Styles Diagrams
This is a financial management kpi metrics business ppt powerpoint presentation styles diagrams. This is a four stage process. The stages in this process are finance, marketing, management, investment, analysis.
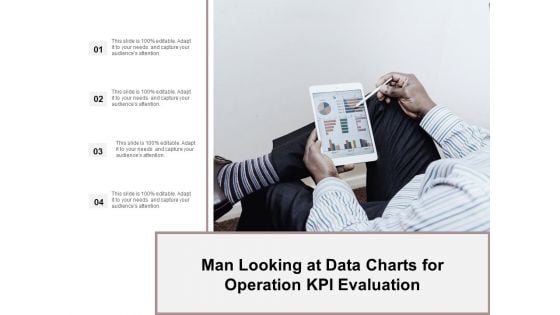
Man Looking At Data Charts For Operation Kpi Evaluation Ppt Powerpoint Presentation Ideas Demonstration
This is a man looking at data charts for operation kpi evaluation ppt powerpoint presentation ideas demonstration. This is a four stage process. The stages in this process are business metrics, business kpi, business dashboard.
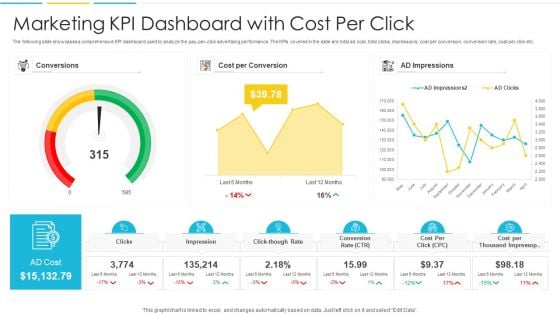
Marketing KPI Dashboard With Cost Per Click Infographics PDF
The following slide showcases a comprehensive KPI dashboard used to analyze the pay-per-click advertising performance. The KPIs covered in the slide are total ad cost, total clicks, impressions, cost per conversion, conversion rate, cost per click etc. Pitch your topic with ease and precision using this Marketing KPI Dashboard With Cost Per Click Infographics PDF. This layout presents information on Conversions, Cost, Impressions. It is also available for immediate download and adjustment. So, changes can be made in the color, design, graphics or any other component to create a unique layout.
KPI Dashboard For Organizational Debt Management Ppt Professional Icons PDF
This slide shows the KPI dashboard for debt management which can be used by an organization to track debt performance. It includes KPIs such as current bank balance, amount due, creditors, etc. Showcasing this set of slides titled KPI Dashboard For Organizational Debt Management Ppt Professional Icons PDF. The topics addressed in these templates are Total Amount Due, Current Bank Balance, Invoiced vs Paid. All the content presented in this PPT design is completely editable. Download it and make adjustments in color, background, font etc. as per your unique business setting.
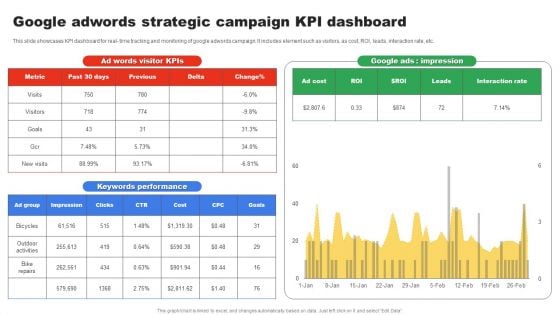
Google Adwords Strategic Campaign KPI Dashboard Topics PDF
This slide showcases KPI dashboard for real time tracking and monitoring of google adwords campaign. It includes element such as visitors, as cost, ROI, leads, interaction rate, etc. Showcasing this set of slides titled Google Adwords Strategic Campaign KPI Dashboard Topics PDF. The topics addressed in these templates are Keywords Performance, Google Ads Impression, Ad Words Visitor Kpis. All the content presented in this PPT design is completely editable. Download it and make adjustments in color, background, font etc. as per your unique business setting.
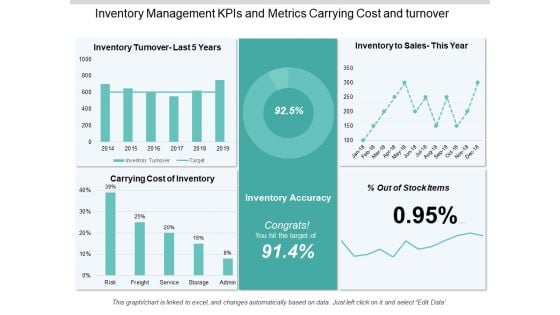
Inventory Management Kpis And Metrics Carrying Cost And Turnover Ppt PowerPoint Presentation Information
This is a inventory management kpis and metrics carrying cost and turnover ppt powerpoint presentation information. This is a five stage process. The stages in this process are logistics performance, logistics dashboard, logistics kpis.
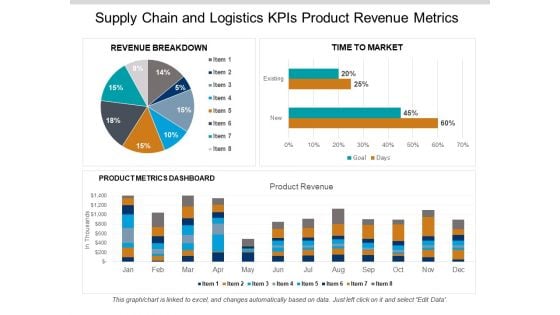
Supply Chain And Logistics Kpis Product Revenue Metrics Ppt PowerPoint Presentation Gallery Aids
This is a supply chain and logistics kpis product revenue metrics ppt powerpoint presentation gallery aids. This is a three stage process. The stages in this process are logistics performance, logistics dashboard, logistics kpis.
KPI Metrics Vector Icon Ppt PowerPoint Presentation Layouts Slide
This is a kpi metrics vector icon ppt powerpoint presentation layouts slide. This is a three stage process. The stages in this process are kpi proposal, kpi plan, kpi scheme.
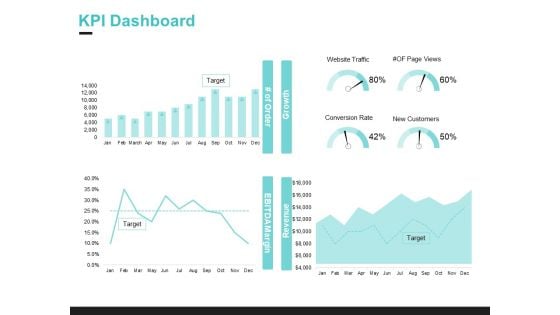
Inbound Marketing Proposal KPI Dashboard Designs PDF
Deliver and pitch your topic in the best possible manner with this inbound marketing proposal kpi dashboard designs pdf. Use them to share invaluable insights on target, growth, revenue and impress your audience. This template can be altered and modified as per your expectations. So, grab it now.
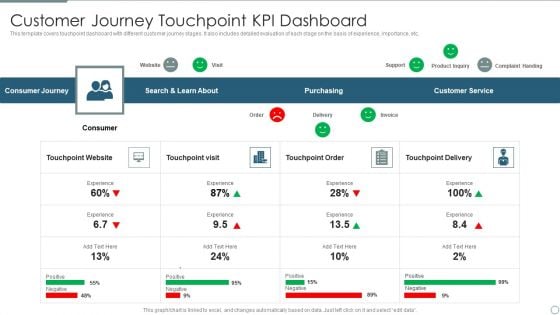
Customer Journey Touchpoint Kpi Dashboard Slides PDF
This template covers touchpoint dashboard with different customer journey stages. It also includes detailed evaluation of each stage on the basis of experience, importance, etc. Showcasing this set of slides titled Customer Journey Touchpoint Kpi Dashboard Slides PDF. The topics addressed in these templates are Purchasing, Customer Service, Consumer Journey. All the content presented in this PPT design is completely editable. Download it and make adjustments in color, background, font etc. as per your unique business setting.
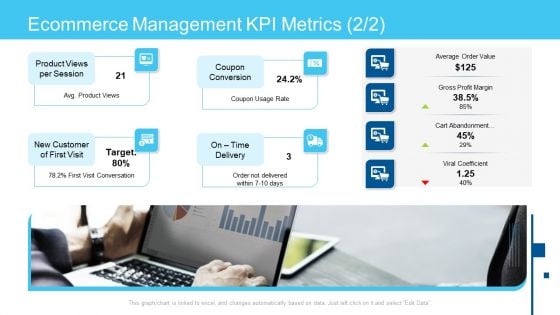
Online Business Framework Ecommerce Management Kpi Metrics Profit Introduction PDF
Presenting online business framework ecommerce management kpi metrics profit introduction pdf to provide visual cues and insights. Share and navigate important information on one stages that need your due attention. This template can be used to pitch topics like customer, product, target. In addtion, this PPT design contains high resolution images, graphics, etc, that are easily editable and available for immediate download.
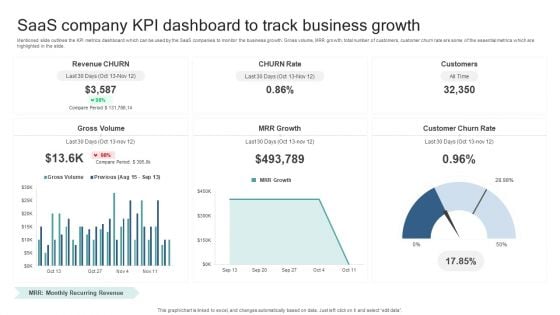
Saas Company KPI Dashboard To Track Business Growth Guidelines PDF
Mentioned slide outlines the KPI metrics dashboard which can be used by the SaaS companies to monitor the business growth. Gross volume, MRR growth, total number of customers, customer churn rate are some of the essential metrics which are highlighted in the slide. Showcasing this set of slides titled Saas Company KPI Dashboard To Track Business Growth Guidelines PDF. The topics addressed in these templates are Gross Volume, Mrr Growth, Customer Churn Rate. All the content presented in this PPT design is completely editable. Download it and make adjustments in color, background, font etc. as per your unique business setting.
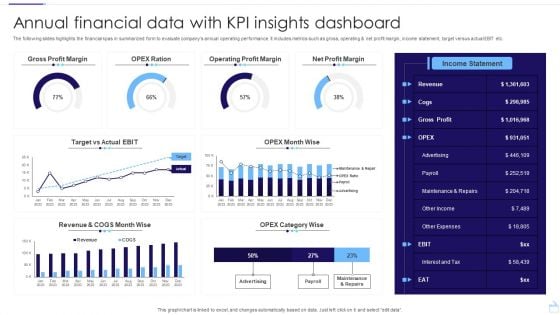
Annual Financial Data With KPI Insights Dashboard Structure PDF
The following slides highlights the financial kpas in summarized form to evaluate companys annual operating performance. It includes metrics such as gross, operating and net profit margin, income statement, target versus actual EBIT etc. Pitch your topic with ease and precision using this Annual Financial Data With KPI Insights Dashboard Structure PDF. This layout presents information on Gross Profit Margin, Operating Profit Margin, Net Profit Margin. It is also available for immediate download and adjustment. So, changes can be made in the color, design, graphics or any other component to create a unique layout.
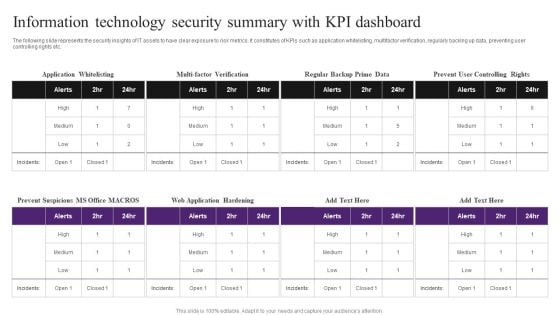
Information Technology Security Summary With KPI Dashboard Inspiration PDF
The following slide represents the security insights of IT assets to have clear exposure to risk metrics. It constitutes of KPIs such as application whitelisting, multifactor verification, regularly backing up data, preventing user controlling rights etc. Pitch your topic with ease and precision using this Information Technology Security Summary With KPI Dashboard Inspiration PDF. This layout presents information on Information Technology Security, Summary With KPI Dashboard. It is also available for immediate download and adjustment. So, changes can be made in the color, design, graphics or any other component to create a unique layout.
Project Error Tracking KPI Dashboard Themes PDF
This slide illustrates the dashboard for the project issue tracking and management. It includes the column chart for issues assignee, incomplete issues by priority and project, monthly percentage increase in issues created and closed, etc. Pitch your topic with ease and precision using this Project Error Tracking KPI Dashboard Themes PDF. This layout presents information on Issues Assignee, Issue Status, Incomplete Issues. It is also available for immediate download and adjustment. So, changes can be made in the color, design, graphics or any other component to create a unique layout.
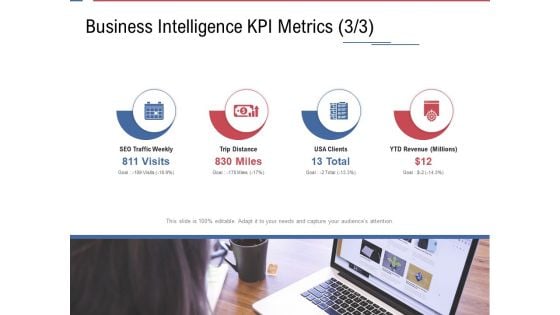
Data Assimilation Business Intelligence KPI Metrics Miles Ppt Ideas PDF
Presenting data assimilation business intelligence kpi metrics miles ppt ideas pdf to provide visual cues and insights. Share and navigate important information on four stages that need your due attention. This template can be used to pitch topics like seo traffic weekly, trip distance, usa clients, ytd revenue . In addtion, this PPT design contains high resolution images, graphics, etc, that are easily editable and available for immediate download.
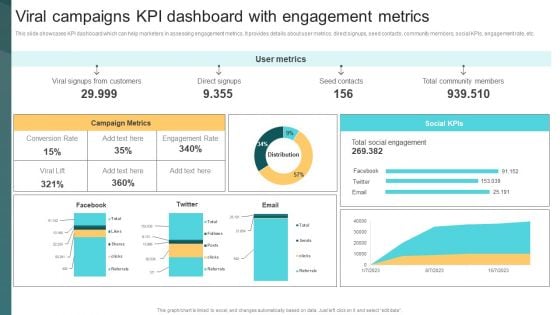
Viral Campaigns Kpi Dashboard With Engagement Metrics Deploying Viral Marketing Strategies Demonstration PDF
This slide showcases KPI dashboard which can help marketers in assessing engagement metrics. It provides details about user metrics, direct signups, seed contacts, community members, social KPIs, engagement rate, etc. Whether you have daily or monthly meetings, a brilliant presentation is necessary. Viral Campaigns Kpi Dashboard With Engagement Metrics Deploying Viral Marketing Strategies Demonstration PDF can be your best option for delivering a presentation. Represent everything in detail using Viral Campaigns Kpi Dashboard With Engagement Metrics Deploying Viral Marketing Strategies Demonstration PDF and make yourself stand out in meetings. The template is versatile and follows a structure that will cater to your requirements. All the templates prepared by Slidegeeks are easy to download and edit. Our research experts have taken care of the corporate themes as well. So, give it a try and see the results.
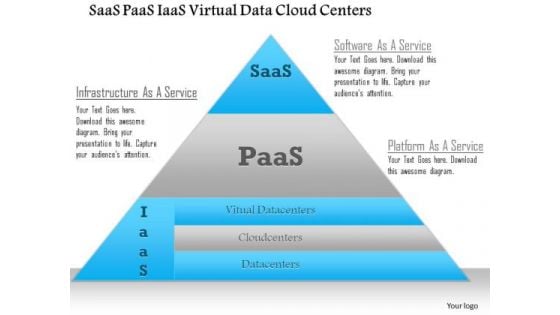
Business Diagram Saas Paas Iaas Virtual Data Cloud Centers Ppt Slide
This technical diagram has been designed with graphic of triangle. This slide contains the concept of SAAS, PAAS and IASS. This slide also helps to explain the virtual data on cloud centers. Download this diagram to make professional presentations.
Strategic Staffing Using Data Kpis For Tracking Recruitment Funnel Effectiveness CRP DK SS V
This slide showcases KPI metrics analyzed to monitor recruitment process such as candidate engagement rates, time to fill, offer acceptance rates etc. Presenting this PowerPoint presentation, titled Strategic Staffing Using Data Kpis For Tracking Recruitment Funnel Effectiveness CRP DK SS V, with topics curated by our researchers after extensive research. This editable presentation is available for immediate download and provides attractive features when used. Download now and captivate your audience. Presenting this Strategic Staffing Using Data Kpis For Tracking Recruitment Funnel Effectiveness CRP DK SS V. Our researchers have carefully researched and created these slides with all aspects taken into consideration. This is a completely customizable Strategic Staffing Using Data Kpis For Tracking Recruitment Funnel Effectiveness CRP DK SS V that is available for immediate downloading. Download now and make an impact on your audience. Highlight the attractive features available with our PPTs. This slide showcases KPI metrics analyzed to monitor recruitment process such as candidate engagement rates, time to fill, offer acceptance rates etc.
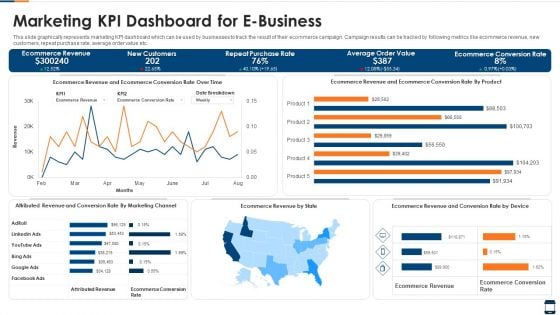
Marketing KPI Dashboard For E Business Brochure PDF
This slide graphically represents marketing KPI dashboard which can be used by businesses to track the result of their ecommerce campaign. Campaign results can be tracked by following metrics like ecommerce revenue, new customers, repeat purchase rate, average order value etc. Showcasing this set of slides titled marketing kpi dashboard for e business brochure pdf. The topics addressed in these templates are marketing kpi dashboard for e business. All the content presented in this PPT design is completely editable. Download it and make adjustments in color, background, font etc. as per your unique business setting.
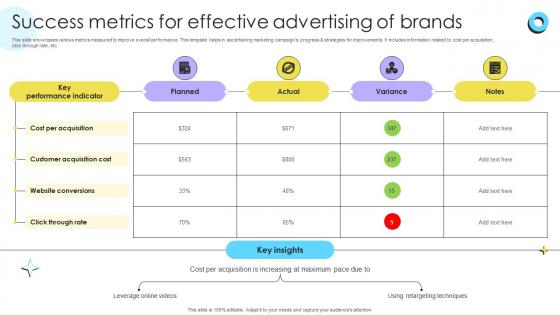
Success Metrics For Effective Advertising Encouraging Repetitive Customer Purchase Ppt Powerpoint
This slide showcases various metrics measured to improve overall performance. This template helps in ascertaining marketing campaigns progress and strategies for improvements. It includes information related to cost per acquisition, click through rate, etc. Retrieve professionally designed Success Metrics For Effective Advertising Encouraging Repetitive Customer Purchase Ppt Powerpoint to effectively convey your message and captivate your listeners. Save time by selecting pre-made slideshows that are appropriate for various topics, from business to educational purposes. These themes come in many different styles, from creative to corporate, and all of them are easily adjustable and can be edited quickly. Access them as PowerPoint templates or as Google Slides themes. You do not have to go on a hunt for the perfect presentation because Slidegeeks got you covered from everywhere. This slide showcases various metrics measured to improve overall performance. This template helps in ascertaining marketing campaigns progress and strategies for improvements. It includes information related to cost per acquisition, click through rate, etc.
Business Operations Metrics Dashboard Icon Graphics PDF
Showcasing this set of slides titled Business Operations Metrics Dashboard Icon Graphics PDF. The topics addressed in these templates are Business Operations, Metrics Dashboard Icon. All the content presented in this PPT design is completely editable. Download it and make adjustments in color, background, font etc. as per your unique business setting.
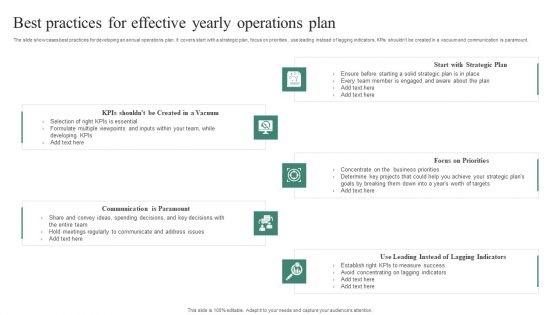
Best Practices For Effective Yearly Operations Plan Portrait PDF
The slide showcases best practices for developing an annual operations plan. It covers start with a strategic plan, focus on priorities , use leading instead of lagging indicators, KPIs should not be created in a vacuum and communication is paramount. Persuade your audience using this Best Practices For Effective Yearly Operations Plan Portrait PDF. This PPT design covers four stages, thus making it a great tool to use. It also caters to a variety of topics including Strategic Plan, Focus On Priorities, Communication Is Paramount. Download this PPT design now to present a convincing pitch that not only emphasizes the topic but also showcases your presentation skills.
Kpi And Dashboard Ppt PowerPoint Presentation Icon Template
This is a kpi and dashboard ppt powerpoint presentation icon template. This is a two stage process. The stages in this process are kpi dashboard, kpi metrics, management, marketing, strategy.
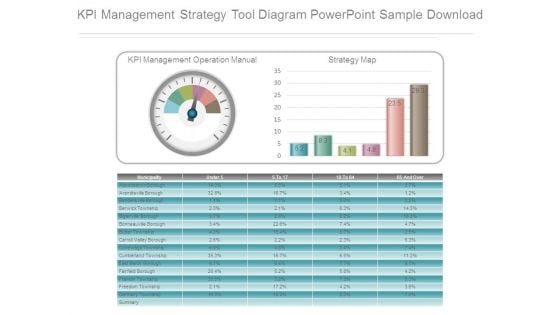
Kpi Management Strategy Tool Diagram Powerpoint Sample Download
This is a kpi management strategy tool diagram powerpoint sample download. This is a one stage process. The stages in this process are kpi management operation manual, strategy map.
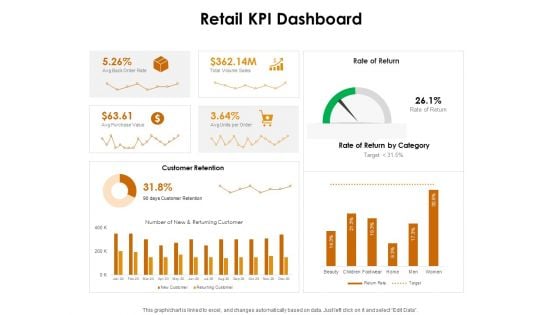
KPI Dashboards Per Industry Retail KPI Dashboard Ppt PowerPoint Presentation Slides Clipart PDF
Deliver an awe-inspiring pitch with this creative kpi dashboards per industry retail kpi dashboard ppt powerpoint presentation slides clipart pdf bundle. Topics like return reasons, top seller orders, perfect order rate, total orders can be discussed with this completely editable template. It is available for immediate download depending on the needs and requirements of the user.
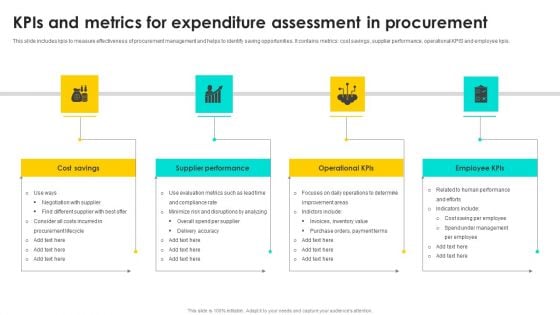
Kpis And Metrics For Expenditure Assessment In Procurement Slides PDF
This slide includes kpis to measure effectiveness of procurement management and helps to identify saving opportunities. It contains metrics cost savings, supplier performance, operational KPIS and employee kpis. Persuade your audience using this Kpis And Metrics For Expenditure Assessment In Procurement Slides PDF. This PPT design covers Four stages, thus making it a great tool to use. It also caters to a variety of topics including Cost Savings, Supplier Performance. Download this PPT design now to present a convincing pitch that not only emphasizes the topic but also showcases your presentation skills.
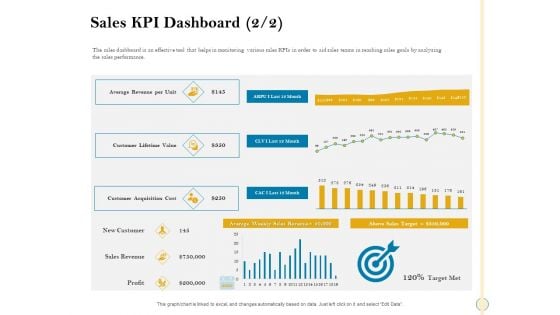
Sales Optimization Best Practices To Close More Deals Sales KPI Dashboard Revenue Diagrams PDF
The sales dashboard is an effective tool that helps in monitoring various sales KPIs in order to aid sales teams in reaching sales goals by analyzing the sales performance. Deliver an awe inspiring pitch with this creative sales optimization best practices to close more deals sales kpi dashboard revenue diagrams pdf bundle. Topics like sales kpi dashboard can be discussed with this completely editable template. It is available for immediate download depending on the needs and requirements of the user.
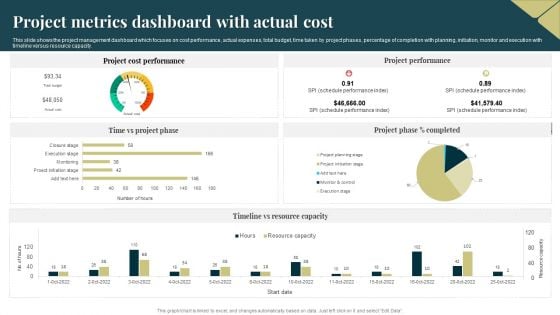
Project Metrics Dashboard With Actual Cost Background PDF
This slide shows the project management dashboard which focuses on cost performance, actual expenses, total budget, time taken by project phases, percentage of completion with planning, initiation, monitor and execution with timeline versus resource capacity. Showcasing this set of slides titled Project Metrics Dashboard With Actual Cost Background PDF. The topics addressed in these templates are Project Cost Performance, Project Performance, Resource Capacity. All the content presented in this PPT design is completely editable. Download it and make adjustments in color, background, font etc. as per your unique business setting.
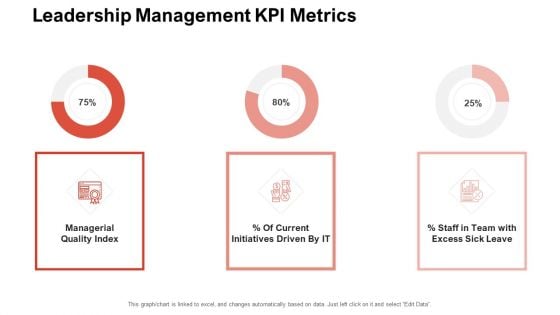
Team Manager Administration Leadership Management KPI Metrics Topics Pdf
Deliver an awe-inspiring pitch with this creative team manager administration leadership management kPI metrics topics pdf. bundle. Topics like staff team excess sick leave, managerial quality index, current initiatives driven by it can be discussed with this completely editable template. It is available for immediate download depending on the needs and requirements of the user

Enterprise Dashboard Ppt Presentation Powerpoint Example
This is a enterprise dashboard ppt presentation powerpoint example. This is a three stage process. The stages in this process are balance scorecard, enterprise performance, industry trends.
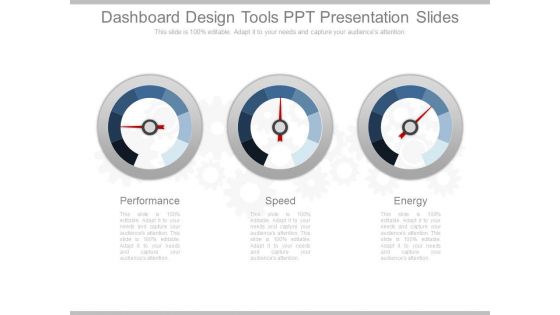
Dashboard Design Tools Ppt Presentation Slides
This is a dashboard design tools ppt presentation slides. This is a three stage process. The stages in this process are performance, speed, energy.


 Continue with Email

 Home
Home


