key performance indicators
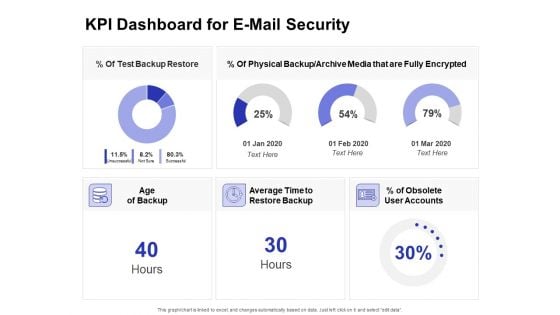
Global Cloud Based Email Security Market KPI Dashboard For E Mail Security Ideas PDF
Presenting this set of slides with name global cloud based email security market kpi dashboard for e mail security ideas pdf. The topics discussed in these slides are test backup restore, physical backup or archive media that are fully encrypted, obsolete user accounts, average time to restore backup. This is a completely editable PowerPoint presentation and is available for immediate download. Download now and impress your audience.
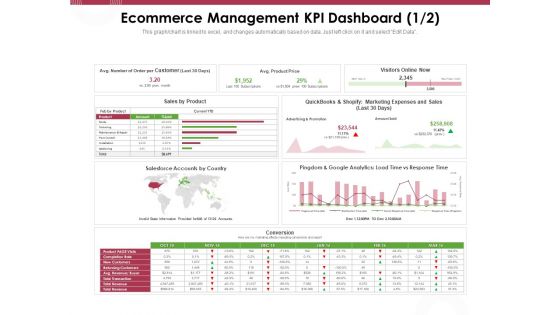
Online Product Planning Ecommerce Management KPI Dashboard Ppt Layouts Background Image PDF
Presenting this set of slides with name online product planning ecommerce management kpi dashboard ppt layouts background image pdf. The topics discussed in these slides are total volume sold this month, average purchase value, growth in average purchase value, growth in volume sold this month, growth in sales this month, total sales this month. This is a completely editable PowerPoint presentation and is available for immediate download. Download now and impress your audience.
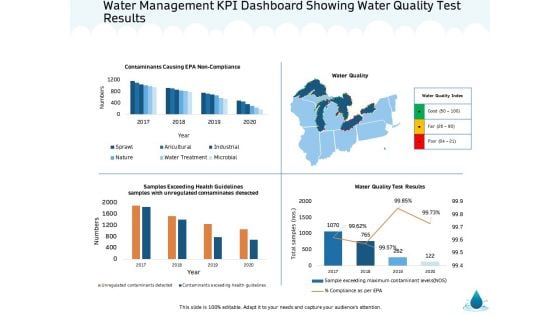
Water NRM Water Management KPI Dashboard Showing Water Quality Test Results Information PDF
Presenting this set of slides with name water nrm water management kpi dashboard showing water quality test results information pdf. The topics discussed in these slides are contaminants causing epa non compliance, water quality, water quality test results, samples exceeding health guidelines samples with unregulated contaminates detected. This is a completely editable PowerPoint presentation and is available for immediate download. Download now and impress your audience.
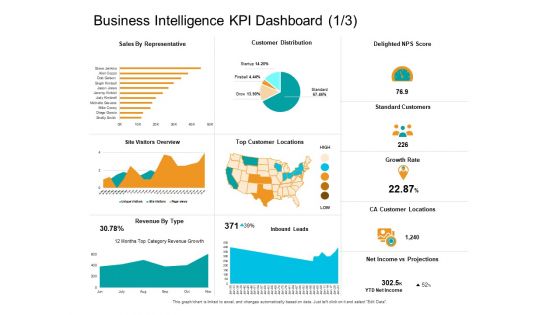
Facts Assessment Business Intelligence KPI Dashboard Expenses Ppt PowerPoint Presentation Layouts Background Images PDF
Presenting this set of slides with name facts assessment business intelligence kpi dashboard expenses ppt powerpoint presentation layouts background images pdf. The topics discussed in these slides are sales representative, delighted nps score, standard customers, growth rate, ca customer locations, net income vs projections, revenue type, top customer locations, customer distribution. This is a completely editable PowerPoint presentation and is available for immediate download. Download now and impress your audience.
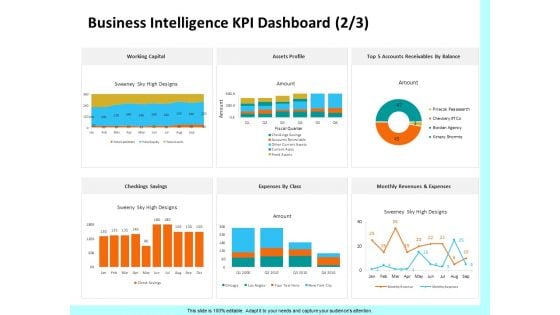
Firm Productivity Administration Business Intelligence KPI Dashboard Assets Ppt PowerPoint Presentation Slides Background Designs PDF
Presenting this set of slides with name firm productivity administration business intelligence kpi dashboard assets ppt powerpoint presentation slides background designs pdf. The topics discussed in these slides are expenses class, top 5 accounts receivables balance, assets profile, working capital, checking savings, monthly revenues and expenses. This is a completely editable PowerPoint presentation and is available for immediate download. Download now and impress your audience.
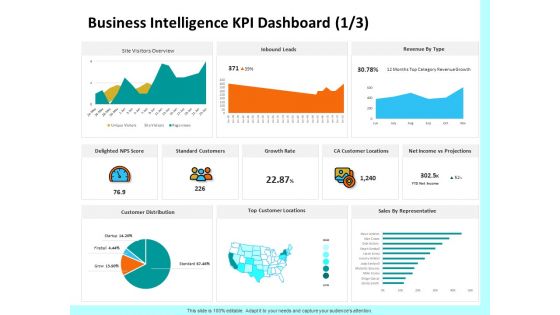
Firm Productivity Administration Business Intelligence KPI Dashboard Score Ppt PowerPoint Presentation Infographic Template Display PDF
Presenting this set of slides with name firm productivity administration business intelligence kpi dashboard score ppt powerpoint presentation infographic template display pdf. The topics discussed in these slides are sales representative, delighted nps score, standard customers, growth rate, ca customer locations, net income vs projections, revenue type, top customer locations, customer distribution. This is a completely editable PowerPoint presentation and is available for immediate download. Download now and impress your audience.

Enterprise Problem Solving And Intellect Business Intelligence KPI Dashboard Growth Ppt PowerPoint Presentation Model Images PDF
Presenting this set of slides with name enterprise problem solving and intellect business intelligence kpi dashboard growth ppt powerpoint presentation model images pdf. The topics discussed in these slides are sales representative, delighted nps score, standard customers, growth rate, ca customer locations, net income vs projections, revenue type, top customer locations, customer distribution. This is a completely editable PowerPoint presentation and is available for immediate download. Download now and impress your audience.

Enterprise Problem Solving And Intellect Business Intelligence KPI Dashboard Profile Ppt PowerPoint Presentation Summary Structure PDF
Presenting this set of slides with name enterprise problem solving and intellect business intelligence kpi dashboard profile ppt powerpoint presentation summary structure pdf. The topics discussed in these slides are expenses class, top 5 accounts receivables balance, assets profile, working capital, checking savings, monthly revenues and expenses. This is a completely editable PowerPoint presentation and is available for immediate download. Download now and impress your audience.
Power Management System And Technology KPI Dashboard Sales Ppt PowerPoint Presentation Icon Slide PDF
Presenting this set of slides with name power management system and technology kpi dashboard sales ppt powerpoint presentation icon slide pdf. The topics discussed in these slides are energy sources, consumption sector, average production costs, total consumption, sales sector, number power cuts and average duration, contribution renewable energy. This is a completely editable PowerPoint presentation and is available for immediate download. Download now and impress your audience.
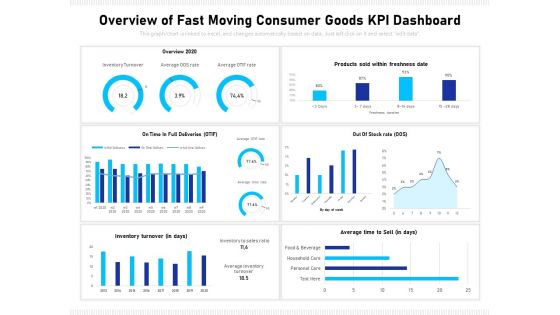
Overview Of Fast Moving Consumer Goods Kpi Dashboard Ppt PowerPoint Presentation Show Visual Aids PDF
Showcasing this set of slides titled overview of fast moving consumer goods kpi dashboard ppt powerpoint presentation show visual aids pdf. The topics addressed in these templates are overview 2020, on time in full deliveries otif, out of stock rate oos, inventory turnover in days, average time to sell in days. All the content presented in this PPT design is completely editable. Download it and make adjustments in color, background, font etc. as per your unique business setting.

Digitalization Corporate Initiative Ecommerce Management KPI Dashboard Source Ppt Model Pdf
This is a digitalization corporate initiative ecommerce management kpi dashboard source ppt model pdf template with various stages. Focus and dispense information on one stage using this creative set, that comes with editable features. It contains large content boxes to add your information on topics like average, purchase, product, sales, source. You can also showcase facts, figures, and other relevant content using this PPT layout. Grab it now.
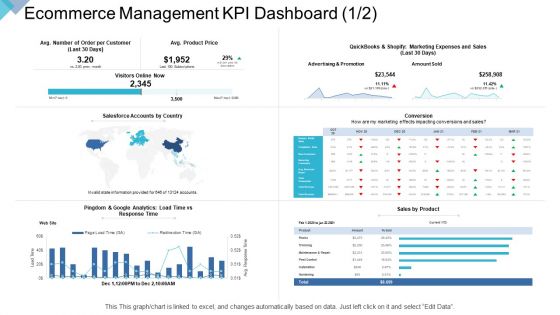
Digital Enterprise Management Ecommerce Management KPI Dashboard Ppt PowerPoint Presentation Outline Clipart PDF
Deliver and pitch your topic in the best possible manner with this digital enterprise management ecommerce management kpi dashboard ppt powerpoint presentation outline clipart pdf. Use them to share invaluable insights on avg product price, advertising and promotion, sales by product, pingdom and google analytics load time vs response time, visitors online now and impress your audience. This template can be altered and modified as per your expectations. So, grab it now.
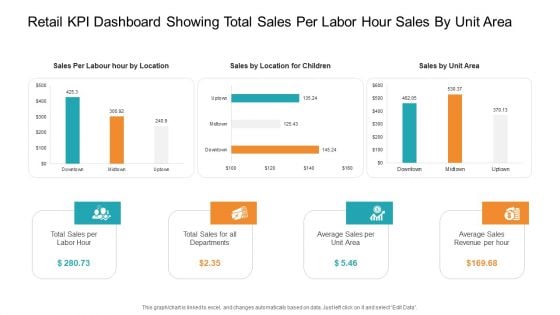
Retail KPI Dashboard Showing Total Sales Per Labor Hour Sales By Unit Area Infographics PDF
Deliver and pitch your topic in the best possible manner with this retail KPI dashboard showing total sales per labor hour sales by unit area infographics pdf. Use them to share invaluable insights on total sales per labor hour, total sales for all departments, average sales revenue per hour and impress your audience. This template can be altered and modified as per your expectations. So, grab it now.
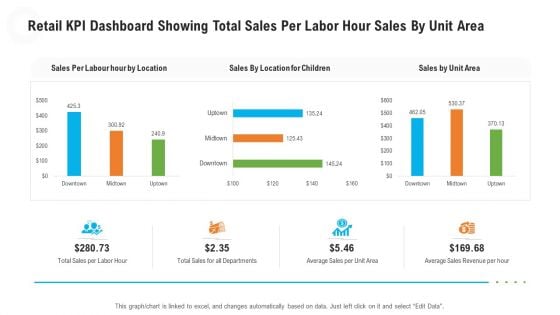
Retail KPI Dashboard Showing Total Sales Per Labor Hour Sales By Unit Area Designs PDF
Deliver and pitch your topic in the best possible manner with this retail KPI dashboard showing total sales per labor hour sales by unit area designs pdf. Use them to share invaluable insights on total sales per labor hour, total sales for all departments, average sales per unit area, average sales revenue per hour and impress your audience. This template can be altered and modified as per your expectations. So, grab it now.
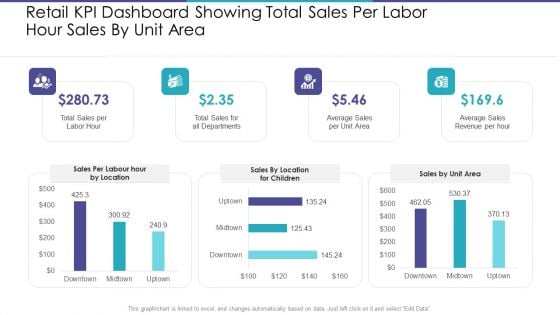
Retail KPI Dashboard Showing Total Sales Per Labor Hour Sales By Unit Area Information PDF
Deliver and pitch your topic in the best possible manner with this retail kpi dashboard showing total sales per labor hour sales by unit area information pdf. Use them to share invaluable insights on total sales for all departments, average sales per unit area, average sales revenue per hour and impress your audience. This template can be altered and modified as per your expectations. So, grab it now.
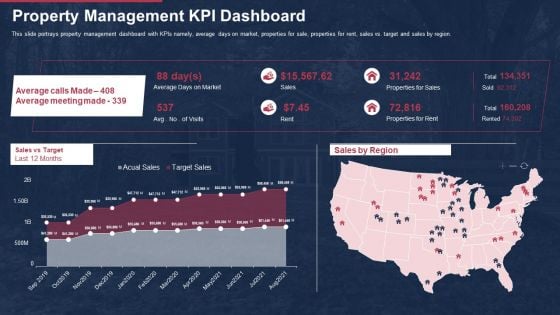
Building Promotional Campaign Real Estate Sales Property Management KPI Dashboard Rules PDF
Following slide illustrates information about the promotion strategy adopted by the firm to meet its objectives. Objectives covered in the slide are informative and persuasive promotion. Deliver an awe inspiring pitch with this creative building promotional campaign real estate sales property management kpi dashboard rules pdf bundle. Topics like process, producer, wholesalers, persuasive can be discussed with this completely editable template. It is available for immediate download depending on the needs and requirements of the user.
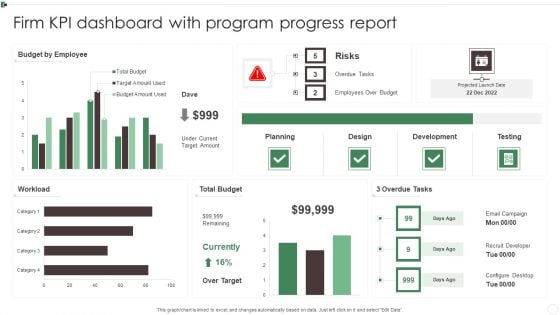
Firm KPI Dashboard With Program Progress Report Ppt Pictures Deck PDF
This graph or chart is linked to excel, and changes automatically based on data. Just left click on it and select Edit Data. Showcasing this set of slides titled Firm KPI Dashboard With Program Progress Report Ppt Pictures Deck PDF. The topics addressed in these templates are Budget By Employee, Total Budget, 3 Overdue Tasks, Workload. All the content presented in this PPT design is completely editable. Download it and make adjustments in color, background, font etc. as per your unique business setting.
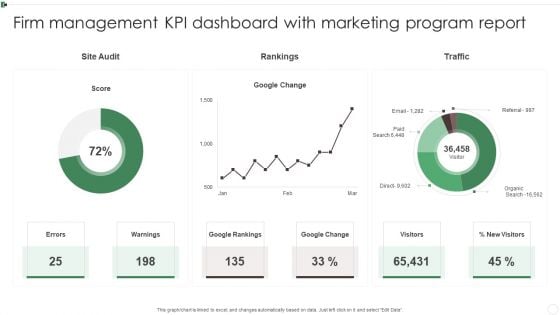
Firm Management KPI Dashboard With Marketing Program Report Ppt Styles Introduction PDF
This graph or chart is linked to excel, and changes automatically based on data. Just left click on it and select Edit Data. Showcasing this set of slides titled Firm Management KPI Dashboard With Marketing Program Report Ppt Styles Introduction PDF. The topics addressed in these templates are Google Rankings, Google Change, Warnings, Visitors. All the content presented in this PPT design is completely editable. Download it and make adjustments in color, background, font etc. as per your unique business setting.
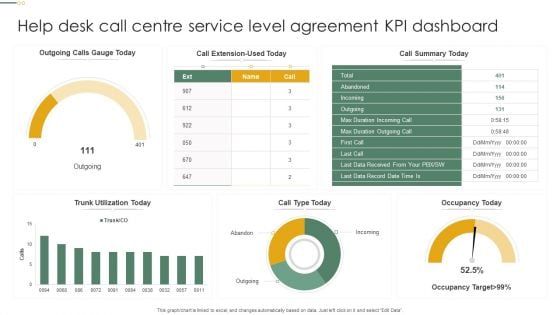
Help Desk Call Centre Service Level Agreement KPI Dashboard Pictures PDF
This graph or chart is linked to excel, and changes automatically based on data. Just left click on it and select Edit Data. Showcasing this set of slides titled Help Desk Call Centre Service Level Agreement KPI Dashboard Pictures PDF. The topics addressed in these templates are Call Type Today, Occupancy Today, Call Summary Today. All the content presented in this PPT design is completely editable. Download it and make adjustments in color, background, font etc. as per your unique business setting.
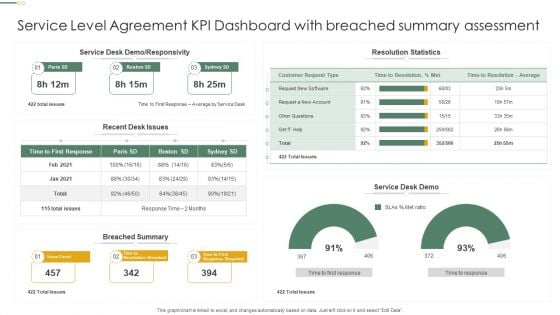
Service Level Agreement KPI Dashboard With Breached Summary Assessment Professional PDF
This graph or chart is linked to excel, and changes automatically based on data. Just left click on it and select Edit Data. Pitch your topic with ease and precision using this Service Level Agreement KPI Dashboard With Breached Summary Assessment Professional PDF. This layout presents information on Resolution Statistics, Service Desk Demo, Breached Summary. It is also available for immediate download and adjustment. So, changes can be made in the color, design, graphics or any other component to create a unique layout.
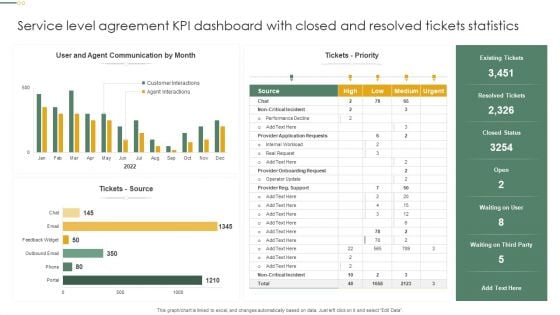
Service Level Agreement KPI Dashboard With Closed And Resolved Tickets Statistics Inspiration PDF
This graph or chart is linked to excel, and changes automatically based on data. Just left click on it and select Edit Data. Showcasing this set of slides titled Service Level Agreement KPI Dashboard With Closed And Resolved Tickets Statistics Inspiration PDF. The topics addressed in these templates are Tickets Priority, Tickets Source, Resolved Tickets. All the content presented in this PPT design is completely editable. Download it and make adjustments in color, background, font etc. as per your unique business setting.
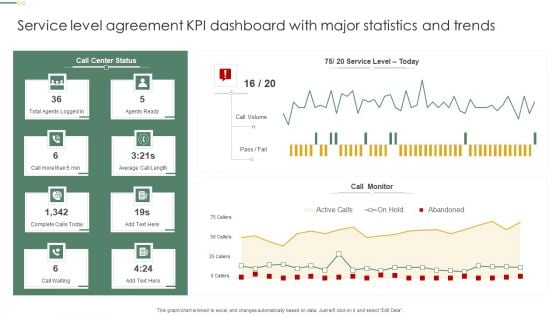
Service Level Agreement KPI Dashboard With Major Statistics And Trends Pictures PDF
This graph or chart is linked to excel, and changes automatically based on data. Just left click on it and select Edit Data. Pitch your topic with ease and precision using this Service Level Agreement KPI Dashboard With Major Statistics And Trends Pictures PDF. This layout presents information on Call Monitor, Call Volume, Agents Ready. It is also available for immediate download and adjustment. So, changes can be made in the color, design, graphics or any other component to create a unique layout.
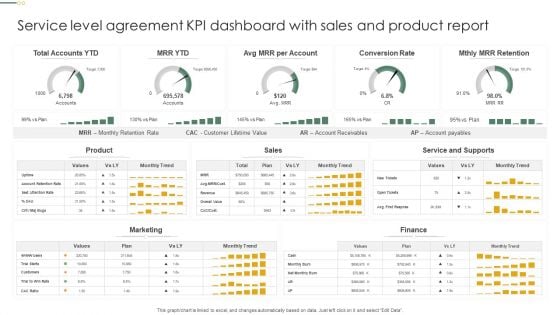
Service Level Agreement KPI Dashboard With Sales And Product Report Clipart PDF
This graph or chart is linked to excel, and changes automatically based on data. Just left click on it and select Edit Data. Showcasing this set of slides titled Service Level Agreement KPI Dashboard With Sales And Product Report Clipart PDF. The topics addressed in these templates are Total Accounts YTD, Conversion Rate, Mthly MRR Retention. All the content presented in this PPT design is completely editable. Download it and make adjustments in color, background, font etc. as per your unique business setting.
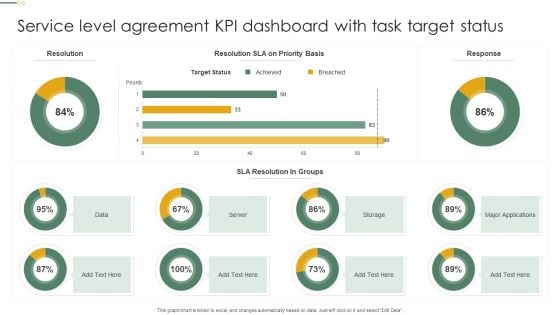
Service Level Agreement KPI Dashboard With Task Target Status Microsoft PDF
This graph or chart is linked to excel, and changes automatically based on data. Just left click on it and select Edit Data. Pitch your topic with ease and precision using this Service Level Agreement KPI Dashboard With Task Target Status Microsoft PDF. This layout presents information on Target Status, Sla Resolution, Groups, Server. It is also available for immediate download and adjustment. So, changes can be made in the color, design, graphics or any other component to create a unique layout.
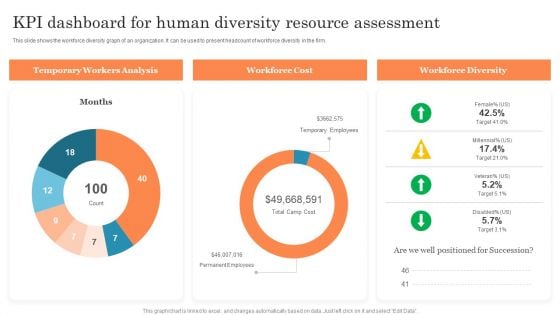
KPI Dashboard For Human Diversity Resource Assessment Ppt PowerPoint Presentation Model Vector PDF
This slide shows the workforce diversity graph of an organization. It can be used to present headcount of workforce diversity in the firm. Showcasing this set of slides titled KPI Dashboard For Human Diversity Resource Assessment Ppt PowerPoint Presentation Model Vector PDF. The topics addressed in these templates are Temporary Workers, Temporary Employees, Workforce Diversity. All the content presented in this PPT design is completely editable. Download it and make adjustments in color, background, font etc. as per your unique business setting.
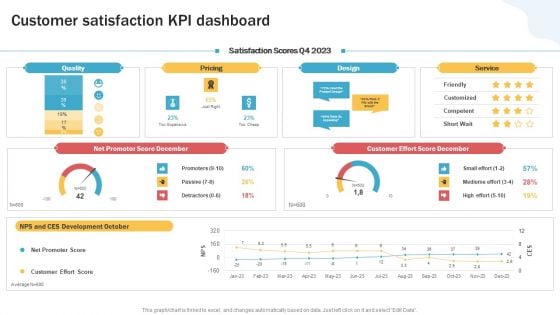
Developing Personal Brand On Social Media Channels Customer Satisfaction Kpi Dashboard Designs PDF
Make sure to capture your audiences attention in your business displays with our gratis customizable Developing Personal Brand On Social Media Channels Customer Satisfaction Kpi Dashboard Designs PDF. These are great for business strategies, office conferences, capital raising or task suggestions. If you desire to acquire more customers for your tech business and ensure they stay satisfied, create your own sales presentation with these plain slides.
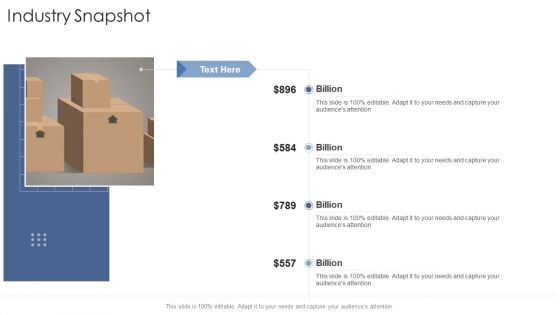
Industry Snapshot Billion Startup Business Strategy Ppt Pictures Images PDF
Presenting industry snapshot billion startup business strategy ppt pictures images pdf to provide visual cues and insights. Share and navigate important information on four stages that need your due attention. This template can be used to pitch topics like industry snapshot. In addtion, this PPT design contains high resolution images, graphics, etc, that are easily editable and available for immediate download.
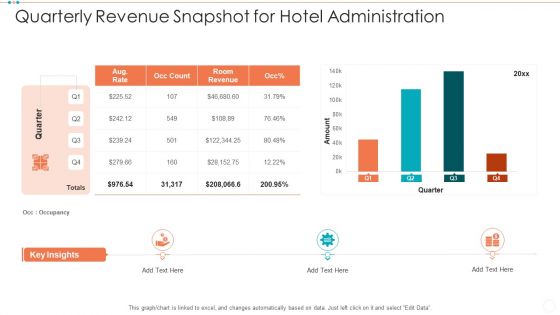
Quarterly Revenue Snapshot For Hotel Administration Structure PDF
Showcasing this set of slides titled quarterly revenue snapshot for hotel administration structure pdf. The topics addressed in these templates are quarterly revenue snapshot for hotel administration. All the content presented in this PPT design is completely editable. Download it and make adjustments in color, background, font etc. as per your unique business setting.
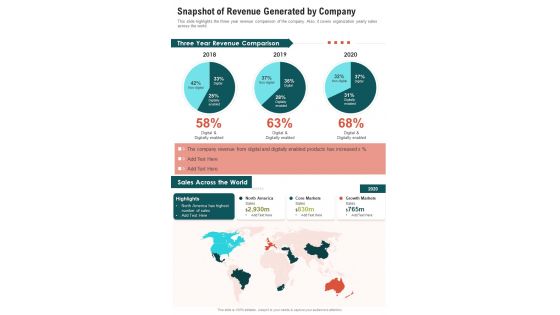
Snapshot Of Revenue Generated By Company One Pager Documents
Presenting you a fantastic Snapshot Of Revenue Generated By Company One Pager Documents. This piece is crafted on hours of research and professional design efforts to ensure you have the best resource. It is completely editable and its design allow you to rehash its elements to suit your needs. Get this Snapshot Of Revenue Generated By Company One Pager Documents A4 One-pager now.
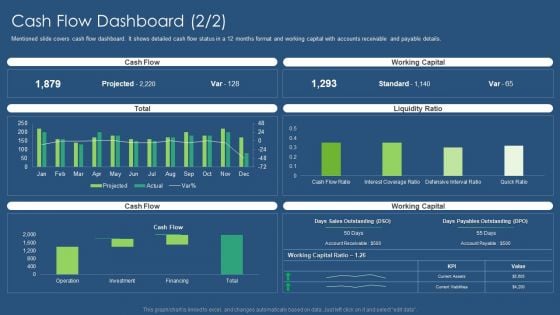
Sustainability Calculation With KPI Cash Flow Dashboard Liquidity Ratio Inspiration PDF Introduction PDF
Following slide covers cash flow dashboard covering details like beginning cash on hand, cash going in, cash going out, profit loss and ending cash on hand. It also includes detail of accounts receivable and payable. Deliver an awe inspiring pitch with this creative sustainability calculation with kpi cash flow dashboard cash designs pdf bundle. Topics like beginning cash on hand, cash going out, profit and loss, ending cash on hand can be discussed with this completely editable template. It is available for immediate download depending on the needs and requirements of the user.
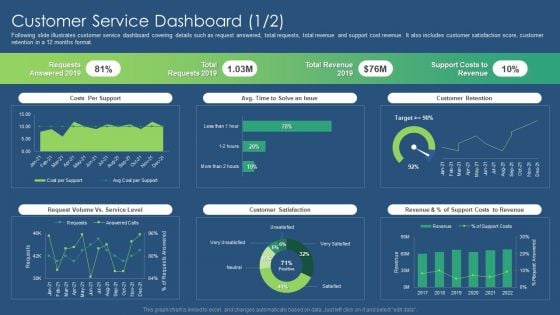
Sustainability Calculation With KPI Customer Service Dashboard Revenue Ideas PDF Graphics PDF
Following slide illustrates customer service dashboard covering details such as request answered, total requests, total revenue and support cost revenue. It also includes customer satisfaction score, customer retention in a 12 months format. Deliver and pitch your topic in the best possible manner with this sustainability calculation with kpi customer service dashboard microsoft pdf. Use them to share invaluable insights on customer satisfaction, revenue, customer retention and impress your audience. This template can be altered and modified as per your expectations. So, grab it now.
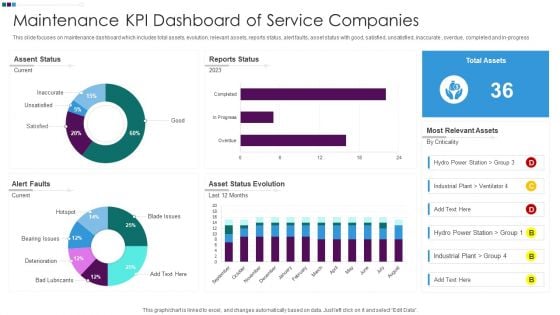
Maintenance KPI Dashboard Of Service Companies Ppt Outline Graphics Design PDF
This slide focuses on maintenance dashboard which includes total assets, evolution, relevant assets, reports status, alert faults, asset status with good, satisfied, unsatisfied, inaccurate , overdue, completed and in-progress. Pitch your topic with ease and precision using this Maintenance KPI Dashboard Of Service Companies Ppt Outline Graphics Design PDF. This layout presents information on Assent Status Current, Reports Status 2023, Asset Status Evolution. It is also available for immediate download and adjustment. So, changes can be made in the color, design, graphics or any other component to create a unique layout.
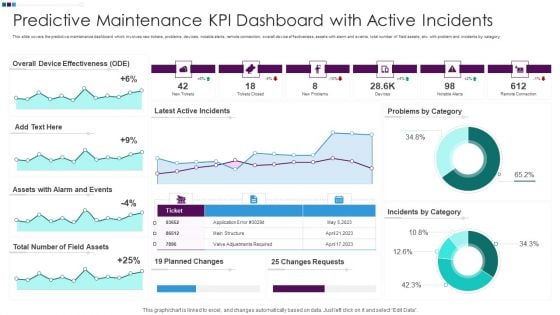
Predictive Maintenance KPI Dashboard With Active Incidents Ppt Slides Backgrounds PDF
This slide covers the predictive maintenance dashboard which involves new tickets, problems, devices, notable alerts, remote connection, overall device effectiveness, assets with alarm and events, total number of field assets, etc. with problem and incidents by category. Showcasing this set of slides titled Predictive Maintenance KPI Dashboard With Active Incidents Ppt Slides Backgrounds PDF. The topics addressed in these templates are Overall Device Effectiveness, Assets Alarm Events, Total Number Field. All the content presented in this PPT design is completely editable. Download it and make adjustments in color, background, font etc. as per your unique business setting.
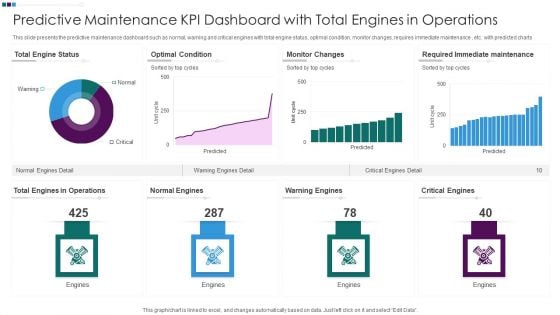
Predictive Maintenance KPI Dashboard With Total Engines In Operations Ppt Professional Inspiration PDF
This slide presents the predictive maintenance dashboard such as normal, warning and critical engines with total engine status, optimal condition, monitor changes, requires immediate maintenance , etc. with predicted charts. Pitch your topic with ease and precision using this Predictive Maintenance KPI Dashboard With Total Engines In Operations Ppt Professional Inspiration PDF. This layout presents information on Total Engine Status, Optimal Condition Monitor, Changes Warning Engines, Required Immediate Maintenance. It is also available for immediate download and adjustment. So, changes can be made in the color, design, graphics or any other component to create a unique layout.
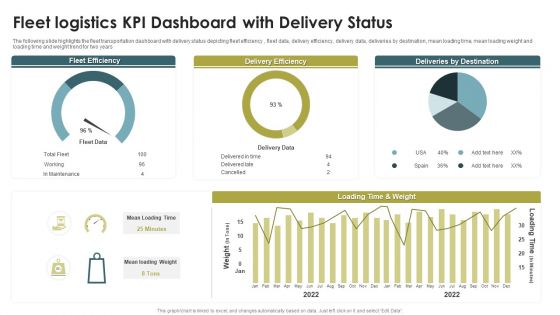
Fleet Logistics KPI Dashboard With Delivery Status Ppt Model Guide PDF
The following slide highlights the fleet transportation dashboard with delivery status depicting fleet efficiency , fleet data, delivery efficiency, delivery data, deliveries by destination, mean loading time, mean loading weight and loading time and weight trend for two years. Pitch your topic with ease and precision using this Fleet Logistics KPI Dashboard With Delivery Status Ppt Model Guide PDF. This layout presents information on Fleet Efficiency, Delivery Efficiency, Deliveries By Destination. It is also available for immediate download and adjustment. So, changes can be made in the color, design, graphics or any other component to create a unique layout.
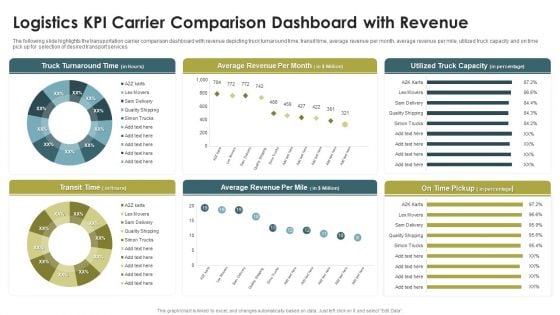
Logistics KPI Carrier Comparison Dashboard With Revenue Ppt Infographics Portfolio PDF
The following slide highlights the transportation carrier comparison dashboard with revenue depicting truck turnaround time, transit time, average revenue per month, average revenue per mile, utilized truck capacity and on time pick up for selection of desired transport services. Pitch your topic with ease and precision using this Logistics KPI Carrier Comparison Dashboard With Revenue Ppt Infographics Portfolio PDF. This layout presents information on Truck Turnaround Time, Average Revenue, Per Month, Transit Time. It is also available for immediate download and adjustment. So, changes can be made in the color, design, graphics or any other component to create a unique layout.
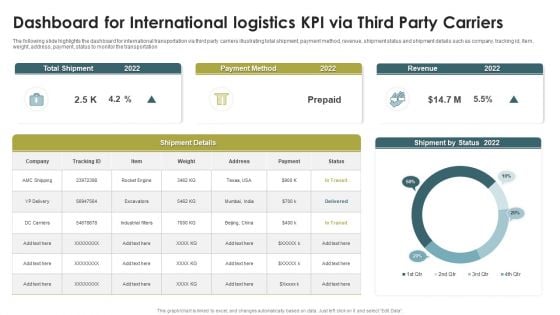
Dashboard For International Logistics KPI Via Third Party Carriers Rules PDF
The following slide highlights the dashboard for international transportation via third party carriers illustrating total shipment, payment method, revenue, shipment status and shipment details such as company, tracking id, Item, weight, address, payment, status to monitor the transportation. Showcasing this set of slides titled Dashboard For International Logistics KPI Via Third Party Carriers Rules PDF. The topics addressed in these templates are Total Shipment, Payment Method, Revenue, 20. All the content presented in this PPT design is completely editable. Download it and make adjustments in color, background, font etc. as per your unique business setting.
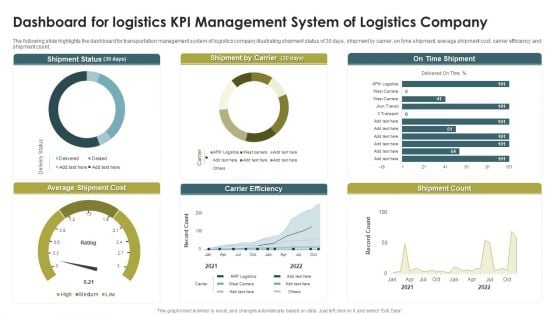
Dashboard For Logistics KPI Management System Of Logistics Company Infographics PDF
The following slide highlights the dashboard for transportation management system of logistics company illustrating shipment status of 30 days, shipment by carrier, on time shipment, average shipment cost, carrier efficiency and shipment count. Pitch your topic with ease and precision using this Dashboard For Logistics KPI Management System Of Logistics Company Infographics PDF. This layout presents information on Shipment Status, Shipment By Carrier, On Time Shipment. It is also available for immediate download and adjustment. So, changes can be made in the color, design, graphics or any other component to create a unique layout.
KPI Dashboard For Tracking Consumer Journey Touchpoints Consumer Contact Point Guide Template PDF
This slide covers a touchpoint dashboard with different customer journey stages. It also includes a detailed evaluation of each stage on the basis of experience, importance, etc. Take your projects to the next level with our ultimate collection of KPI Dashboard For Tracking Consumer Journey Touchpoints Consumer Contact Point Guide Template PDF. Slidegeeks has designed a range of layouts that are perfect for representing task or activity duration, keeping track of all your deadlines at a glance. Tailor these designs to your exact needs and give them a truly corporate look with your own brand colors they well make your projects stand out from the rest.
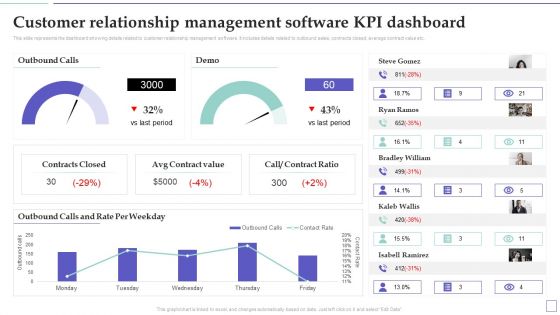
System Deployment Project Customer Relationship Management Software Kpi Dashboard Rules PDF
This slide represents the dashboard showing details related to customer relationship management software. It includes details related to outbound sales, contracts closed, average contract value etc. Present like a pro with System Deployment Project Customer Relationship Management Software Kpi Dashboard Rules PDF Create beautiful presentations together with your team, using our easy-to-use presentation slides. Share your ideas in real-time and make changes on the fly by downloading our templates. So whether youre in the office, on the go, or in a remote location, you can stay in sync with your team and present your ideas with confidence. With Slidegeeks presentation got a whole lot easier. Grab these presentations today.

Strategic Plan For Enterprise Customer Relationship Management Software KPI Dashboard Infographics PDF
This slide represents the dashboard showing details related to customer relationship management software. It includes details related to outbound sales, contracts closed, average contract value etc. Present like a pro with Strategic Plan For Enterprise Customer Relationship Management Software KPI Dashboard Infographics PDF Create beautiful presentations together with your team, using our easy-to-use presentation slides. Share your ideas in real-time and make changes on the fly by downloading our templates. So whether youre in the office, on the go, or in a remote location, you can stay in sync with your team and present your ideas with confidence. With Slidegeeks presentation got a whole lot easier. Grab these presentations today.
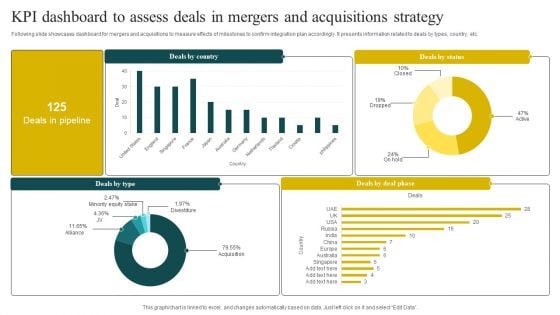
KPI Dashboard To Assess Deals In Mergers And Acquisitions Strategy Rules PDF
Following slide showcases dashboard for mergers and acquisitions to measure effects of milestones to confirm integration plan accordingly. It presents information related to deals by types, country, etc. Pitch your topic with ease and precision using this KPI Dashboard To Assess Deals In Mergers And Acquisitions Strategy Rules PDF. This layout presents information on Status, Strategy, Minority Equity Stake. It is also available for immediate download and adjustment. So, changes can be made in the color, design, graphics or any other component to create a unique layout.
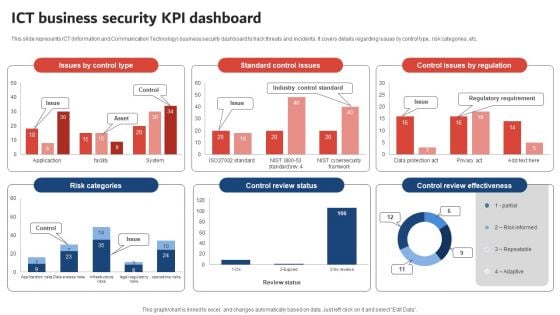
Execution Of ICT Strategic Plan ICT Business Security KPI Dashboard Designs PDF
This slide represents ICT Information and Communication Technology business security dashboard to track threats and incidents. It covers details regarding issues by control type, risk categories, etc. Boost your pitch with our creative Execution Of ICT Strategic Plan ICT Business Security KPI Dashboard Designs PDF. Deliver an awe inspiring pitch that will mesmerize everyone. Using these presentation templates you will surely catch everyones attention. You can browse the ppts collection on our website. We have researchers who are experts at creating the right content for the templates. So you do not have to invest time in any additional work. Just grab the template now and use them.
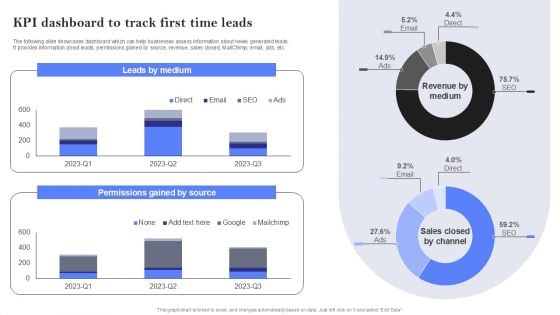
KPI Dashboard To Track First Time Leads Ppt PowerPoint Presentation File Pictures PDF
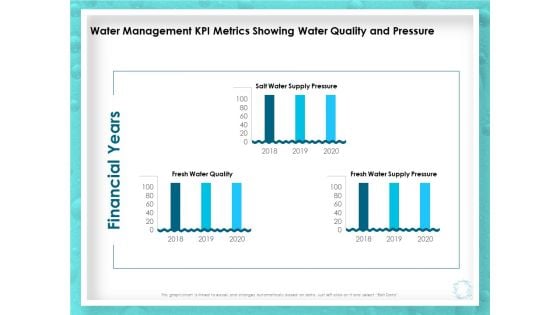
WQM System Water Management KPI Metrics Showing Water Quality And Pressure Ppt PowerPoint Presentation Model Example File PDF
Presenting this set of slides with name wqm system water management kpi metrics showing water quality and pressure ppt powerpoint presentation model example file pdf. The topics discussed in these slides are financial years, fresh water quality, fresh water supply pressure, salt water supply pressure, 2018 to 2020. This is a completely editable PowerPoint presentation and is available for immediate download. Download now and impress your audience.
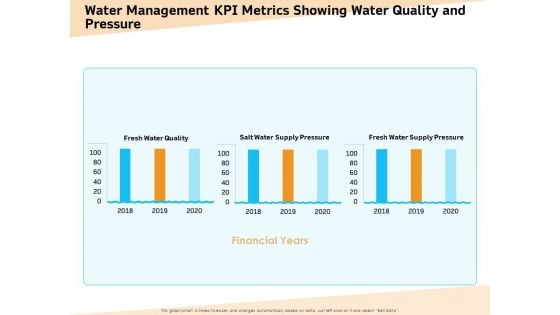
Optimization Of Water Usage Water Management KPI Metrics Showing Water Quality And Pressure Ppt Gallery Graphics PDF
Presenting this set of slides with name optimization of water usage water management kpi metrics showing water quality and pressure ppt gallery graphics pdf. The topics discussed in these slides are financial years, fresh water quality, fresh water supply pressure, salt water supply pressure, 2018 to 2020. This is a completely editable PowerPoint presentation and is available for immediate download. Download now and impress your audience.
Monitoring And Evaluating Water Quality Water Management KPI Metrics Showing Water Quality And Pressure Ppt Icon Maker PDF
Presenting this set of slides with name monitoring and evaluating water quality water management kpi metrics showing water quality and pressure ppt icon maker pdf. The topics discussed in these slides are financial years, fresh water quality, fresh water supply pressure, salt water supply pressure, 2018 to 2020. This is a completely editable PowerPoint presentation and is available for immediate download. Download now and impress your audience.
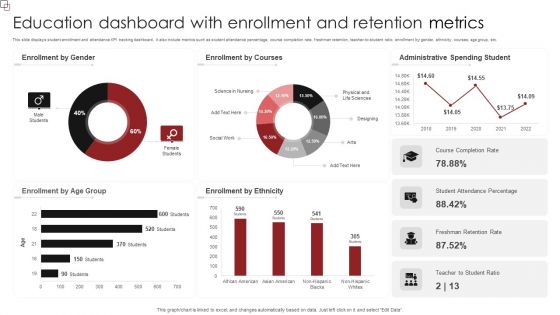
Education Dashboard With Enrollment And Retention Metrics Sample PDF
This slide displays student enrollment and attendance KPI tracking dashboard. It also include metrics such as student attendance percentage, course completion rate, freshman retention, teacher-to-student ratio, enrollment by gender, ethnicity, courses, age group, etc. Pitch your topic with ease and precision using this Education Dashboard With Enrollment And Retention Metrics Sample PDF. This layout presents information on Enrollment Gender, Enrollment Courses, Administrative Spending Student. It is also available for immediate download and adjustment. So, changes can be made in the color, design, graphics or any other component to create a unique layout.
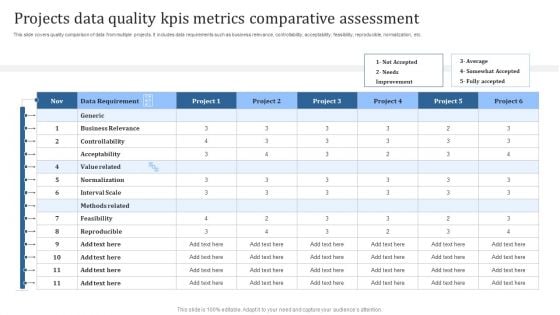
Projects Data Quality Kpis Metrics Comparative Assessment Guidelines PDF
Pitch your topic with ease and precision using this Projects Data Quality Kpis Metrics Comparative Assessment Guidelines PDF. This layout presents information on Business Relevance, Value Related, Methods Related. It is also available for immediate download and adjustment. So, changes can be made in the color, design, graphics or any other component to create a unique layout.
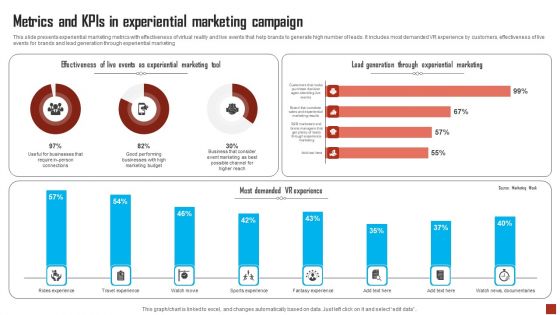
Metrics And Kpis In Experiential Marketing Campaign Structure PDF
This slide presents experiential marketing metrics with effectiveness of virtual reality and live events that help brands to generate high number of leads. It includes most demanded VR experience by customers, effectiveness of live events for brands and lead generation through experiential marketing. Pitch your topic with ease and precision using this Metrics And Kpis In Experiential Marketing Campaign Structure PDF. This layout presents information on Experiential Marketing, Business, Metrics. It is also available for immediate download and adjustment. So, changes can be made in the color, design, graphics or any other component to create a unique layout.
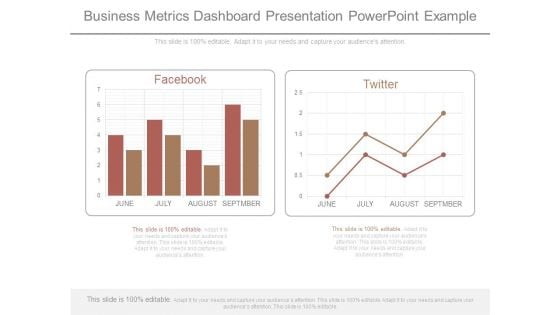
Business Metrics Dashboard Presentation Powerpoint Example
This is a business metrics dashboard presentation powerpoint example. This is a two stage process. The stages in this process are facebook, twitter.
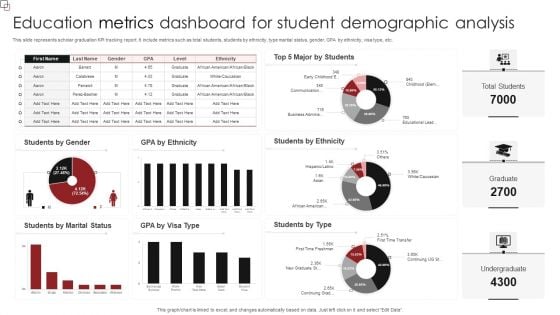
Education Metrics Dashboard For Student Demographic Analysis Diagrams PDF
This slide represents scholar graduation KPI tracking report. It include metrics such as total students, students by ethnicity, type marital status, gender, GPA by ethnicity, visa type, etc. Showcasing this set of slides titled Education Metrics Dashboard For Student Demographic Analysis Diagrams PDF. The topics addressed in these templates are Students Ethnicity, Students Type, Students Marital Status. All the content presented in this PPT design is completely editable. Download it and make adjustments in color, background, font etc. as per your unique business setting.
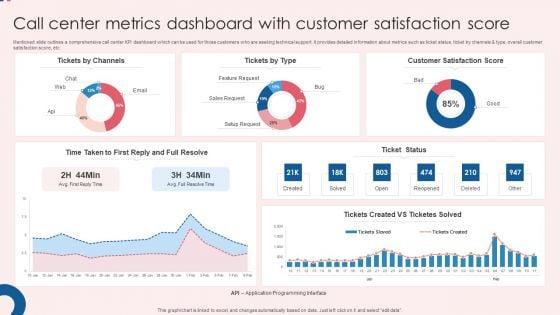
Call Center Metrics Dashboard With Customer Satisfaction Score Ideas PDF
Mentioned slide outlines a comprehensive call center KPI dashboard which can be used for those customers who are seeking technical support. It provides detailed information about metrics such as ticket status, ticket by channels and type, overall customer satisfaction score, etc. Showcasing this set of slides titled Call Center Metrics Dashboard With Customer Satisfaction Score Ideas PDF. The topics addressed in these templates are Customer Satisfaction, Score Ticket Status, Satisfaction Score. All the content presented in this PPT design is completely editable. Download it and make adjustments in color, background, font etc. as per your unique business setting.
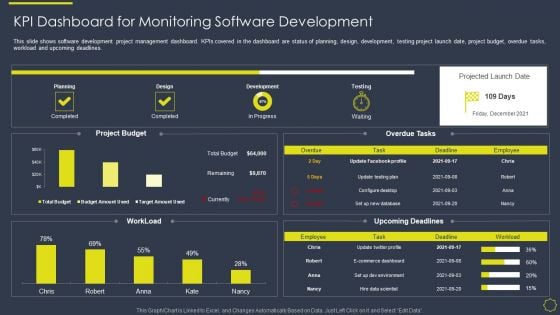
Implementing Development And Operations Platforms For In Time Product Launch IT KPI Dashboard For Monitoring Elements PDF
This slide shows software development project management dashboard. KPIs covered in the dashboard are status of planning, design, development, testing project launch date, project budget, overdue tasks, workload and upcoming deadlines. Deliver and pitch your topic in the best possible manner with this implementing development and operations platforms for in time product launch it kpi dashboard for monitoring elements pdf. Use them to share invaluable insights on development, design, development, planning and impress your audience. This template can be altered and modified as per your expectations. So, grab it now.
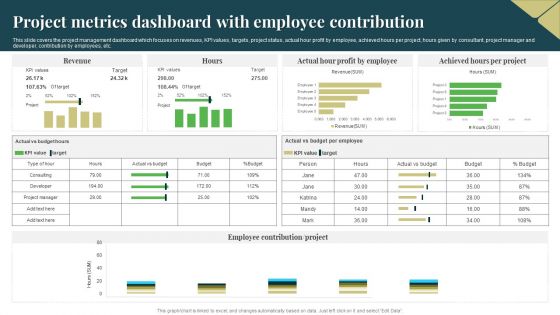
Project Metrics Dashboard With Employee Contribution Guidelines PDF
This slide covers the project management dashboard which focuses on revenues, KPI values, targets, project status, actual hour profit by employee, achieved hours per project, hours given by consultant, project manager and developer, contribution by employees, etc. Showcasing this set of slides titled Project Metrics Dashboard With Employee Contribution Guidelines PDF. The topics addressed in these templates are Target, Revenue, Profit By Employee. All the content presented in this PPT design is completely editable. Download it and make adjustments in color, background, font etc. as per your unique business setting.
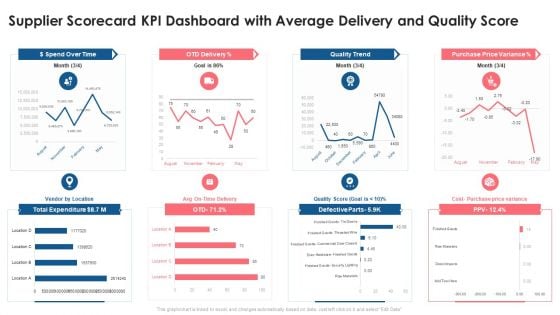
Supplier Scorecard Supplier Scorecard KPI Dashboard With Average Delivery And Quality Score Introduction PDF
This graph or chart is linked to excel, and changes automatically based on data. Just left click on it and select Edit Data. Deliver an awe inspiring pitch with this creative supplier scorecard supplier scorecard kpi dashboard with average delivery and quality score introduction pdf bundle. Topics like dollar spend over time, otd delivery, quality trend, purchase price variance, total expenditure can be discussed with this completely editable template. It is available for immediate download depending on the needs and requirements of the user.
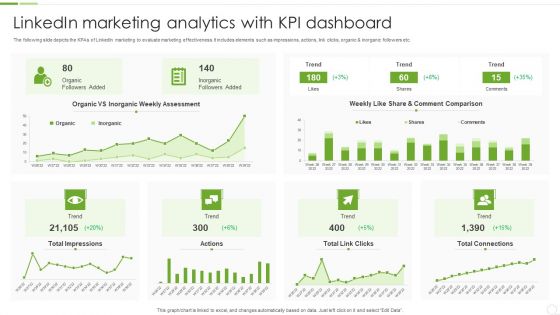
Linkedin Marketing Analytics With KPI Dashboard Ppt PowerPoint Presentation File Inspiration PDF
The following slide depicts the KPAs of LinkedIn marketing to evaluate marketing effectiveness. It includes elements such as impressions, actions, link clicks, organic and inorganic followers etc. Showcasing this set of slides titled Linkedin Marketing Analytics With KPI Dashboard Ppt PowerPoint Presentation File Inspiration PDF. The topics addressed in these templates are Total Impressions, Total Connections, Inorganic Followers Added. All the content presented in this PPT design is completely editable. Download it and make adjustments in color, background, font etc. as per your unique business setting.
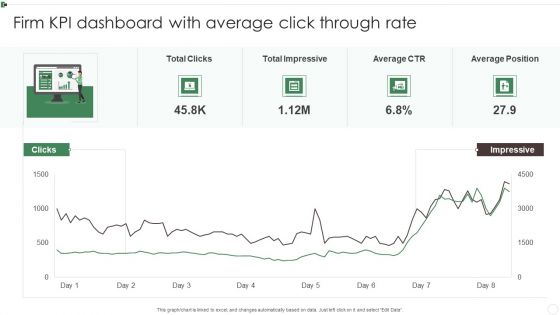
Firm KPI Dashboard With Average Click Through Rate Ppt Inspiration Sample PDF
This graph or chart is linked to excel, and changes automatically based on data. Just left click on it and select Edit Data. Pitch your topic with ease and precision using this Firm KPI Dashboard With Average Click Through Rate Ppt Inspiration Sample PDF. This layout presents information on Total Clicks, Total Impressive, Average CTR, Average Position. It is also available for immediate download and adjustment. So, changes can be made in the color, design, graphics or any other component to create a unique layout.
Market Insights Research Results With KPI Dashboard Ppt PowerPoint Presentation Icon File Formats PDF
The given below slide highlights the KPAs of market research associated with customer satisfaction. It includes net promoter score, customer effort score, monthly NPS and CES trend etc.Pitch your topic with ease and precision using this Market Insights Research Results With KPI Dashboard Ppt PowerPoint Presentation Icon File Formats PDF. This layout presents information on Satisfaction Score, Customer Effort, Customer Score. It is also available for immediate download and adjustment. So, changes can be made in the color, design, graphics or any other component to create a unique layout.
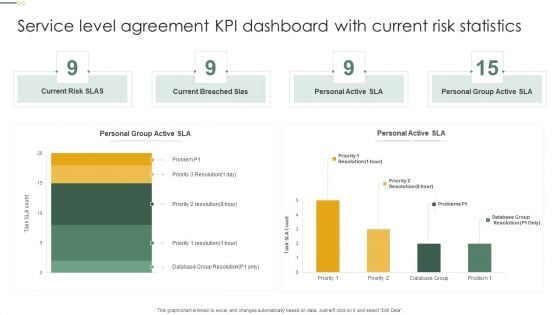
Service Level Agreement KPI Dashboard With Current Risk Statistics Topics PDF
This graph or chart is linked to excel, and changes automatically based on data. Just left click on it and select Edit Data. Pitch your topic with ease and precision using this Service Level Agreement KPI Dashboard With Current Risk Statistics Topics PDF. This layout presents information on Current Risk SLAS, Current Breached Slas, Personal Active SLA It is also available for immediate download and adjustment. So, changes can be made in the color, design, graphics or any other component to create a unique layout.


 Continue with Email

 Home
Home


