key performance indicators
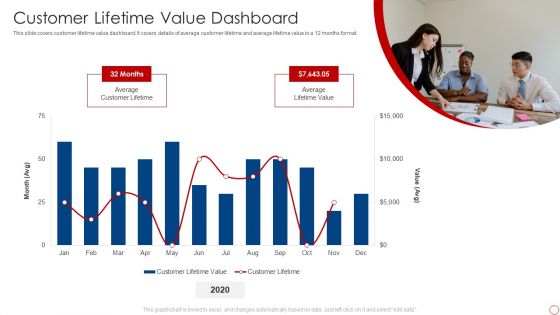
Kpis For Evaluating Business Sustainability Customer Lifetime Value Dashboard Clipart PDF
This slide covers customer lifetime value dashboard. It covers details of average customer lifetime and average lifetime value in a 12 months format. Deliver and pitch your topic in the best possible manner with this Kpis For Evaluating Business Sustainability Customer Lifetime Value Dashboard Clipart PDF. Use them to share invaluable insights on Average Customer Lifetime, Average Lifetime Value and impress your audience. This template can be altered and modified as per your expectations. So, grab it now.
WAF Platform Kpis Dashboard For Threat Tracking In WAF Demonstration PDF
This slide depicts how threat risk will be monitored and threat detection will be done in the organization through web application firewall implementation. Deliver an awe inspiring pitch with this creative WAF Platform Kpis Dashboard For Threat Tracking In WAF Demonstration PDF bundle. Topics like Current Risk Status, Threat Dashboard, Risk By Threats can be discussed with this completely editable template. It is available for immediate download depending on the needs and requirements of the user.
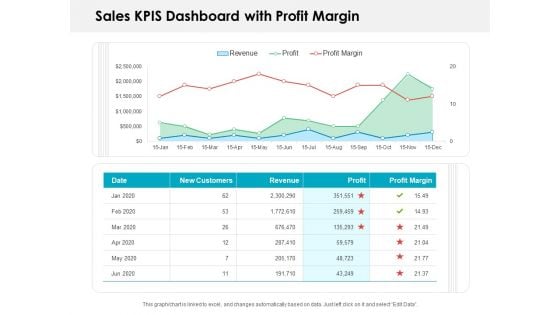
Sales KPIS Dashboard With Profit Margin Ppt PowerPoint Presentation Slides Show PDF
Presenting this set of slides with name sales kpis dashboard with profit margin ppt powerpoint presentation slides show pdf. The topics discussed in these slides are new customers, revenue, profit, profit margin. This is a completely editable PowerPoint presentation and is available for immediate download. Download now and impress your audience.
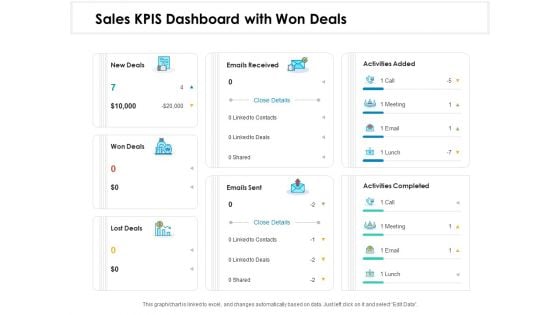
Sales KPIS Dashboard With Won Deals Ppt PowerPoint Presentation Styles Templates PDF
Presenting this set of slides with name sales kpis dashboard with won deals ppt powerpoint presentation styles templates pdf. This is a seven stage process. The stages in this process are new deals, won deals, lost deals, emails received, emails sent, activities added, activities completed. This is a completely editable PowerPoint presentation and is available for immediate download. Download now and impress your audience.
Kpis Deriving Demand Driven Manufacturing Operations Icons PDF
This slide represents the metrics which drive actions for demand driven manufacturing operations. It includes details related to operations, supplier, customer sales and quality. Showcasing this set of slides titled Kpis Deriving Demand Driven Manufacturing Operations Icons PDF. The topics addressed in these templates are Operations, Supplier, Customer Or Sales, Quality. All the content presented in this PPT design is completely editable. Download it and make adjustments in color, background, font etc. as per your unique business setting.
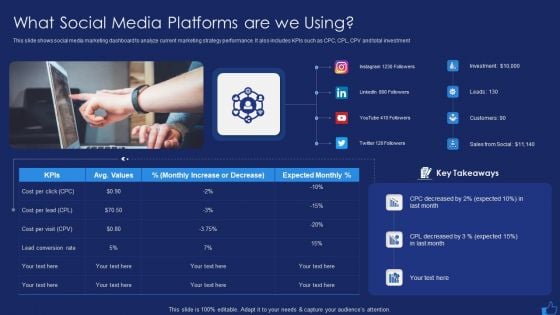
Facebook Advertising Plan For Demand Generation What Social Media Platforms Are We Using Mockup PDF
This slide shows social media marketing dashboard to analyze current marketing strategy performance. It also includes KPIs such as CPC, CPL, CPV and total investment This is a facebook advertising plan for demand generation what social media platforms are we using mockup pdf template with various stages. Focus and dispense information on one stages using this creative set, that comes with editable features. It contains large content boxes to add your information on topics like what social media platforms are we using. You can also showcase facts, figures, and other relevant content using this PPT layout. Grab it now.
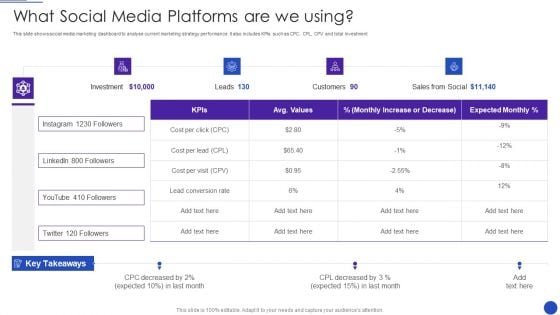
Facebook Marketing Strategies For Small Enterprise What Social Media Platforms Are We Using Topics PDF
This slide shows social media marketing dashboard to analyse current marketing strategy performance. It also includes KPIs such as CPC, CPL, CPV and total investment Deliver and pitch your topic in the best possible manner with this Facebook Marketing Strategies For Small Enterprise What Social Media Platforms Are We Using Topics PDF Use them to share invaluable insights on What Social Media Platforms Are We Using and impress your audience. This template can be altered and modified as per your expectations. So, grab it now.
HR Recruitment Dashboard Kpis With Recruitment Cost Ppt Inspiration Icons PDF
This slide showcases the recruitment dashboard of company of Hr department. It include time to hire days, cost, source, department, funnel no. of applications, male female ratio. Showcasing this set of slides titled HR Recruitment Dashboard Kpis With Recruitment Cost Ppt Inspiration Icons PDF. The topics addressed in these templates are Recruitment Funnel, Operational Dashboard, Application Date. All the content presented in this PPT design is completely editable. Download it and make adjustments in color, background, font etc. as per your unique business setting.
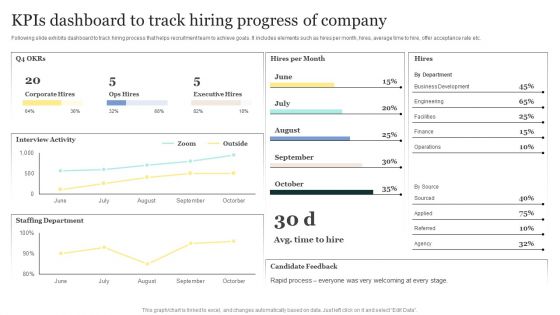
Strategic Approaches To Efficient Candidate Selection Kpis Dashboard To Track Hiring Progress Of Company Pictures PDF
Following slide exhibits dashboard to track hiring process that helps recruitment team to achieve goals. It includes elements such as hires per month, hires, average time to hire, offer acceptance rate etc. Explore a selection of the finest Strategic Approaches To Efficient Candidate Selection Kpis Dashboard To Track Hiring Progress Of Company Pictures PDF here. With a plethora of professionally designed and pre-made slide templates, you can quickly and easily find the right one for your upcoming presentation. You can use our Strategic Approaches To Efficient Candidate Selection Kpis Dashboard To Track Hiring Progress Of Company Pictures PDF to effectively convey your message to a wider audience. Slidegeeks has done a lot of research before preparing these presentation templates. The content can be personalized and the slides are highly editable. Grab templates today from Slidegeeks.
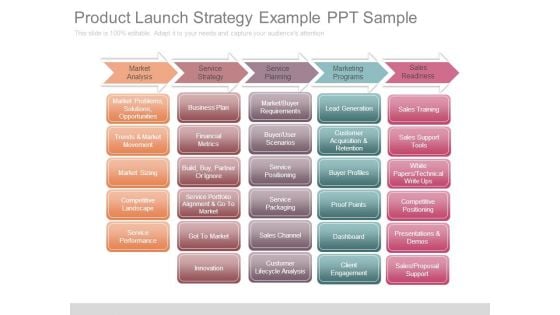
Product Launch Strategy Example Ppt Sample
This is a product launch strategy example ppt sample. This is a five stage process. The stages in this process are market analysis, service strategy, service planning, marketing programs, sales readiness, market problems solutions opportunities, trends and market movement, market sizing, competitive landscape, service performance, business plan, financial metrics, build buy partner or ignore, service portfolio alignment and go to market, got to market, innovation, market buyer requirements, buyer user scenarios, service positioning, service packaging, sales channel, customer lifecycle analysis, lead generation, customer acquisition and retention, buyer profiles, proof points, dashboard, client engagement, sales training, sales support tools, white papers technical write ups, competitive positioning, presentations and demos, sales proposal support.
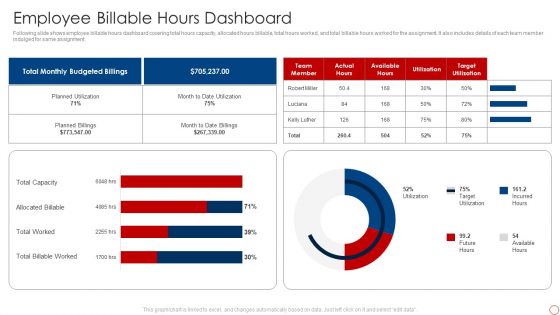
Kpis For Evaluating Business Sustainability Employee Billable Hours Dashboard Professional PDF
Following slide shows employee billable hours dashboard covering total hours capacity, allocated hours billable, total hours worked, and total billable hours worked for the assignment. It also includes details of each team member indulged for same assignment. Deliver and pitch your topic in the best possible manner with this Kpis For Evaluating Business Sustainability Employee Billable Hours Dashboard Professional PDF. Use them to share invaluable insights on Total Billable Worked, Total Worked, Allocated Billable, Total Capacity and impress your audience. This template can be altered and modified as per your expectations. So, grab it now.
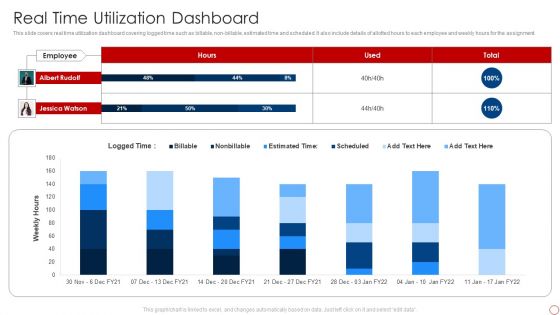
Kpis For Evaluating Business Sustainability Real Time Utilization Dashboard Portrait PDF
This slide covers real time utilization dashboard covering logged time such as billable, non-billable, estimated time and scheduled. It also include details of allotted hours to each employee and weekly hours for the assignment. Deliver an awe inspiring pitch with this creative Kpis For Evaluating Business Sustainability Real Time Utilization Dashboard Portrait PDF bundle. Topics like Logged Time, Employee, Albert Rudolf can be discussed with this completely editable template. It is available for immediate download depending on the needs and requirements of the user.
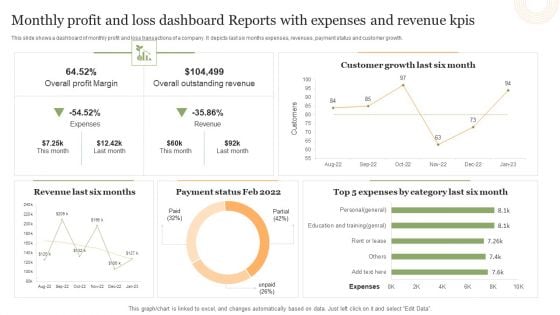
Monthly Profit And Loss Dashboard Reports With Expenses And Revenue Kpis Portrait PDF
This slide shows a dashboard of monthly profit and loss transactions of a company. It depicts last six months expenses, revenues, payment status and customer growth.Showcasing this set of slides titled Monthly Profit And Loss Dashboard Reports With Expenses And Revenue Kpis Portrait PDF. The topics addressed in these templates are Overall Profit Margin, Overall Outstanding Revenue, Customer Growth. All the content presented in this PPT design is completely editable. Download it and make adjustments in color, background, font etc. as per your unique business setting.
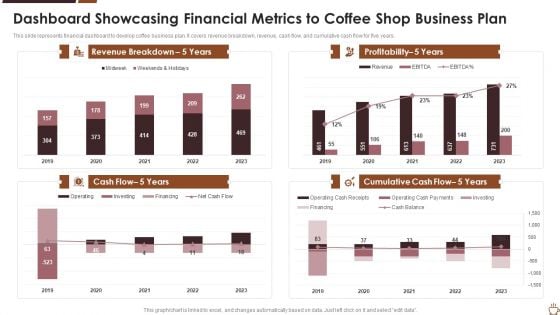
Dashboard Showcasing Financial Metrics To Coffee Shop Business Plan Background PDF
This slide represents financial dashboard to develop coffee business plan. It covers revenue breakdown, revenue, cash flow, and cumulative cash flow for five years. Showcasing this set of slides titled dashboard showcasing financial metrics to coffee shop business plan background pdf. The topics addressed in these templates are dashboard showcasing financial metrics to coffee shop business plan. All the content presented in this PPT design is completely editable. Download it and make adjustments in color, background, font etc. as per your unique business setting.
Accelerator Meter Speed Icon Ppt Powerpoint Presentation Professional Good
This is a accelerator meter speed icon ppt powerpoint presentation professional good. This is a three stage process. The stages in this process are accelerator, seed accelerators, startup accelerator.
Accelerator Speed Meter Icon Ppt Powerpoint Presentation Outline Layout
This is a accelerator speed meter icon ppt powerpoint presentation outline layout. This is a four stage process. The stages in this process are accelerator, seed accelerators, startup accelerator.
Speed Level Meter Icon Ppt Powerpoint Presentation Inspiration Slides
This is a speed level meter icon ppt powerpoint presentation inspiration slides. This is a four stage process. The stages in this process are accelerator, seed accelerators, startup accelerator.
Speed Meter Vector Icon Ppt Powerpoint Presentation Model Inspiration
This is a speed meter vector icon ppt powerpoint presentation model inspiration. This is a four stage process. The stages in this process are accelerator, seed accelerators, startup accelerator.
Strategic Kpis Ppt PowerPoint Presentation Layouts Templates
This is a strategic kpis ppt powerpoint presentation layouts templates. This is a two stage process. The stages in this process are strategic kpis.
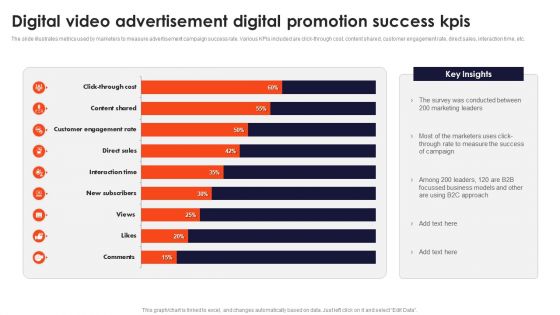
Digital Video Advertisement Digital Promotion Success Kpis Formats PDF
The slide illustrates metrics used by marketers to measure advertisement campaign success rate. Various KPIs included are click-through cost, content shared, customer engagement rate, direct sales, interaction time, etc. Showcasing this set of slides titled Digital Video Advertisement Digital Promotion Success Kpis Formats PDF. The topics addressed in these templates are Digital Video, Advertisement Digital, Promotion Success Kpis. All the content presented in this PPT design is completely editable. Download it and make adjustments in color, background, font etc. as per your unique business setting.
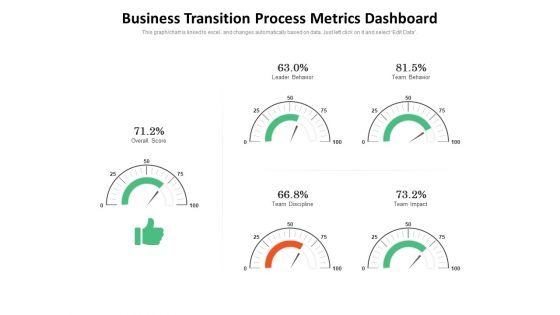
Business Transition Process Metrics Dashboard Ppt PowerPoint Presentation Slides Inspiration PDF
Presenting this set of slides with name business transition process metrics dashboard ppt powerpoint presentation slides inspiration pdf. The topics discussed in these slides are team behavior, leader behavior, team impact, team discipline, overall score. This is a completely editable PowerPoint presentation and is available for immediate download. Download now and impress your audience.
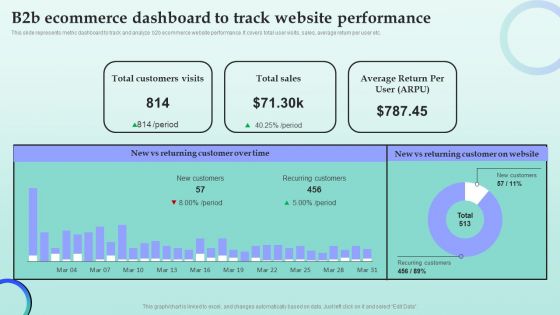
Strategies For Successful Customer Base Development In B2b M Commerce B2b Ecommerce Dashboard To Track Website Sample PDF
This slide represents metric dashboard to track and analyze b2b ecommerce website performance. It covers total user visits, sales, average return per user etc. If you are looking for a format to display your unique thoughts, then the professionally designed Strategies For Successful Customer Base Development In B2b M Commerce B2b Ecommerce Dashboard To Track Website Sample PDF is the one for you. You can use it as a Google Slides template or a PowerPoint template. Incorporate impressive visuals, symbols, images, and other charts. Modify or reorganize the text boxes as you desire. Experiment with shade schemes and font pairings. Alter, share or cooperate with other people on your work. Download Strategies For Successful Customer Base Development In B2b M Commerce B2b Ecommerce Dashboard To Track Website Sample PDF and find out how to give a successful presentation. Present a perfect display to your team and make your presentation unforgettable.
Customer Relationship Management CRM Dashboard For Tracking Sales Pipeline Brochure PDF
This slide covers the CRM KPI dashboard for monitoring lead status in the sales funnel. It includes metrics such as open pipeline value, open pipeline by product package, pipeline value forecast, etc. Deliver an awe inspiring pitch with this creative Customer Relationship Management CRM Dashboard For Tracking Sales Pipeline Brochure PDF bundle. Topics like Pipeline Value, Pipeline Value, Product Package can be discussed with this completely editable template. It is available for immediate download depending on the needs and requirements of the user.
Online Customer Interaction Dashboard For Tracking Social Media Platforms Infographics PDF
This slide covers the KPI dashboard for analyzing social media channels. It includes metrics such as social media followers, Facebook daily reach, Facebook engaged users and page impressions, etc. Deliver and pitch your topic in the best possible manner with this Online Customer Interaction Dashboard For Tracking Social Media Platforms Infographics PDF. Use them to share invaluable insights on Awareness, Daily Reach, Impression Final and impress your audience. This template can be altered and modified as per your expectations. So, grab it now.
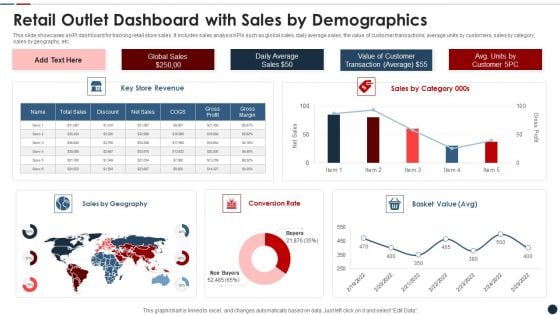
Retail Outlet Dashboard With Sales By Demographics Slides PDF
This slide showcases a KPI dashboard for tracking retail store sales. It includes sales analysis KPIs such as global sales, daily average sales, the value of customer transactions, average units by customers, sales by category, sales by geography, etc. Showcasing this set of slides titled retail outlet dashboard with sales by demographics slides pdf The topics addressed in these templates are Retail outlet dashboard with sales by demographics All the content presented in this PPT design is completely editable. Download it and make adjustments in color, background, font etc. as per your unique business setting.
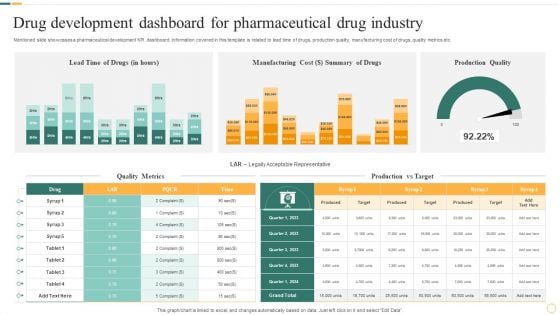
Drug Development Dashboard For Pharmaceutical Drug Industry Portrait PDF
Mentioned slide showcases a pharmaceutical development KPI dashboard. Information covered in this template is related to lead time of drugs, production quality, manufacturing cost of drugs, quality metrics etc. Showcasing this set of slides titled Drug Development Dashboard For Pharmaceutical Drug Industry Portrait PDF. The topics addressed in these templates are Manufacturing Cost, Summary Of Drugs, Production Quality. All the content presented in this PPT design is completely editable. Download it and make adjustments in color, background, font etc. as per your unique business setting.
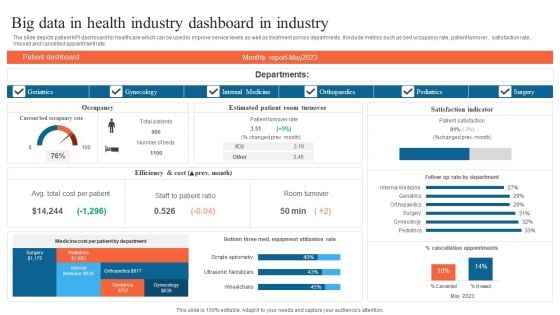
Big Data In Health Industry Dashboard In Industry Summary PDF
The slide depicts patient KPI dashboard for healthcare which can be used to improve service levels as well as treatment across departments. It include metrics such as bed occupancy rate, patient turnover, satisfaction rate, missed and cancelled appointment rate. Showcasing this set of slides titled Big Data In Health Industry Dashboard In Industry Summary PDF. The topics addressed in these templates are Geriatrics, Gynecology, Internal Medicine. All the content presented in this PPT design is completely editable. Download it and make adjustments in color, background, font etc. as per your unique business setting.
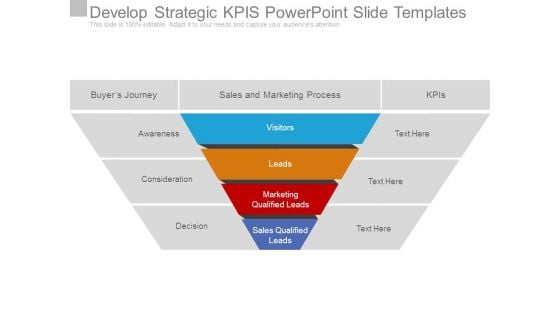
Develop Strategic Kpis Powerpoint Slide Templates
This is a develop strategic kpis powerpoint slide templates. This is a four stage process. The stages in this process are visitors, leads, marketing qualified leads, sales qualified leads, buyer s journey, sales and marketing process, kpis, awareness, consideration, decision.
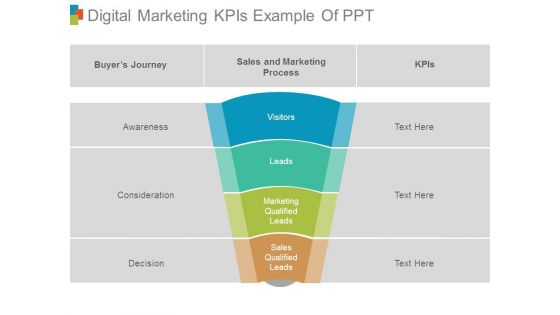
Digital Marketing Kpis Example Of Ppt
This is a digital marketing kpis example of ppt. This is a four stage process. The stages in this process are buyer journey, sales and marketing process, kpis, awareness, consideration, decision, visitors, leads, marketing qualified leads, sales qualified leads.
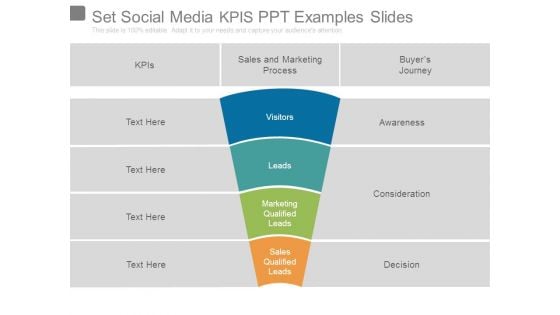
Set Social Media Kpis Ppt Examples Slides
This is a set social media kpis ppt examples slides. This is a four stage process. The stages in this process are kpis, sales and marketing process, buyers journey, visitors, leads, marketing qualified leads, sales qualified leads, awareness, consideration, decision.
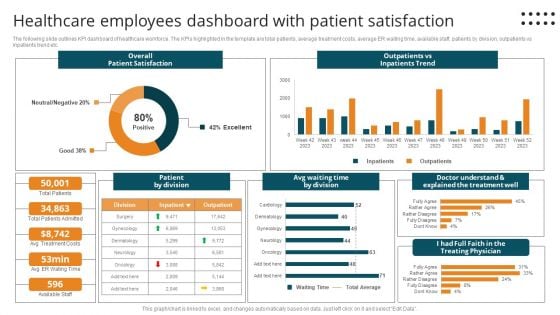
Healthcare Employees Dashboard With Patient Satisfaction Mockup PDF
The following slide outlines KPI dashboard of healthcare workforce. The KPIs highlighted in the template are total patients, average treatment costs, average ER waiting time, available staff, patients by division, outpatients vs inpatients trend etc.Pitch your topic with ease and precision using this Healthcare Employees Dashboard With Patient Satisfaction Mockup PDF. This layout presents information on Patient Satisfaction, Outpatients Inpatients Trend, Doctor Understand. It is also available for immediate download and adjustment. So, changes can be made in the color, design, graphics or any other component to create a unique layout.
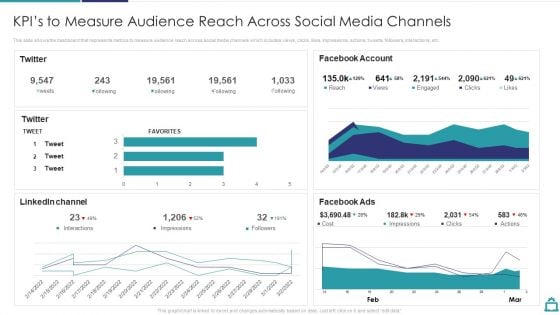
Deploying B2C Social Media Kpis To Measure Audience Reach Across Social Media Channels Introduction PDF
This slide shows the dashboard that represents metrics to measure audience reach across social media channels which includes views, clicks, likes, impressions, actions, tweets, followers, interactions, etc.Deliver an awe inspiring pitch with this creative Deploying B2C Social Media Kpis To Measure Audience Reach Across Social Media Channels Introduction PDF bundle. Topics like Facebook Account, Linkedin Channel, Facebook Ads can be discussed with this completely editable template. It is available for immediate download depending on the needs and requirements of the user.
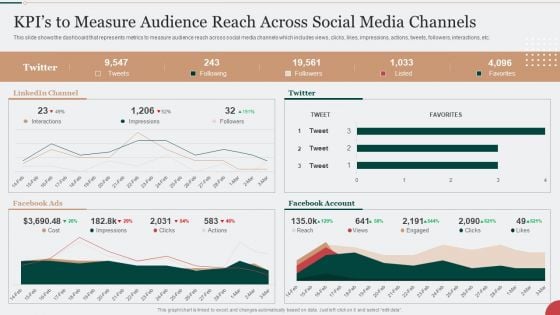
Kpis To Measure Audience Reach Across Social Media Channels Formats PDF
This slide shows the dashboard that represents metrics to measure audience reach across social media channels which includes views, clicks, likes, impressions, actions, tweets, followers, interactions, etc. Deliver an awe inspiring pitch with this creative Kpis To Measure Audience Reach Across Social Media Channels Formats PDF bundle. Topics like Social Media Channels, Measure Audience can be discussed with this completely editable template. It is available for immediate download depending on the needs and requirements of the user.
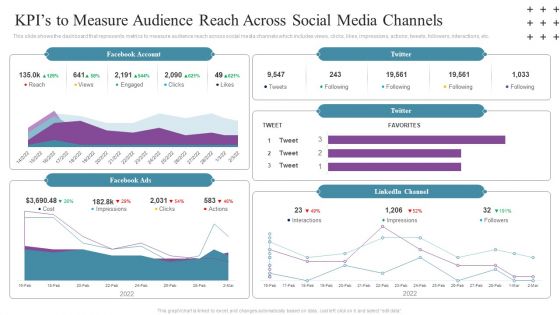
Social Networking Program Kpis To Measure Audience Reach Across Social Media Channels Summary PDF
This slide shows the dashboard that represents metrics to measure audience reach across social media channels which includes views, clicks, likes, impressions, actions, tweets, followers, interactions, etc. Deliver an awe inspiring pitch with this creative Social Networking Program Kpis To Measure Audience Reach Across Social Media Channels Summary PDF bundle. Topics like Facebook Account, 2022, Reach can be discussed with this completely editable template. It is available for immediate download depending on the needs and requirements of the user.
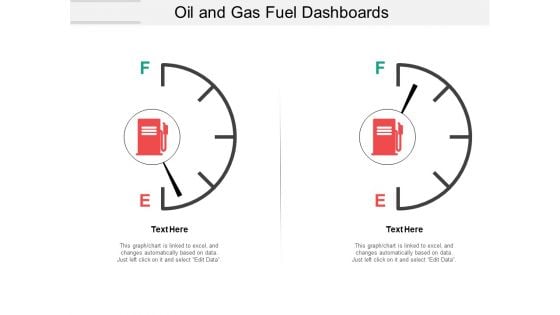
Oil And Gas Fuel Dashboards Ppt PowerPoint Presentation File Introduction
This is a oil and gas fuel dashboards ppt powerpoint presentation file introduction. This is a two stage process. The stages in this process are fuel gauge, gas gauge, fuel containers.
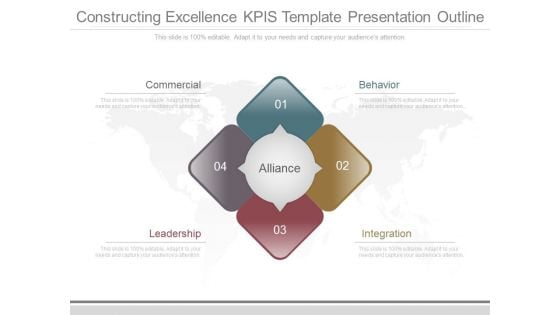
Constructing Excellence Kpis Template Presentation Outline
This is a constructing excellence kpis template presentation outline. This is a four stage process. The stages in this process are commercial, behavior, leadership, integration, alliance.
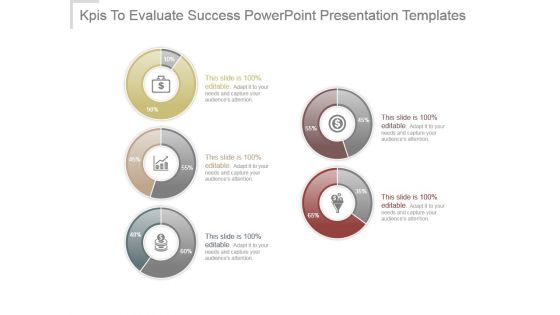
Kpis To Evaluate Success Powerpoint Presentation Templates
This is a kpis to evaluate success powerpoint presentation templates. This is a five stage process. The stages in this process are business, marketing, finance, icons, strategy.
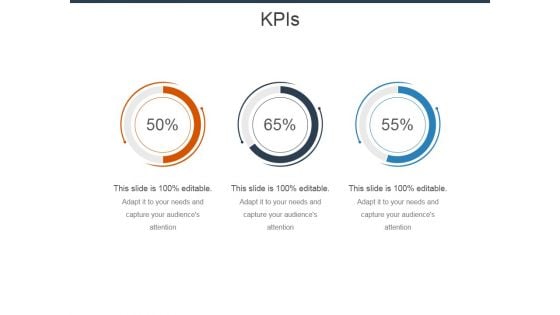
Kpis Ppt Powerpoint Presentation Slides Vector
This is a kpis ppt powerpoint presentation slides vector. This is a three stage process. The stages in this process are planning, marketing, business, management, strategy.
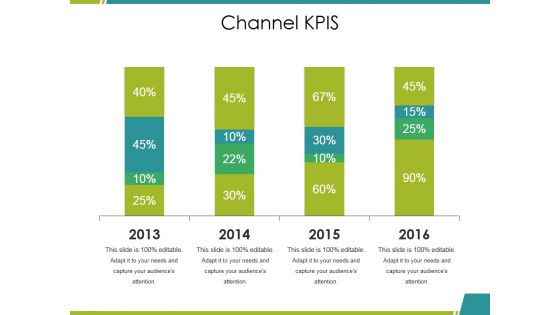
Channel Kpis Ppt PowerPoint Presentation Inspiration Aids
This is a channel kpis ppt powerpoint presentation inspiration aids. This is a four stage process. The stages in this process are business, marketing, graph, percentage, finance.
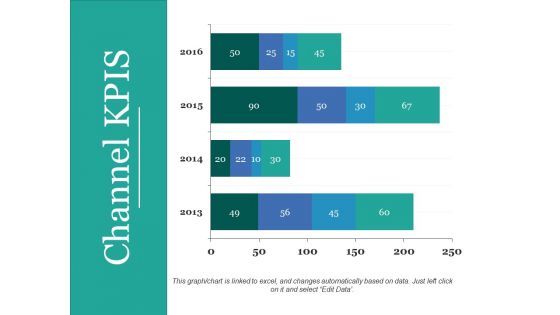
Channel KPIS Ppt PowerPoint Presentation Ideas Topics
This is a channel kpis ppt powerpoint presentation ideas topics. This is a four stage process. The stages in this process are years, business, marketing, finance, graph.
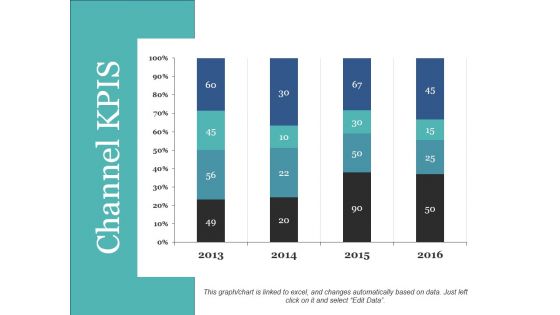
Channel Kpis Ppt PowerPoint Presentation Professional Inspiration
This is a channel kpis ppt powerpoint presentation professional inspiration. This is a four stage process. The stages in this process are bar graph, marketing, finance, strategy, planning.
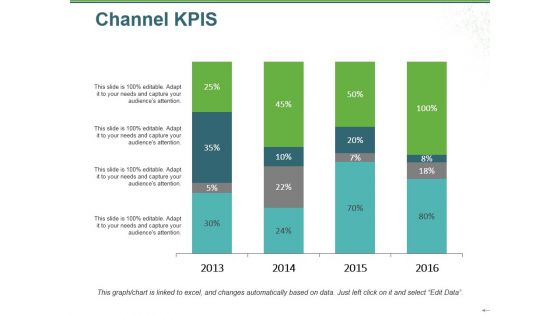
Channel Kpis Ppt PowerPoint Presentation Model Smartart
This is a channel kpis ppt powerpoint presentation model smartart. This is a four stage process. The stages in this process are business, marketing, finance, years, percentage.
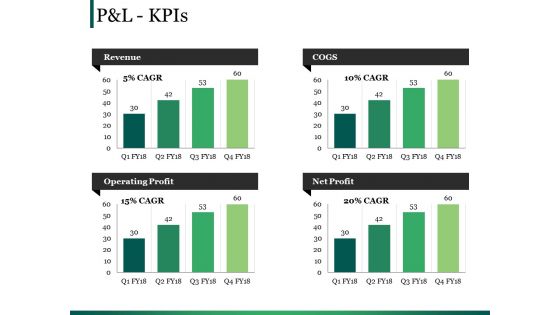
Pandl Kpis Ppt PowerPoint Presentation Outline Gallery
This is a pandl kpis ppt powerpoint presentation outline gallery. This is a four stage process. The stages in this process are revenue, cogs, operating profit, net profit.
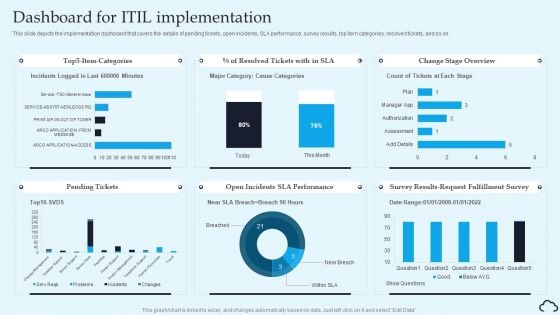
Dashboard For ITIL Implementation IT Service Management Framework Introduction PDF
This slide depicts the implementation dashboard that covers the details of pending tickets, open incidents, SLA performance, survey results, top item categories, resolved tickets, and so on.Retrieve professionally designed Dashboard For ITIL Implementation IT Service Management Framework Introduction PDF to effectively convey your message and captivate your listeners. Save time by selecting pre-made slideshows that are appropriate for various topics, from business to educational purposes. These themes come in many different styles, from creative to corporate, and all of them are easily adjustable and can be edited quickly. Access them as PowerPoint templates or as Google Slides themes. You do not have to go on a hunt for the perfect presentation because Slidegeeks got you covered from everywhere.
Budget Deficit Evaluation Kpis Icon Elements PDF
Presenting Budget Deficit Evaluation Kpis Icon Elements PDF to dispense important information. This template comprises Four stages. It also presents valuable insights into the topics including Budget Deficit, Evaluation Kpis Icon. This is a completely customizable PowerPoint theme that can be put to use immediately. So, download it and address the topic impactfully.
Scrum Service Management Kpis Icon Ideas PDF
Presenting Scrum Service Management Kpis Icon Ideas PDF to dispense important information. This template comprises Three stages. It also presents valuable insights into the topics including Scrum Service, Management Kpis Icon. This is a completely customizable PowerPoint theme that can be put to use immediately. So, download it and address the topic impactfully.
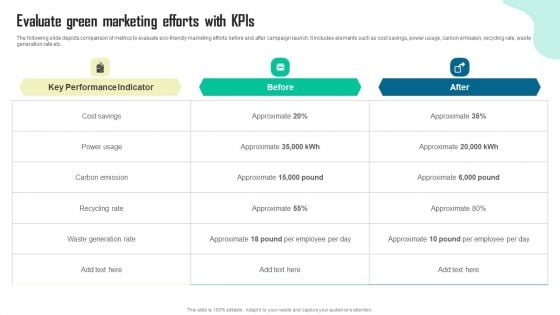
Evaluate Green Marketing Efforts With Kpis Portrait PDF
The following slide depicts comparison of metrics to evaluate eco-friendly marketing efforts before and after campaign launch. It includes elements such as cost savings, power usage, carbon emission, recycling rate, waste generation rate etc. Take your projects to the next level with our ultimate collection of Evaluate Green Marketing Efforts With Kpis Portrait PDF. Slidegeeks has designed a range of layouts that are perfect for representing task or activity duration, keeping track of all your deadlines at a glance. Tailor these designs to your exact needs and give them a truly corporate look with your own brand colors they will make your projects stand out from the rest.
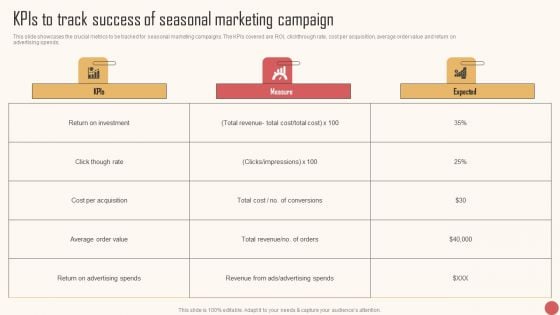
Kpis To Track Success Of Seasonal Marketing Campaign Graphics PDF
This slide showcases the crucial metrics to be tracked for seasonal marketing campaigns. The KPIs covered are ROI, clickthrough rate, cost per acquisition, average order value and return on advertising spends. Present like a pro with Kpis To Track Success Of Seasonal Marketing Campaign Graphics PDF Create beautiful presentations together with your team, using our easy-to-use presentation slides. Share your ideas in real-time and make changes on the fly by downloading our templates. So whether you are in the office, on the go, or in a remote location, you can stay in sync with your team and present your ideas with confidence. With Slidegeeks presentation got a whole lot easier. Grab these presentations today.
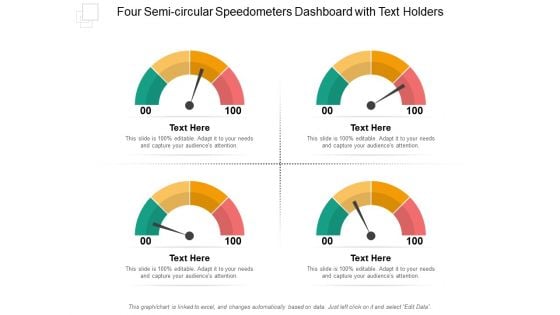
Four Semi Circular Speedometers Dashboard With Text Holders Ppt PowerPoint Presentation File Layouts
This is a four semi circular speedometers dashboard with text holders ppt powerpoint presentation file layouts. This is a four stage process. The stages in this process are fuel gauge, gas gauge, fuel containers.

Car Dashboard And Speedometer Graphics Ppt PowerPoint Presentation File Graphics Template
This is a car dashboard and speedometer graphics ppt powerpoint presentation file graphics template. This is a four stage process. The stages in this process are fuel gauge, gas gauge, fuel containers.
Fuel Dashboards Showing Empty And Full Levels Ppt PowerPoint Presentation Professional Slide Portrait
This is a fuel dashboards showing empty and full levels ppt powerpoint presentation professional slide portrait. This is a four stage process. The stages in this process are fuel gauge, gas gauge, fuel containers.
Semi Circular Fuel Dashboard With Pointer In Centre Ppt PowerPoint Presentation Outline Visuals
This is a semi circular fuel dashboard with pointer in centre ppt powerpoint presentation outline visuals. This is a three stage process. The stages in this process are fuel gauge, gas gauge, fuel containers.
Levels Of Human Resource Business Metrics Pyramid Icons PDF
The slide showcases the HR metrics pyramid to ensure the implementation of excellent talent-related program. It covers KPIs in three levels HR strategy, program and operating. Persuade your audience using this Levels Of Human Resource Business Metrics Pyramid Icons PDF. This PPT design covers three stages, thus making it a great tool to use. It also caters to a variety of topics including HR Strategy Metrics, HR Program Metrics, HR Operating Metrics. Download this PPT design now to present a convincing pitch that not only emphasizes the topic but also showcases your presentation skills.
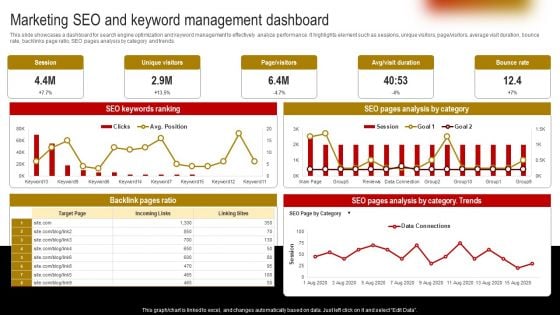
Marketing Seo And Keyword Management Dashboard Themes PDF
This slide showcases a dashboard for search engine optimization and keyword management to effectively analyze performance. It highlights element such as sessions, unique visitors, page or visitors, average visit duration, bounce rate, backlinks page ratio, SEO pages analysis by category and trends. Get a simple yet stunning designed Marketing Seo And Keyword Management Dashboard Themes PDF. It is the best one to establish the tone in your meetings. It is an excellent way to make your presentations highly effective. So, download this PPT today from Slidegeeks and see the positive impacts. Our easy to edit Marketing Seo And Keyword Management Dashboard Themes PDF can be your go to option for all upcoming conferences and meetings. So, what are you waiting for Grab this template today.
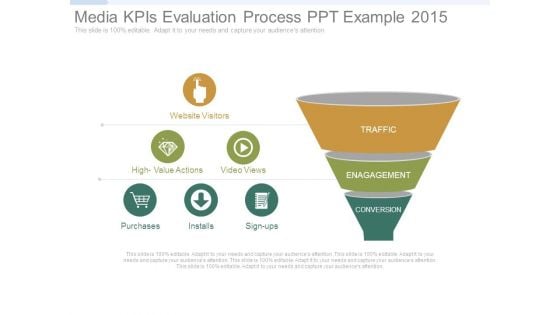
Media Kpis Evaluation Process Ppt Example 2015
This is a media kpis evaluation process ppt example 2015. This is a three stage process. The stages in this process are traffic, engagement, conversion, website visitors, high value actions, video views, purchases, installs, sign ups.
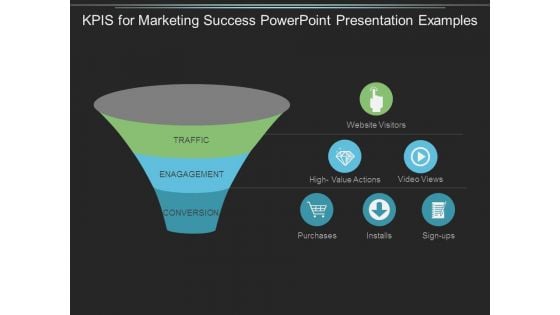
Kpis For Marketing Success Powerpoint Presentation Examples
This is a kpis for marketing success powerpoint presentation examples. This is a three stage process. The stages in this process are traffic, enagagement, conversion, website visitors, high value actions, video views, purchases, installs.
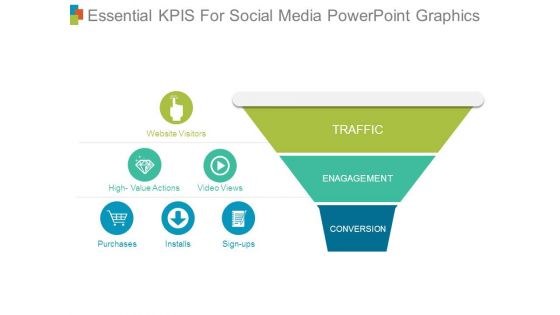
Essential Kpis For Social Media Powerpoint Graphics
This is a essential kpis for social media powerpoint graphics. This is a three stage process. The stages in this process are website visitors, high value actions, video views, purchases, installs, sign ups, traffic, enagagement, conversion.
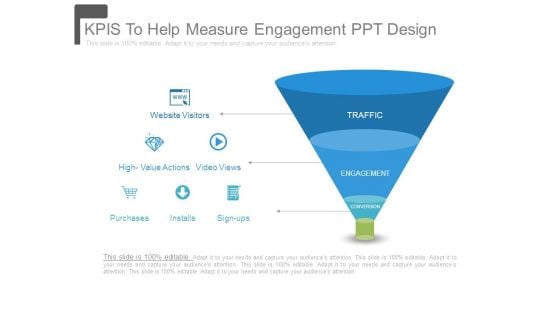
Kpis To Help Measure Engagement Ppt Design
This is a kpis to help measure engagement ppt design. This is a three stage process. The stages in this process are traffic, engagement, conversion, website visitors, high value actions, video views, purchases, installs, sign ups.
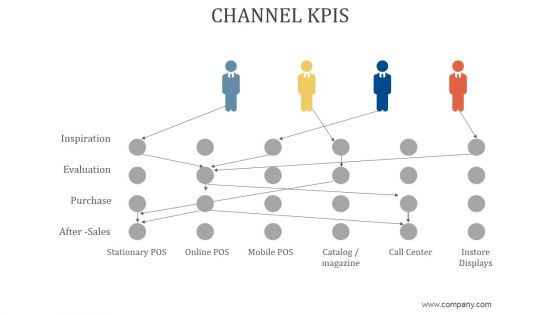
Channel Kpis Ppt PowerPoint Presentation Ideas
This is a channel kpis ppt powerpoint presentation ideas. This is a four stage process. The stages in this process are inspiration, evaluation, purchase, after sales, catalog magazine, call center, instore displays.
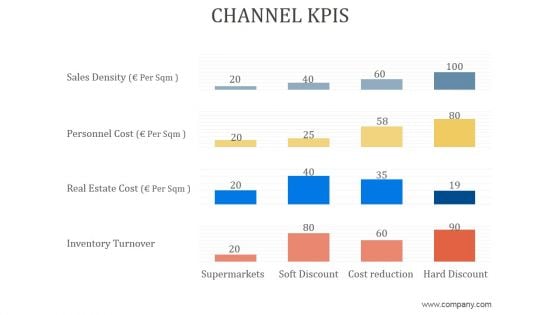
Channel Kpis Ppt PowerPoint Presentation Background Designs
This is a channel kpis ppt powerpoint presentation background designs. This is a four stage process. The stages in this process are sales density, personnel cost, real estate cost, inventory turnover, supermarkets, soft discount, cost reduction, hard discount.


 Continue with Email

 Home
Home


