key performance indicators
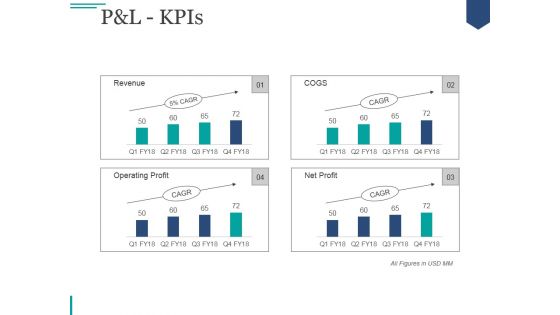
Pandl Kpis Ppt PowerPoint Presentation Deck
This is a pandl kpis ppt powerpoint presentation deck. This is a four stage process. The stages in this process are net sales, other income, total income, expenses, total material consumed.
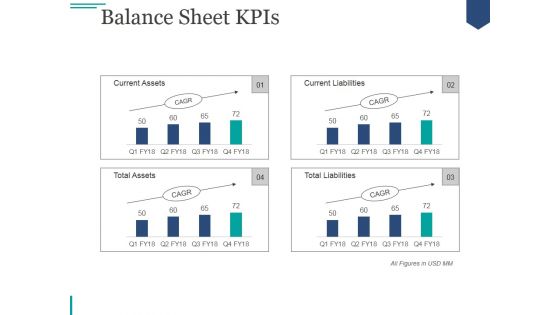
Balance Sheet Kpis Ppt PowerPoint Presentation Professional
This is a balance sheet kpis ppt powerpoint presentation professional. This is a four stage process. The stages in this process are current assets, current liabilities, total assets, total liabilities.
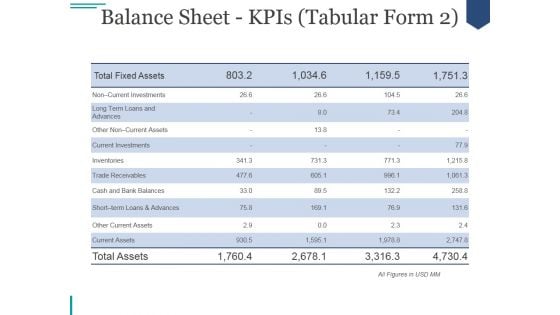
Balance Sheet Kpis Ppt PowerPoint Presentation Graphics
This is a balance sheet kpis ppt powerpoint presentation graphics. This is a five stage process. The stages in this process are long term loans and advances, other non current assets, current investments, inventories, inventories.
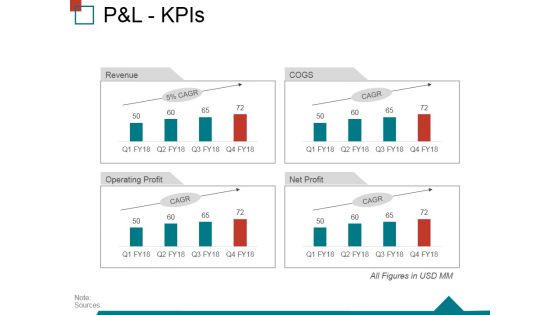
Pandl Kpis Ppt PowerPoint Presentation Outline Visuals
This is a pandl kpis ppt powerpoint presentation outline visuals. This is a four stage process. The stages in this process are other income, total income, expenses, total material consumed, other expenses.
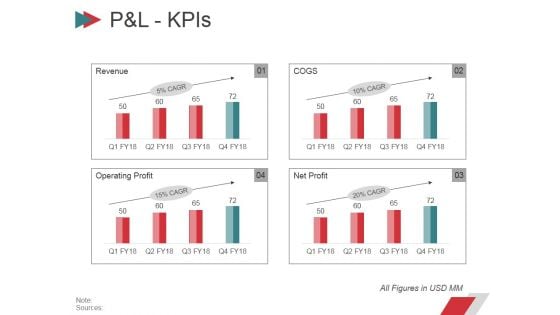
Pandl Kpis Ppt PowerPoint Presentation Gallery Slides
This is a pandl kpis ppt powerpoint presentation gallery slides. This is a four stage process. The stages in this process are net sales, other income, total income, expenses, total material consumed.
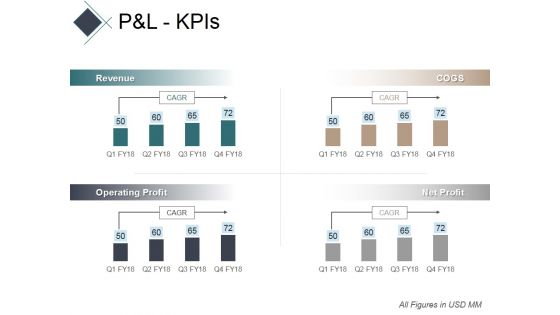
Pandl Kpis Ppt PowerPoint Presentation Professional Show
This is a pandl kpis ppt powerpoint presentation professional show. This is a four stage process. The stages in this process are other income, total income, expenses, total material consumed, employee benefit expense.
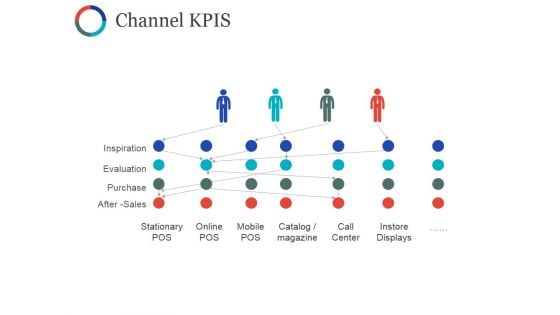
Channel Kpis Ppt PowerPoint Presentation Model Graphics
This is a channel kpis template ppt powerpoint presentation show portfolio. This is a seven stage process. The stages in this process are inspiration, evaluation, purchase, stationary pos, online pos.
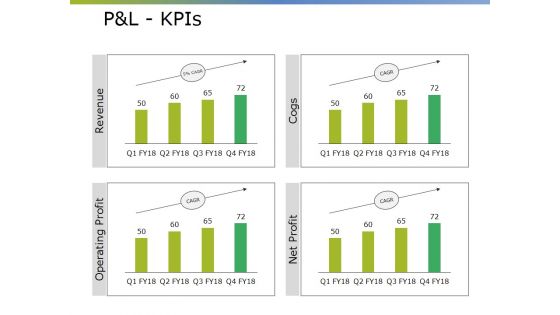
Pandl Kpis Ppt PowerPoint Presentation Gallery Display
This is a pandl kpis ppt powerpoint presentation gallery display. This is a four stage process. The stages in this process are net sales, total income, expenses, ebitda, profit after tax.

Litigation Kpis Ppt PowerPoint Presentation Slides Inspiration
This is a litigation kpis ppt powerpoint presentation slides inspiration. This is a three stage process. The stages in this process are average cost per lawsuit, average legal opinion response time, litigation cases won, business, marketing.
Litigation Kpis Ppt PowerPoint Presentation Styles Aids
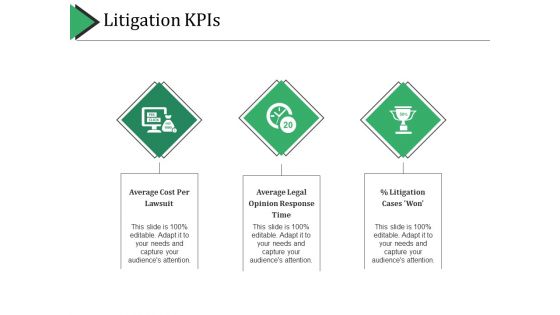
This is a litigation kpis ppt powerpoint presentation styles aids. This is a three stage process. The stages in this process are average cost per lawsuit, average legal opinion response time.
Litigation Kpis Ppt PowerPoint Presentation Model Aids
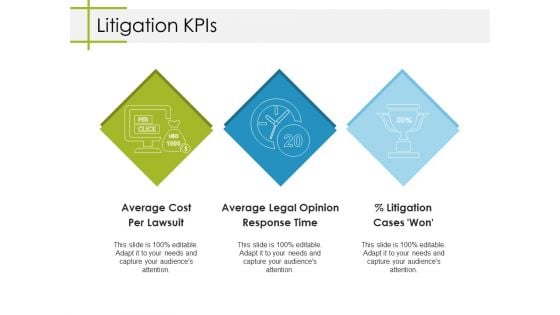
This is a litigation kpis ppt powerpoint presentation model aids. This is a three stage process. The stages in this process are average cost per lawsuit, average legal opinion response time, litigation cases won, business, marketing.
Pandl Kpis Ppt PowerPoint Presentation Professional Backgrounds
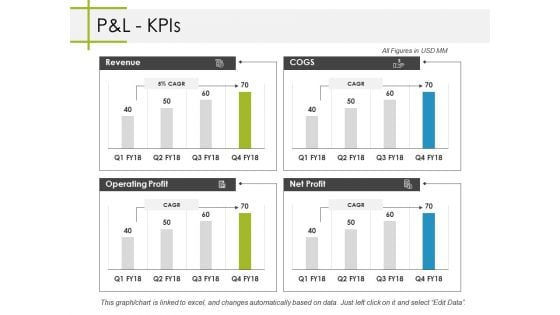
This is a pandl kpis ppt powerpoint presentation professional backgrounds. This is a four stage process. The stages in this process are business, revenue, operating profit, cogs, net profit.
Litigation Kpis Ppt PowerPoint Presentation Model Portrait
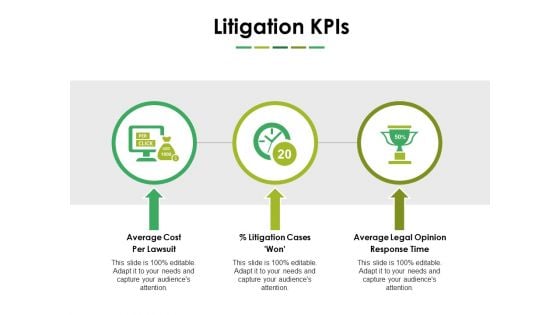
This is a litigation kpis ppt powerpoint presentation model portrait. This is a three stage process. The stages in this process are average cost per lawsuit, litigation cases won, average legal opinion response time, business, marketing.
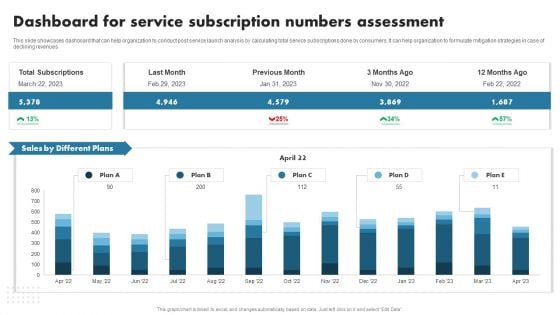
Enhancing Customer Outreach Dashboard For Service Subscription Numbers Template PDF
This slide showcases dashboard that can help organization to conduct post service launch analysis by calculating total service subscriptions done by consumers. It can help organization to formulate mitigation strategies in case of declining revenues. This Enhancing Customer Outreach Dashboard For Service Subscription Numbers Template PDF from Slidegeeks makes it easy to present information on your topic with precision. It provides customization options, so you can make changes to the colors, design, graphics, or any other component to create a unique layout. It is also available for immediate download, so you can begin using it right away. Slidegeeks has done good research to ensure that you have everything you need to make your presentation stand out. Make a name out there for a brilliant performance.
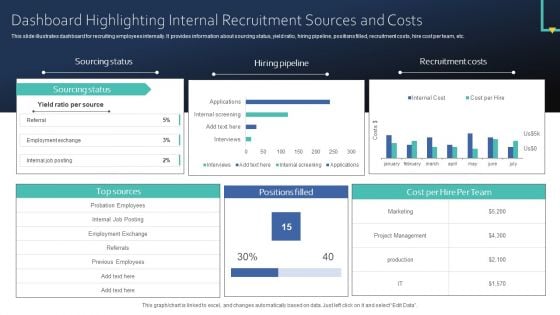
Dashboard Highlighting Internal Recruitment Sources And Costs Portrait PDF
This slide illustrates dashboard for recruiting employees internally. It provides information about sourcing status, yield ratio, hiring pipeline, positions filled, recruitment costs, hire cost per team, etc. This Dashboard Highlighting Internal Recruitment Sources And Costs Portrait PDF from Slidegeeks makes it easy to present information on your topic with precision. It provides customization options, so you can make changes to the colors, design, graphics, or any other component to create a unique layout. It is also available for immediate download, so you can begin using it right away. Slidegeeks has done good research to ensure that you have everything you need to make your presentation stand out. Make a name out there for a brilliant performance.
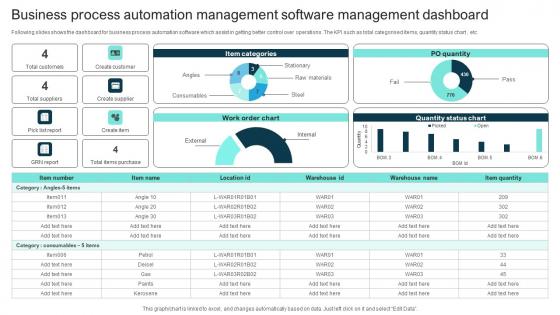
Business Process Automation Management Software Management Dashboard Themes Pdf
Following slides shows the dashboard for business process automation software which assist in getting better control over operations. The KPI such as total categorised items, quantity status chart, etc Showcasing this set of slides titled Business Process Automation Management Software Management Dashboard Themes Pdf The topics addressed in these templates are Item Categories, Warehouse, Business Process All the content presented in this PPT design is completely editable. Download it and make adjustments in color, background, font etc. as per your unique business setting. Following slides shows the dashboard for business process automation software which assist in getting better control over operations. The KPI such as total categorised items, quantity status chart, etc
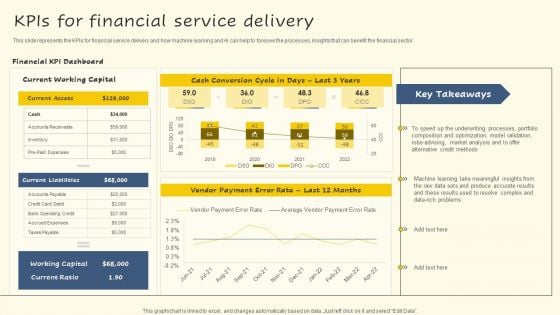
Kpis For Financial Service Delivery Background PDF
This slide represents the KPIs for financial service delivery and how machine learning and AI can help to foresee the processes, insights that can benefit the financial sector. If you are looking for a format to display your unique thoughts, then the professionally designed Kpis For Financial Service Delivery Background PDF is the one for you. You can use it as a Google Slides template or a PowerPoint template. Incorporate impressive visuals, symbols, images, and other charts. Modify or reorganize the text boxes as you desire. Experiment with shade schemes and font pairings. Alter, share or cooperate with other people on your work. Download Kpis For Financial Service Delivery Background PDF and find out how to give a successful presentation. Present a perfect display to your team and make your presentation unforgettable.
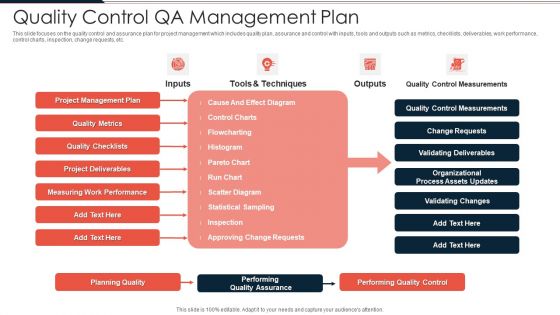
Quality Control QA Management Plan Ppt PowerPoint Presentation File Guide PDF
This slide focuses on the quality control and assurance plan for project management which includes quality plan, assurance and control with inputs, tools and outputs such as metrics, checklists, deliverables, work performance, control charts, inspection, change requests, etc. Showcasing this set of slides titled quality control qa management plan ppt powerpoint presentation file guide pdf. The topics addressed in these templates are project management plan, quality metrics, quality checklists, project deliverables. All the content presented in this PPT design is completely editable. Download it and
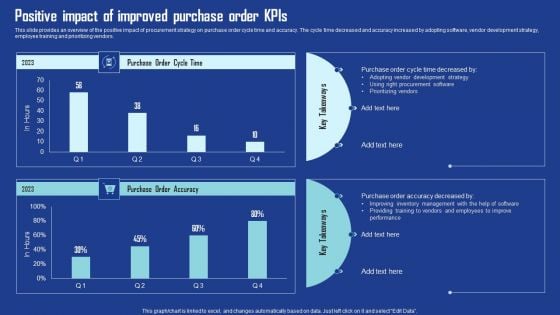
Positive Impact Of Improved Purchase Order Kpis Ideas PDF
This slide provides an overview of the positive impact of procurement strategy on purchase order cycle time and accuracy. The cycle time decreased and accuracy increased by adopting software, vendor development strategy, employee training and prioritizing vendors. Presenting this PowerPoint presentation, titled Positive Impact Of Improved Purchase Order Kpis Ideas PDF, with topics curated by our researchers after extensive research. This editable presentation is available for immediate download and provides attractive features when used. Download now and captivate your audience. Presenting this Positive Impact Of Improved Purchase Order Kpis Ideas PDF. Our researchers have carefully researched and created these slides with all aspects taken into consideration. This is a completely customizable Positive Impact Of Improved Purchase Order Kpis Ideas PDF that is available for immediate downloading. Download now and make an impact on your audience. Highlight the attractive features available with our PPTs.
Icons Slide Project Administration Kpis Brochure PDF
Presenting our innovatively structured Icons Slide Project Administration Kpis Brochure PDF set of slides. The slides contain a hundred percent editable icons. You can replace these icons without any inconvenience. Therefore, pick this set of slides and create a striking presentation.
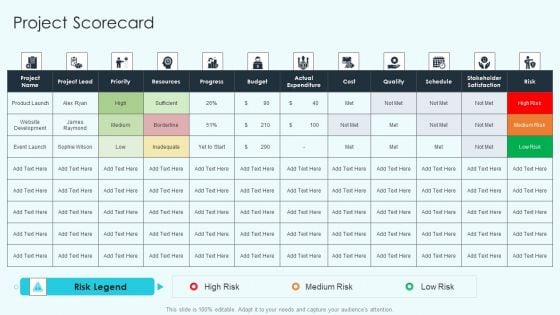
Project Administration Kpis Project Scorecard Demonstration PDF
Deliver an awe inspiring pitch with this creative Project Administration Kpis Project Scorecard Demonstration PDF bundle. Topics like Risk Legend, Resources, Cost can be discussed with this completely editable template. It is available for immediate download depending on the needs and requirements of the user.
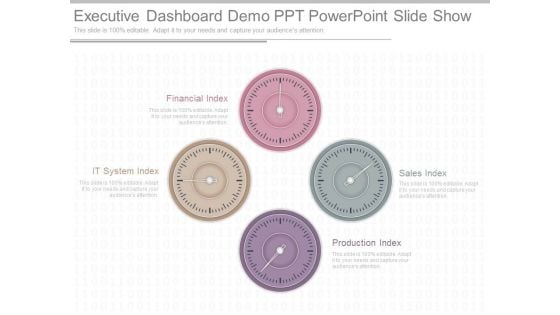
Executive Dashboard Demo Ppt Powerpoint Slide Show
This is a executive dashboard demo ppt powerpoint slide show. This is a four stage process. The stages in this process are financial index, it system index, production index, sales index.
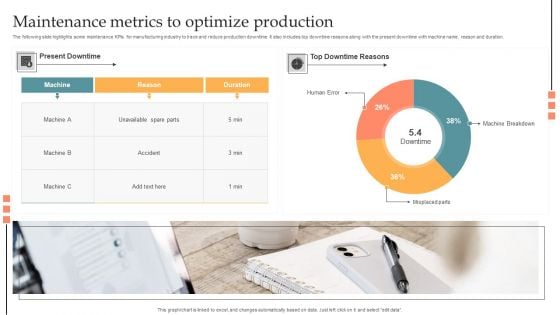
Maintenance Metrics To Optimize Production Information PDF
The following slide highlights some maintenance KPIs for manufacturing industry to trace and reduce production downtime. It also includes top downtime reasons along with the present downtime with machine name, reason and duration. Showcasing this set of slides titled Maintenance Metrics To Optimize Production Information PDF. The topics addressed in these templates are Human Error, Misplaced Parts, Machine Breakdown. All the content presented in this PPT design is completely editable. Download it and make adjustments in color, background, font etc. as per your unique business setting.
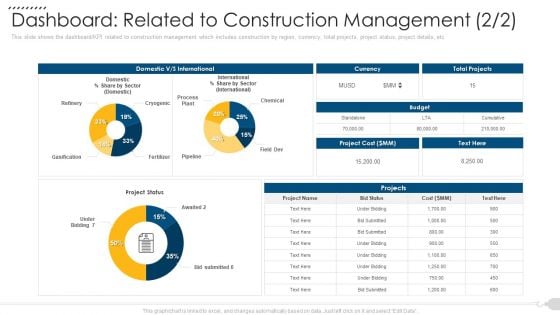
Dashboard Related To Construction Management Guidelines PDF
This slide shows the dashboard KPI related to construction management which includes total project details, Running project status, contractor details, invoice status, etc. Deliver and pitch your topic in the best possible manner with this dashboard related to construction management guidelines pdf. Use them to share invaluable insights on dashboard related to construction management and impress your audience. This template can be altered and modified as per your expectations. So, grab it now.
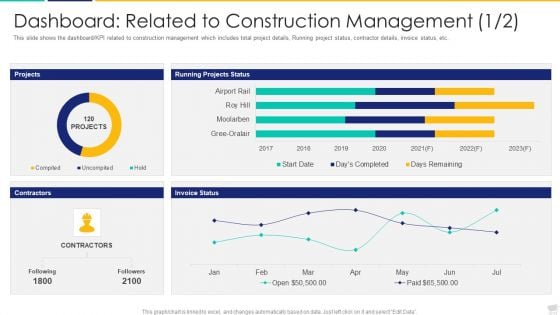
Dashboard Related To Construction Management Demonstration PDF
This slide shows the dashboard or KPI related to construction management which includes total project details, Running project status, contractor details, invoice status, etc.Deliver and pitch your topic in the best possible manner with this dashboard related to construction management demonstration pdf. Use them to share invaluable insights on dashboard related to construction management and impress your audience. This template can be altered and modified as per your expectations. So, grab it now.
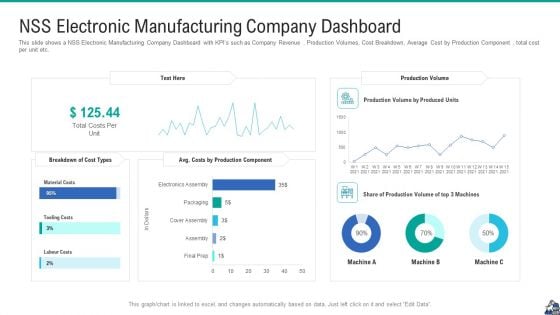
NSS Electronic Manufacturing Company Dashboard Portrait PDF
This slide shows a NSS Electronic Manufacturing Company Dashboard with KPI s such as Company Revenue , Production Volumes, Cost Breakdown, Average Cost by Production Component , total cost per unit etc. Deliver an awe inspiring pitch with this creative nss electronic manufacturing company dashboard portrait pdf bundle. Topics like nss electronic manufacturing company dashboard can be discussed with this completely editable template. It is available for immediate download depending on the needs and requirements of the user.
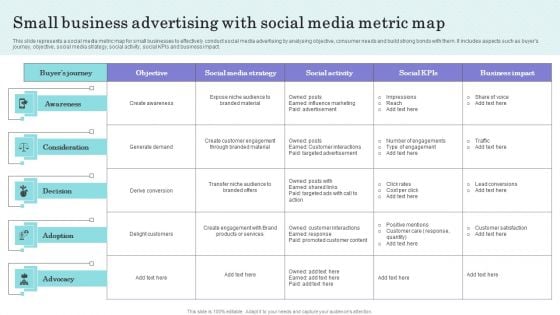
Small Business Advertising With Social Media Metric Map Graphics PDF
This slide represents a social media metric map for small businesses to effectively conduct social media advertising by analysing objective, consumer needs and build strong bonds with them. It includes aspects such as buyers journey, objective, social media strategy, social activity, social KPIs and business impact. Pitch your topic with ease and precision using this Small Business Advertising With Social Media Metric Map Graphics PDF. This layout presents information on Awareness, Consideration, Decision . It is also available for immediate download and adjustment. So, changes can be made in the color, design, graphics or any other component to create a unique layout.
Revenue Management Model With Kpis Icons PDF
This Slide exhibits five levers of revenue management for optimizing financial results. It starts with brand portfolio pricing and ends at trade terms management. Pitch your topic with ease and precision using this revenue management model with kpis icons pdf. This layout presents information on promotion management, brand portfolio pricing, trade terms management. It is also available for immediate download and adjustment. So, changes can be made in the color, design, graphics or any other component to create a unique layout.
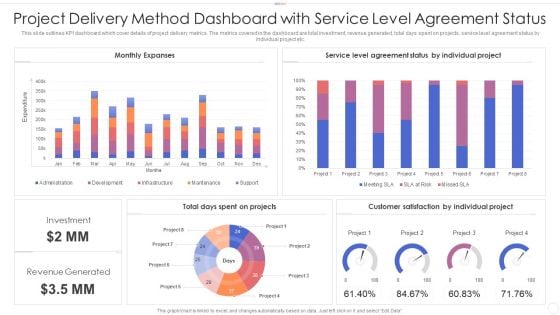
Project Delivery Method Dashboard With Service Level Agreement Status Clipart PDF
This slide outlines KPI dashboard which cover details of project delivery metrics. The metrics covered in the dashboard are total investment, revenue generated, total days spent on projects, service level agreement status by individual project etc. Pitch your topic with ease and precision using this project delivery method dashboard with service level agreement status clipart pdf. This layout presents information on project delivery method dashboard with service level agreement status. It is also available for immediate download and adjustment. So, changes can be made in the color, design, graphics or any other component to create a unique layout.
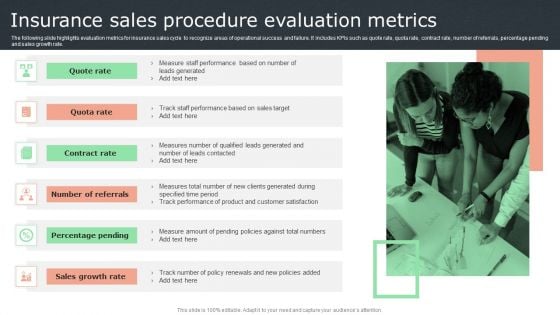
Insurance Sales Procedure Evaluation Metrics Graphics PDF
The following slide highlights evaluation metrics for insurance sales cycle to recognize areas of operational success and failure. It includes KPIs such as quote rate, quota rate, contract rate, number of referrals, percentage pending and sales growth rate. Presenting Insurance Sales Procedure Evaluation Metrics Graphics PDF to dispense important information. This template comprises six stages. It also presents valuable insights into the topics including Contract Rate, Percentage Pending, Sales Growth Rate . This is a completely customizable PowerPoint theme that can be put to use immediately. So, download it and address the topic impactfully.
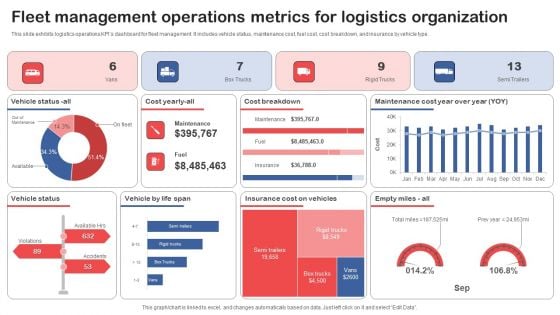
Fleet Management Operations Metrics For Logistics Organization Graphics PDF
This slide exhibits logistics operations KPIs dashboard for fleet management. It includes vehicle status, maintenance cost, fuel cost, cost breakdown, and insurance by vehicle type. Pitch your topic with ease and precision using this Fleet Management Operations Metrics For Logistics Organization Graphics PDF. This layout presents information on Cost Breakdown, Vehicle Status, Vehicle By Life Span. It is also available for immediate download and adjustment. So, changes can be made in the color, design, graphics or any other component to create a unique layout.
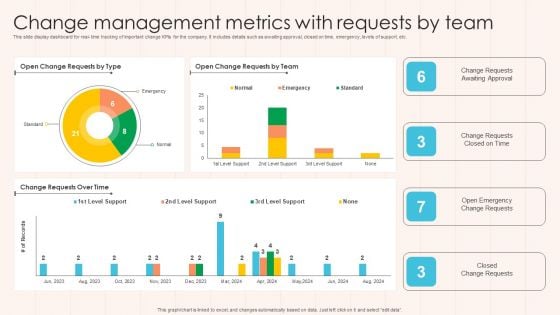
Change Management Metrics With Requests By Team Designs PDF
This slide display dashboard for real- time tracking of important change KPIs for the company. It includes details such as awaiting approval, closed on time, emergency, levels of support, etc. Pitch your topic with ease and precision using this Change Management Metrics With Requests By Team Designs PDF This layout presents information on Change Requests, Approval, Team. It is also available for immediate download and adjustment. So, changes can be made in the color, design, graphics or any other component to create a unique layout.
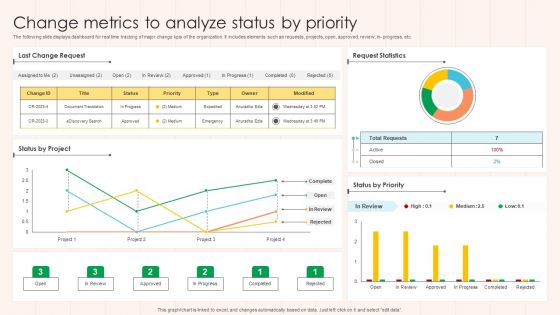
Change Metrics To Analyze Status By Priority Formats PDF
The following slide displays dashboard for real time tracking of major change kpis of the organization. It includes elements such as requests, projects, open, approved, review, in- progress, etc. Pitch your topic with ease and precision using this Change Metrics To Analyze Status By Priority Formats PDF This layout presents information on Project, Request Statistics, Priority. It is also available for immediate download and adjustment. So, changes can be made in the color, design, graphics or any other component to create a unique layout.
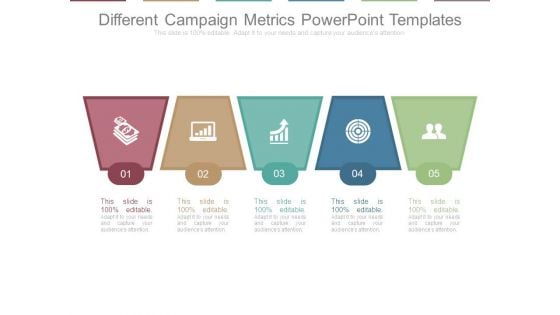
Different Campaign Metrics Powerpoint Templates
This is a different campaign metrics powerpoint templates. This is a five stage process. The stages in this process are metrics, management, marketing, business, strategy.
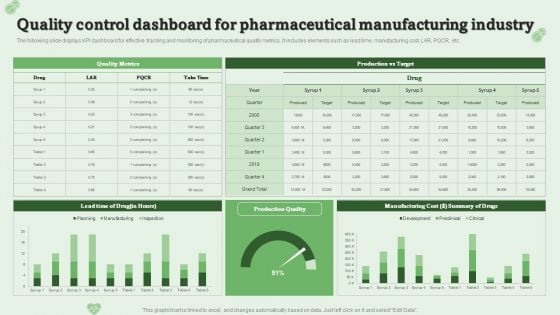
Quality Control Dashboard For Pharmaceutical Manufacturing Industry Ppt PowerPoint Presentation Model Layouts PDF
The following slide displays KPI dashboard for effective tracking and monitoring of pharmaceutical quality metrics. It includes elements such as lead time, manufacturing cost, LAR, PQCR, etc.Pitch your topic with ease and precision using this Quality Control Dashboard For Pharmaceutical Manufacturing Industry Ppt PowerPoint Presentation Model Layouts PDF. This layout presents information on Manufacturing Cost, Summary Drugs, Quality Metrics. It is also available for immediate download and adjustment. So, changes can be made in the color, design, graphics or any other component to create a unique layout.
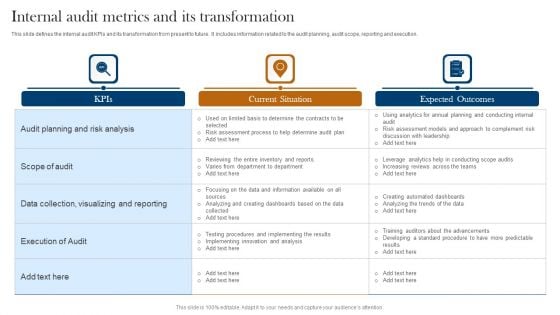
Internal Audit Metrics And Its Transformation Ppt Outline Layout PDF
This slide defines the internal audit KPIs and its transformation from present to future. It includes information related to the audit planning, audit scope, reporting and execution. Showcasing this set of slides titled Internal Audit Metrics And Its Transformation Ppt Outline Layout PDF. The topics addressed in these templates are Kpis, Current Situation, Audit Planning. All the content presented in this PPT design is completely editable. Download it and make adjustments in color, background, font etc. as per your unique business setting.
Product Support Service Organizational Model Icons PDF
This slide presents a business model of product support to achieve and maintain customer satisfaction. It includes elements like warfighter, product support arrangement, product support integrators and product support providers. Showcasing this set of slides titled Product Support Service Organizational Model Icons PDF. The topics addressed in these templates are Performance, Data And Metrics, Commercial And Government, Responsibility. All the content presented in this PPT design is completely editable. Download it and make adjustments in color, background, font etc. as per your unique business setting.
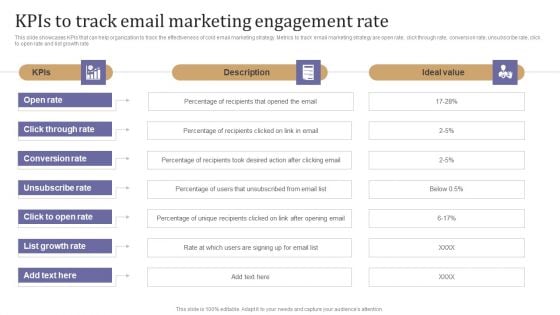
Kpis To Track Email Marketing Engagement Rate Slides PDF
This slide showcases KPIs that can help organization to track the effectiveness of cold email marketing strategy. Metrics to track email marketing strategy are open rate, click through rate, conversion rate, unsubscribe rate, click to open rate and list growth rate. Slidegeeks is here to make your presentations a breeze with Kpis To Track Email Marketing Engagement Rate Slides PDF With our easy to use and customizable templates, you can focus on delivering your ideas rather than worrying about formatting. With a variety of designs to choose from, you are sure to find one that suits your needs. And with animations and unique photos, illustrations, and fonts, you can make your presentation pop. So whether you are giving a sales pitch or presenting to the board, make sure to check out Slidegeeks first.
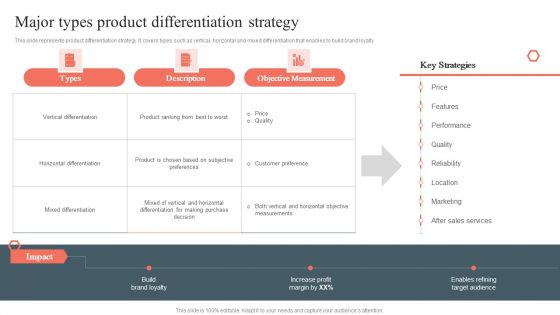
Major Types Product Differentiation Strategy Product Development And Management Plan Clipart PDF
This slide represents KPI dashboard for measuring product performance. It covers total activities, new customers, events, net promoter score etc.Find highly impressive Major Types Product Differentiation Strategy Product Development And Management Plan Clipart PDF on Slidegeeks to deliver a meaningful presentation. You can save an ample amount of time using these presentation templates. No need to worry to prepare everything from scratch because Slidegeeks experts have already done a huge research and work for you. You need to download Major Types Product Differentiation Strategy Product Development And Management Plan Clipart PDF for your upcoming presentation. All the presentation templates are 100 precent editable and you can change the color and personalize the content accordingly. Download now.
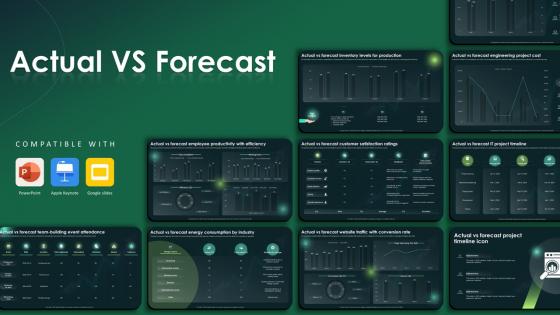
Actual Vs Forecast Powerpoint Ppt Template Bundles
This Actual Vs Forecast Powerpoint Ppt Template Bundles is designed to help you retain your audiences attention. This content-ready PowerPoint Template enables you to take your audience on a journey and share information in a way that is easier to recall. It helps you highlight the crucial parts of your work so that the audience does not get saddled with information download. This KPI Dashboard, Data Driven Marketing, Campaign Performance, Marketing Evaluation, Inventory Assessment-slide PPT Deck comes prepared with the graphs and charts you could need to showcase your information through visuals. You only need to enter your own data in them. Download this editable PowerPoint Theme and walk into that meeting with confidence. Our Actual vs. Forecast PowerPoint presentation can provide you with valuable business insights. Analyze sales figures, budgets, and financial predictions. Identify major differences, modify methods, and match projections with results to improve decision-making. Download now to accelerate your success.
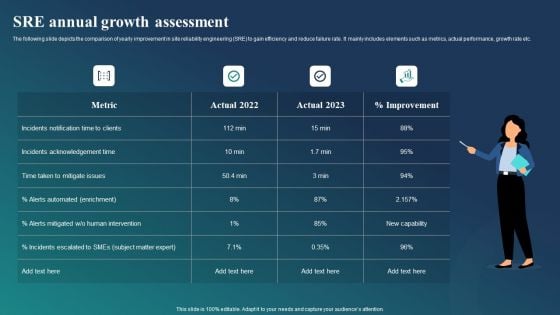
SRE Annual Growth Assessment Ppt Model Visuals PDF
The following slide depicts the comparison of yearly improvement in site reliability engineering SRE to gain efficiency and reduce failure rate. It mainly includes elements such as metrics, actual performance, growth rate etc. Presenting SRE Annual Growth Assessment Ppt Model Visuals PDF to dispense important information. This template comprises four stages. It also presents valuable insights into the topics including Metric, Actual 2022, Actual 2023, Improvement. This is a completely customizable PowerPoint theme that can be put to use immediately. So, download it and address the topic impactfully.
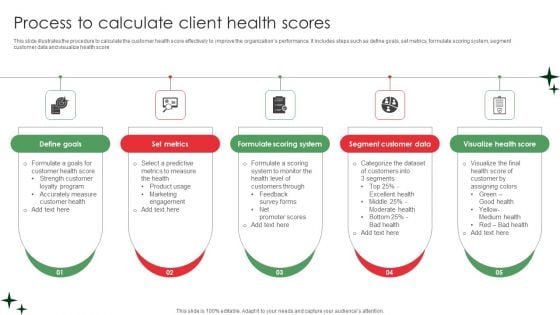
Process To Calculate Client Health Scores Demonstration PDF
This slide illustrates the procedure to calculate the customer health score effectively to improve the organizations performance. It includes steps such as define goals, set metrics, formulate scoring system, segment customer data and visualize health score. Persuade your audience using this Process To Calculate Client Health Scores Demonstration PDF. This PPT design covers five stages, thus making it a great tool to use. It also caters to a variety of topics including Define Goals, Set Metrics, Formulate Scoring System. Download this PPT design now to present a convincing pitch that not only emphasizes the topic but also showcases your presentation skills.
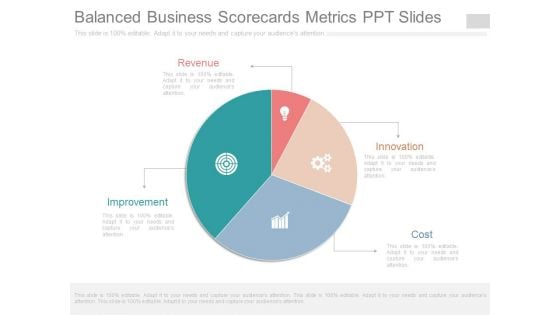
Balanced Business Scorecards Metrics Ppt Slides
This is a balanced business scorecards metrics ppt slides. This is a four stage process. The stages in this process are revenue, improvement, innovation, cost.

Business Development Metrics Sample Diagram Powerpoint Slides
This is a business development metrics sample diagram powerpoint slides. This is a four stage process. The stages in this process are place, price, target market, product, promotion.
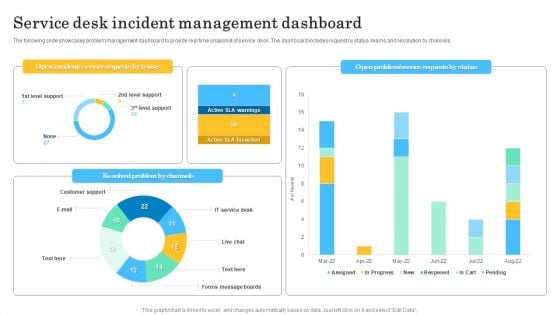
Service Desk Incident Management Dashboard Summary PDF
The following slide showcases problem management dashboard to provide real time snapshot of service desk. The dashboard includes request by status, teams and resolution by channels. Showcasing this set of slides titled Service Desk Incident Management Dashboard Summary PDF. The topics addressed in these templates are Open Incidents Service, Requests By Teams. All the content presented in this PPT design is completely editable. Download it and make adjustments in color, background, font etc. as per your unique business setting.
Measurement Gauge Vector Icon Ppt PowerPoint Presentation File Infographics PDF
Presenting this set of slides with name measurement gauge vector icon ppt powerpoint presentation file infographics pdf. This is a three stage process. The stages in this process are measurement gauge vector icon. This is a completely editable PowerPoint presentation and is available for immediate download. Download now and impress your audience.
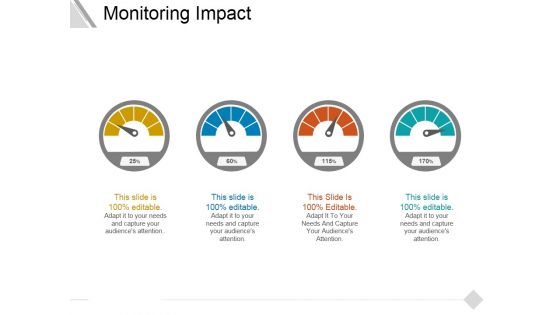
Monitoring Impact Ppt PowerPoint Presentation Ideas Guide
This is a monitoring impact ppt powerpoint presentation ideas guide. This is a four stage process. The stages in this process are speed, meter, business, marketing, equipment.
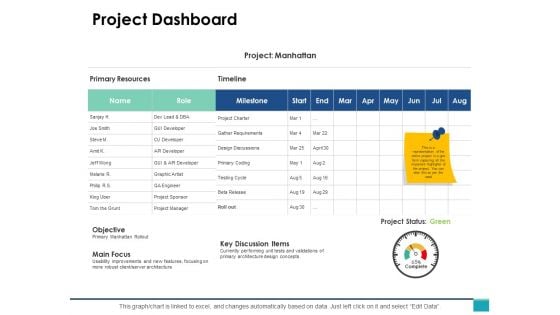
Project Dashboard Ppt PowerPoint Presentation Show Samples
This is a project dashboard ppt powerpoint presentation show samples. The topics discussed in this diagram are business, management, marketing, dashboard. This is a completely editable PowerPoint presentation, and is available for immediate download.
Metrics Showcasing Project Management Operations Icons PDF
This slide exhibits project management operations dashboard. It covers task status, budget status, pending tasks, activity progress status etc to track project progress. Showcasing this set of slides titled Metrics Showcasing Project Management Operations Icons PDF. The topics addressed in these templates are Metrics Showcasing, Project Management Operations. All the content presented in this PPT design is completely editable. Download it and make adjustments in color, background, font etc. as per your unique business setting.
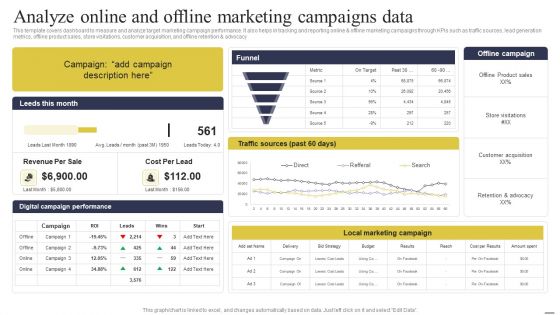
Defining Generic Target Marketing Techniques Analyze Online And Offline Marketing Campaigns Data Topics PDF
This template covers dashboard to measure and analyze target marketing campaign performance. It also helps in tracking and reporting online and offline marketing campaigns through KPIs such as traffic sources, lead generation metrics, offline product sales, store visitations, customer acquisition, and offline retention and advocacy. Create an editable Defining Generic Target Marketing Techniques Analyze Online And Offline Marketing Campaigns Data Topics PDF that communicates your idea and engages your audience. Whether you are presenting a business or an educational presentation, pre designed presentation templates help save time. Defining Generic Target Marketing Techniques Analyze Online And Offline Marketing Campaigns Data Topics PDF is highly customizable and very easy to edit, covering many different styles from creative to business presentations. Slidegeeks has creative team members who have crafted amazing templates. So, go and get them without any delay.
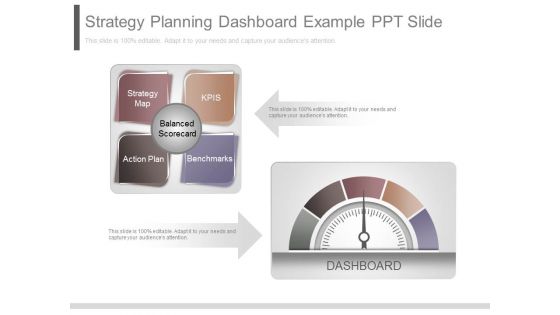
Strategy Planning Dashboard Example Ppt Slide
This is a strategy planning dashboard example ppt slide. This is a two stage process. The stages in this process are strategy map, kpis, balanced scorecard, action plan, benchmarks, dashboard.
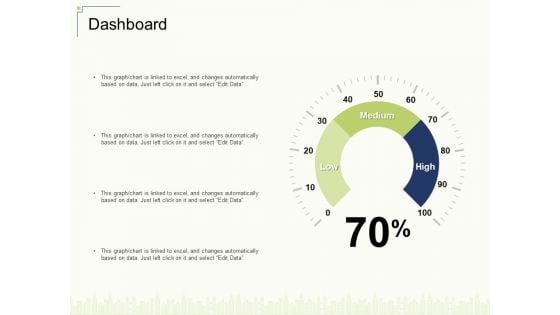
Dashboard Ppt Show Microsoft PDF
Deliver and pitch your topic in the best possible manner with this dashboard ppt show microsoft pdf. Use them to share invaluable insights on low, medium, high and impress your audience. This template can be altered and modified as per your expectations. So, grab it now.
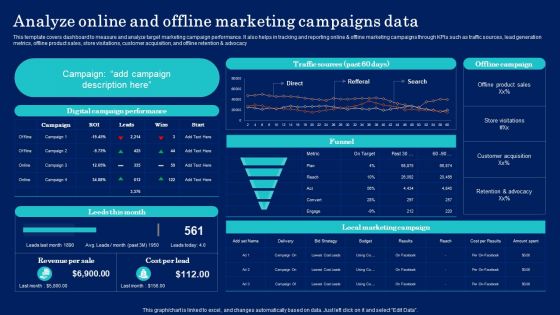
Why Target Market Identification Analyze Online And Offline Marketing Campaigns Data Topics PDF
This template covers dashboard to measure and analyze target marketing campaign performance. It also helps in tracking and reporting online and offline marketing campaigns through KPIs such as traffic sources, lead generation metrics, offline product sales, store visitations, customer acquisition, and offline retention and advocacy. Boost your pitch with our creative Why Target Market Identification Analyze Online And Offline Marketing Campaigns Data Topics PDF. Deliver an awe inspiring pitch that will mesmerize everyone. Using these presentation templates you will surely catch everyones attention. You can browse the ppts collection on our website. We have researchers who are experts at creating the right content for the templates. So you do not have to invest time in any additional work. Just grab the template now and use them.
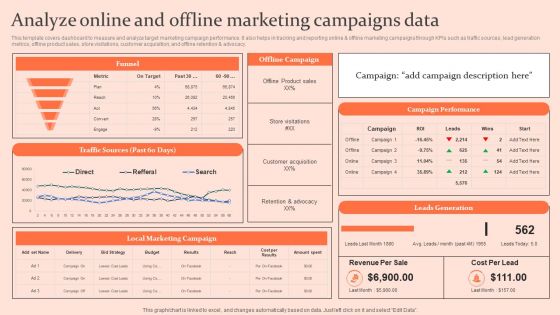
Customised Advertising Strategies Analyze Online And Offline Marketing Download PDF
This template covers dashboard to measure and analyze target marketing campaign performance. It also helps in tracking and reporting online and offline marketing campaigns through KPIs such as traffic sources, lead generation metrics, offline product sales, store visitations, customer acquisition, and offline retention and advocacy. Boost your pitch with our creative Customised Advertising Strategies Analyze Online And Offline Marketing Download PDF. Deliver an awe-inspiring pitch that will mesmerize everyone. Using these presentation templates you will surely catch everyones attention. You can browse the ppts collection on our website. We have researchers who are experts at creating the right content for the templates. So you do not have to invest time in any additional work. Just grab the template now and use them.
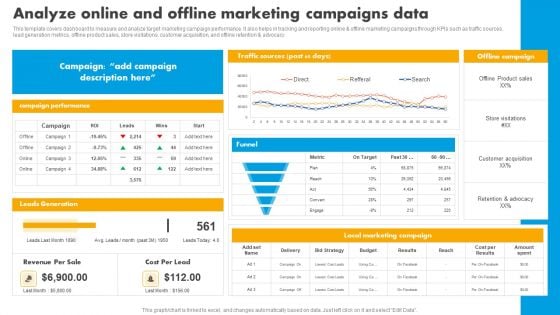
Analyze Online And Offline Marketing Campaigns Data Graphics PDF
This template covers dashboard to measure and analyze target marketing campaign performance. It also helps in tracking and reporting online and offline marketing campaigns through KPIs such as traffic sources, lead generation metrics, offline product sales, store visitations, customer acquisition, and offline retention and advocacy. If you are looking for a format to display your unique thoughts, then the professionally designed Analyze Online And Offline Marketing Campaigns Data Graphics PDF is the one for you. You can use it as a Google Slides template or a PowerPoint template. Incorporate impressive visuals, symbols, images, and other charts. Modify or reorganize the text boxes as you desire. Experiment with shade schemes and font pairings. Alter, share or cooperate with other people on your work. Download Analyze Online And Offline Marketing Campaigns Data Graphics PDF and find out how to give a successful presentation. Present a perfect display to your team and make your presentation unforgettable.
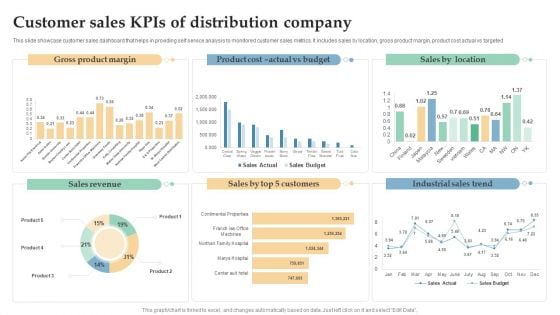
Customer Sales Kpis Of Distribution Company Ppt Infographic Template Templates PDF
This slide showcase customer sales dashboard that helps in providing self service analysis to monitored customer sales metrics. It includes sales by location, gross product margin, product cost actual vs targeted. Showcasing this set of slides titled Customer Sales Kpis Of Distribution Company Ppt Infographic Template Templates PDF. The topics addressed in these templates are Gross Product Margin, Sales Revenue, Industrial Sales Trend. All the content presented in this PPT design is completely editable. Download it and make adjustments in color, background, font etc. as per your unique business setting.

Hr Matrix Dashboard Ppt PowerPoint Presentation Complete Deck With Slides
This is a hr matrix dashboard ppt powerpoint presentation complete deck with slides. This is a one stage process. The stages in this process are business, management, strategy, dashboard, analysis.
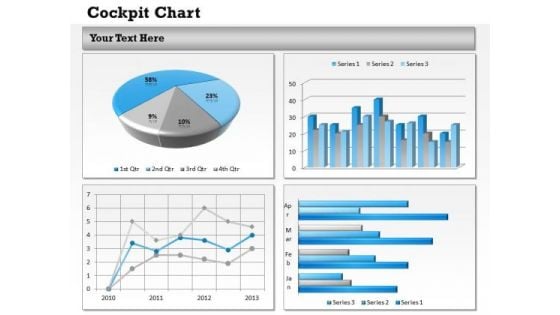
Marketing Diagram Data Driven Dashboard Design Business Diagram
Get The Doers Into Action. Activate Them With Our Marketing Diagram Data Driven Dashboard Design Business Diagram Powerpoint Templates.
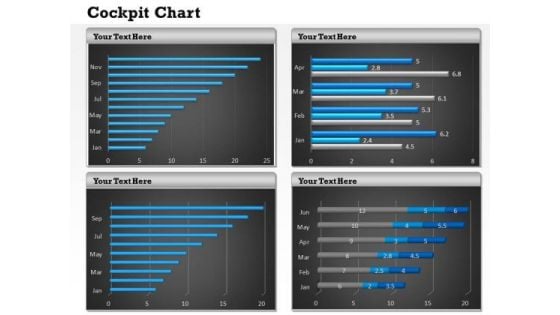
Sales Diagram Visual Design Of Dashboard Strategy Diagram
Dominate Proceedings With Your Ideas. Our Sales Diagram Visual Design Of Dashboard Strategy Diagram Powerpoint Templates Will Empower Your Thoughts.
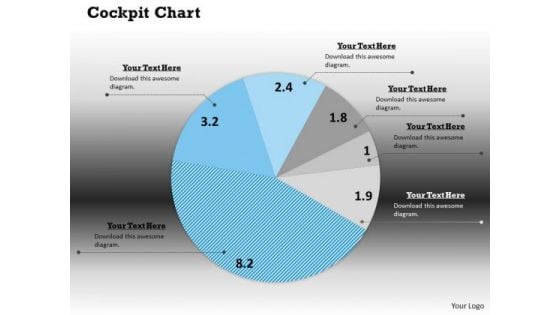
Strategic Management Interactiive Chart Dashboard Design Marketing Diagram
Your Listeners Will Never Doodle. Our Strategic Management Interactiive Chart Dashboard Design Marketing Diagram Powerpoint Templates Will Hold Their Concentration.


 Continue with Email

 Home
Home


