key performance indicators
Performance Tracking Dashboard For Reinforcement Learning Model Sample PDF
This slide represents the performance tracking dashboard for the reinforcement learning model based on different time frames and categories. From laying roadmaps to briefing everything in detail, our templates are perfect for you. You can set the stage with your presentation slides. All you have to do is download these easy to edit and customizable templates. Performance Tracking Dashboard For Reinforcement Learning Model Sample PDF will help you deliver an outstanding performance that everyone would remember and praise you for. Do download this presentation today.
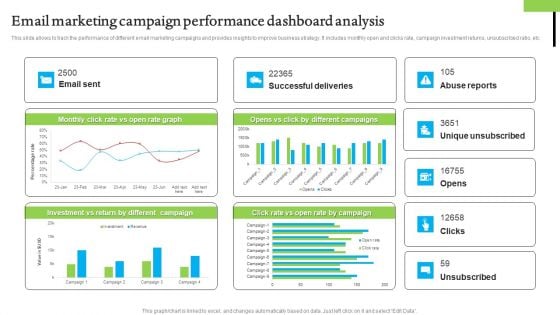
Email Marketing Campaign Performance Dashboard Analysis Information PDF
This slide allows to track the performance of different email marketing campaigns and provides insights to improve business strategy. It includes monthly open and clicks rate, campaign investment returns, unsubscribed ratio, etc. Showcasing this set of slides titled Email Marketing Campaign Performance Dashboard Analysis Information PDF. The topics addressed in these templates are Performance Dashboard Analysis, Email Marketing Campaign. All the content presented in this PPT design is completely editable. Download it and make adjustments in color, background, font etc. as per your unique business setting.
Progressive Business Performance Measurement Metrics Gross Ppt Styles Icon PDF
Presenting this set of slides with name progressive business performance measurement metrics gross ppt styles icon pdf. The topics discussed in these slides are gross profit margin, quick ratio, revenue vs expenses, current accounts payable vs receivable. This is a completely editable PowerPoint presentation and is available for immediate download. Download now and impress your audience.
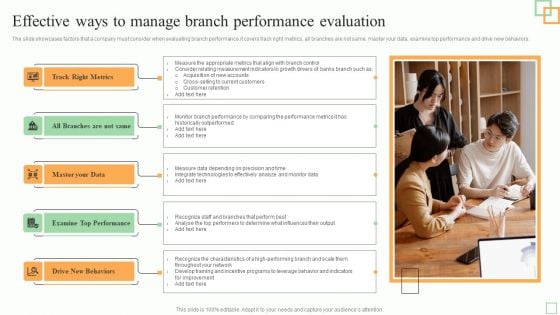
Effective Ways To Manage Branch Performance Evaluation Introduction PDF
The slide showcases factors that a company must consider when evaluating branch performance.it covers track right metrics, all branches are not same, master your data, examine top performance and drive new behaviors.Persuade your audience using this Effective Ways To Manage Branch Performance Evaluation Introduction PDF. This PPT design covers five stages, thus making it a great tool to use. It also caters to a variety of topics including Master Data, Examine Top Performance, Drive Behaviors . Download this PPT design now to present a convincing pitch that not only emphasizes the topic but also showcases your presentation skills.
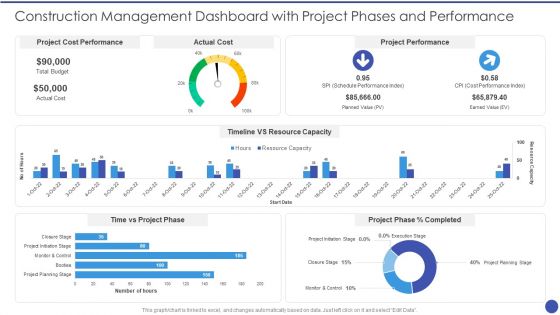
Construction Management Dashboard With Project Phases And Performance Inspiration PDF
This graph for chart is linked to excel, and changes automatically based on data. Just left click on it and select Edit Data. Deliver and pitch your topic in the best possible manner with this Construction Management Dashboard With Project Phases And Performance Inspiration PDF. Use them to share invaluable insights on Project Cost Performance, Actual Cost, Project Performance, Timeline VS Resource Capacity, Time vs Project Phase and impress your audience. This template can be altered and modified as per your expectations. So, grab it now.
Different Brands Performance Tracking Dashboard Ppt Gallery Infographics PDF
This slide provides information regarding different brands performance tracking dashboard in terms of brand metric, brand commitment, advertising metrics, and purchase metrics. Take your projects to the next level with our ultimate collection of Different Brands Performance Tracking Dashboard Ppt Gallery Infographics PDF. Slidegeeks has designed a range of layouts that are perfect for representing task or activity duration, keeping track of all your deadlines at a glance. Tailor these designs to your exact needs and give them a truly corporate look with your own brand colors they will make your projects stand out from the rest.
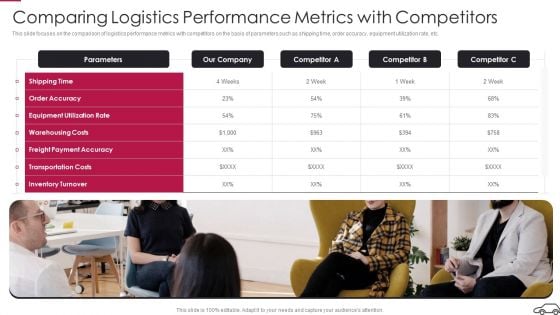
Comparing Logistics Performance Metrics With Competitors Topics PDF
This slide focuses on the comparison of logistics performance metrics with competitors on the basis of parameters such as shipping time, order accuracy, equipment utilization rate, etc.Presenting Comparing Logistics Performance Metrics With Competitors Topics PDF to provide visual cues and insights. Share and navigate important information on one stage that need your due attention. This template can be used to pitch topics like Equipment Utilization, Warehousing Costs, Transportation Costs In addtion, this PPT design contains high resolution images, graphics, etc, that are easily editable and available for immediate download.
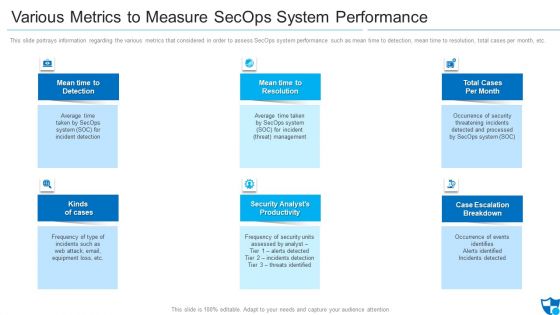
Various Metrics To Measure Secops System Performance Brochure PDF
This slide portrays information regarding the various metrics that considered in order to assess SecOps system performance such as mean time to detection, mean time to resolution, total cases per month, etc. This is a various metrics to measure secops system performance brochure pdf template with various stages. Focus and dispense information on six stages using this creative set, that comes with editable features. It contains large content boxes to add your information on topics like mean time to detection, mean time to resolution, total cases per month . You can also showcase facts, figures, and other relevant content using this PPT layout. Grab it now.
Brand Recognition Overview Different Brands Performance Tracking Dashboard Brochure PDF
This slide provides information regarding different brands performance tracking dashboard in terms of brand metric, brand commitment, advertising metrics, and purchase metrics. Do you have to make sure that everyone on your team knows about any specific topic I yes, then you should give Brand Recognition Overview Different Brands Performance Tracking Dashboard Brochure PDF a try. Our experts have put a lot of knowledge and effort into creating this impeccable Brand Recognition Overview Different Brands Performance Tracking Dashboard Brochure PDF. You can use this template for your upcoming presentations, as the slides are perfect to represent even the tiniest detail. You can download these templates from the Slidegeeks website and these are easy to edit. So grab these today

Sales Product Performance Dashboard Ppt PowerPoint Presentation Model Graphics Design
This is a sales product performance dashboard ppt powerpoint presentation model graphics design. This is a four stage process. The stages in this process are top products in revenue, incremental sales, cost of goods.
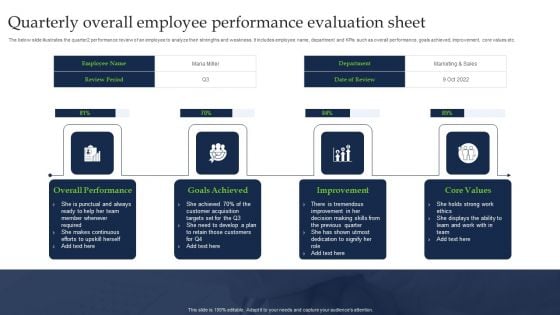
Quarterly Overall Employee Performance Evaluation Sheet Sample PDF
The below slide illustrates the quarter2 performance review of an employee to analyze their strengths and weakness. It includes employee name, department and KPIs such as overall performance, goals achieved, improvement, core values etc. Showcasing this set of slides titled Quarterly Overall Employee Performance Evaluation Sheet Sample PDF. The topics addressed in these templates are Overall Performance, Goals Achieved, Improvement. All the content presented in this PPT design is completely editable. Download it and make adjustments in color, background, font etc. as per your unique business setting.

Performance Benchmarking Report For Effective Supply Chain Process Infographics PDF
This slide covers the performance benchmarking report for effective supply chain process which includes performance attribute, metrics, supplier actual, parity, advantage, superior and gaps in actual performance with accuracy, responsiveness, flexibility, expense, etc.Pitch your topic with ease and precision using this Performance Benchmarking Report For Effective Supply Chain Process Infographics PDF This layout presents information on Responsiveness, Flexibility, Accuracy It is also available for immediate download and adjustment. So, changes can be made in the color, design, graphics or any other component to create a unique layout.
CASB Performance Tracking Dashboard Ppt PowerPoint Presentation File Styles PDF
This slide outlines the performance tracking dashboard for CASB deployment. The purpose of this slide is to showcase the status of various applications, IP addresses, users, machines, and web traffic. It also includes cloud discovery open alerts, risk levels, and top entities. Presenting this PowerPoint presentation, titled CASB Performance Tracking Dashboard Ppt PowerPoint Presentation File Styles PDF, with topics curated by our researchers after extensive research. This editable presentation is available for immediate download and provides attractive features when used. Download now and captivate your audience. Presenting this CASB Performance Tracking Dashboard Ppt PowerPoint Presentation File Styles PDF. Our researchers have carefully researched and created these slides with all aspects taken into consideration. This is a completely customizable CASB Performance Tracking Dashboard Ppt PowerPoint Presentation File Styles PDF that is available for immediate downloading. Download now and make an impact on your audience. Highlight the attractive features available with our PPTs.
Fixed Asset Management Dashboard For Tracking Equipment Performance Inspiration PDF
This slide represents fixed asset management dashboard for tracking equipment performance. It includes work management, downtime, work orders etc.Deliver an awe inspiring pitch with this creative Fixed Asset Management Dashboard For Tracking Equipment Performance Inspiration PDF bundle. Topics like Asset Comparison, Labour Analysis, Purchasing Spend can be discussed with this completely editable template. It is available for immediate download depending on the needs and requirements of the user.
Dashboard For Tracking Aftersales Customer Services Team Performance Pictures PDF
This slide covers the KPI dashboard for ticket tracking. It includes metrics such as tickets by month, service level, and details of customer service department agents. Here you can discover an assortment of the finest PowerPoint and Google Slides templates. With these templates, you can create presentations for a variety of purposes while simultaneously providing your audience with an eye catching visual experience. Download Dashboard For Tracking Aftersales Customer Services Team Performance Pictures PDF to deliver an impeccable presentation. These templates will make your job of preparing presentations much quicker, yet still, maintain a high level of quality. Slidegeeks has experienced researchers who prepare these templates and write high quality content for you. Later on, you can personalize the content by editing the Dashboard For Tracking Aftersales Customer Services Team Performance Pictures PDF.
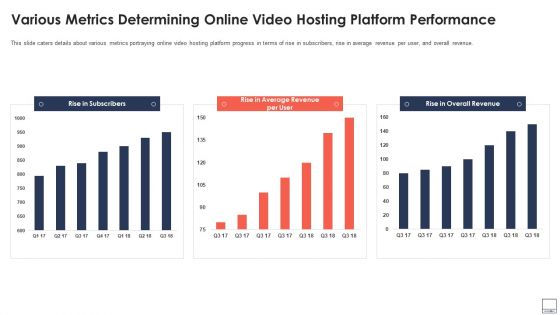
Various Metrics Determining Online Video Hosting Platform Performance Background PDF
This slide caters details about various metrics portraying online video hosting platform progress in terms of rise in subscribers, rise in average revenue per user, and overall revenue. Deliver and pitch your topic in the best possible manner with this various metrics determining online video hosting platform performance background pdf. Use them to share invaluable insights on various metrics determining online video hosting platform performance and impress your audience. This template can be altered and modified as per your expectations. So, grab it now.
Facebook Ad Campaign Performance Tracking Dashboard Ppt Show Picture PDF
This slide represents the KPI dashboard to effectively measure and monitor performance of Facebook marketing campaign conducted by the organization to enhance customer engagement. It includes details related to KPIs such as ad impressions, ad reach etc. Are you in need of a template that can accommodate all of your creative concepts This one is crafted professionally and can be altered to fit any style. Use it with Google Slides or PowerPoint. Include striking photographs, symbols, depictions, and other visuals. Fill, move around, or remove text boxes as desired. Test out color palettes and font mixtures. Edit and save your work, or work with colleagues. Download Facebook Ad Campaign Performance Tracking Dashboard Ppt Show Picture PDF and observe how to make your presentation outstanding. Give an impeccable presentation to your group and make your presentation unforgettable.
Facebook Ad Campaign Performance Tracking Dashboard Ppt Ideas Objects PDF
This slide represents the KPI dashboard to effectively measure and monitor performance of Facebook marketing campaign conducted by the organization to enhance customer engagement. It includes details related to KPIs such as ad impressions, ad reach etc. Are you in need of a template that can accommodate all of your creative concepts This one is crafted professionally and can be altered to fit any style. Use it with Google Slides or PowerPoint. Include striking photographs, symbols, depictions, and other visuals. Fill, move around, or remove text boxes as desired. Test out color palettes and font mixtures. Edit and save your work, or work with colleagues. Download Facebook Ad Campaign Performance Tracking Dashboard Ppt Ideas Objects PDF and observe how to make your presentation outstanding. Give an impeccable presentation to your group and make your presentation unforgettable.
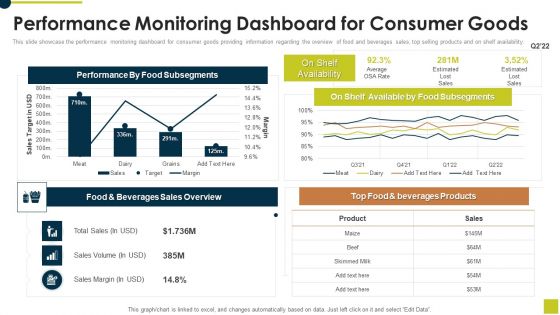
Performance Monitoring Dashboard For Consumer Goods Ppt Professional Ideas PDF
This slide showcase the performance monitoring dashboard for consumer goods providing information regarding the overview of food and beverages sales, top selling products and on shelf availability. Deliver an awe inspiring pitch with this creative Performance Monitoring Dashboard For Consumer Goods Ppt Professional Ideas PDF bundle. Topics like Food And Beverages, Sales Overview, Top Food Beverages, Products can be discussed with this completely editable template. It is available for immediate download depending on the needs and requirements of the user.
Content Marketing Freelance Metrics To Track Performance Icons PDF
The following slide highlights the content marketing freelance metrics to track performance which illustrates four categories of metrics depicting seo outcome, company revenue, user behaviour,and engagement. Persuade your audience using this Content Marketing Freelance Metrics To Track Performance Icons PDF. This PPT design covers four stages, thus making it a great tool to use. It also caters to a variety of topics including User Bahavior, Company Revenue, Engagement. Download this PPT design now to present a convincing pitch that not only emphasizes the topic but also showcases your presentation skills.
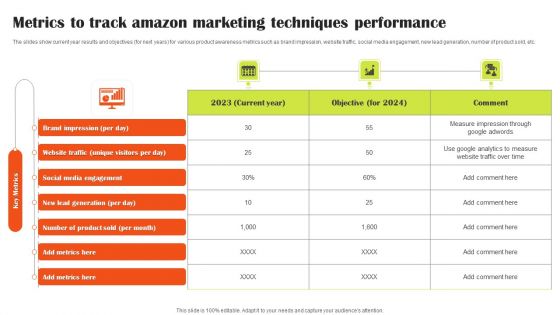
Metrics To Track Amazon Marketing Techniques Performance Ideas PDF
The slides show current year results and objectives for next years for various product awareness metrics such as brand impression, website traffic, social media engagement, new lead generation, number of product sold, etc. Pitch your topic with ease and precision using this Metrics To Track Amazon Marketing Techniques Performance Ideas PDF. This layout presents information on Metrics, Performance, Techniques. It is also available for immediate download and adjustment. So, changes can be made in the color, design, graphics or any other component to create a unique layout.
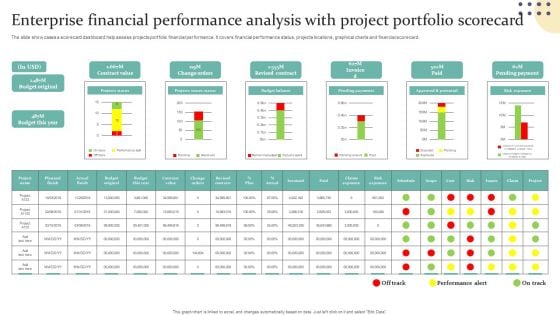
Enterprise Financial Performance Analysis With Project Portfolio Scorecard Guidelines PDF
The slide showcases a scorecard dashboard help assess projects portfolio financial performance. It covers financial performance status, projects locations, graphical charts and financial scorecard. Showcasing this set of slides titled Enterprise Financial Performance Analysis With Project Portfolio Scorecard Guidelines PDF. The topics addressed in these templates are Projects Status, Projects Issues Status, Budget Balance. All the content presented in this PPT design is completely editable. Download it and make adjustments in color, background, font etc. as per your unique business setting.
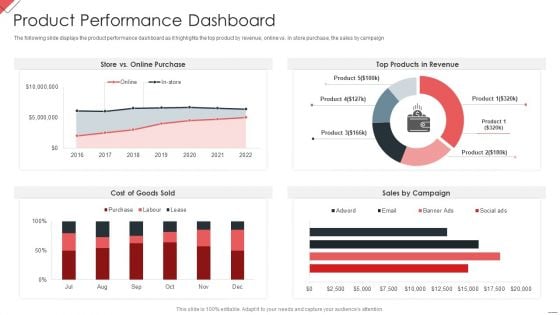
New Commodity Market Viability Review Product Performance Dashboard Infographics PDF
The following slide displays the product performance dashboard as it highlights the top product by revenue, online vs. in store purchase, the sales by campaign Deliver an awe inspiring pitch with this creative New Commodity Market Viability Review Product Performance Dashboard Infographics PDF bundle. Topics like Online Purchase, Products Revenue, Sales Campaign can be discussed with this completely editable template. It is available for immediate download depending on the needs and requirements of the user.
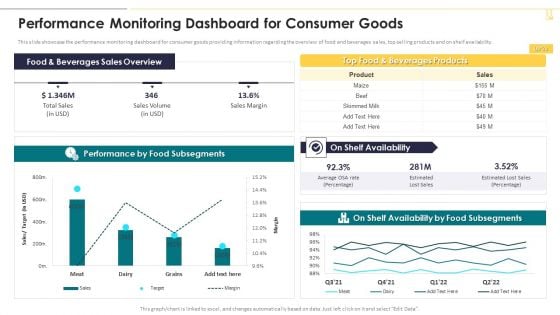
Performance Monitoring Dashboard For Consumer Goods Themes PDF
This slide showcase the performance monitoring dashboard for consumer goods providing information regarding the overview of food and beverages sales, top selling products and on shelf availability. Deliver an awe inspiring pitch with this creative Performance Monitoring Dashboard For Consumer Goods Themes PDF bundle. Topics like Beverages Sales Overview, Beverages Products, Availability can be discussed with this completely editable template. It is available for immediate download depending on the needs and requirements of the user.
Agile Virtual Project Management Agile Performance Evaluation Metrics Icons PDF
This slide covers the metrics used by the organisation to measure agile capability on the basis of product performance, security level and user satisfaction Present like a pro with Agile Virtual Project Management Agile Performance Evaluation Metrics Icons PDF Create beautiful presentations together with your team, using our easy-to-use presentation slides. Share your ideas in real-time and make changes on the fly by downloading our templates. So whether youre in the office, on the go, or in a remote location, you can stay in sync with your team and present your ideas with confidence. With Slidegeeks presentation got a whole lot easier. Grab these presentations today.
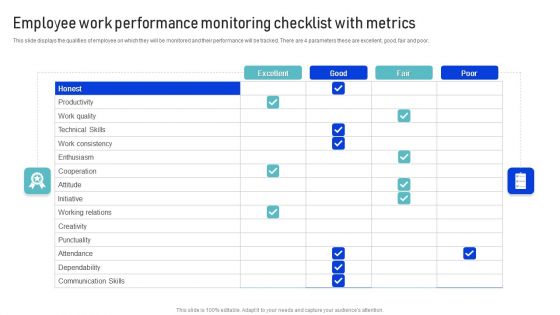
Employee Work Performance Monitoring Checklist With Metrics Infographics PDF
This slide displays the qualities of employee on which they will be monitored and their performance will be tracked. There are 4 parameters these are excellent, good, fair and poor. Showcasing this set of slides titled Employee Work Performance Monitoring Checklist With Metrics Infographics PDF. The topics addressed in these templates are Work Quality, Productivity, Communication Skills. All the content presented in this PPT design is completely editable. Download it and make adjustments in color, background, font etc. as per your unique business setting.
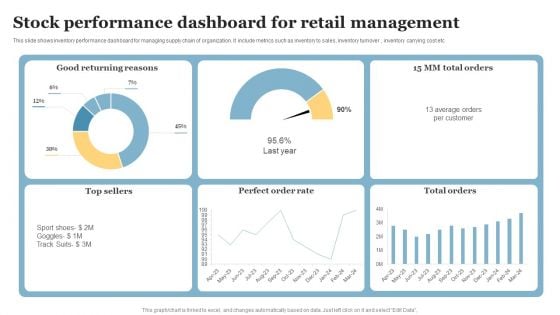
Stock Performance Dashboard For Retail Management Pictures PDF
This slide shows inventory performance dashboard for managing supply chain of organization. It include metrics such as inventory to sales, inventory turnover , inventory carrying cost etc. Pitch your topic with ease and precision using this Stock Performance Dashboard For Retail Management Pictures PDF. This layout presents information on Good Returning Reasons, Perfect Order Rate, Top Sellers. It is also available for immediate download and adjustment. So, changes can be made in the color, design, graphics or any other component to create a unique layout.
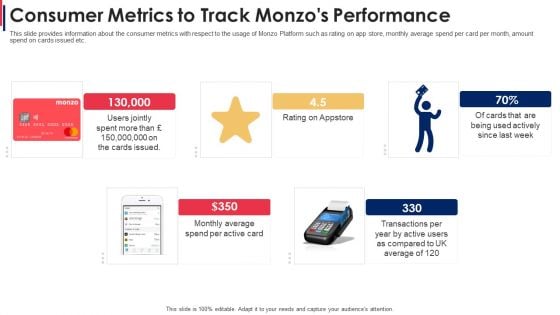
Consumer Metrics To Track Monzos Performance Formats PDF
This slide provides information about the consumer metrics with respect to the usage of Monzo Platform such as rating on app store, monthly average spend per card per month, amount spend on cards issued etc. This is a consumer metrics to track monzos performance formats pdf template with various stages. Focus and dispense information on five stages using this creative set, that comes with editable features. It contains large content boxes to add your information on topics like consumer metrics to track monzos performance. You can also showcase facts, figures, and other relevant content using this PPT layout. Grab it now.
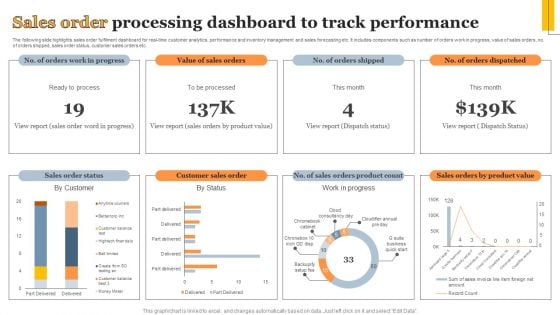
Sales Order Processing Dashboard To Track Performance Information PDF
The following slide highlights sales order fulfilment dashboard for real-time customer analytics, performance and inventory management and sales forecasting etc. It includes components such as number of orders work in progress, value of sales orders, no. of orders shipped, sales order status, customer sales orders etc. Showcasing this set of slides titled Sales Order Processing Dashboard To Track Performance Information PDF. The topics addressed in these templates are Sales Order Status, Customer Sales Order, Work Progress. All the content presented in this PPT design is completely editable. Download it and make adjustments in color, background, font etc. as per your unique business setting.

Team Performance Dashboard Ppt PowerPoint Presentation Example 2015
This is a team performance dashboard ppt powerpoint presentation example 2015. This is a four stage process. The stages in this process are reward, completion, overdue plans, problems, summary, completion.
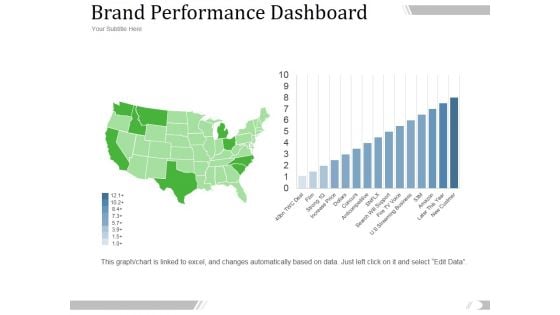
Brand Performance Dashboard Template 1 Ppt PowerPoint Presentation Inspiration
This is a brand performance dashboard template 1 ppt powerpoint presentation inspiration. This is a ten stage process. The stages in this process are new customer, film, dollars, amazon.
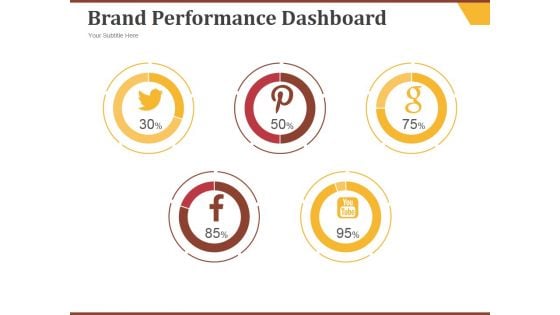
Brand Performance Dashboard Template 2 Ppt PowerPoint Presentation Template
This is a brand performance dashboard template 2 ppt powerpoint presentation template. This is a five stage process. The stages in this process are marketing, business, social, icons, management.
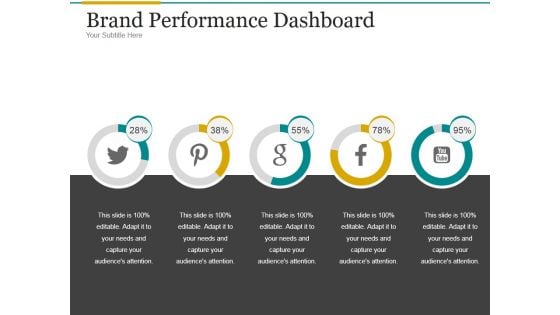
Brand Performance Dashboard Template 1 Ppt PowerPoint Presentation Layouts
This is a brand performance dashboard template 1 ppt powerpoint presentation layouts. This is a five stage process. The stages in this process are business, marketing, strategy, finance, analysis.
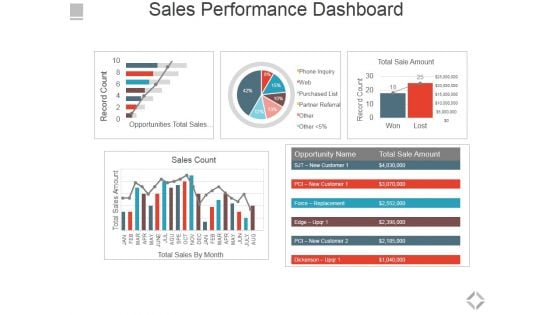
Sales Performance Dashboard Ppt PowerPoint Presentation File Graphics Pictures
This is a sales performance dashboard ppt powerpoint presentation file graphics pictures. This is a five stage process. The stages in this process are total sales by month, sales count, opportunities total sales by probability, total sale amount.
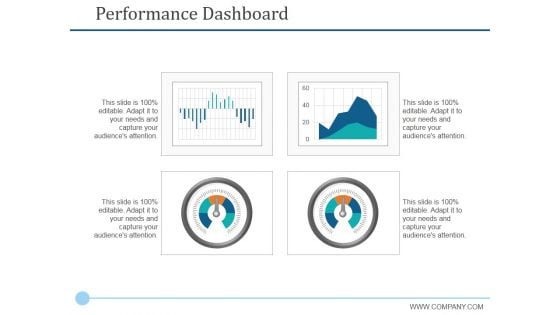
Performance Dashboard Template 2 Ppt PowerPoint Presentation Styles Graphics Tutorials
This is a performance dashboard template 2 ppt powerpoint presentation styles graphics tutorials. This is a four stage process. The stages in this process are finance, business, marketing, management.
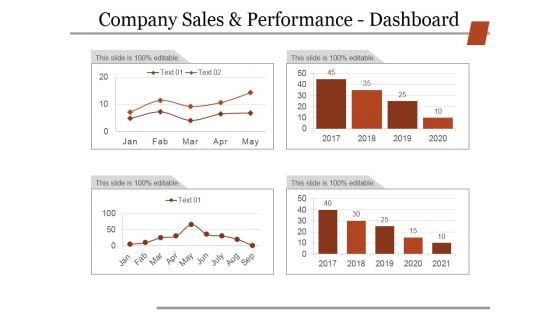
Company Sales And Performance Dashboard Ppt PowerPoint Presentation Slides Grid
This is a company sales and performance dashboard ppt powerpoint presentation slides grid. This is a four stage process. The stages in this process are business, strategy, marketing, finance, analysis.
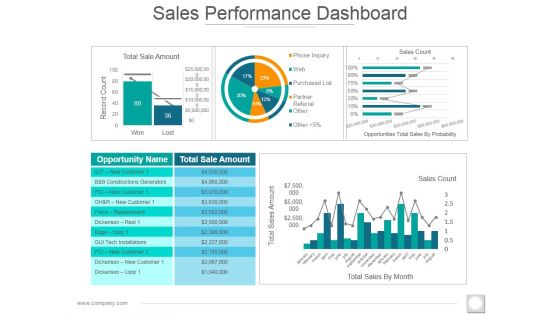
Sales Performance Dashboard Ppt PowerPoint Presentation Styles Images
This is a sales performance dashboard ppt powerpoint presentation styles images. This is a five stage process. The stages in this process are total sale amount, record count, sales count, total sales amount, total sales by month.
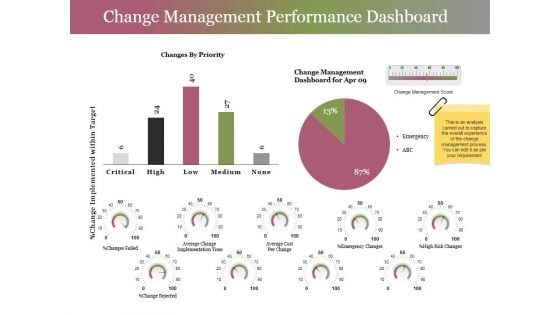
Change Management Performance Dashboard Ppt PowerPoint Presentation Layouts Master Slide
This is a change management performance dashboard ppt powerpoint presentation layouts master slide. This is a three stage process. The stages in this process are critical, high, low, medium, none.
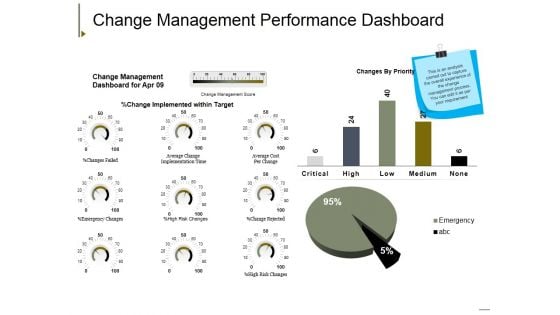
Change Management Performance Dashboard Ppt PowerPoint Presentation Summary Background Image
This is a change management performance dashboard ppt powerpoint presentation summary background image. This is a three stage process. The stages in this process are high risk changes, average change, implementation time, emergency changes, average cost per change, change rejected.
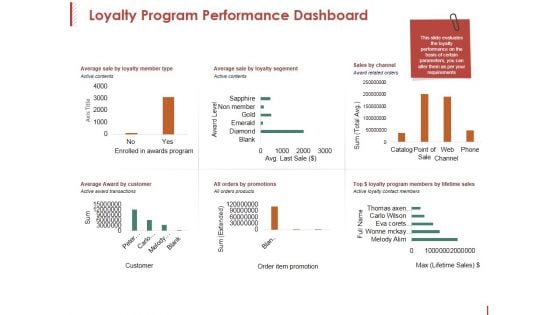
Loyalty Program Performance Dashboard Ppt PowerPoint Presentation Pictures Clipart
This is a loyalty program performance dashboard ppt powerpoint presentation pictures clipart. This is a six stage process. The stages in this process are axis title, award level, sum, active contents, channel.
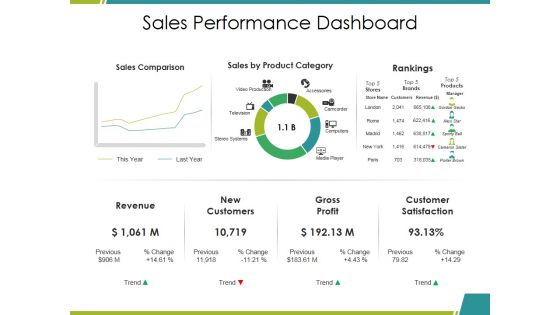
Sales Performance Dashboard Ppt PowerPoint Presentation Infographics Mockup
This is a sales performance dashboard ppt powerpoint presentation infographics mockup. This is a three stage process. The stages in this process are sales comparison, sales by product category, rankings, revenue, gross profit.
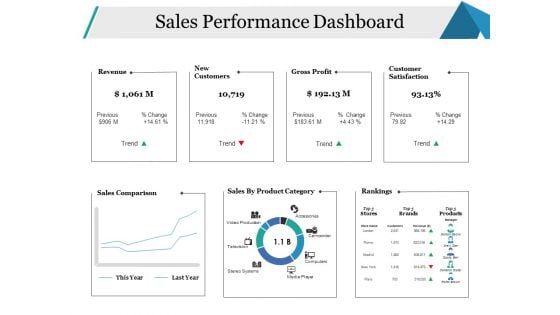
Sales Performance Dashboard Ppt PowerPoint Presentation Gallery Background
This is a sales performance dashboard ppt powerpoint presentation gallery backgroun. This is a six stage process. The stages in this process are sales comparison, sales by product category, rankings, revenue, new customers.
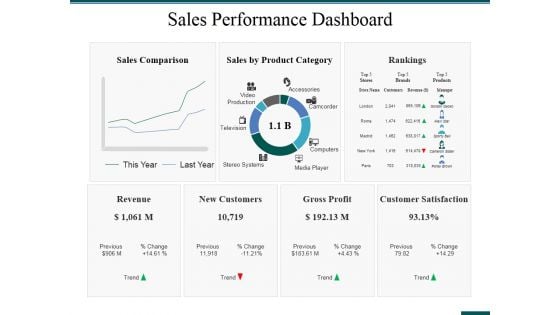
Sales Performance Dashboard Ppt PowerPoint Presentation Ideas Format Ideas
This is a sales performance dashboard ppt powerpoint presentation ideas format ideas. This is a three stage process. The stages in this process are rankings, revenue, new customers, gross profit, customer satisfaction.
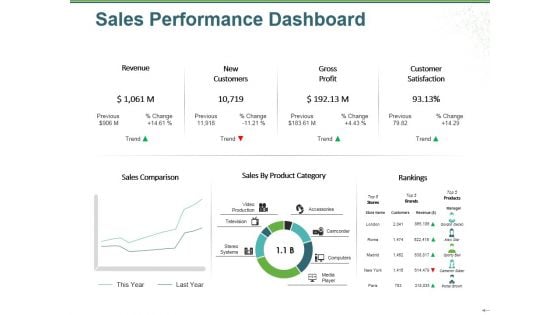
Sales Performance Dashboard Ppt PowerPoint Presentation Outline File Formats
This is a sales performance dashboard ppt powerpoint presentation outline file formats. This is a three stage process. The stages in this process are revenue, new customers, gross profit, customer satisfaction, rankings.
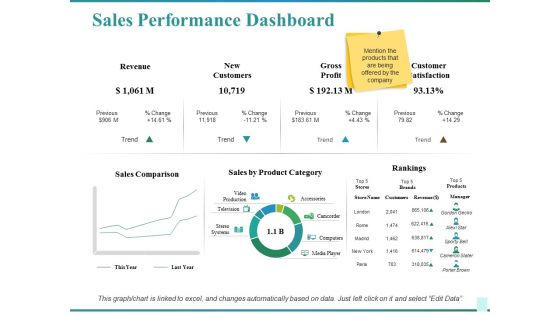
Sales Performance Dashboard Ppt PowerPoint Presentation Show Graphics Design
This is a sales performance dashboard ppt powerpoint presentation show graphics design. This is a two stage process. The stages in this process are sales comparison, sales by product category, rankings, customer satisfaction, revenue.
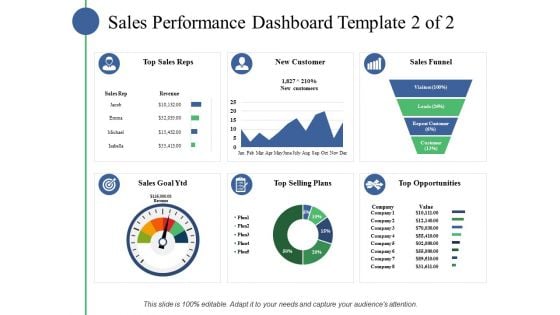
Sales Performance Dashboard Template Ppt PowerPoint Presentation Slides Example File
This is a sales performance dashboard template ppt powerpoint presentation slides example file. This is a eight stage process. The stages in this process are business, marketing, strategy, finance, planning.
Sales Performance Dashboard Ppt PowerPoint Presentation Professional Icons
This is a sales performance dashboard template ppt powerpoint presentation slides example file. This is a six stage process. The stages in this process are business, marketing, strategy, finance, planning.
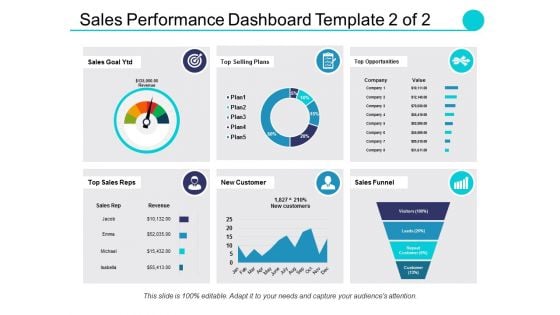
Sales Performance Dashboard Template Ppt PowerPoint Presentation Professional Elements
This is a sales performance dashboard template ppt powerpoint presentation professional elements. This is a eight stage process. The stages in this process are sales comparison, sales by product category, sales by month, brand profitability, revenue.
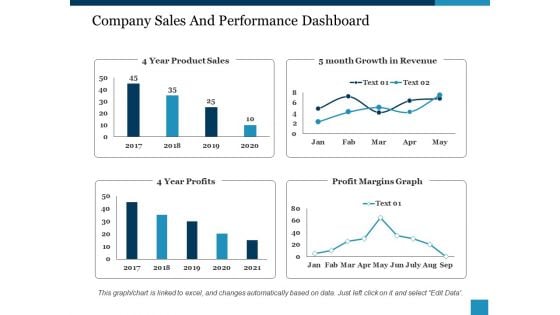
Company Sales And Performance Dashboard Ppt PowerPoint Presentation Show Structure
This is a company sales and performance dashboard ppt powerpoint presentation show structure. This is a four stage process. The stages in this process are year product sales, month growth in revenue, profit margins graph, year profits.
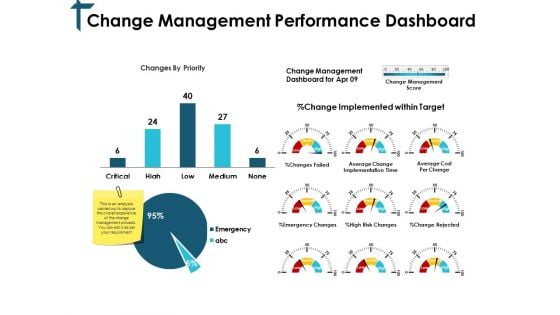
Change Management Performance Dashboard Ppt PowerPoint Presentation Professional Slides
This is a change management performance dashboard ppt powerpoint presentation professional slides. This is a three stage process. The stages in this process are finance, marketing, management, investment, analysis.

Loyalty Program Performance Dashboard Ppt Powerpoint Presentation Professional Templates
This is a loyalty program performance dashboard ppt powerpoint presentation professional templates. This is a six stage process. The stages in this process are finance, marketing, management, investment, analysis.
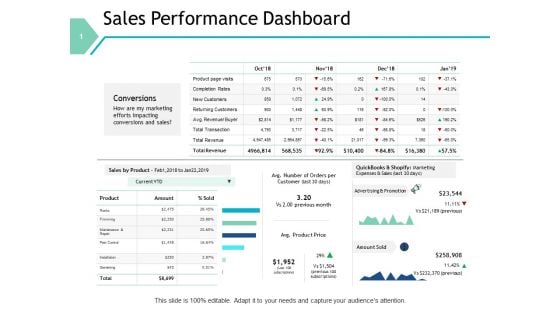
Sales Performance Dashboard Marketing Ppt PowerPoint Presentation Slides Graphics Design
This is a sales performance dashboard marketing ppt powerpoint presentation slides graphics design. This is a four stage process. The stages in this process are compare, marketing, business, management, planning.
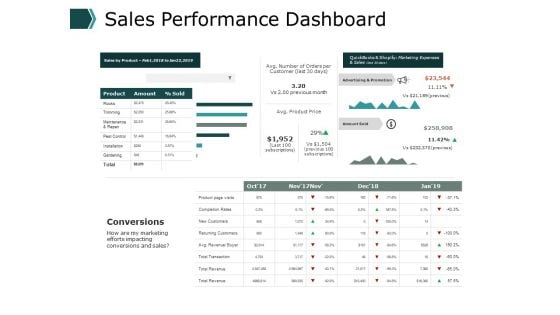
Sales Performance Dashboard Business Ppt PowerPoint Presentation Pictures Visuals
This is a sales performance dashboard business ppt powerpoint presentation pictures visuals . This is a three stage process. The stages in this process are finance, marketing, management, investment, analysis.

Loyalty Program Performance Dashboard Ppt Powerpoint Presentation Gallery Inspiration
This is a loyalty program performance dashboard ppt powerpoint presentation gallery inspiration. This is a six stage process. The stages in this process are finance, marketing, analysis, investment, strategy.
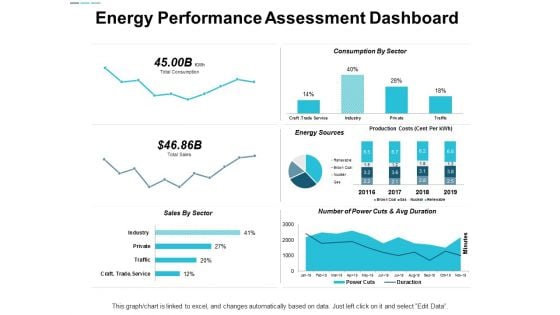
Energy Performance Assessment Dashboard Ppt Powerpoint Presentation Portfolio Deck
This is a energy performance assessment dashboard ppt powerpoint presentation portfolio deck. The topics discussed in this diagram are finance, marketing, management, investment, analysis. This is a completely editable PowerPoint presentation, and is available for immediate download.
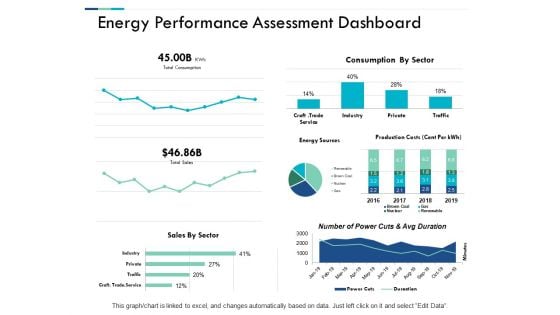
Energy Performance Assessment Dashboard Ppt PowerPoint Presentation Inspiration Background Designs
This is a energy performance assessment dashboard ppt powerpoint presentation inspiration background designs. The topics discussed in this diagram are finance, marketing, management, investment, analysis. This is a completely editable PowerPoint presentation, and is available for immediate download.
Product And Customer Performance Tracking Dashboard Portrait PDF
This slide provides information regarding dashboard utilized by firm to monitor performance of products offered and customer associated. The performance is tracked through revenues generated, new customer acquired, customer satisfaction, sales comparison, etc. Do you have an important presentation coming up Are you looking for something that will make your presentation stand out from the rest Look no further than Product And Customer Performance Tracking Dashboard Portrait PDF. With our professional designs, you can trust that your presentation will pop and make delivering it a smooth process. And with Slidegeeks, you can trust that your presentation will be unique and memorable. So why wait Grab Product And Customer Performance Tracking Dashboard Portrait PDF today and make your presentation stand out from the rest.
Product And Customer Performance Tracking Dashboard Summary PDF
This slide provides information regarding dashboard utilized by firm to monitor performance of products offered and customer associated. The performance is tracked through revenues generated, new customer acquired, customer satisfaction, sales comparison, etc. If you are looking for a format to display your unique thoughts, then the professionally designed Product And Customer Performance Tracking Dashboard Summary PDF is the one for you. You can use it as a Google Slides template or a PowerPoint template. Incorporate impressive visuals, symbols, images, and other charts. Modify or reorganize the text boxes as you desire. Experiment with shade schemes and font pairings. Alter, share or cooperate with other people on your work. Download Product And Customer Performance Tracking Dashboard Summary PDF and find out how to give a successful presentation. Present a perfect display to your team and make your presentation unforgettable.
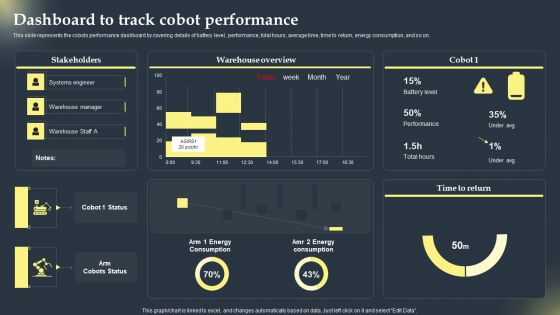
Cobots Global Statistics Dashboard To Track Cobot Performance Mockup PDF
This slide represents the cobots performance dashboard by covering details of battery level, performance, total hours, average time, time to return, energy consumption, and so on. If you are looking for a format to display your unique thoughts, then the professionally designed Cobots Global Statistics Dashboard To Track Cobot Performance Mockup PDF is the one for you. You can use it as a Google Slides template or a PowerPoint template. Incorporate impressive visuals, symbols, images, and other charts. Modify or reorganize the text boxes as you desire. Experiment with shade schemes and font pairings. Alter, share or cooperate with other people on your work. Download Cobots Global Statistics Dashboard To Track Cobot Performance Mockup PDF and find out how to give a successful presentation. Present a perfect display to your team and make your presentation unforgettable.
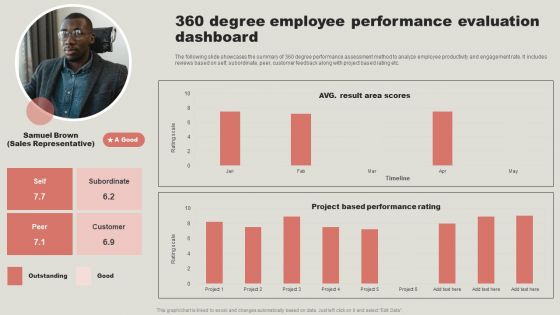
360 Degree Employee Performance Evaluation Dashboard Elements PDF
The following slide showcases the summary of 360 degree performance assessment method to analyze employee productivity and engagement rate. It includes reviews based on self, subordinate, peer, customer feedback along with project based rating etc. Presenting this PowerPoint presentation, titled 360 Degree Employee Performance Evaluation Dashboard Elements PDF, with topics curated by our researchers after extensive research. This editable presentation is available for immediate download and provides attractive features when used. Download now and captivate your audience. Presenting this 360 Degree Employee Performance Evaluation Dashboard Elements PDF. Our researchers have carefully researched and created these slides with all aspects taken into consideration. This is a completely customizable 360 Degree Employee Performance Evaluation Dashboard Elements PDF that is available for immediate downloading. Download now and make an impact on your audience. Highlight the attractive features available with our PPTs.


 Continue with Email

 Home
Home


