key performance indicators
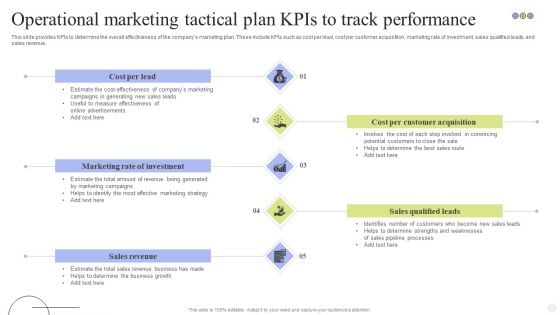
Operational Marketing Tactical Plan Kpis To Track Performance Background PDF
This slide provides KPIs to determine the overall effectiveness of the companys marketing plan. These include KPIs such as cost per lead, cost per customer acquisition, marketing rate of investment, sales qualified leads, and sales revenue. Presenting Operational Marketing Tactical Plan Kpis To Track Performance Background PDF to dispense important information. This template comprises five stages. It also presents valuable insights into the topics including Cost Per Lead, Cost Per Customer Acquisition, Sales Qualified Leads. This is a completely customizable PowerPoint theme that can be put to use immediately. So, download it and address the topic impactfully.
Project Performance Metrics Our Mission Ppt File Clipart Images PDF
This is a project performance metrics our mission ppt file clipart images pdf template with various stages. Focus and dispense information on three stages using this creative set, that comes with editable features. It contains large content boxes to add your information on topics like vision, mission, goal. You can also showcase facts, figures, and other relevant content using this PPT layout. Grab it now.
Supply Chain Management Operational Metrics Performance Measures Designs PDF
This is a supply chain management operational metrics performance measures designs pdf. template with various stages. Focus and dispense information on two stages using this creative set, that comes with editable features. It contains large content boxes to add your information on topics like NON financial measures, financial measures. You can also showcase facts, figures, and other relevant content using this PPT layout. Grab it now.
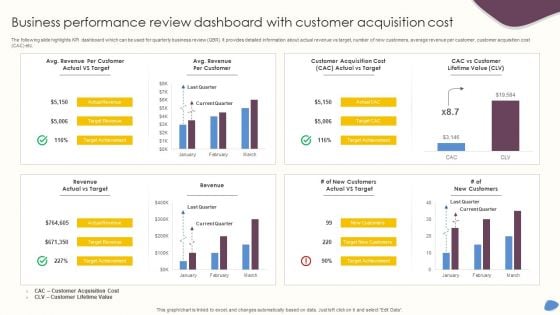
Business Performance Review Dashboard With Customer Acquisition Cost Diagrams PDF
The following slide highlights KPI dashboard which can be used for quarterly business review QBR. It provides detailed information about actual revenue vs target, number of new customers, average revenue per customer, customer acquisition cost CAC etc. Pitch your topic with ease and precision using this Business Performance Review Dashboard With Customer Acquisition Cost Diagrams PDF. This layout presents information on Revenue, Customer Acquisition Cost, Current Quarter. It is also available for immediate download and adjustment. So, changes can be made in the color, design, graphics or any other component to create a unique layout.
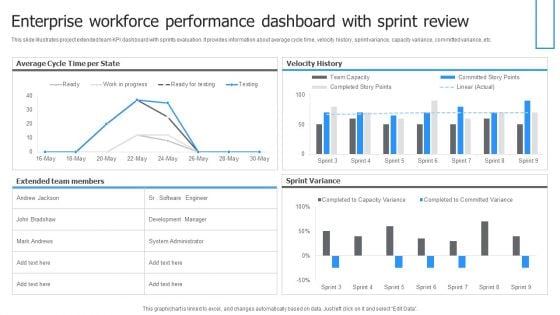
Enterprise Workforce Performance Dashboard With Sprint Review Themes PDF
This slide illustrates project extended team KPI dashboard with sprints evaluation. It provides information about average cycle time, velocity history, sprint variance, capacity variance, committed variance, etc. Showcasing this set of slides titled Enterprise Workforce Performance Dashboard With Sprint Review Themes PDF. The topics addressed in these templates are Velocity History, Sprint Variance, Average Cycle, Time Per State. All the content presented in this PPT design is completely editable. Download it and make adjustments in color, background, font etc. as per your unique business setting.
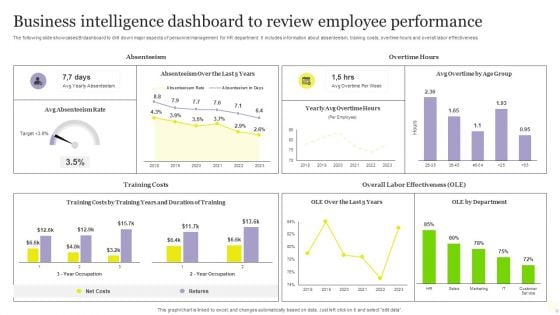
Business Intelligence Dashboard To Review Employee Performance Pictures PDF
The following slide showcases BI dashboard to drill down major aspects of personnel management for HR department. It includes information about absenteeism, training costs, overtime hours and overall labor effectiveness. Showcasing this set of slides titled Business Intelligence Dashboard To Review Employee Performance Pictures PDF. The topics addressed in these templates are Business Intelligence Dashboard, Review Employee Performance. All the content presented in this PPT design is completely editable. Download it and make adjustments in color, background, font etc. as per your unique business setting.
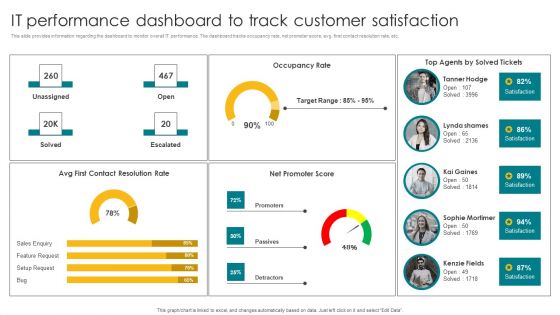
IT Performance Dashboard To Track Customer Satisfaction Elements PDF
This slide provides information regarding the dashboard to monitor overall IT performance. The dashboard tracks occupancy rate, net promoter score, avg. first contact resolution rate, etc. Boost your pitch with our creative IT Performance Dashboard To Track Customer Satisfaction Elements PDF. Deliver an awe inspiring pitch that will mesmerize everyone. Using these presentation templates you will surely catch everyones attention. You can browse the ppts collection on our website. We have researchers who are experts at creating the right content for the templates. So you do not have to invest time in any additional work. Just grab the template now and use them.
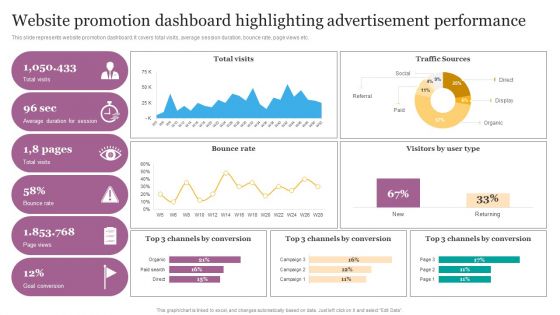
Website Promotion Dashboard Highlighting Advertisement Performance Ppt Infographics Portfolio PDF
This slide represents website promotion dashboard. It covers total visits, average session duration, bounce rate, page views etc. Create an editable Website Promotion Dashboard Highlighting Advertisement Performance Ppt Infographics Portfolio PDF that communicates your idea and engages your audience. Whether youre presenting a business or an educational presentation, pre designed presentation templates help save time. Website Promotion Dashboard Highlighting Advertisement Performance Ppt Infographics Portfolio PDF is highly customizable and very easy to edit, covering many different styles from creative to business presentations. Slidegeeks has creative team members who have crafted amazing templates. So, go and get them without any delay.
Tracking Performance Of Cloud Storage Deployment Dashboard Portrait PDF
The following slide highlights implementation of cloud storage performance tracking dashboard to improve innovation, to attain faster time to market. It includes components such as pinned folders, storage usage, recently used files, documents, images, videos, music, fonts, projects etc. Showcasing this set of slides titled Tracking Performance Of Cloud Storage Deployment Dashboard Portrait PDF. The topics addressed in these templates are Storage Usage, Dashboard, Tracking. All the content presented in this PPT design is completely editable. Download it and make adjustments in color, background, font etc. as per your unique business setting.

Project Performance Metrics Actual Cost Ppt Pictures PDF
This is a project performance metrics actual cost ppt pictures pdf template with various stages. Focus and dispense information on three stages using this creative set, that comes with editable features. It contains large content boxes to add your information on topics like project design, project development, project delivery, labor hours, other cost. You can also showcase facts, figures, and other relevant content using this PPT layout. Grab it now.
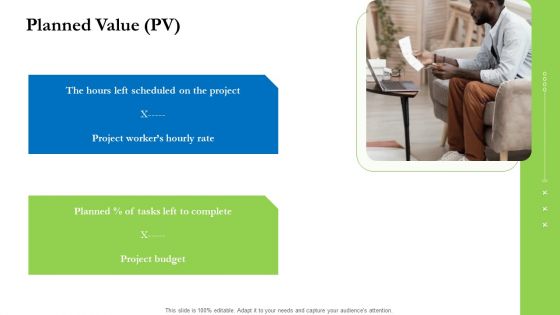
Project Performance Metrics Planned Value PV Ppt Show Backgrounds PDF
This is a project performance metrics planned value pv ppt show backgrounds pdf template with various stages. Focus and dispense information on two stages using this creative set, that comes with editable features. It contains large content boxes to add your information on topics like the hours left scheduled on the project, project workers hourly rate, planned percent of tasks left to complete, project budget. You can also showcase facts, figures, and other relevant content using this PPT layout. Grab it now.
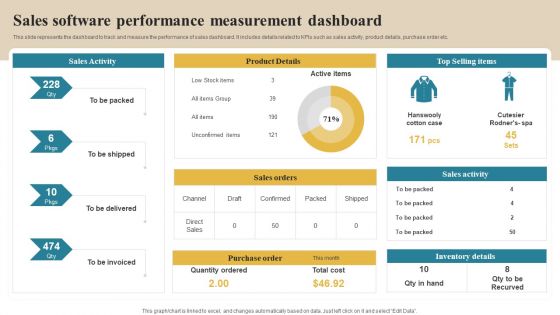
Software Implementation Technique Sales Software Performance Measurement Dashboard Slides PDF
This slide represents the dashboard to track and measure the performance of sales dashboard. It includes details related to KPIs such as sales activity, product details, purchase order etc. This modern and well arranged Software Implementation Technique Sales Software Performance Measurement Dashboard Slides PDF provides lots of creative possibilities. It is very simple to customize and edit with the Powerpoint Software. Just drag and drop your pictures into the shapes. All facets of this template can be edited with Powerpoint no extra software is necessary. Add your own material, put your images in the places assigned for them, adjust the colors, and then you can show your slides to the world, with an animated slide included.
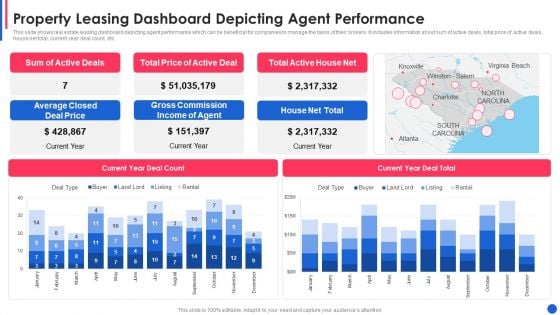
Property Leasing Dashboard Depicting Agent Performance Guidelines PDF
This slide shows real estate leasing dashboard depicting agent performance which can be beneficial for companies to manage the tasks of their brokers. It includes information about sum of active deals, total price of active deals, house net total, current year deal count, etc.Pitch your topic with ease and precision using this property leasing dashboard depicting agent performance guidelines pdf This layout presents information on average closed deal price, gross commission income, total active house net It is also available for immediate download and adjustment. So, changes can be made in the color, design, graphics or any other component to create a unique layout.
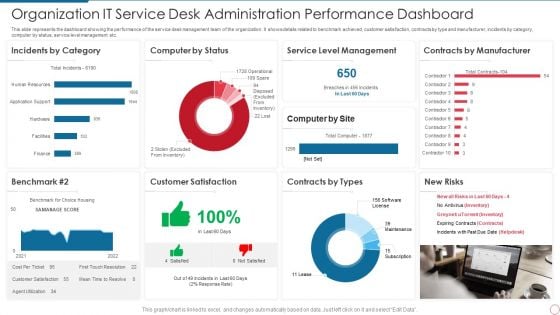
Organization IT Service Desk Administration Performance Dashboard Infographics PDF
This slide represents the dashboard showing the performance of the service desk management team of the organization. It shows details related to benchmark achieved, customer satisfaction, contracts by type and manufacturer, incidents by category, computer by status, service level management etc. Showcasing this set of slides titled Organization IT Service Desk Administration Performance Dashboard Infographics PDF. The topics addressed in these templates are Service, Management, Manufacturer. All the content presented in this PPT design is completely editable. Download it and make adjustments in color, background, font etc. as per your unique business setting.
Marketing And Operations Dashboard For Performance Management Icons PDF
This slide covers sales and operation dashboard for performance management. It involves details such as number of new buyers, sales revenue, average revenue per unit etc. Pitch your topic with ease and precision using this Marketing And Operations Dashboard For Performance Management Icons PDF. This layout presents information on Average Revenue Per Unit, Customer Acquisition Cost, Customer Lifetime Value. It is also available for immediate download and adjustment. So, changes can be made in the color, design, graphics or any other component to create a unique layout.
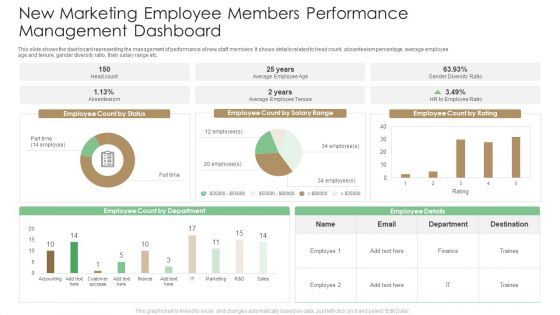
New Marketing Employee Members Performance Management Dashboard Summary PDF
This slide shows the dashboard representing the management of performance of new staff members. It shows details related to head count, absenteeism percentage, average employee age and tenure, gender diversity ratio, their salary range etc. Pitch your topic with ease and precision using this New Marketing Employee Members Performance Management Dashboard Summary PDF. This layout presents information on Employee Ratio, Average Employee Tenure. It is also available for immediate download and adjustment. So, changes can be made in the color, design, graphics or any other component to create a unique layout.
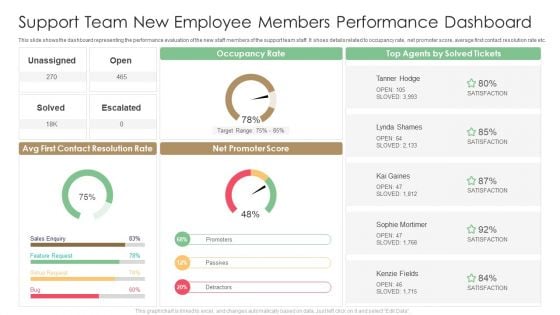
Support Team New Employee Members Performance Dashboard Designs PDF
This slide shows the dashboard representing the performance evaluation of the new staff members of the support team staff. It shoes details related to occupancy rate, net promoter score, average first contact resolution rate etc. Pitch your topic with ease and precision using this Support Team New Employee Members Performance Dashboard Designs PDF. This layout presents information on Target Range, Occupancy Rate, Contact Resolution Rate. It is also available for immediate download and adjustment. So, changes can be made in the color, design, graphics or any other component to create a unique layout.
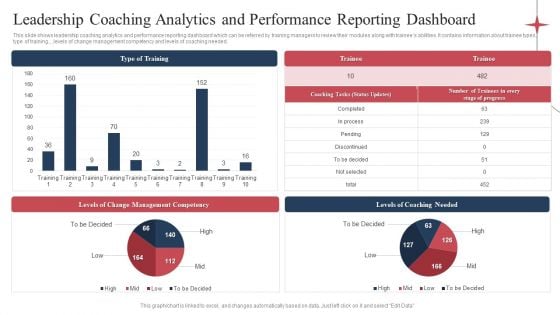
Leadership Coaching Analytics And Performance Reporting Dashboard Demonstration PDF
This slide shows leadership coaching analytics and performance reporting dashboard which can be referred by training managers to review their modules along with trainees abilities. It contains information about trainee types, type of training., ,levels of change management competency and levels of coaching needed. Pitch your topic with ease and precision using this Leadership Coaching Analytics And Performance Reporting Dashboard Demonstration PDF. This layout presents information on Levels Coaching Needed, Levels Change Management, Type Training. It is also available for immediate download and adjustment. So, changes can be made in the color, design, graphics or any other component to create a unique layout.
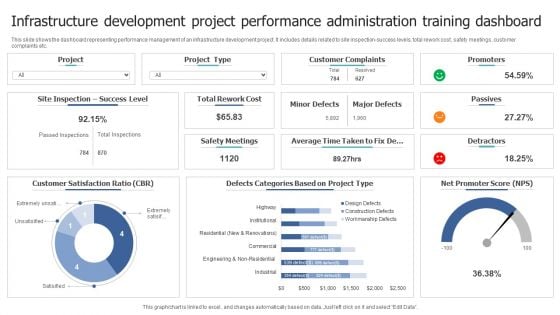
Infrastructure Development Project Performance Administration Training Dashboard Professional PDF
This slide shows the dashboard representing performance management of an infrastructure development project. It includes details related to site inspection success levels, total rework cost, safety meetings, customer complaints etc. Showcasing this set of slides titled Infrastructure Development Project Performance Administration Training Dashboard Professional PDF. The topics addressed in these templates are Customer Satisfaction Ratio, Customer Complaints, Rework Cost. All the content presented in this PPT design is completely editable. Download it and make adjustments in color, background, font etc. as per your unique business setting.
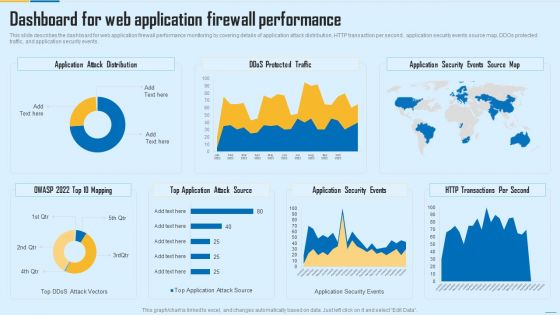
Dashboard For Web Application Firewall Performance WAF Platform Diagrams PDF
This slide describes the dashboard for web application firewall performance monitoring by covering details of application attack distribution, HTTP transaction per second, application security events source map, DDOs protected traffic, and application security events. Deliver an awe inspiring pitch with this creative Dashboard For Web Application Firewall Performance WAF Platform Diagrams PDF bundle. Topics like Application Attack Distribution, Application Security Events, Transactions Per Second can be discussed with this completely editable template. It is available for immediate download depending on the needs and requirements of the user.
Retail Assortment Dashboard Depicting Store Performance Ppt Icon Structure PDF
This slide shows product assortment dashboard depicting store performance which can benefit managers in reviewing the current situation of outlets and make decisions according to reached benchmarks. It includes details about achieved sales, rate of conversion, weekday vs. Weekend sales, daily trend, etc. Showcasing this set of slides titled Retail Assortment Dashboard Depicting Store Performance Ppt Icon Structure PDF. The topics addressed in these templates are Achieved Sales, Rate Of Conversion, Daily Trend, Outlet Sales. All the content presented in this PPT design is completely editable. Download it and make adjustments in color, background, font etc. as per your unique business setting.
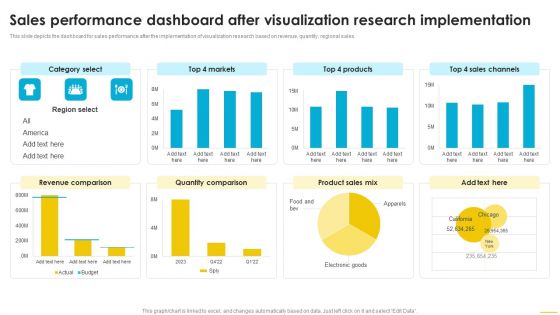
Sales Performance Dashboard After Visualization Research Implementation Introduction PDF
This slide depicts the dashboard for sales performance after the implementation of visualization research based on revenue, quantity, regional sales. Welcome to our selection of the Sales Performance Dashboard After Visualization Research Implementation Introduction PDF. These are designed to help you showcase your creativity and bring your sphere to life. Planning and Innovation are essential for any business that is just starting out. This collection contains the designs that you need for your everyday presentations. All of our PowerPoints are 100 percent editable, so you can customize them to suit your needs. This multi purpose template can be used in various situations. Grab these presentation templates today.
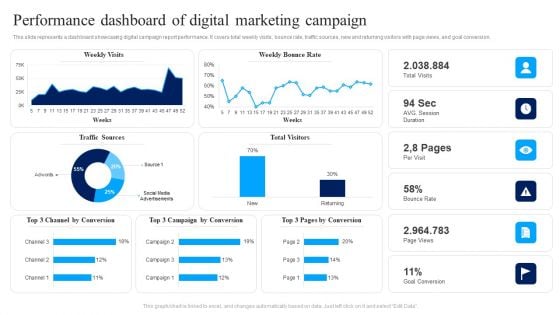
Performance Dashboard Of Digital Marketing Campaign Ppt Show Slide PDF
This slide represents a dashboard showcasing digital campaign report performance. It covers total weekly visits, bounce rate, traffic sources, new and returning visitors with page views, and goal conversion. Pitch your topic with ease and precision using this Performance Dashboard Of Digital Marketing Campaign Ppt Show Slide PDF. This layout presents information on Weekly Visits, Weekly Bounce Rate, Bounce Rate. It is also available for immediate download and adjustment. So, changes can be made in the color, design, graphics or any other component to create a unique layout.
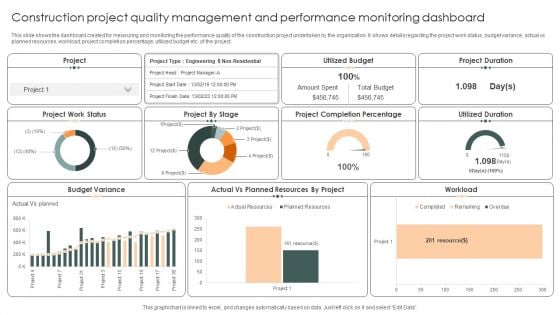
Construction Project Quality Management And Performance Monitoring Dashboard Themes PDF
This slide shows the dashboard created for measuring and monitoring the performance quality of the construction project undertaken by the organization. It shows details regarding the project work status, budget variance, actual vs planned resources, workload, project completion percentage, utilized budget etc. of the project.Showcasing this set of slides titled Construction Project Quality Management And Performance Monitoring Dashboard Themes PDF. The topics addressed in these templates are Planned Resources, Project Duration, Budget Variance. All the content presented in this PPT design is completely editable. Download it and make adjustments in color, background, font etc. as per your unique business setting.

Digital Marketing Campaign Performance Monitoring Dashboard Pictures PDF
This slide represents the dashboard for measuring and monitoring the performance of digital marketing campaign. It includes information related to the advertisement cost, cost per conversion, no. of clicks, conversion rate, impressions, cost per click, click through rate and cost per thousand impressions of the project.Pitch your topic with ease and precision using this Digital Marketing Campaign Performance Monitoring Dashboard Pictures PDF. This layout presents information on Conversion Rate, Per Conversion, Cost Per Thousand. It is also available for immediate download and adjustment. So, changes can be made in the color, design, graphics or any other component to create a unique layout.
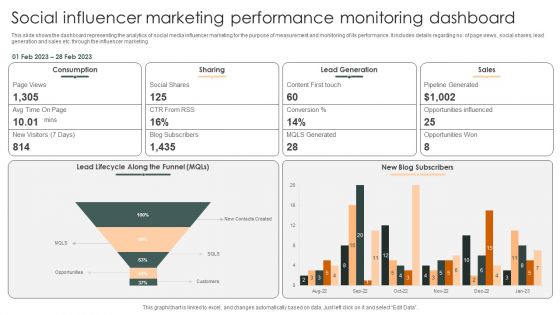
Social Influencer Marketing Performance Monitoring Dashboard Slides PDF
This slide shows the dashboard representing the analytics of social media influencer marketing for the purpose of measurement and monitoring of its performance. It includes details regarding no. of page views, social shares, lead generation and sales etc. through the influencer marketing.Pitch your topic with ease and precision using this Social Influencer Marketing Performance Monitoring Dashboard Slides PDF. This layout presents information on Lead Generation, Pipeline Generated, Opportunities Influenced. It is also available for immediate download and adjustment. So, changes can be made in the color, design, graphics or any other component to create a unique layout.
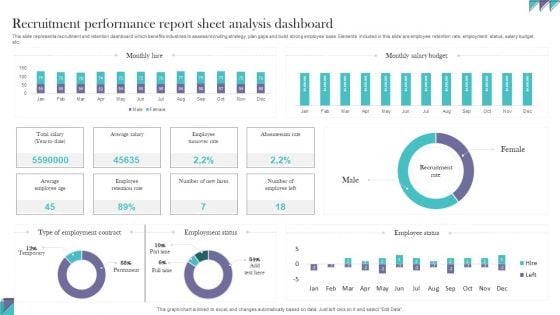
Recruitment Performance Report Sheet Analysis Dashboard Information PDF
This slide represents recruitment and retention dashboard which benefits industries to assess recruiting strategy, plan gaps and build strong employee base. Elements included in this slide are employee retention rate, employment status, salary budget, etc. Pitch your topic with ease and precision using this Recruitment Performance Report Sheet Analysis Dashboard Information PDF. This layout presents information onRecruitment Performance, Report Sheet Analysis. It is also available for immediate download and adjustment. So, changes can be made in the color, design, graphics or any other component to create a unique layout.
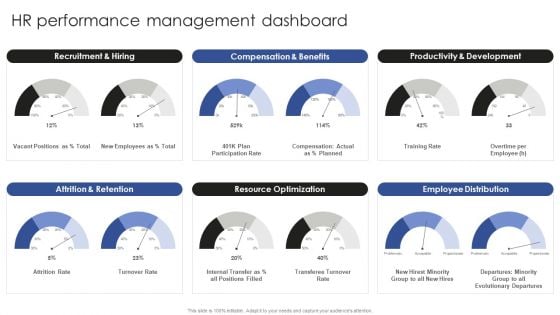
Talent Administration And Succession HR Performance Management Dashboard Background PDF
Whether you have daily or monthly meetings, a brilliant presentation is necessary. Talent Administration And Succession HR Performance Management Dashboard Background PDF can be your best option for delivering a presentation. Represent everything in detail using Talent Administration And Succession HR Performance Management Dashboard Background PDF and make yourself stand out in meetings. The template is versatile and follows a structure that will cater to your requirements. All the templates prepared by Slidegeeks are easy to download and edit. Our research experts have taken care of the corporate themes as well. So, give it a try and see the results.
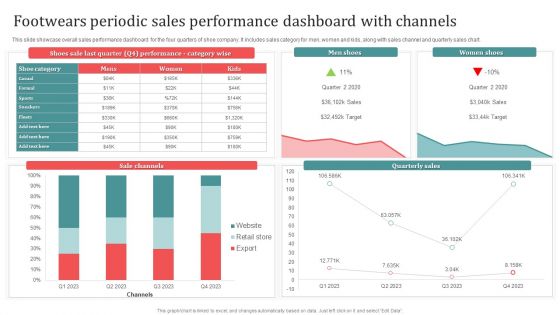
Footwears Periodic Sales Performance Dashboard With Channels Download PDF
This slide showcase overall sales performance dashboard for the four quarters of shoe company. It includes sales category for men, women and kids, along with sales channel and quarterly sales chart. Showcasing this set of slides titled Footwears Periodic Sales Performance Dashboard With Channels Download PDF. The topics addressed in these templates are Men Shoes, Women Shoes, Sale Channels. All the content presented in this PPT design is completely editable. Download it and make adjustments in color, background, font etc. as per your unique business setting.
Overall Marketing Dashboard Showcasing Market Performance Icons PDF
This slide showcases mass marketing dashboard which helps marketers in assessing there business performance. It provides information regarding net promoter score, inbound leads, sales per platform etc. Showcasing this set of slides titled Overall Marketing Dashboard Showcasing Market Performance Icons PDF. The topics addressed in these templates are Standard Customers, Market Share Growth Rate, Customer Locations . All the content presented in this PPT design is completely editable. Download it and make adjustments in color, background, font etc. as per your unique business setting.
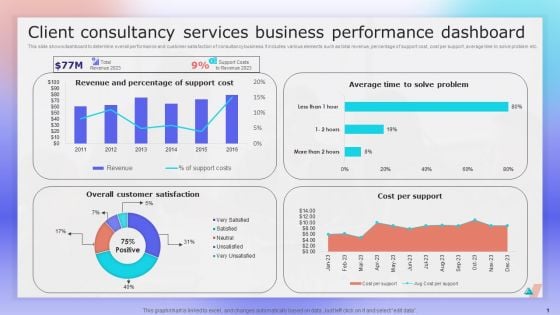
Client Consultancy Services Business Performance Dashboard Ppt File Layout PDF
This slide shows dashboard to determine overall performance and customer satisfaction of consultancy business. It includes various elements such as total revenue, percentage of support cost, cost per support, average time to solve problem etc. Showcasing this set of slides titled Client Consultancy Services Business Performance Dashboard Ppt File Layout PDF. The topics addressed in these templates are Revenue And Percentage, Support Cost, Cost Per Support. All the content presented in this PPT design is completely editable. Download it and make adjustments in color, background, font etc. as per your unique business setting.

Virtual Performance Management And Monitoring Dashboard Pictures PDF
Following slide illustrates remote performance dashboard utilized by organizations to monitor active issues and stay ahead of problems. This slide provides data regarding issues, problematic servers, unmonitored devices, server status, reboot time, etc. Pitch your topic with ease and precision using this Virtual Performance Management And Monitoring Dashboard Pictures PDF. This layout presents information on Total Devices, Devices With Problem, Regular Safety Check Problems. It is also available for immediate download and adjustment. So, changes can be made in the color, design, graphics or any other component to create a unique layout.
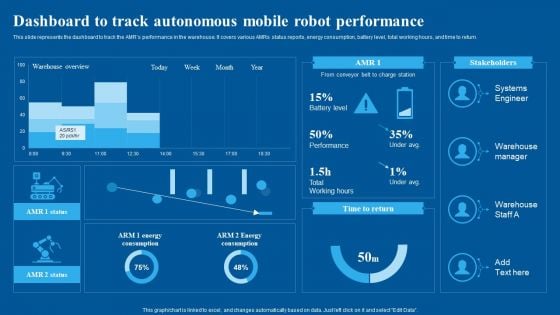
Dashboard To Track Autonomous Mobile Robot Performance Infographics PDF
This slide represents the dashboard to track the AMRs performance in the warehouse. It covers various AMRs status reports, energy consumption, battery level, total working hours, and time to return. Take your projects to the next level with our ultimate collection of Dashboard To Track Autonomous Mobile Robot Performance Infographics PDF. Slidegeeks has designed a range of layouts that are perfect for representing task or activity duration, keeping track of all your deadlines at a glance. Tailor these designs to your exact needs and give them a truly corporate look with your own brand colors they will make your projects stand out from the rest.
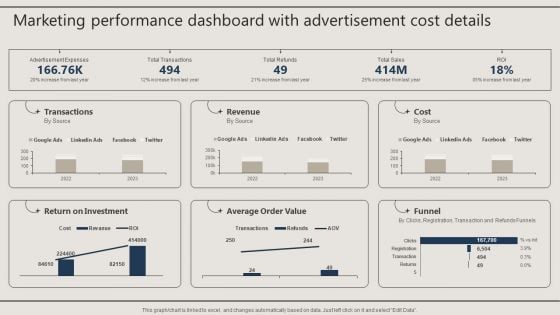
Marketing Performance Dashboard With Advertisement Cost Details Download PDF
Here you can discover an assortment of the finest PowerPoint and Google Slides templates. With these templates, you can create presentations for a variety of purposes while simultaneously providing your audience with an eye catching visual experience. Download Marketing Performance Dashboard With Advertisement Cost Details Download PDF to deliver an impeccable presentation. These templates will make your job of preparing presentations much quicker, yet still, maintain a high level of quality. Slidegeeks has experienced researchers who prepare these templates and write high quality content for you. Later on, you can personalize the content by editing the Marketing Performance Dashboard With Advertisement Cost Details Download PDF.
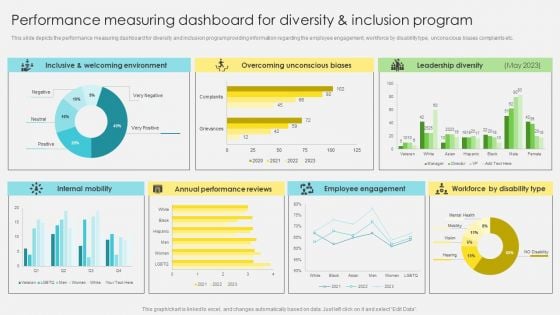
Performance Measuring Dashboard For Diversity And Inclusion Program Template PDF
This slide depicts the performance measuring dashboard for diversity and inclusion program providing information regarding the employee engagement, workforce by disability type, unconscious biases complaints etc. The Performance Measuring Dashboard For Diversity And Inclusion Program Template PDF is a compilation of the most recent design trends as a series of slides. It is suitable for any subject or industry presentation, containing attractive visuals and photo spots for businesses to clearly express their messages. This template contains a variety of slides for the user to input data, such as structures to contrast two elements, bullet points, and slides for written information. Slidegeeks is prepared to create an impression.
Projection Model Predictive Analytics Model Performance Tracking Dashboard Microsoft PDF
This slide represents the predictive analytics model performance tracking dashboard, and it covers the details of total visitors, total buyers, total products added to the cart, filters by date and category, visitors to clients conversion rate, and so on. Find a pre-designed and impeccable Projection Model Predictive Analytics Model Performance Tracking Dashboard Microsoft PDF. The templates can ace your presentation without additional effort. You can download these easy-to-edit presentation templates to make your presentation stand out from others. So, what are you waiting for Download the template from Slidegeeks today and give a unique touch to your presentation.
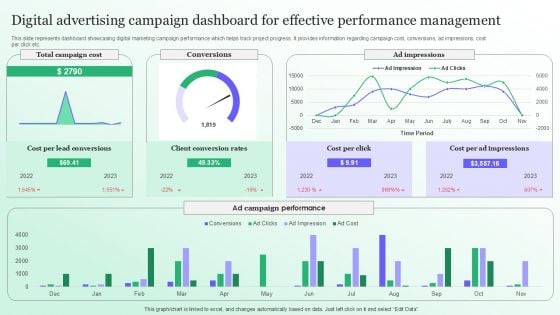
Digital Advertising Campaign Dashboard For Effective Performance Management Sample PDF

Dashboard To Measure Robotic Process Automation Bots Performance Structure PDF
This slide presents a dashboard to measure RPA bots performance in an organization. It includes utilization hours, bot types, average daily utilization, percentage of errors that occurred by bots, and occupied bots by business operations. If your project calls for a presentation, then Slidegeeks is your go-to partner because we have professionally designed, easy-to-edit templates that are perfect for any presentation. After downloading, you can easily edit Dashboard To Measure Robotic Process Automation Bots Performance Structure PDF and make the changes accordingly. You can rearrange slides or fill them with different images. Check out all the handy templates
Zero Trust Network Access Performance Tracking Dashboard Template PDF
This slide represents the performance tracking dashboard for zero trust network access. The purpose of this slide is to showcase the level of request modes, connected users, daily usage of the network, security rating, device risk and threat flow. Find a pre-designed and impeccable Zero Trust Network Access Performance Tracking Dashboard Template PDF. The templates can ace your presentation without additional effort. You can download these easy-to-edit presentation templates to make your presentation stand out from others. So, what are you waiting for Download the template from Slidegeeks today and give a unique touch to your presentation.
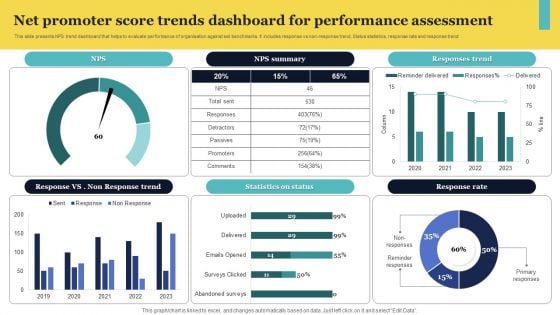
Net Promoter Score Trends Dashboard For Performance Assessment Elements PDF
This slide presents NPS trend dashboard that helps to evaluate performance of organisation against set benchmarks. It includes response vs non-response trend, Status statistics, response rate and response trend Pitch your topic with ease and precision using this Net Promoter Score Trends Dashboard For Performance Assessment Elements PDF. This layout presents information on Response Trend, Summary, Status. It is also available for immediate download and adjustment. So, changes can be made in the color, design, graphics or any other component to create a unique layout.
Promotional Campaign Performance Tracking Dashboard For Business Growth Information PDF
This slide represents dashboard showcasing advertising campaign performance progress which helps to manage marketing activities effectively. It provides information regarding total marketing cost, website impressions, content clicks, customer acquisition, cost per campaign etc. Showcasing this set of slides titled Promotional Campaign Performance Tracking Dashboard For Business Growth Information PDF. The topics addressed in these templates are Website Impression, Content Clicks, Customer Acquisition . All the content presented in this PPT design is completely editable. Download it and make adjustments in color, background, font etc. as per your unique business setting.
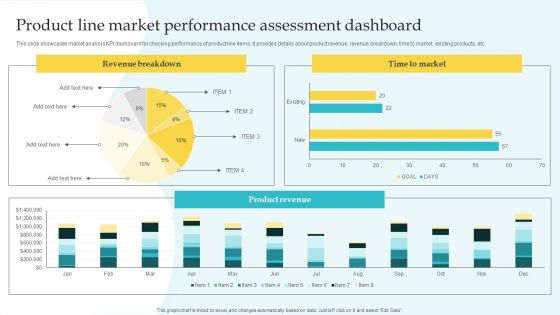
Commodity Line Expansion Product Line Market Performance Assessment Download PDF
This slide showcases market analysis KPI dashboard for checking performance of product line items. It provides details about product revenue, revenue breakdown, time to market, existing products, etc. Explore a selection of the finest Commodity Line Expansion Product Line Market Performance Assessment Download PDF here. With a plethora of professionally designed and pre-made slide templates, you can quickly and easily find the right one for your upcoming presentation. You can use our Commodity Line Expansion Product Line Market Performance Assessment Download PDF to effectively convey your message to a wider audience. Slidegeeks has done a lot of research before preparing these presentation templates. The content can be personalized and the slides are highly editable. Grab templates today from Slidegeeks.
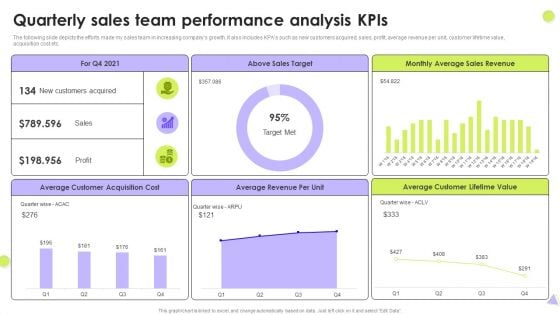
Quarterly Sales Team Performance Analysis Kpis Slides PDF
The following slide depicts the efforts made my sales team in increasing companys growth. It also includes KPAs such as new customers acquired, sales, profit, average revenue per unit, customer lifetime value, acquisition cost etc. Showcasing this set of slides titled Quarterly Sales Team Performance Analysis Kpis Slides PDF. The topics addressed in these templates are Above Sales Target, Average Sales Revenue, Average Customer. All the content presented in this PPT design is completely editable. Download it and make adjustments in color, background, font etc. as per your unique business setting.
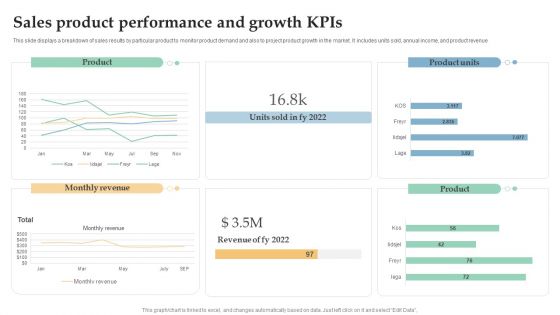
Sales Product Performance And Growth Kpis Ppt Layouts Mockup PDF
This slide displays a breakdown of sales results by particular product to monitor product demand and also to project product growth in the market. It includes units sold, annual income, and product revenue. Pitch your topic with ease and precision using this Sales Product Performance And Growth Kpis Ppt Layouts Mockup PDF. This layout presents information on Monthly Revenue, Product, Product Units. It is also available for immediate download and adjustment. So, changes can be made in the color, design, graphics or any other component to create a unique layout.
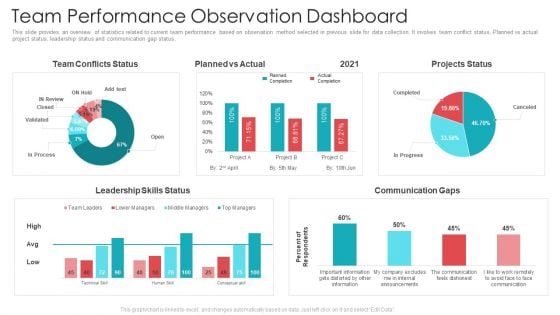
Official Team Collaboration Plan Team Performance Observation Dashboard Background PDF
This slide provides an overview of statistics related to current team performance based on observation method selected in previous slide for data collection. It involves team conflict status, Planned vs actual project status, leadership status and communication gap status. Deliver an awe-inspiring pitch with this creative official team collaboration plan team performance observation dashboard background pdf bundle. Topics like leadership skills status, team conflicts status, communication gaps can be discussed with this completely editable template. It is available for immediate download depending on the needs and requirements of the user.
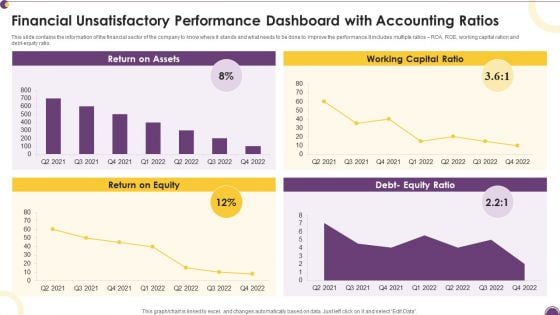
Financial Unsatisfactory Performance Dashboard With Accounting Ratios Diagrams PDF
This slide contains the information of the financial sector of the company to know where it stands and what needs to be done to improve the performance.It includes multiple ratios ROA, ROE, working capital ration and debt-equity ratio. Pitch your topic with ease and precision using this Financial Unsatisfactory Performance Dashboard With Accounting Ratios Diagrams PDF. This layout presents information on Return Assets, Working Capital, Return Equity. It is also available for immediate download and adjustment. So, changes can be made in the color, design, graphics or any other component to create a unique layout.
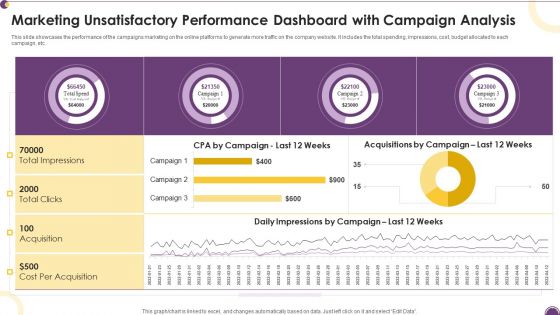
Marketing Unsatisfactory Performance Dashboard With Campaign Analysis Information PDF
This slide showcases the performance of the campaigns marketing on the online platforms to generate more traffic on the company website. It includes the total spending, impressions, cost, budget allocated to each campaign, etc.Pitch your topic with ease and precision using this Marketing Unsatisfactory Performance Dashboard With Campaign Analysis Information PDF. This layout presents information on Cost Acquisition, Total Clicks, Total Impressions. It is also available for immediate download and adjustment. So, changes can be made in the color, design, graphics or any other component to create a unique layout.

Weekly Performance Report Dashboard With Project Budget Download PDF
This slide contains the weekly performance report of various phases of project with the overdue tasks and their upcoming . it also includes the project budget with the tracking of workload on staff members. Pitch your topic with ease and precision using this Weekly Performance Report Dashboard With Project Budget Download PDF. This layout presents information on Planning, Design, Development, Testing. It is also available for immediate download and adjustment. So, changes can be made in the color, design, graphics or any other component to create a unique layout.
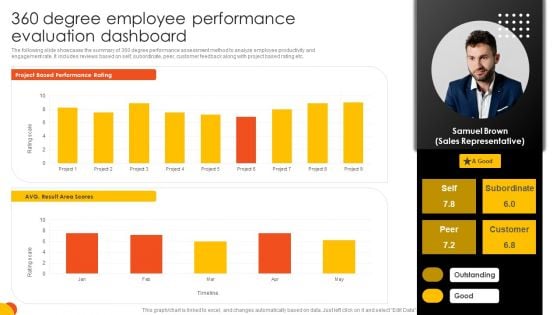
360 Degree Employee Performance Evaluation Dashboard Portrait PDF
The following slide showcases the summary of 360 degree performance assessment method to analyze employee productivity and engagement rate. It includes reviews based on self, subordinate, peer, customer feedback along with project based rating etc. Find a pre designed and impeccable 360 Degree Employee Performance Evaluation Dashboard Portrait PDF. The templates can ace your presentation without additional effort. You can download these easy to edit presentation templates to make your presentation stand out from others. So, what are you waiting for Download the template from Slidegeeks today and give a unique touch to your presentation.
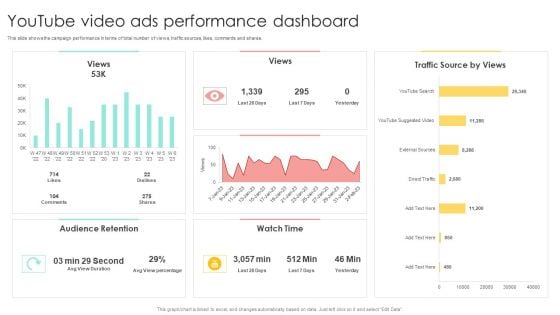
Media Advertising Youtube Video Ads Performance Dashboard Information PDF
This slide shows the campaign performance in terms of total number of views, traffic sources, likes, comments and shares. The best PPT templates are a great way to save time, energy, and resources. Slidegeeks have 100 percent editable powerpoint slides making them incredibly versatile. With these quality presentation templates, you can create a captivating and memorable presentation by combining visually appealing slides and effectively communicating your message. Download Media Advertising Youtube Video Ads Performance Dashboard Information PDF from Slidegeeks and deliver a wonderful presentation.
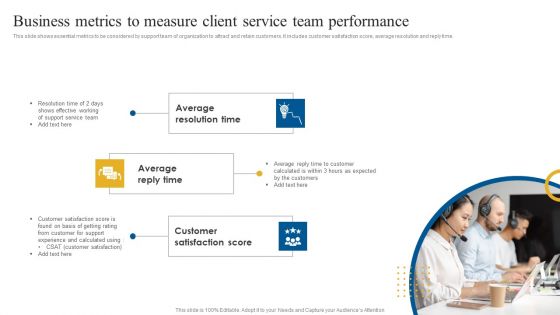
Business Metrics To Measure Client Service Team Performance Guidelines PDF
This slide shows essential metrics to be considered by support team of organization to attract and retain customers. It includes customer satisfaction score, average resolution and reply time. Presenting Business Metrics To Measure Client Service Team Performance Guidelines PDF to dispense important information. This template comprises three stages. It also presents valuable insights into the topics including Average Reply Time, Average Resolution Time, Customer Satisfaction Score. This is a completely customizable PowerPoint theme that can be put to use immediately. So, download it and address the topic impactfully.
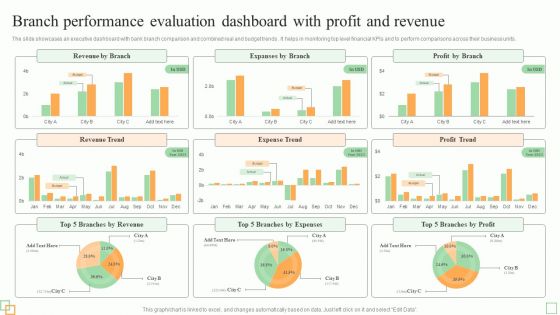
Branch Performance Evaluation Dashboard With Profit And Revenue Diagrams PDF
The slides showcases tips for enhancing branchs workforce performance and efficiency. It covers utilize transaction analysis data, schedule idle time, incent staff for efficiency, get bottom support and use part-time staff.Persuade your audience using this Best Practices To Improve Branch Workforce Performance Evaluation And Efficiency Introduction PDF. This PPT design covers five stages, thus making it a great tool to use. It also caters to a variety of topics including Market Opportunities, Customer Branch, Unnecessary Labor. Download this PPT design now to present a convincing pitch that not only emphasizes the topic but also showcases your presentation skills.
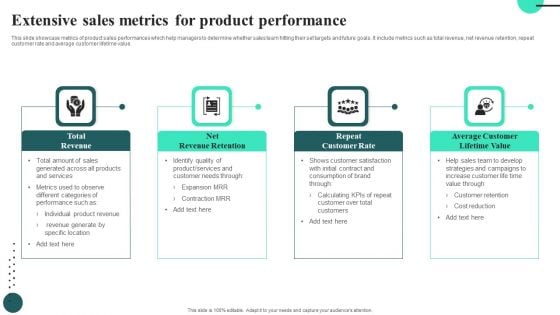
Extensive Sales Metrics For Product Performance Summary PDF
This slide showcase metrics of product sales performances which help managers to determine whether sales team hitting their set targets and future goals. It include metrics such as total revenue, net revenue retention, repeat customer rate and average customer lifetime value.Persuade your audience using this Extensive Sales Metrics For Product Performance Summary PDF. This PPT design covers four stages, thus making it a great tool to use. It also caters to a variety of topics including Total Revenue, Net Revenue Retention. Download this PPT design now to present a convincing pitch that not only emphasizes the topic but also showcases your presentation skills.
Social Media Performance Analytics Dashboard Ppt Styles Icons PDF
Following slide exhibits social media management statistics with website report. It includes multiple KPIs such as website traffic, followers on multiple social media platforms and site revenue. Showcasing this set of slides titled social media performance analytics dashboard ppt styles icons pdf. The topics addressed in these templates are site revenue, website traffic. All the content presented in this PPT design is completely editable. Download it and make adjustments in color, background, font etc. as per your unique business setting.
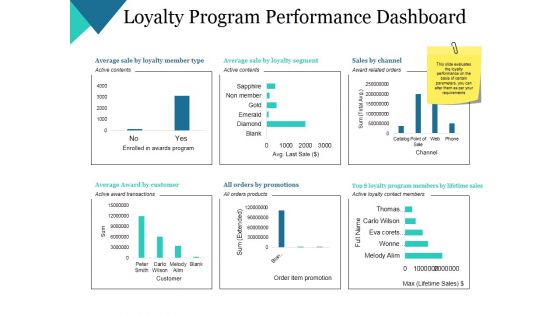
Loyalty Program Performance Dashboard Ppt PowerPoint Presentation Summary Grid
This is a loyalty program performance dashboard ppt powerpoint presentation summary grid. This is a six stage process. The stages in this process are average sale by loyalty member type, average award by customer, all orders by promotions, average sale by loyalty segment, sales by channel.
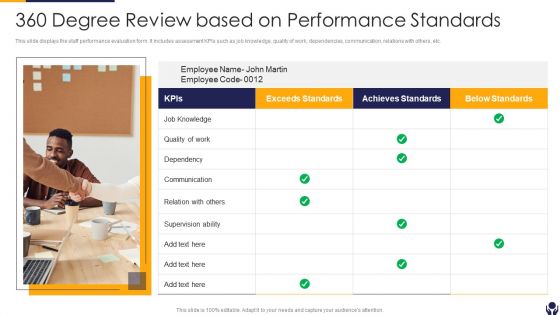
360 Degree Review Based On Performance Standards Diagrams PDF
This slide displays the staff performance evaluation form. It includes assessment KPIs such as job knowledge, quality of work, dependencies, communication, relations with others, etc. Presenting 360 Degree Review Based On Performance Standards Diagrams PDF to dispense important information. This template comprises one stage. It also presents valuable insights into the topics including Communication, Supervision Ability, Exceeds Standards This is a completely customizable PowerPoint theme that can be put to use immediately. So, download it and address the topic impactfully.
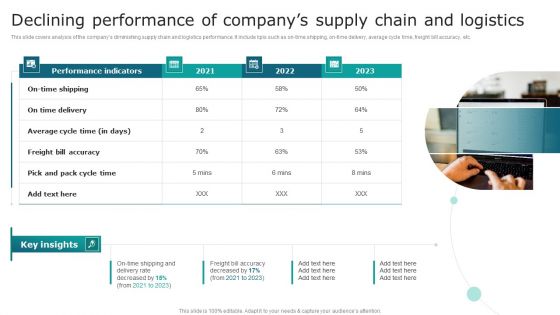
Declining Performance Of Companys Supply Chain And Logistics Microsoft PDF
This slide covers analysis of the companys diminishing supply chain and logistics performance. It include kpis such as on time shipping, on-time delivery, average cycle time, freight bill accuracy, etc. There are so many reasons you need a Declining Performance Of Companys Supply Chain And Logistics Microsoft PDF. The first reason is you can not spend time making everything from scratch, Thus, Slidegeeks has made presentation templates for you too. You can easily download these templates from our website easily.
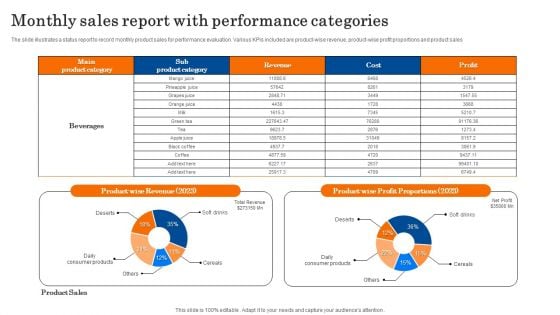
Monthly Sales Report With Performance Categories Diagrams PDF
The slide illustrates a status report to record monthly product sales for performance evaluation. Various KPIs included are product wise revenue, product-wise profit proportions and product sales. Showcasing this set of slides titled Monthly Sales Report With Performance Categories Diagrams PDF. The topics addressed in these templates are Revenue, Profit Proportions, Product Sales. All the content presented in this PPT design is completely editable. Download it and make adjustments in color, background, font etc. as per your unique business setting.
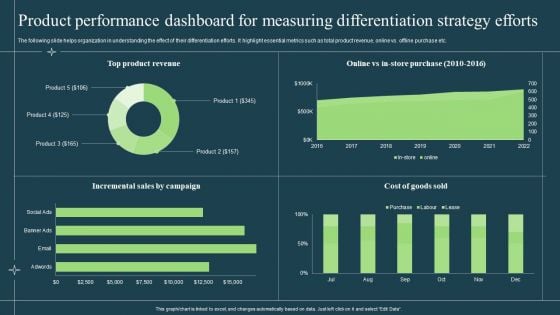
Product Performance Dashboard For Measuring Differentiation Strategy Efforts Diagrams PDF
The following slide helps organization in understanding the effect of their differentiation efforts. It highlight essential metrics such as total product revenue, online vs. offline purchase etc. Deliver an awe inspiring pitch with this creative Product Performance Dashboard For Measuring Differentiation Strategy Efforts Diagrams PDF bundle. Topics like Product, Incremental Sales, Cost Of Goods can be discussed with this completely editable template. It is available for immediate download depending on the needs and requirements of the user.
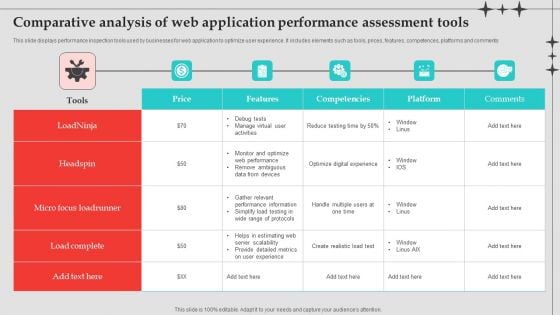
Comparative Analysis Of Web Application Performance Assessment Tools Diagrams PDF
This slide displays performance inspection tools used by businesses for web application to optimize user experience. It includes elements such as tools, prices, features, competences, platforms and comments. Pitch your topic with ease and precision using this Comparative Analysis Of Web Application Performance Assessment Tools Diagrams PDF. This layout presents information on Devices, Optimize, Metrics. It is also available for immediate download and adjustment. So, changes can be made in the color, design, graphics or any other component to create a unique layout.


 Continue with Email

 Home
Home


