key performance indicators
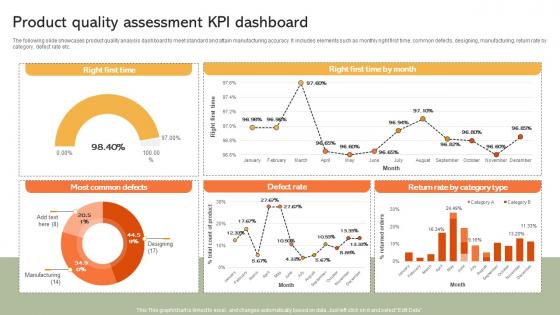
Product Quality Assessment KPI Dashboard Implementing Manufacturing Strategy SS V
The following slide showcases product quality analysis dashboard to meet standard and attain manufacturing accuracy. It includes elements such as monthly right first time, common defects, designing, manufacturing, return rate by category, defect rate etc. Take your projects to the next level with our ultimate collection of Product Quality Assessment KPI Dashboard Implementing Manufacturing Strategy SS V. Slidegeeks has designed a range of layouts that are perfect for representing task or activity duration, keeping track of all your deadlines at a glance. Tailor these designs to your exact needs and give them a truly corporate look with your own brand colors they will make your projects stand out from the rest The following slide showcases product quality analysis dashboard to meet standard and attain manufacturing accuracy. It includes elements such as monthly right first time, common defects, designing, manufacturing, return rate by category, defect rate etc.
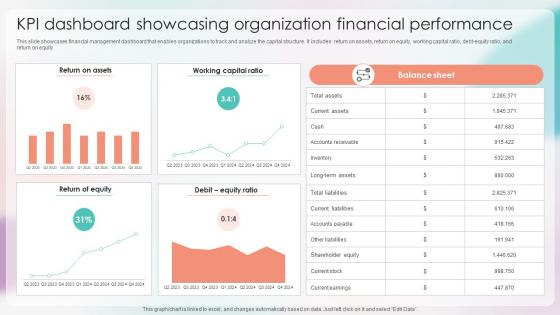
Strategies For Stabilizing Corporate KPI Dashboard Showcasing Organization Financial
This slide showcases financial management dashboard that enables organizations to track and analyze the capital structure. It includes return on assets, return on equity, working capital ratio, debt-equity ratio, and return on equity. Coming up with a presentation necessitates that the majority of the effort goes into the content and the message you intend to convey. The visuals of a PowerPoint presentation can only be effective if it supplements and supports the story that is being told. Keeping this in mind our experts created Strategies For Stabilizing Corporate KPI Dashboard Showcasing Organization Financial to reduce the time that goes into designing the presentation. This way, you can concentrate on the message while our designers take care of providing you with the right template for the situation. This slide showcases financial management dashboard that enables organizations to track and analyze the capital structure. It includes return on assets, return on equity, working capital ratio, debt-equity ratio, and return on equity.
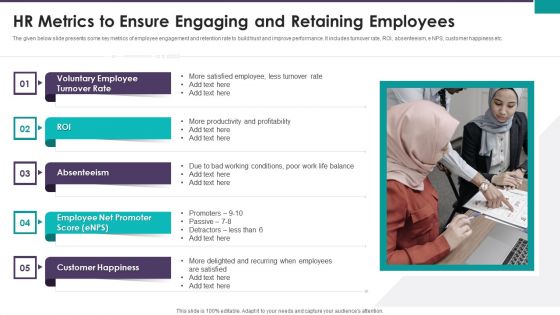
HR Metrics To Ensure Engaging And Retaining Employees Ppt Summary Grid PDF
The given below slide presents some key metrics of employee engagement and retention rate to build trust and improve performance. It includes turnover rate, ROI, absenteeism, e NPS, customer happiness etc. Persuade your audience using this HR Metrics To Ensure Engaging And Retaining Employees Ppt Summary Grid PDF. This PPT design covers five stages, thus making it a great tool to use. It also caters to a variety of topics including Voluntary Employee Turnover, Rate ROI Absenteeism, Employee Net Promoter. Download this PPT design now to present a convincing pitch that not only emphasizes the topic but also showcases your presentation skills.
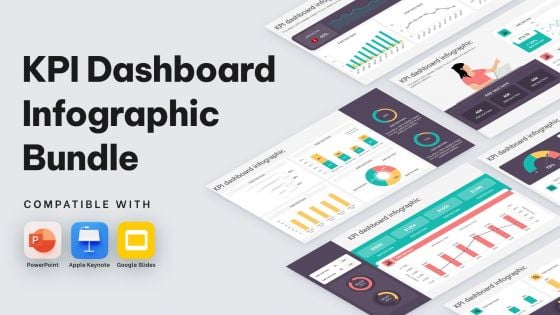
KPI Dashboard Infographic Bundle Powerpoint Ppt Templates And Slides
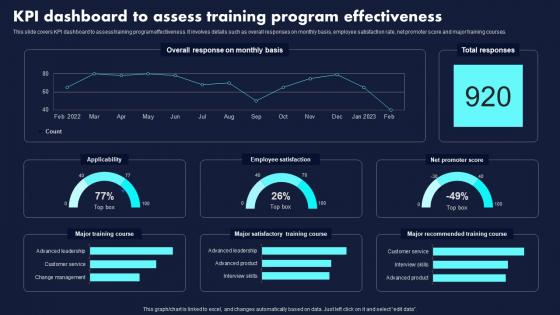
KPI Dashboard To Assess Training Program Effectiveness Proven Techniques For Enhancing Summary Pdf
This slide covers KPI dashboard to assess training program effectiveness. It involves details such as overall responses on monthly basis, employee satisfaction rate, net promoter score and major training courses. Do you have an important presentation coming up Are you looking for something that will make your presentation stand out from the rest Look no further than KPI Dashboard To Assess Training Program Effectiveness Proven Techniques For Enhancing Summary Pdf. With our professional designs, you can trust that your presentation will pop and make delivering it a smooth process. And with Slidegeeks, you can trust that your presentation will be unique and memorable. So why wait Grab KPI Dashboard To Assess Training Program Effectiveness Proven Techniques For Enhancing Summary Pdf today and make your presentation stand out from the rest. This slide covers KPI dashboard to assess training program effectiveness. It involves details such as overall responses on monthly basis, employee satisfaction rate, net promoter score and major training courses.
KPI Dashboard For Tracking Holistic Marketing Strategies To Optimize Guidelines Pdf
This slide showcases the KPI dashboard that would help the business organization to track shareholder and companys valuation. It includes parameters such as total dividend growth rate, total capital return, share count reduced, etc. Explore a selection of the finest KPI Dashboard For Tracking Holistic Marketing Strategies To Optimize Guidelines Pdf here. With a plethora of professionally designed and pre made slide templates, you can quickly and easily find the right one for your upcoming presentation. You can use our KPI Dashboard For Tracking Holistic Marketing Strategies To Optimize Guidelines Pdf to effectively convey your message to a wider audience. Slidegeeks has done a lot of research before preparing these presentation templates. The content can be personalized and the slides are highly editable. Grab templates today from Slidegeeks. This slide showcases the KPI dashboard that would help the business organization to track shareholder and companys valuation. It includes parameters such as total dividend growth rate, total capital return, share count reduced, etc.
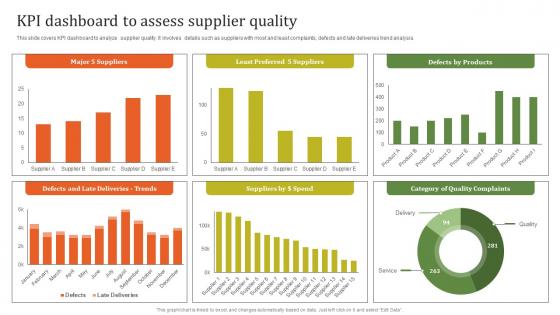
KPI Dashboard To Assess Supplier Executing Effective Quality Enhancement Structure Pdf
This slide covers KPI dashboard to analyze supplier quality. It involves details such as suppliers with most and least complaints, defects and late deliveries trend analysis. Create an editable KPI Dashboard To Assess Supplier Executing Effective Quality Enhancement Structure Pdf that communicates your idea and engages your audience. Whether you are presenting a business or an educational presentation, pre designed presentation templates help save time. KPI Dashboard To Assess Supplier Executing Effective Quality Enhancement Structure Pdf is highly customizable and very easy to edit, covering many different styles from creative to business presentations. Slidegeeks has creative team members who have crafted amazing templates. So, go and get them without any delay. This slide covers KPI dashboard to analyze supplier quality. It involves details such as suppliers with most and least complaints, defects and late deliveries trend analysis.
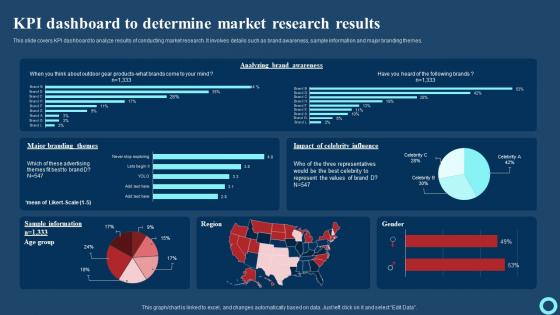
KPI Dashboard To Determine Market Research Results Effective Strategies To Enhance Structure Pdf
This slide covers KPI dashboard to analyze results of conducting market research. It involves details such as brand awareness, sample information and major branding themes. Do you have an important presentation coming up Are you looking for something that will make your presentation stand out from the rest Look no further than KPI Dashboard To Determine Market Research Results Effective Strategies To Enhance Structure Pdf With our professional designs, you can trust that your presentation will pop and make delivering it a smooth process. And with Slidegeeks, you can trust that your presentation will be unique and memorable. So why wait Grab KPI Dashboard To Determine Market Research Results Effective Strategies To Enhance Structure Pdf today and make your presentation stand out from the rest. This slide covers KPI dashboard to analyze results of conducting market research. It involves details such as brand awareness, sample information and major branding themes.
KPI Dashboard For Tracking Monthly Personal Comprehensive Smartphone Banking Introduction Pdf
This slide shows dashboard which can be used by individuals to track monthly expenses in order to get better understanding of hisorher finances. It includes metrics such as users spending, savings, debt, etc.Take your projects to the next level with our ultimate collection of KPI Dashboard For Tracking Monthly Personal Comprehensive Smartphone Banking Introduction Pdf. Slidegeeks has designed a range of layouts that are perfect for representing task or activity duration, keeping track of all your deadlines at a glance. Tailor these designs to your exact needs and give them a truly corporate look with your own brand colors they all make your projects stand out from the rest. This slide shows dashboard which can be used by individuals to track monthly expenses in order to get better understanding of hisorher finances. It includes metrics such as users spending, savings, debt, etc.
Wireless Banking To Improve KPI Dashboard For Tracking Monthly Personal Fin SS V
This slide shows dashboard which can be used by individuals to track monthly expenses in order to get better understanding of his or her finances. It includes metrics such as users spending, savings, debt, etc. Slidegeeks is one of the best resources for PowerPoint templates. You can download easily and regulate Wireless Banking To Improve KPI Dashboard For Tracking Monthly Personal Fin SS V for your personal presentations from our wonderful collection. A few clicks is all it takes to discover and get the most relevant and appropriate templates. Use our Templates to add a unique zing and appeal to your presentation and meetings. All the slides are easy to edit and you can use them even for advertisement purposes. This slide shows dashboard which can be used by individuals to track monthly expenses in order to get better understanding of his or her finances. It includes metrics such as users spending, savings, debt, etc.
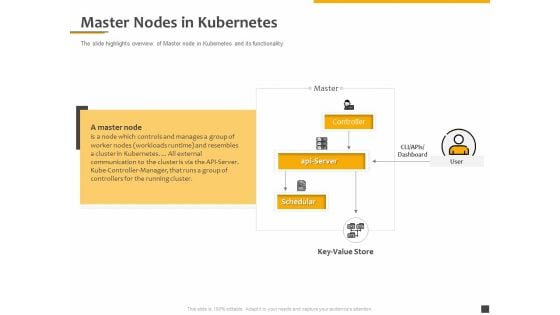
Understanding The Kubernetes Components Through Diagram Master Nodes In Kubernetes Ppt Slides Structure PDF
Presenting this set of slides with name understanding the kubernetes components through diagram master nodes in kubernetes ppt slides structure pdf. This is a five stage process. The stages in this process are controller, api server, schedular, key value store, master, dashboard. This is a completely editable PowerPoint presentation and is available for immediate download. Download now and impress your audience.
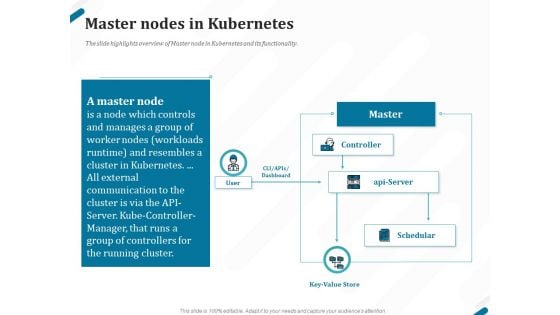
Kubernetes Containers Architecture Overview Master Nodes In Kubernetes Ppt Portfolio Graphics PDF
Presenting this set of slides with name kubernetes containers architecture overview master nodes in kubernetes ppt portfolio graphics pdf. This is a five stage process. The stages in this process are controller, api server, schedular, key value store, master, dashboard. This is a completely editable PowerPoint presentation and is available for immediate download. Download now and impress your audience.
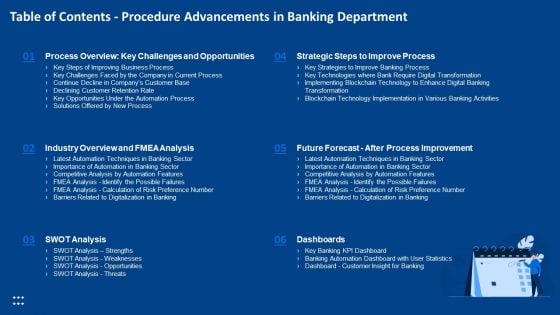
Table Of Contents Procedure Advancements In Banking Department Guidelines PDF
Deliver an awe-inspiring pitch with this creative table of contents procedure advancements in banking department guidelines pdf bundle. Topics like swot analysis, dashboards, process improvement, analysis, key challenges can be discussed with this completely editable template. It is available for immediate download depending on the needs and requirements of the user.
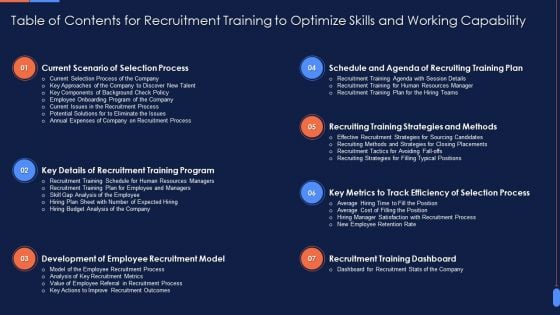
Table Of Contents For Recruitment Training To Optimize Skills And Working Capability Elements PDF
Deliver an awe inspiring pitch with this creative Table Of Contents For Recruitment Training To Optimize Skills And Working Capability Elements PDF bundle. Topics like Recruitment Training Dashboard, Development Employee Recruitment Model, Key Details of Recruitment Training Program can be discussed with this completely editable template. It is available for immediate download depending on the needs and requirements of the user.
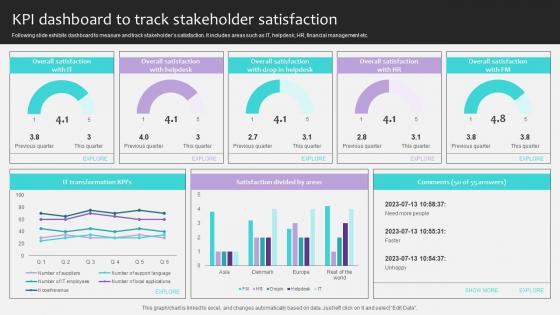
Project Stakeholders Management KPI Dashboard To Track Stakeholder Satisfaction Ppt Powerpoint
Following slide exhibits dashboard to measure and track stakeholders satisfaction. It includes areas such as IT, helpdesk, HR, financial management etc. Presenting this PowerPoint presentation, titled Project Stakeholders Management KPI Dashboard To Track Stakeholder Satisfaction Ppt Powerpoint, with topics curated by our researchers after extensive research. This editable presentation is available for immediate download and provides attractive features when used. Download now and captivate your audience. Presenting this Project Stakeholders Management KPI Dashboard To Track Stakeholder Satisfaction Ppt Powerpoint. Our researchers have carefully researched and created these slides with all aspects taken into consideration. This is a completely customizable Project Stakeholders Management KPI Dashboard To Track Stakeholder Satisfaction Ppt Powerpoint that is available for immediate downloading. Download now and make an impact on your audience. Highlight the attractive features available with our PPTs. Following slide exhibits dashboard to measure and track stakeholders satisfaction. It includes areas such as IT, helpdesk, HR, financial management etc.
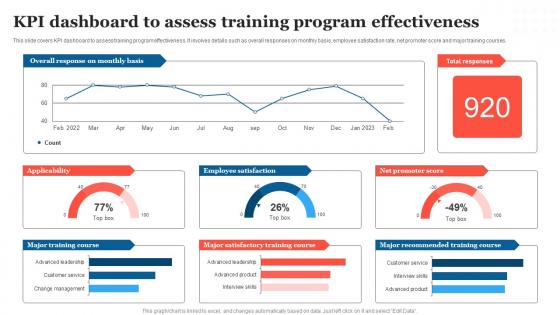
KPI Dashboard To Assess Training Strategic Measures To Boost Employee Efficienc Elements Pdf
This slide covers KPI dashboard to assess training program effectiveness. It involves details such as overall responses on monthly basis, employee satisfaction rate, net promoter score and major training courses. Present like a pro with KPI Dashboard To Assess Training Strategic Measures To Boost Employee Efficienc Elements Pdf Create beautiful presentations together with your team, using our easy to use presentation slides. Share your ideas in real time and make changes on the fly by downloading our templates. So whether you are in the office, on the go, or in a remote location, you can stay in sync with your team and present your ideas with confidence. With Slidegeeks presentation got a whole lot easier. Grab these presentations today. This slide covers KPI dashboard to assess training program effectiveness. It involves details such as overall responses on monthly basis, employee satisfaction rate, net promoter score and major training courses.
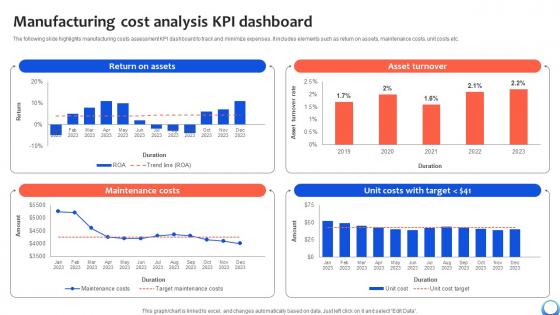
Manufacturing Cost Analysis KPI Dashboard Automating Production Process Strategy SS V
The following slide highlights manufacturing costs assessment KPI dashboard to track and minimize expenses. It includes elements such as return on assets, maintenance costs, unit costs etc. Make sure to capture your audiences attention in your business displays with our gratis customizable Manufacturing Cost Analysis KPI Dashboard Automating Production Process Strategy SS V. These are great for business strategies, office conferences, capital raising or task suggestions. If you desire to acquire more customers for your tech business and ensure they stay satisfied, create your own sales presentation with these plain slides. The following slide highlights manufacturing costs assessment KPI dashboard to track and minimize expenses. It includes elements such as return on assets, maintenance costs, unit costs etc.
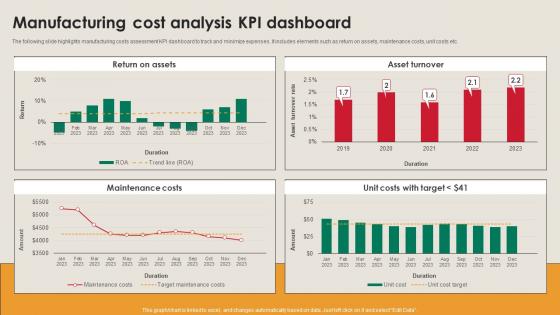
Manufacturing Cost Analysis KPI Dashboard Manufacturing Strategy Driving Industry 4 0
The following slide highlights manufacturing costs assessment KPI dashboard to track and minimize expenses. It includes elements such as return on assets, maintenance costs, unit costs etc. Find a pre-designed and impeccable Manufacturing Cost Analysis KPI Dashboard Manufacturing Strategy Driving Industry 4 0. The templates can ace your presentation without additional effort. You can download these easy-to-edit presentation templates to make your presentation stand out from others. So, what are you waiting for Download the template from Slidegeeks today and give a unique touch to your presentation. The following slide highlights manufacturing costs assessment KPI dashboard to track and minimize expenses. It includes elements such as return on assets, maintenance costs, unit costs etc.
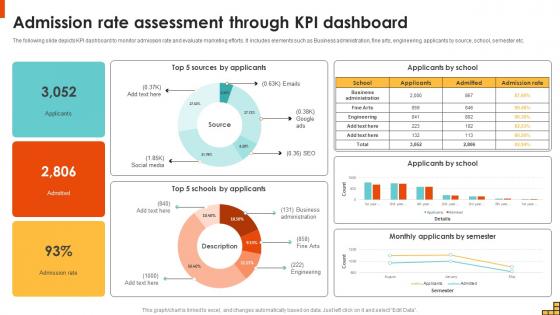
Admission Rate Assessment Through KPI Dashboard Running Marketing Campaigns Strategy SS V
The following slide depicts KPI dashboard to monitor admission rate and evaluate marketing efforts. It includes elements such as Business administration, fine arts, engineering, applicants by source, school, semester etc. Find a pre-designed and impeccable Admission Rate Assessment Through KPI Dashboard Running Marketing Campaigns Strategy SS V. The templates can ace your presentation without additional effort. You can download these easy-to-edit presentation templates to make your presentation stand out from others. So, what are you waiting for Download the template from Slidegeeks today and give a unique touch to your presentation. The following slide depicts KPI dashboard to monitor admission rate and evaluate marketing efforts. It includes elements such as Business administration, fine arts, engineering, applicants by source, school, semester etc.
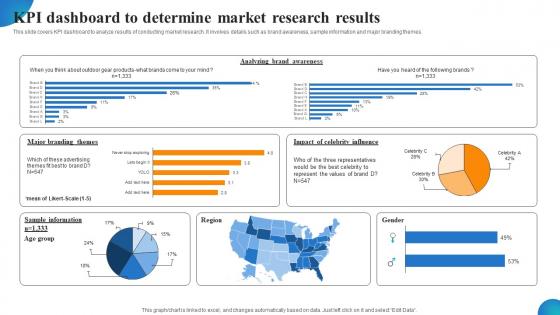
KPI Dashboard To Determine Market Research Results MDSS For Enhanced Ideas Pdf
This slide covers KPI dashboard to analyze results of conducting market research. It involves details such as brand awareness, sample information and major branding themes. If you are looking for a format to display your unique thoughts, then the professionally designed KPI Dashboard To Determine Market Research Results MDSS For Enhanced Ideas Pdf is the one for you. You can use it as a Google Slides template or a PowerPoint template. Incorporate impressive visuals, symbols, images, and other charts. Modify or reorganize the text boxes as you desire. Experiment with shade schemes and font pairings. Alter, share or cooperate with other people on your work. Download KPI Dashboard To Determine Market Research Results MDSS For Enhanced Ideas Pdf and find out how to give a successful presentation. Present a perfect display to your team and make your presentation unforgettable. This slide covers KPI dashboard to analyze results of conducting market research. It involves details such as brand awareness, sample information and major branding themes.
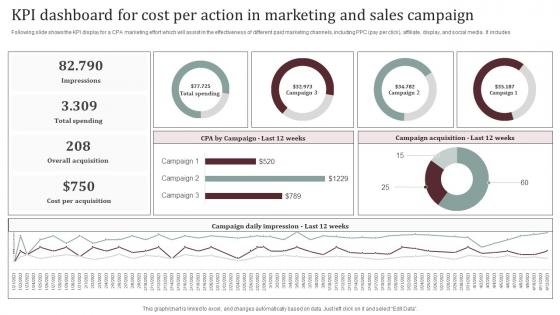
KPI Dashboard For Cost Per Action In Marketing And Sales Campaign Sample Pdf
Following slide shows the KPI display for a CPA marketing effort which will assist in the effectiveness of different paid marketing channels, including PPC pay per click, affiliate, display, and social media. It includes. Showcasing this set of slides titled KPI Dashboard For Cost Per Action In Marketing And Sales Campaign Sample Pdf. The topics addressed in these templates are Campaign Acquisition, Campaign Daily Impression. All the content presented in this PPT design is completely editable. Download it and make adjustments in color, background, font etc. as per your unique business setting. Following slide shows the KPI display for a CPA marketing effort which will assist in the effectiveness of different paid marketing channels, including PPC pay per click, affiliate, display, and social media. It includes.
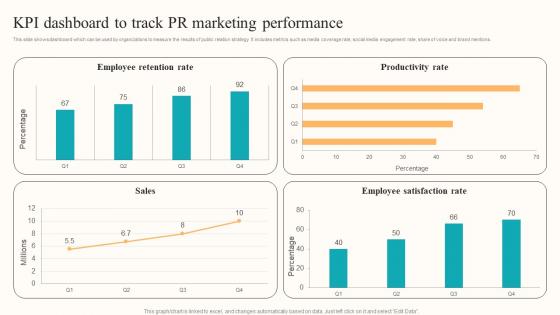
KPI Dashboard Track PR Developing Employee Centric Marketing Program Designs Pdf
This slide shows dashboard which can be used by organizations to measure the results of public relation strategy. It includes metrics such as media coverage rate, social media engagement rate, share of voice and brand mentions. This KPI Dashboard Track PR Developing Employee Centric Marketing Program Designs Pdf is perfect for any presentation, be it in front of clients or colleagues. It is a versatile and stylish solution for organizing your meetings. The KPI Dashboard Track PR Developing Employee Centric Marketing Program Designs Pdf features a modern design for your presentation meetings. The adjustable and customizable slides provide unlimited possibilities for acing up your presentation. Slidegeeks has done all the homework before launching the product for you. So, do not wait, grab the presentation templates today This slide shows dashboard which can be used by organizations to measure the results of public relation strategy. It includes metrics such as media coverage rate, social media engagement rate, share of voice and brand mentions.
Ultimate Guide To Cold Calling Sources Tracking Kpi Dashboard SA SS V
This slide outlines a call-tracking dashboard that helps marketers to track call quality, encompassing volume of calls, top call sources, total calls, etc. Do you have an important presentation coming up Are you looking for something that will make your presentation stand out from the rest Look no further than Ultimate Guide To Cold Calling Sources Tracking Kpi Dashboard SA SS V. With our professional designs, you can trust that your presentation will pop and make delivering it a smooth process. And with Slidegeeks, you can trust that your presentation will be unique and memorable. So why wait Grab Ultimate Guide To Cold Calling Sources Tracking Kpi Dashboard SA SS V today and make your presentation stand out from the rest This slide outlines a call-tracking dashboard that helps marketers to track call quality, encompassing volume of calls, top call sources, total calls, etc.
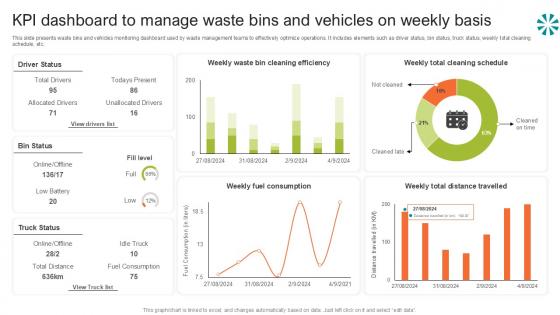
Kpi Dashboard To Manage Waste Step By Step Guide For Electronic Ppt Template
This slide presents waste bins and vehicles monitoring dashboard used by waste management teams to effectively optimize operations. It includes elements such as driver status, bin status, truck status, weekly total cleaning schedule, etc. This Kpi Dashboard To Manage Waste Step By Step Guide For Electronic Ppt Template is perfect for any presentation, be it in front of clients or colleagues. It is a versatile and stylish solution for organizing your meetings. The Kpi Dashboard To Manage Waste Step By Step Guide For Electronic Ppt Template features a modern design for your presentation meetings. The adjustable and customizable slides provide unlimited possibilities for acing up your presentation. Slidegeeks has done all the homework before launching the product for you. So, do not wait, grab the presentation templates today This slide presents waste bins and vehicles monitoring dashboard used by waste management teams to effectively optimize operations. It includes elements such as driver status, bin status, truck status, weekly total cleaning schedule, etc.
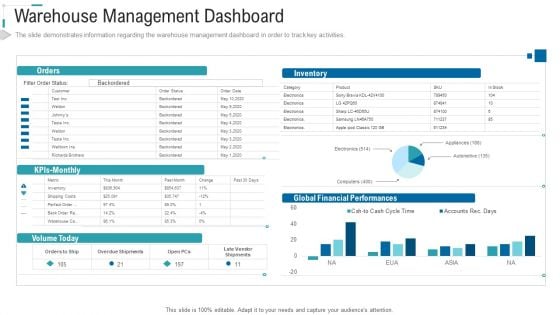
Inventory Stock Control Warehouse Management Dashboard Ppt Styles Images PDF
The slide demonstrates information regarding the warehouse management dashboard in order to track key activities. Deliver and pitch your topic in the best possible manner with this inventory stock control warehouse management dashboard ppt styles images pdf. Use them to share invaluable insights on kpls monthly, orders, inventory, global financial performances, volume today and impress your audience. This template can be altered and modified as per your expectations. So, grab it now.
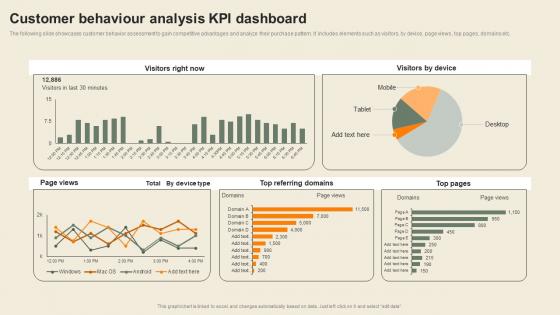
Customer Behaviour Analysis KPI Dashboard Usability Of CDP Software Tool Graphics Pdf
The following slide showcases customer behavior assessment to gain competitive advantages and analyze their purchase pattern. It includes elements such as visitors, by device, page views, top pages, domains etc. Do you have an important presentation coming up Are you looking for something that will make your presentation stand out from the rest Look no further than Customer Behaviour Analysis KPI Dashboard Usability Of CDP Software Tool Graphics Pdf. With our professional designs, you can trust that your presentation will pop and make delivering it a smooth process. And with Slidegeeks, you can trust that your presentation will be unique and memorable. So why wait Grab Customer Behaviour Analysis KPI Dashboard Usability Of CDP Software Tool Graphics Pdf today and make your presentation stand out from the rest The following slide showcases customer behavior assessment to gain competitive advantages and analyze their purchase pattern. It includes elements such as visitors, by device, page views, top pages, domains etc.
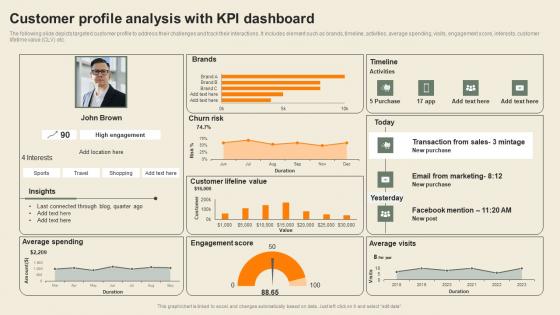
Customer Profile Analysis With KPI Dashboard Usability Of CDP Software Tool Ideas Pdf
The following slide depicts targeted customer profile to address their challenges and track their interactions. It includes element such as brands, timeline, activities, average spending, visits, engagement score, interests, customer lifetime value CLV etc. Crafting an eye-catching presentation has never been more straightforward. Let your presentation shine with this tasteful yet straightforward Customer Profile Analysis With KPI Dashboard Usability Of CDP Software Tool Ideas Pdf template. It offers a minimalistic and classy look that is great for making a statement. The colors have been employed intelligently to add a bit of playfulness while still remaining professional. Construct the ideal Customer Profile Analysis With KPI Dashboard Usability Of CDP Software Tool Ideas Pdf that effortlessly grabs the attention of your audience Begin now and be certain to wow your customers The following slide depicts targeted customer profile to address their challenges and track their interactions. It includes element such as brands, timeline, activities, average spending, visits, engagement score, interests, customer lifetime value CLV etc.
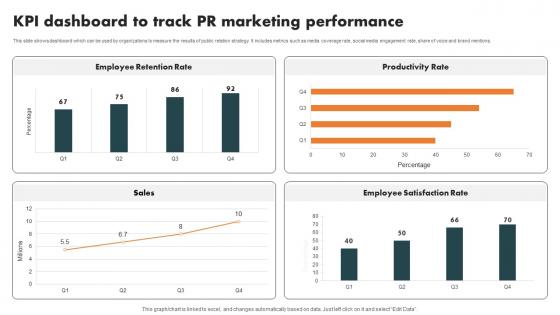
KPI Dashboard Track Pr Internal Branding Strategy For Enhanced Advocacy Infographics Pdf
This slide shows dashboard which can be used by organizations to measure the results of public relation strategy. It includes metrics such as media coverage rate, social media engagement rate, share of voice and brand mentions. Explore a selection of the finest KPI Dashboard Track Pr Internal Branding Strategy For Enhanced Advocacy Infographics Pdf here. With a plethora of professionally designed and pre made slide templates, you can quickly and easily find the right one for your upcoming presentation. You can use our KPI Dashboard Track Pr Internal Branding Strategy For Enhanced Advocacy Infographics Pdf to effectively convey your message to a wider audience. Slidegeeks has done a lot of research before preparing these presentation templates. The content can be personalized and the slides are highly editable. Grab templates today from Slidegeeks. This slide shows dashboard which can be used by organizations to measure the results of public relation strategy. It includes metrics such as media coverage rate, social media engagement rate, share of voice and brand mentions.
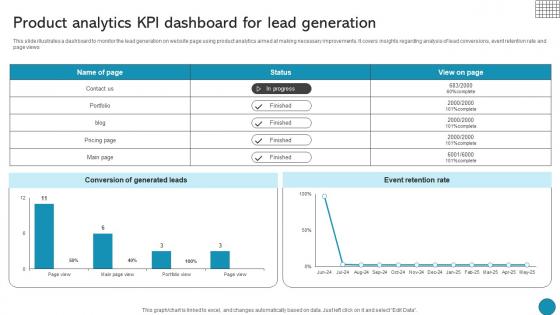
Product Analytics Kpi Dashboard For Lead Generation Driving Business Success Integrating Product
This slide illustrates a dashboard to monitor the lead generation on website page using product analytics aimed at making necessary improvements. It covers insights regarding analysis of lead conversions, event retention rate and page views Do you have to make sure that everyone on your team knows about any specific topic I yes, then you should give Product Analytics Kpi Dashboard For Lead Generation Driving Business Success Integrating Product a try. Our experts have put a lot of knowledge and effort into creating this impeccable Product Analytics Kpi Dashboard For Lead Generation Driving Business Success Integrating Product. You can use this template for your upcoming presentations, as the slides are perfect to represent even the tiniest detail. You can download these templates from the Slidegeeks website and these are easy to edit. So grab these today This slide illustrates a dashboard to monitor the lead generation on website page using product analytics aimed at making necessary improvements. It covers insights regarding analysis of lead conversions, event retention rate and page views
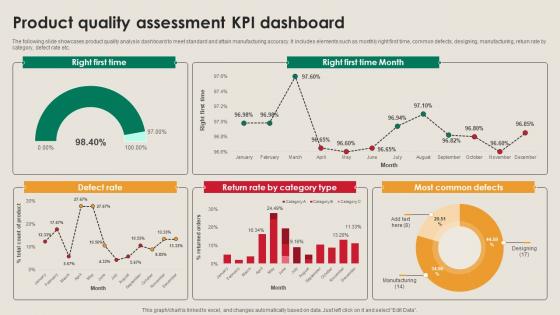
Product Quality Assessment KPI Dashboard Manufacturing Strategy Driving Industry 4 0
The following slide showcases product quality analysis dashboard to meet standard and attain manufacturing accuracy. It includes elements such as monthly right first time, common defects, designing, manufacturing, return rate by category, defect rate etc. If you are looking for a format to display your unique thoughts, then the professionally designed Product Quality Assessment KPI Dashboard Manufacturing Strategy Driving Industry 4 0 is the one for you. You can use it as a Google Slides template or a PowerPoint template. Incorporate impressive visuals, symbols, images, and other charts. Modify or reorganize the text boxes as you desire. Experiment with shade schemes and font pairings. Alter, share or cooperate with other people on your work. Download Product Quality Assessment KPI Dashboard Manufacturing Strategy Driving Industry 4 0 and find out how to give a successful presentation. Present a perfect display to your team and make your presentation unforgettable. The following slide showcases product quality analysis dashboard to meet standard and attain manufacturing accuracy. It includes elements such as monthly right first time, common defects, designing, manufacturing, return rate by category, defect rate etc.

Product Analytics KPI Dashboard For Lead Generation Product Analytics Implementation Data Analytics V
This slide illustrates a dashboard to monitor the lead generation on website page using product analytics aimed at making necessary improvements. It covers insights regarding analysis of lead conversions, event retention rate and page views.Do you have to make sure that everyone on your team knows about any specific topic I yes, then you should give Product Analytics KPI Dashboard For Lead Generation Product Analytics Implementation Data Analytics V a try. Our experts have put a lot of knowledge and effort into creating this impeccable Product Analytics KPI Dashboard For Lead Generation Product Analytics Implementation Data Analytics V. You can use this template for your upcoming presentations, as the slides are perfect to represent even the tiniest detail. You can download these templates from the Slidegeeks website and these are easy to edit. So grab these today This slide illustrates a dashboard to monitor the lead generation on website page using product analytics aimed at making necessary improvements. It covers insights regarding analysis of lead conversions, event retention rate and page views
KPI Dashboard For Tracking Social Implementing Marketing Tactics To Drive Sample Pdf
This slide covers the dashboard for analyzing social media marketing campaigns. It includes metrics such as tweets, followers, followings, listed favorites, reach, views, Facebook engagement, clicks, likes, Instagram photos, etc. Take your projects to the next level with our ultimate collection of KPI Dashboard For Tracking Social Implementing Marketing Tactics To Drive Sample Pdf. Slidegeeks has designed a range of layouts that are perfect for representing task or activity duration, keeping track of all your deadlines at a glance. Tailor these designs to your exact needs and give them a truly corporate look with your own brand colors they well make your projects stand out from the rest. This slide covers the dashboard for analyzing social media marketing campaigns. It includes metrics such as tweets, followers, followings, listed favorites, reach, views, Facebook engagement, clicks, likes, Instagram photos, etc.
KPI Dashboard For Tracking Increasing Client Retention Through Efficient Formats Pdf
This slide covers the dashboard for analyzing customer loyalty with metrics such as NPS, loyal customer rate, premium users, CLV, customer churn, revenue churn, net retention, MRR growth, etc. The best PPT templates are a great way to save time, energy, and resources. Slidegeeks have 100 percent editable powerpoint slides making them incredibly versatile. With these quality presentation templates, you can create a captivating and memorable presentation by combining visually appealing slides and effectively communicating your message. Download KPI Dashboard For Tracking Increasing Client Retention Through Efficient Formats Pdf from Slidegeeks and deliver a wonderful presentation. This slide covers the dashboard for analyzing customer loyalty with metrics such as NPS, loyal customer rate, premium users, CLV, customer churn, revenue churn, net retention, MRR growth, etc.
KPI Dashboard For Tracking Major Promotional Analytics Future Trends Clipart Pdf
This slide covers the dashboard for analysing email marketing metrics such as overall open rate, click through rate, click to open ratio, unsubscribe rate, hard bounce rate, soft rate, monthly open rate, total monthly subscribers, etc. The best PPT templates are a great way to save time, energy, and resources. Slidegeeks have 100 percent editable powerpoint slides making them incredibly versatile. With these quality presentation templates, you can create a captivating and memorable presentation by combining visually appealing slides and effectively communicating your message. Download KPI Dashboard For Tracking Major Promotional Analytics Future Trends Clipart Pdf from Slidegeeks and deliver a wonderful presentation. This slide covers the dashboard for analysing email marketing metrics such as overall open rate, click through rate, click to open ratio, unsubscribe rate, hard bounce rate, soft rate, monthly open rate, total monthly subscribers, etc.
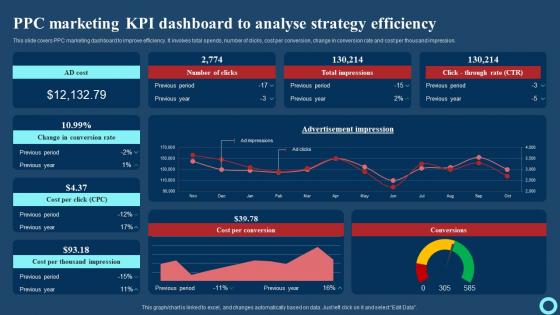
PPC Marketing KPI Dashboard To Analyse Strategy Efficiency Effective Strategies To Enhance Mockup Pdf
This slide covers PPC marketing dashboard to improve efficiency. It involves total spends, number of clicks, cost per conversion, change in conversion rate and cost per thousand impression. Welcome to our selection of the PPC Marketing KPI Dashboard To Analyse Strategy Efficiency Effective Strategies To Enhance Mockup Pdf These are designed to help you showcase your creativity and bring your sphere to life. Planning and Innovation are essential for any business that is just starting out. This collection contains the designs that you need for your everyday presentations. All of our PowerPoints are 100 percent editable, so you can customize them to suit your needs. This multi-purpose template can be used in various situations. Grab these presentation templates today. This slide covers PPC marketing dashboard to improve efficiency. It involves total spends, number of clicks, cost per conversion, change in conversion rate and cost per thousand impression.
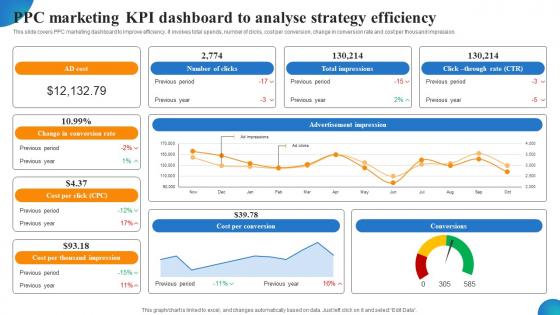
PPC Marketing KPI Dashboard To Analyse Strategy Efficiency MDSS For Enhanced Slides Pdf
This slide covers PPC marketing dashboard to improve efficiency. It involves total spends, number of clicks, cost per conversion, change in conversion rate and cost per thousand impression. Retrieve professionally designed PPC Marketing KPI Dashboard To Analyse Strategy Efficiency MDSS For Enhanced Slides Pdf to effectively convey your message and captivate your listeners. Save time by selecting pre-made slideshows that are appropriate for various topics, from business to educational purposes. These themes come in many different styles, from creative to corporate, and all of them are easily adjustable and can be edited quickly. Access them as PowerPoint templates or as Google Slides themes. You do not have to go on a hunt for the perfect presentation because Slidegeeks got you covered from everywhere. This slide covers PPC marketing dashboard to improve efficiency. It involves total spends, number of clicks, cost per conversion, change in conversion rate and cost per thousand impression.
Bounce Rate KPI Tracking Dashboard With Average Pages And Time Inspiration Pdf
The following slide showcases dashboard that helps to identify the average time spent on page by visitors and the bounce rate. It also includes page load time, bounce rate by browser and details on internet explorer. Pitch your topic with ease and precision using this Bounce Rate KPI Tracking Dashboard With Average Pages And Time Inspiration Pdf. This layout presents information on Page Load Time, Bounce Rate, Internet Explorer. It is also available for immediate download and adjustment. So, changes can be made in the color, design, graphics or any other component to create a unique layout. The following slide showcases dashboard that helps to identify the average time spent on page by visitors and the bounce rate. It also includes page load time, bounce rate by browser and details on internet explorer.
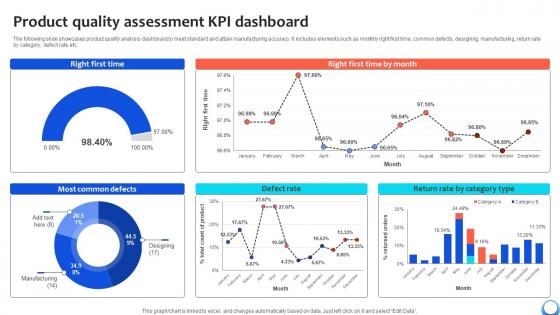
Product Quality Assessment KPI Dashboard Automating Production Process Strategy SS V
The following slide showcases product quality analysis dashboard to meet standard and attain manufacturing accuracy. It includes elements such as monthly right first time, common defects, designing, manufacturing, return rate by category, defect rate etc. Take your projects to the next level with our ultimate collection of Product Quality Assessment KPI Dashboard Automating Production Process Strategy SS V. Slidegeeks has designed a range of layouts that are perfect for representing task or activity duration, keeping track of all your deadlines at a glance. Tailor these designs to your exact needs and give them a truly corporate look with your own brand colors they will make your projects stand out from the rest The following slide showcases product quality analysis dashboard to meet standard and attain manufacturing accuracy. It includes elements such as monthly right first time, common defects, designing, manufacturing, return rate by category, defect rate etc.
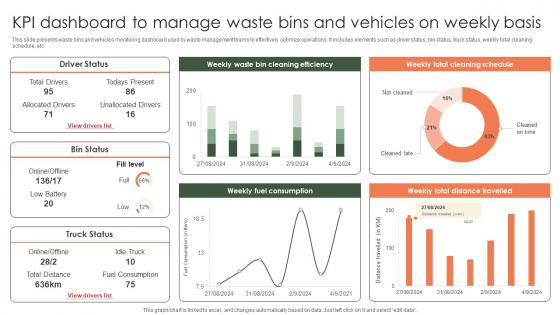
Kpi Dashboard To Manage Waste Bins And Vehicles On Weekly Implementation Of E Waste Guidelines
This slide presents waste bins and vehicles monitoring dashboard used by waste management teams to effectively optimize operations. It includes elements such as driver status, bin status, truck status, weekly total cleaning schedule, etc. Welcome to our selection of the Kpi Dashboard To Manage Waste Bins And Vehicles On Weekly Implementation Of E Waste Guidelines. These are designed to help you showcase your creativity and bring your sphere to life. Planning and Innovation are essential for any business that is just starting out. This collection contains the designs that you need for your everyday presentations. All of our PowerPoints are 100 percent editable, so you can customize them to suit your needs. This multi-purpose template can be used in various situations. Grab these presentation templates today. This slide presents waste bins and vehicles monitoring dashboard used by waste management teams to effectively optimize operations. It includes elements such as driver status, bin status, truck status, weekly total cleaning schedule, etc.

KPI Dashboard To Track Inside Effective Strategies To Succeed At Virtual Ppt PowerPoint SA SS V
Following slide depicts dashboard to measure and track progress of inside sales strategies implemented by company. Retrieve professionally designed KPI Dashboard To Track Inside Effective Strategies To Succeed At Virtual Ppt PowerPoint SA SS V to effectively convey your message and captivate your listeners. Save time by selecting pre-made slideshows that are appropriate for various topics, from business to educational purposes. These themes come in many different styles, from creative to corporate, and all of them are easily adjustable and can be edited quickly. Access them as PowerPoint templates or as Google Slides themes. You do not have to go on a hunt for the perfect presentation because Slidegeeks got you covered from everywhere. Following slide depicts dashboard to measure and track progress of inside sales strategies implemented by company.
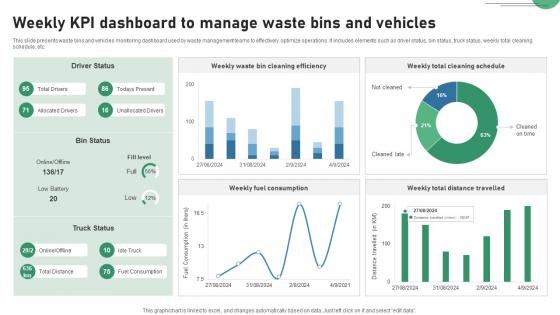
Weekly KPI Dashboard To Manage Waste Bins And Vehicles IOT Applications In Smart Waste IoT SS V
This slide presents waste bins and vehicles monitoring dashboard used by waste management teams to effectively optimize operations. It includes elements such as driver status, bin status, truck status, weekly total cleaning schedule, etc. Find highly impressive Weekly KPI Dashboard To Manage Waste Bins And Vehicles IOT Applications In Smart Waste IoT SS V on Slidegeeks to deliver a meaningful presentation. You can save an ample amount of time using these presentation templates. No need to worry to prepare everything from scratch because Slidegeeks experts have already done a huge research and work for you. You need to download Weekly KPI Dashboard To Manage Waste Bins And Vehicles IOT Applications In Smart Waste IoT SS V for your upcoming presentation. All the presentation templates are 100 percent editable and you can change the color and personalize the content accordingly. Download now. This slide presents waste bins and vehicles monitoring dashboard used by waste management teams to effectively optimize operations. It includes elements such as driver status, bin status, truck status, weekly total cleaning schedule, etc.
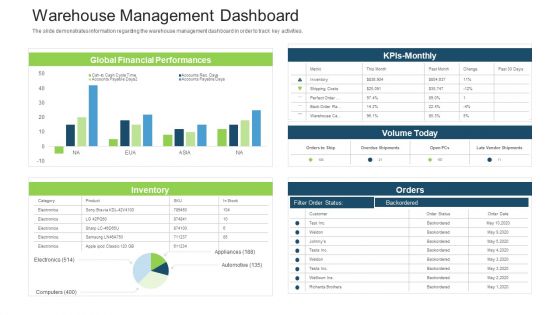
Stock Control System Warehouse Management Dashboard Ppt Visual Aids Outline PDF
The slide demonstrates information regarding the warehouse management dashboard in order to track key activities. Deliver and pitch your topic in the best possible manner with this stock control system warehouse management dashboard ppt visual aids outline pdf. Use them to share invaluable insights on kpls monthly, orders, inventory, global financial performances, volume today and impress your audience. This template can be altered and modified as per your expectations. So, grab it now.
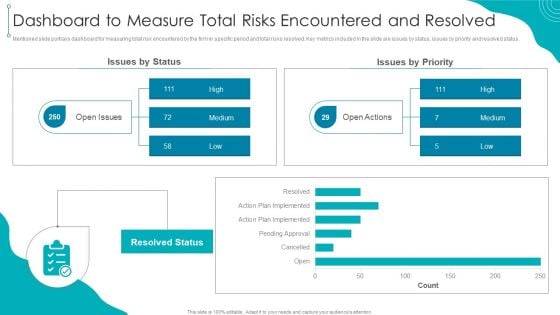
Dashboard To Measure Total Risks Encountered And Resolved Download PDF
Mentioned slide portrays dashboard for measuring total risk encountered by the firm in specific period and total risks resolved. Key metrics included in the slide are issues by status, issues by priority and resolved status.Deliver an awe inspiring pitch with this creative Dashboard To Measure Total Risks Encountered And Resolved Download PDF bundle. Topics like Pending Approval, Action Implemented, Resolved can be discussed with this completely editable template. It is available for immediate download depending on the needs and requirements of the user.
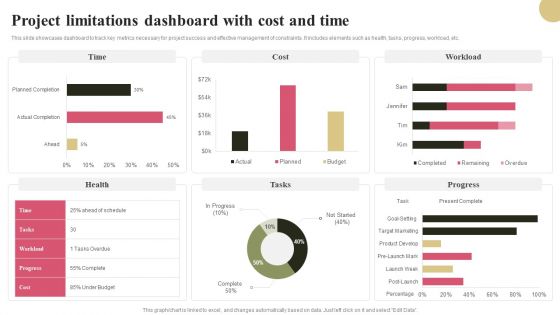
Project Limitations Dashboard With Cost And Time Graphics PDF
This slide showcases dashboard to track key metrics necessary for project success and effective management of constraints. It includes elements such as health, tasks, progress, workload, etc. Pitch your topic with ease and precision using this Project Limitations Dashboard With Cost And Time Graphics PDF. This layout presents information on Time, Workload, Tasks, Progress. It is also available for immediate download and adjustment. So, changes can be made in the color, design, graphics or any other component to create a unique layout.
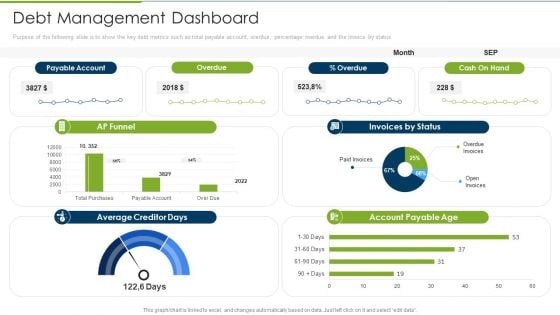
Debt Collection Improvement Plan Debt Management Dashboard Download PDF
Purpose of the following slide is to show the key debt metrics such as total payable account, overdue, percentage overdue and the invoice by status. Deliver an awe inspiring pitch with this creative debt collection improvement plan debt management dashboard download pdf bundle. Topics like payable account, overdue, cash on hand, invoices by status, account payable age, ap funnel can be discussed with this completely editable template. It is available for immediate download depending on the needs and requirements of the user.
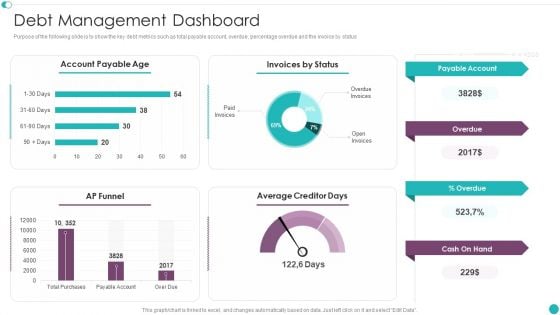
Credit Management And Recovery Policies Debt Management Dashboard Sample PDF
Purpose of the following slide is to show the key debt metrics such as total payable account, overdue, percentage overdue and the invoice by status. Deliver and pitch your topic in the best possible manner with this Credit Management And Recovery Policies Debt Management Dashboard Sample PDF. Use them to share invaluable insights on Account Payable, Invoices Status, Payable Account and impress your audience. This template can be altered and modified as per your expectations. So, grab it now.
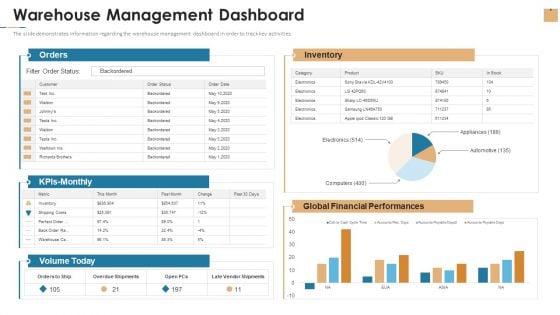
Stock Repository Management For Inventory Control Warehouse Management Dashboard Brochure PDF
The slide demonstrates information regarding the warehouse management dashboard in order to track key activities. Deliver and pitch your topic in the best possible manner with this stock repository management for inventory control warehouse management dashboard brochure pdf. Use them to share invaluable insights on financial performances, inventory, warehouse and impress your audience. This template can be altered and modified as per your expectations. So, grab it now.
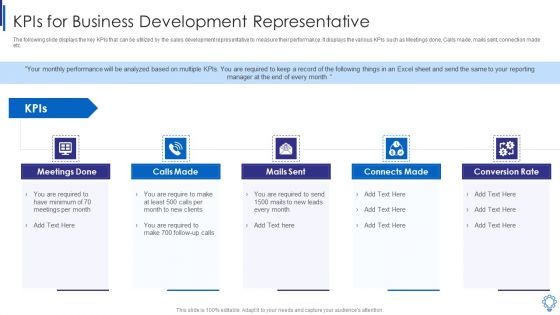
Kpis For Business Development Representative Infographics PDF
The following slide displays the key KPIs that can be utilized by the sales development representative to measure their performance. It displays the various KPIs such as Meetings done, Calls made, mails sent, connection made etc. This is a kpis for business development representative infographics pdf template with various stages. Focus and dispense information on five stages using this creative set, that comes with editable features. It contains large content boxes to add your information on topics like meetings done, mails sent, connects made, conversion rate, calls made. You can also showcase facts, figures, and other relevant content using this PPT layout. Grab it now.

Social Media Marketing Results With Kpi Scorecard Demonstration PDF
The purpose of this slide is to outline the results of different social media marketing channels through KPIs. Followers, impressions, link counts, engagement rate, average order value are some of the key KPIs which are used to measure the marketing results. Showcasing this set of slides titled Social Media Marketing Results With Kpi Scorecard Demonstration PDF. The topics addressed in these templates are Social Media Marketing Results With Kpi Scorecard. All the content presented in this PPT design is completely editable. Download it and make adjustments in color, background, font etc. as per your unique business setting.
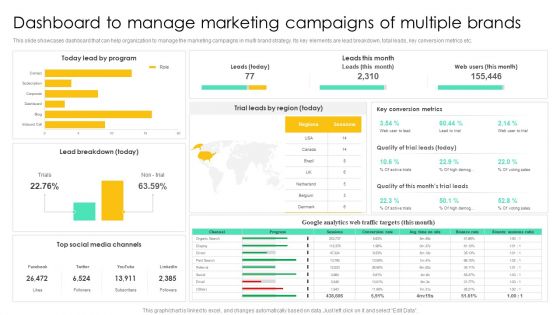
Dashboard To Manage Marketing Campaigns Of Multiple Brands Summary PDF
This slide showcases dashboard that can help organization to manage the marketing campaigns in multi brand strategy. Its key elements are lead breakdown, total leads, key conversion metrics etc. Presenting this PowerPoint presentation, titled Dashboard To Manage Marketing Campaigns Of Multiple Brands Summary PDF, with topics curated by our researchers after extensive research. This editable presentation is available for immediate download and provides attractive features when used. Download now and captivate your audience. Presenting this Dashboard To Manage Marketing Campaigns Of Multiple Brands Summary PDF. Our researchers have carefully researched and created these slides with all aspects taken into consideration. This is a completely customizable Dashboard To Manage Marketing Campaigns Of Multiple Brands Summary PDF that is available for immediate downloading. Download now and make an impact on your audience. Highlight the attractive features available with our PPTs.
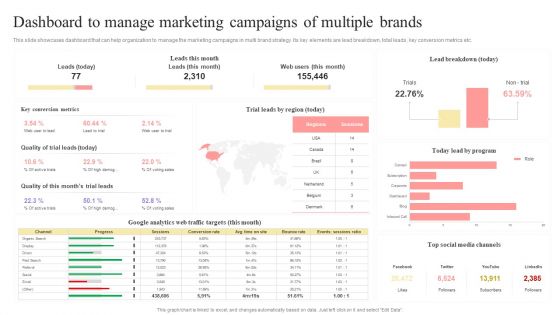
Dashboard To Manage Marketing Campaigns Of Multiple Brands Structure PDF
This slide showcases dashboard that can help organization to manage the marketing campaigns in multi brand strategy. Its key elements are lead breakdown, total leads, key conversion metrics etc.If you are looking for a format to display your unique thoughts, then the professionally designed Dashboard To Manage Marketing Campaigns Of Multiple Brands Structure PDF is the one for you. You can use it as a Google Slides template or a PowerPoint template. Incorporate impressive visuals, symbols, images, and other charts. Modify or reorganize the text boxes as you desire. Experiment with shade schemes and font pairings. Alter, share or cooperate with other people on your work. Download Dashboard To Manage Marketing Campaigns Of Multiple Brands Structure PDF and find out how to give a successful presentation. Present a perfect display to your team and make your presentation unforgettable.
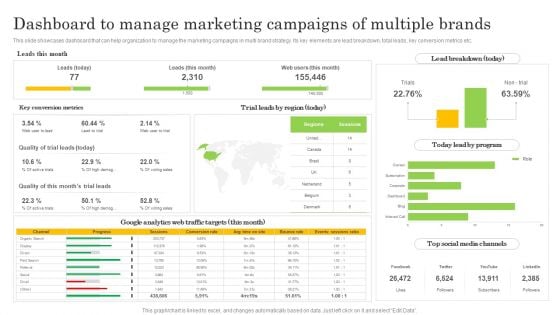
Dashboard To Manage Marketing Campaigns Of Multiple Brands Diagrams PDF
This slide showcases dashboard that can help organization to manage the marketing campaigns in multi brand strategy. Its key elements are lead breakdown, total leads, key conversion metrics etc. Here you can discover an assortment of the finest PowerPoint and Google Slides templates. With these templates, you can create presentations for a variety of purposes while simultaneously providing your audience with an eye catching visual experience. Download Dashboard To Manage Marketing Campaigns Of Multiple Brands Diagrams PDF to deliver an impeccable presentation. These templates will make your job of preparing presentations much quicker, yet still, maintain a high level of quality. Slidegeeks has experienced researchers who prepare these templates and write high quality content for you. Later on, you can personalize the content by editing the Dashboard To Manage Marketing Campaigns Of Multiple Brands Diagrams PDF.
Real Time Employment Tracking Dashboard With Human Resource Metrics Brochure PDF
This slide showcases dashboard that can help human resource manager to track the salary and hiring status of employee in organization. Its key KPIs are permanent rate, turnover rate, absenteeism rate, employees hired and employees left. Showcasing this set of slides titled Real Time Employment Tracking Dashboard With Human Resource Metrics Brochure PDF. The topics addressed in these templates are Average Age, Permanent Rate, Headcount. All the content presented in this PPT design is completely editable. Download it and make adjustments in color, background, font etc. as per your unique business setting.
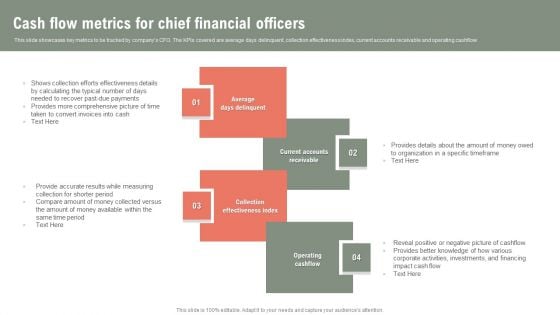
Cash Flow Metrics For Chief Financial Officers Ppt Sample PDF
This slide showcases key metrics to be tracked by companys CFO. The KPIs covered are average days delinquent, collection effectiveness index, current accounts receivable and operating cashflow. Presenting Cash Flow Metrics For Chief Financial Officers Ppt Sample PDF to dispense important information. This template comprises four stages. It also presents valuable insights into the topics including Average Days Delinquent, Current Accounts Receivable, Collection Effectiveness Index. This is a completely customizable PowerPoint theme that can be put to use immediately. So, download it and address the topic impactfully.
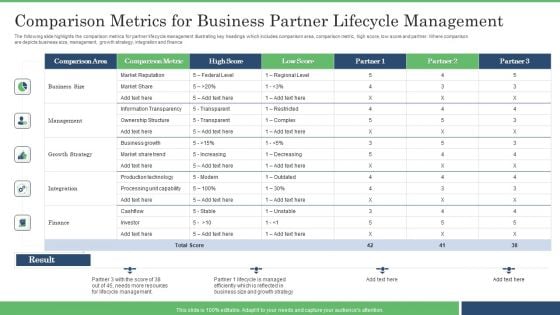
Comparison Metrics For Business Partner Lifecycle Management Guidelines PDF
The following slide highlights the comparison metrics for partner lifecycle management illustrating key headings which includes comparison area, comparison metric, high score, low score and partner. Where comparison are depicts business size, management, growth strategy, integration and finance. Pitch your topic with ease and precision using this Comparison Metrics For Business Partner Lifecycle Management Guidelines PDF. This layout presents information on Business Size, Management, Growth Strategy. It is also available for immediate download and adjustment. So, changes can be made in the color, design, graphics or any other component to create a unique layout.
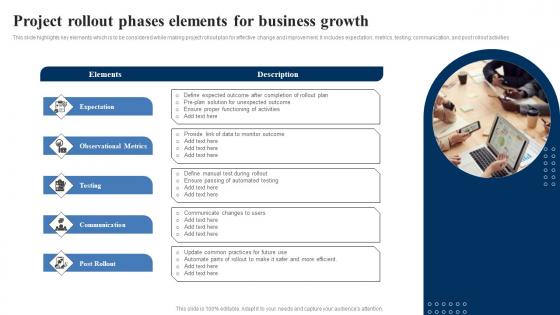
Project Rollout Phases Elements For Business Growth Introduction Pdf
This slide highlights key elements which is to be considered while making project rollout plan for effective change and improvement. It includes expectation, metrics, testing, communication, and post rollout activities Showcasing this set of slides titled Project Rollout Phases Elements For Business Growth Introduction Pdf The topics addressed in these templates are Define Manual, Communicate Changes, Observational Metrics All the content presented in this PPT design is completely editable. Download it and make adjustments in color, background, font etc. as per your unique business setting. This slide highlights key elements which is to be considered while making project rollout plan for effective change and improvement. It includes expectation, metrics, testing, communication, and post rollout activities.
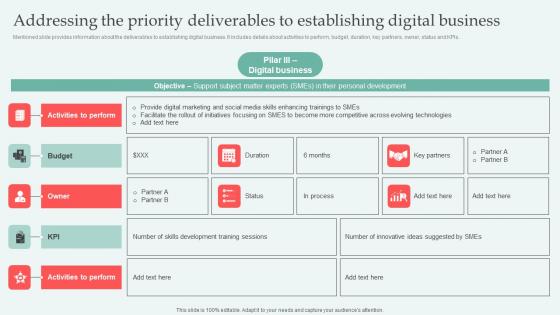
Addressing Priority Deliverables Digital Approaches To Increase Business Growth Professional Pdf
Mentioned slide provides information about the deliverables to establishing digital business. It includes details about activities to perform, budget, duration, key partners, owner, status and KPIs. Retrieve professionally designed Addressing Priority Deliverables Digital Approaches To Increase Business Growth Professional Pdf to effectively convey your message and captivate your listeners. Save time by selecting pre made slideshows that are appropriate for various topics, from business to educational purposes. These themes come in many different styles, from creative to corporate, and all of them are easily adjustable and can be edited quickly. Access them as PowerPoint templates or as Google Slides themes. You do not have to go on a hunt for the perfect presentation because Slidegeeks got you covered from everywhere. Mentioned slide provides information about the deliverables to establishing digital business. It includes details about activities to perform, budget, duration, key partners, owner, status and KPIs.

Asset Assessment Dashboard With Cash Flow And Market Value Summary PDF
This slide illustrates asset valuation dashboard with key financial metrics. It provides information about cash flow, market value, intrinsic value, assumptions, market cap, discount rate, etc.Showcasing this set of slides titled Asset Assessment Dashboard With Cash Flow And Market Value Summary PDF. The topics addressed in these templates are Discount Rate, Capital Expenditure, Market Capitalization. All the content presented in this PPT design is completely editable. Download it and make adjustments in color, background, font etc. as per your unique business setting.
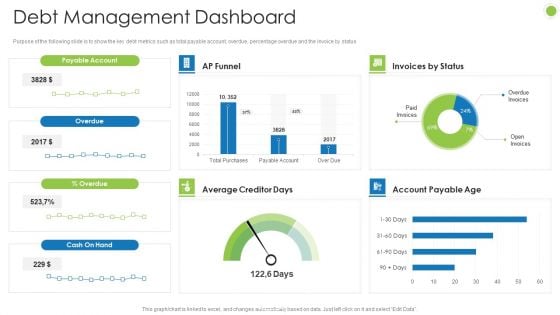
Debt Retrieval Techniques Debt Management Dashboard Ppt Gallery Example File PDF
Purpose of the following slide is to show the key debt metrics such as total payable account, overdue, percentage overdue and the invoice by status Deliver an awe inspiring pitch with this creative debt retrieval techniques debt management dashboard ppt gallery example file pdf bundle. Topics like debt management dashboard can be discussed with this completely editable template. It is available for immediate download depending on the needs and requirements of the user.
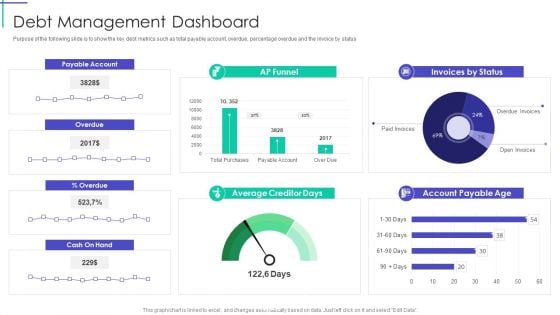
Mortgage Recovery Strategy For Finance Companies Debt Management Dashboard Inspiration PDF
Purpose of the following slide is to show the key debt metrics such as total payable account, overdue, percentage overdue and the invoice by status Deliver an awe inspiring pitch with this creative Mortgage Recovery Strategy For Finance Companies Debt Management Dashboard Inspiration PDF bundle. Topics like Average Creditor Days, Debt Management Dashboard can be discussed with this completely editable template. It is available for immediate download depending on the needs and requirements of the user.


 Continue with Email

 Home
Home


