key performance indicators
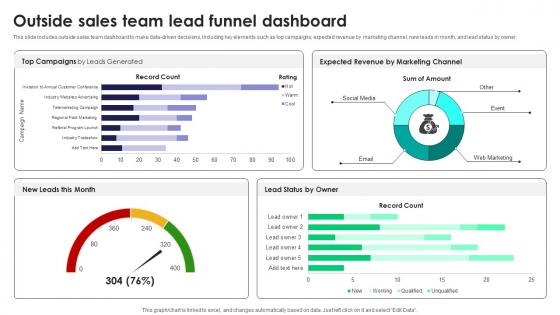
Outside Sales Team Lead Funnel Dashboard Tactics For Improving Field Sales Team SA SS V
This slide includes outside sales team dashboard to make data-driven decisions, including key elements such as top campaigns, expected revenue by marketing channel, new leads in month, and lead status by owner.Retrieve professionally designed Outside Sales Team Lead Funnel Dashboard Tactics For Improving Field Sales Team SA SS V to effectively convey your message and captivate your listeners. Save time by selecting pre-made slideshows that are appropriate for various topics, from business to educational purposes. These themes come in many different styles, from creative to corporate, and all of them are easily adjustable and can be edited quickly. Access them as PowerPoint templates or as Google Slides themes. You do not have to go on a hunt for the perfect presentation because Slidegeeks got you covered from everywhere. This slide includes outside sales team dashboard to make data-driven decisions, including key elements such as top campaigns, expected revenue by marketing channel, new leads in month, and lead status by owner.
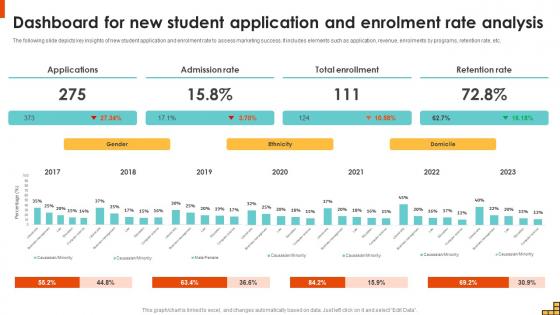
Dashboard For New Student Application And Enrolment Running Marketing Campaigns Strategy SS V
The following slide depicts key insights of new student application and enrolment rate to assess marketing success. It includes elements such as application, revenue, enrolments by programs, retention rate, etc. Crafting an eye-catching presentation has never been more straightforward. Let your presentation shine with this tasteful yet straightforward Dashboard For New Student Application And Enrolment Running Marketing Campaigns Strategy SS V template. It offers a minimalistic and classy look that is great for making a statement. The colors have been employed intelligently to add a bit of playfulness while still remaining professional. Construct the ideal Dashboard For New Student Application And Enrolment Running Marketing Campaigns Strategy SS V that effortlessly grabs the attention of your audience Begin now and be certain to wow your customers The following slide depicts key insights of new student application and enrolment rate to assess marketing success. It includes elements such as application, revenue, enrolments by programs, retention rate, etc.
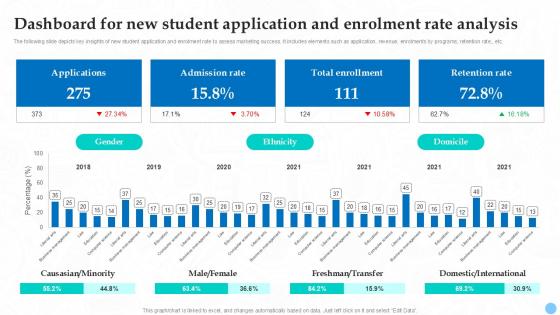
Dashboard For New Student Application Higher Education Ppt Sample Strategy SS V
The following slide depicts key insights of new student application and enrolment rate to assess marketing success. It includes elements such as application, revenue, enrolments by programs, retention rate, etc. Crafting an eye-catching presentation has never been more straightforward. Let your presentation shine with this tasteful yet straightforward Dashboard For New Student Application Higher Education Ppt Sample Strategy SS V template. It offers a minimalistic and classy look that is great for making a statement. The colors have been employed intelligently to add a bit of playfulness while still remaining professional. Construct the ideal Dashboard For New Student Application Higher Education Ppt Sample Strategy SS V that effortlessly grabs the attention of your audience Begin now and be certain to wow your customers The following slide depicts key insights of new student application and enrolment rate to assess marketing success. It includes elements such as application, revenue, enrolments by programs, retention rate, etc.
Strategic Brand Management KPI Dashboard To Monitor Icons Pdf
Mentioned slide shows the KPI dashboard that can be used to track win and lost sales opportunities. It includes metrics namely won opportunities, lost opportunities, pipeline by territory, total opportunities. This Strategic Brand Management KPI Dashboard To Monitor Icons Pdf from Slidegeeks makes it easy to present information on your topic with precision. It provides customization options, so you can make changes to the colors, design, graphics, or any other component to create a unique layout. It is also available for immediate download, so you can begin using it right away. Slidegeeks has done good research to ensure that you have everything you need to make your presentation stand out. Make a name out there for a brilliant performance. Mentioned slide shows the KPI dashboard that can be used to track win and lost sales opportunities. It includes metrics namely won opportunities, lost opportunities, pipeline by territory, total opportunities.
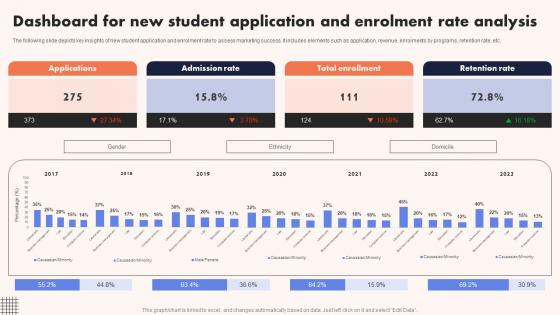
University Marketing Guide Dashboard For New Student Application And Enrolment Strategy SS V
The following slide depicts key insights of new student application and enrolment rate to assess marketing success. It includes elements such as application, revenue, enrolments by programs, retention rate, etc. Coming up with a presentation necessitates that the majority of the effort goes into the content and the message you intend to convey. The visuals of a PowerPoint presentation can only be effective if it supplements and supports the story that is being told. Keeping this in mind our experts created University Marketing Guide Dashboard For New Student Application And Enrolment Strategy SS V to reduce the time that goes into designing the presentation. This way, you can concentrate on the message while our designers take care of providing you with the right template for the situation. The following slide depicts key insights of new student application and enrolment rate to assess marketing success. It includes elements such as application, revenue, enrolments by programs, retention rate, etc.
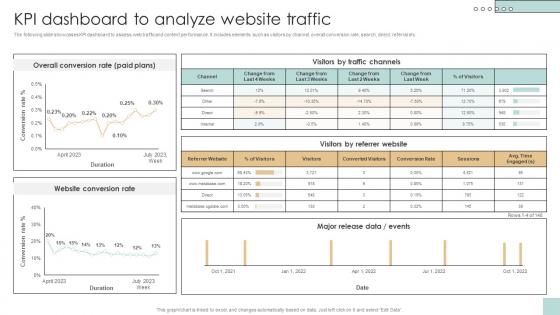
KPI Dashboard To Analyze Website Traffic Developing And Creating Digital Content Strategy SS V
The following slide showcases KPI dashboard to assess web traffic and content performance. It includes elements such as visitors by channel, overall conversion rate, search, direct, referral etc. The best PPT templates are a great way to save time, energy, and resources. Slidegeeks have 100 percent editable powerpoint slides making them incredibly versatile. With these quality presentation templates, you can create a captivating and memorable presentation by combining visually appealing slides and effectively communicating your message. Download KPI Dashboard To Analyze Website Traffic Developing And Creating Digital Content Strategy SS V from Slidegeeks and deliver a wonderful presentation. The following slide showcases KPI dashboard to assess web traffic and content performance. It includes elements such as visitors by channel, overall conversion rate, search, direct, referral etc.
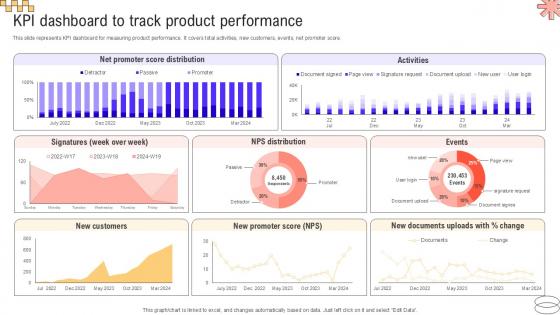
KPI Dashboard To Track Product Implementing Geographic Extension PPT Example Strategy SS V
This slide represents KPI dashboard for measuring product performance. It covers total activities, new customers, events, net promoter score. Coming up with a presentation necessitates that the majority of the effort goes into the content and the message you intend to convey. The visuals of a PowerPoint presentation can only be effective if it supplements and supports the story that is being told. Keeping this in mind our experts created KPI Dashboard To Track Product Implementing Geographic Extension PPT Example Strategy SS V to reduce the time that goes into designing the presentation. This way, you can concentrate on the message while our designers take care of providing you with the right template for the situation. This slide represents KPI dashboard for measuring product performance. It covers total activities, new customers, events, net promoter score.
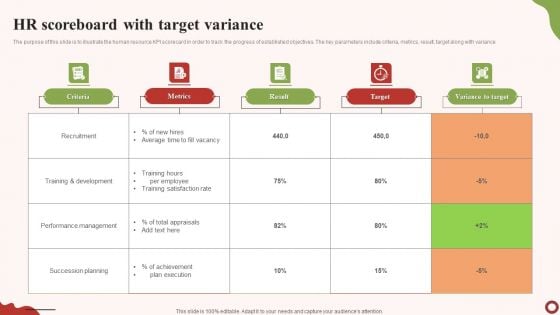
HR Scoreboard With Target Variance Inspiration PDF
The purpose of this slide is to illustrate the human resource KPI scorecard in order to track the progress of established objectives. The key parameters include criteria, metrics, result, target along with variance. Showcasing this set of slides titled HR Scoreboard With Target Variance Inspiration PDF. The topics addressed in these templates are Criteria, Metrics, Result. All the content presented in this PPT design is completely editable. Download it and make adjustments in color, background, font etc. as per your unique business setting.
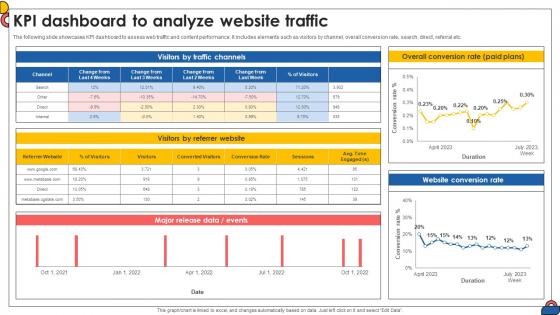
Kpi Dashboard To Analyze Website Traffic Comprehensive Guide To Implement Strategy SS V
The best PPT templates are a great way to save time, energy, and resources. Slidegeeks have 100 percent editable powerpoint slides making them incredibly versatile. With these quality presentation templates, you can create a captivating and memorable presentation by combining visually appealing slides and effectively communicating your message. Download Kpi Dashboard To Analyze Website Traffic Comprehensive Guide To Implement Strategy SS V from Slidegeeks and deliver a wonderful presentation. The following slide showcases KPI dashboard to assess web traffic and content performance. It includes elements such as visitors by channel, overall conversion rate, search, direct, referral etc.
Storage Facility Productivity Tracking KPI Dashboard Graphics PDF
This slide showcases a dashboard for tracking and managing warehouse productivity to optimize logistics operations. It includes key components such as warehouse operating costs, perfect order rate, total shipments by country and on time shipments. Showcasing this set of slides titled Storage Facility Productivity Tracking KPI Dashboard Graphics PDF. The topics addressed in these templates are Warehouse Operating Costs, Perfect Order Rate, Total Shipment Country. All the content presented in this PPT design is completely editable. Download it and make adjustments in color, background, font etc. as per your unique business setting.
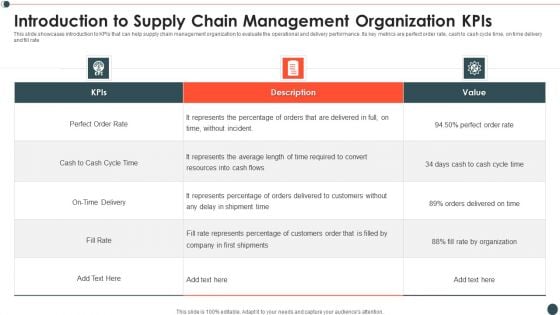
Introduction To Supply Chain Management Organization Kpis Mockup PDF
This slide showcases introduction to KPIs that can help supply chain management organization to evaluate the operational and delivery performance. Its key metrics are perfect order rate, cash to cash cycle time, on time delivery and fill rate.Showcasing this set of slides titled Introduction To Supply Chain Management Organization Kpis Mockup PDF The topics addressed in these templates are Orders Delivered, Represents Percentage, Company Shipments All the content presented in this PPT design is completely editable. Download it and make adjustments in color, background, font etc. as per your unique business setting.
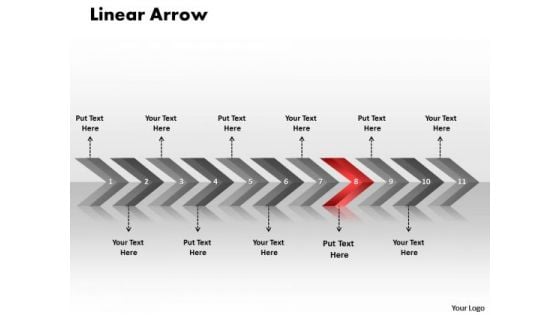
Flow Ppt Linear Arrows 11 States Diagram Project Management PowerPoint 9 Graphic
flow PPT linear arrows 11 states diagram project management powerpoint 9 Graphic-This Linear arrow template helps expound on the logic of your detailed thought process to take your company forward. Break it all down to Key Result Areas. Motivate your team to cross all barriers-flow PPT linear arrows 11 states diagram project management powerpoint 9 Graphic-Aim, Angle, Arrow, Arrowheads, Badge, Banner, Connection, Curve, Design, Direction, Download, Element, Fuchsia, Icon, Illustration, Indicator, Internet, Label, Link, Magenta, Mark, Marker, Next, Object, Orange, Orientation, Pointer, Shadow, Shape, Signs Symbol Motivate your team to excellent performances. Nurture their abilities through our Flow Ppt Linear Arrows 11 States Diagram Project Management PowerPoint 9 Graphic.
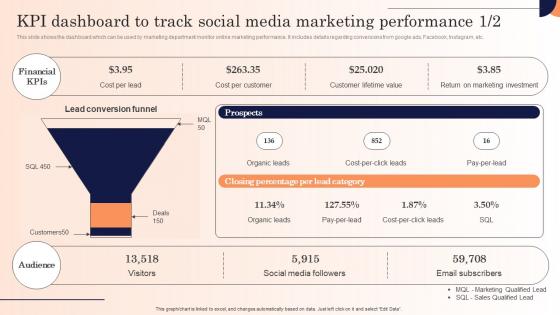
Kpi Dashboard To Track Social Media Marketing Strategic Marketing Campaign Inspiration Pdf
This slide shows the dashboard which can be used by marketing department monitor online marketing performance. It includes details regarding conversions from google ads, Facebook, Instagram, etc.Welcome to our selection of the Kpi Dashboard To Track Social Media Marketing Strategic Marketing Campaign Inspiration Pdf. These are designed to help you showcase your creativity and bring your sphere to life. Planning and Innovation are essential for any business that is just starting out. This collection contains the designs that you need for your everyday presentations. All of our PowerPoints are 100Precent editable, so you can customize them to suit your needs. This multi-purpose template can be used in various situations. Grab these presentation templates today. This slide shows the dashboard which can be used by marketing department monitor online marketing performance. It includes details regarding conversions from google ads, Facebook, Instagram, etc.
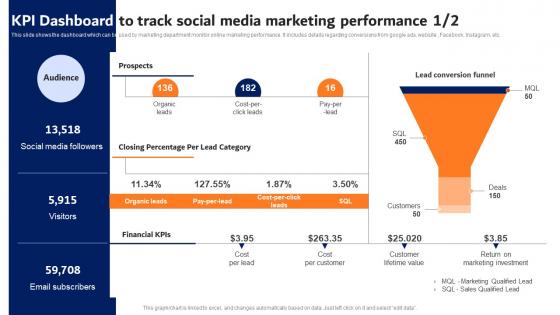
Digital Advertising Strategies KPI Dashboard To Track Social Media Infographics Pdf
This slide shows the dashboard which can be used by marketing department monitor online marketing performance. It includes details regarding conversions from google ads, website , Facebook, Instagram, etc. Make sure to capture your audiences attention in your business displays with our gratis customizable Digital Advertising Strategies KPI Dashboard To Track Social Media Infographics Pdf. These are great for business strategies, office conferences, capital raising or task suggestions. If you desire to acquire more customers for your tech business and ensure they stay satisfied, create your own sales presentation with these plain slides. This slide shows the dashboard which can be used by marketing department monitor online marketing performance. It includes details regarding conversions from google ads, website , Facebook, Instagram, etc.
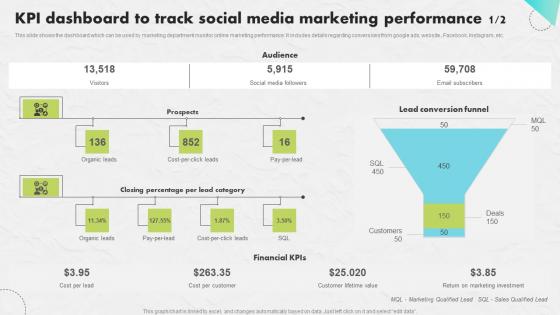
KPI Dashboard Track Social Developing An Impactful SEO Marketing Plan Graphics Pdf
This slide shows the dashboard which can be used by marketing department monitor online marketing performance. It includes details regarding conversions from google ads, website , Facebook, Instagram, etc. If your project calls for a presentation, then Slidegeeks is your go to partner because we have professionally designed, easy to edit templates that are perfect for any presentation. After downloading, you can easily edit KPI Dashboard Track Social Developing An Impactful SEO Marketing Plan Graphics Pdf and make the changes accordingly. You can rearrange slides or fill them with different images. Check out all the handy templates This slide shows the dashboard which can be used by marketing department monitor online marketing performance. It includes details regarding conversions from google ads, website , Facebook, Instagram, etc.
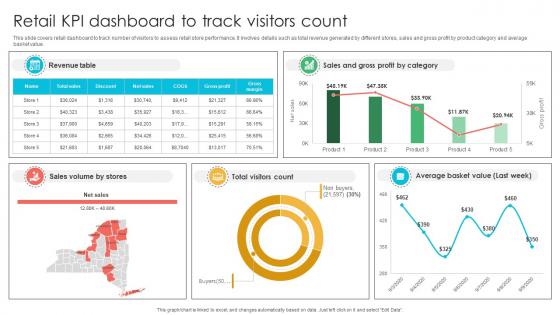
Marketing Strategies For Effective Retail KPI Dashboard To Track Visitors Count
This slide covers retail dashboard to track number of visitors to assess retail store performance. It involves details such as total revenue generated by different stores, sales and gross profit by product category and average basket value. Want to ace your presentation in front of a live audience Our Marketing Strategies For Effective Retail KPI Dashboard To Track Visitors Count can help you do that by engaging all the users towards you. Slidegeeks experts have put their efforts and expertise into creating these impeccable powerpoint presentations so that you can communicate your ideas clearly. Moreover, all the templates are customizable, and easy-to-edit and downloadable. Use these for both personal and commercial use. This slide covers retail dashboard to track number of visitors to assess retail store performance. It involves details such as total revenue generated by different stores, sales and gross profit by product category and average basket value.
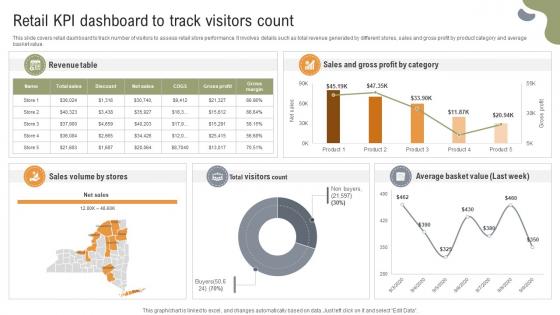
Implementing Strategies To Enhance Retail KPI Dashboard To Track Visitors Count
This slide covers retail dashboard to track number of visitors to assess retail store performance. It involves details such as total revenue generated by different stores, sales and gross profit by product category and average basket value. Want to ace your presentation in front of a live audience Our Implementing Strategies To Enhance Retail KPI Dashboard To Track Visitors Count can help you do that by engaging all the users towards you. Slidegeeks experts have put their efforts and expertise into creating these impeccable powerpoint presentations so that you can communicate your ideas clearly. Moreover, all the templates are customizable, and easy-to-edit and downloadable. Use these for both personal and commercial use. This slide covers retail dashboard to track number of visitors to assess retail store performance. It involves details such as total revenue generated by different stores, sales and gross profit by product category and average basket value.
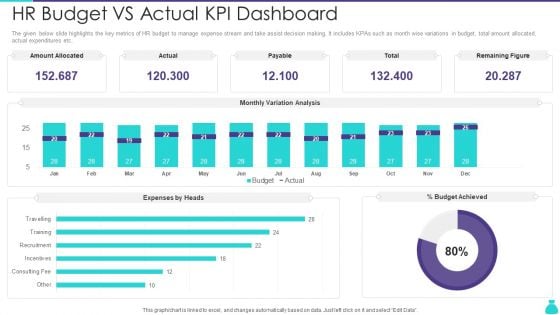
HR Budget Vs Actual KPI Dashboard Ppt PowerPoint Presentation File Structure PDF
The given below slide highlights the key metrics of HR budget to manage expense stream and take assist decision making. It includes KPAs such as month wise variations in budget, total amount allocated, actual expenditures etc. Pitch your topic with ease and precision using this HR Budget Vs Actual KPI Dashboard Ppt PowerPoint Presentation File Structure PDF. This layout presents information on Amount Allocated, Expenses by Heads, Budget Achieved. It is also available for immediate download and adjustment. So, changes can be made in the color, design, graphics or any other component to create a unique layout.
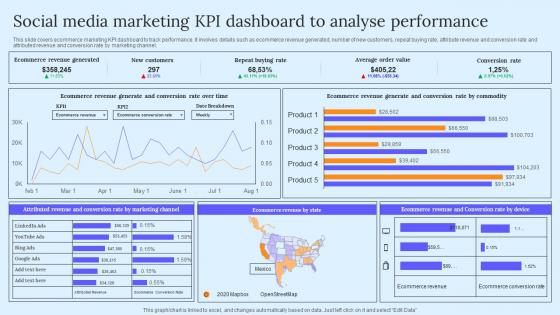
Social Media Marketing KPI Dashboard B2B Marketing Techniques To Attract Potential Pictures Pdf
This slide covers ecommerce marketing KPI dashboard to track performance. It involves details such as ecommerce revenue generated, number of new customers, repeat buying rate, attribute revenue and conversion rate and attributed revenue and conversion rate by marketing channel. Do you have an important presentation coming up Are you looking for something that will make your presentation stand out from the rest Look no further than Social Media Marketing KPI Dashboard B2B Marketing Techniques To Attract Potential Pictures Pdf. With our professional designs, you can trust that your presentation will pop and make delivering it a smooth process. And with Slidegeeks, you can trust that your presentation will be unique and memorable. So why wait Grab Social Media Marketing KPI Dashboard B2B Marketing Techniques To Attract Potential Pictures Pdf today and make your presentation stand out from the rest This slide covers ecommerce marketing KPI dashboard to track performance. It involves details such as ecommerce revenue generated, number of new customers, repeat buying rate, attribute revenue and conversion rate and attributed revenue and conversion rate by marketing channel.
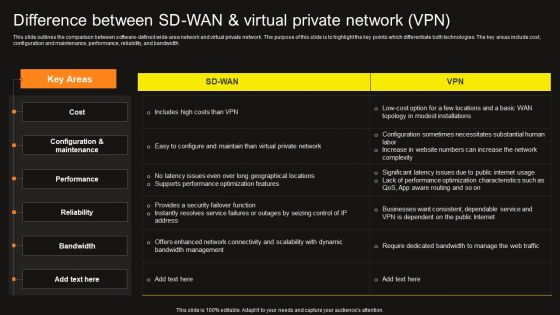
Virtual WAN Architecture Difference Between SD WAN And Virtual Private Network VPN Clipart PDF
This slide outlines the comparison between software-defined wide-area network and virtual private network. The purpose of this slide is to highlight the key points which differentiate both technologies. The key areas include cost, configuration and maintenance, performance, reliability, and bandwidth. This modern and well-arranged Virtual WAN Architecture Difference Between SD WAN And Virtual Private Network VPN Clipart PDF provides lots of creative possibilities. It is very simple to customize and edit with the Powerpoint Software. Just drag and drop your pictures into the shapes. All facets of this template can be edited with Powerpoint, no extra software is necessary. Add your own material, put your images in the places assigned for them, adjust the colors, and then you can show your slides to the world, with an animated slide included.
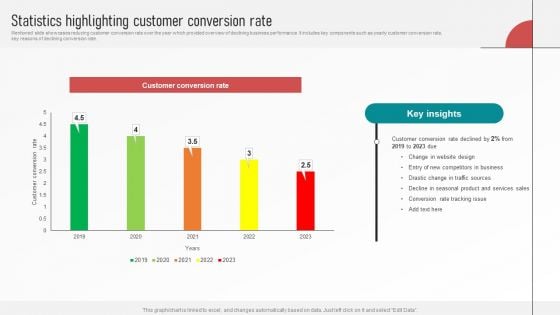
Customer Retention With Email Advertising Campaign Plan Statistics Highlighting Customer Conversion Rate Demonstration PDF
Mentioned slide showcases reducing customer conversion rate over the year which provided overview of declining business performance. It includes key components such as yearly customer conversion rate, key reasons of declining conversion rate. This modern and well arranged Customer Retention With Email Advertising Campaign Plan Statistics Highlighting Customer Conversion Rate Demonstration PDF provides lots of creative possibilities. It is very simple to customize and edit with the Powerpoint Software. Just drag and drop your pictures into the shapes. All facets of this template can be edited with Powerpoint no extra software is necessary. Add your own material, put your images in the places assigned for them, adjust the colors, and then you can show your slides to the world, with an animated slide included.
Lead Tracking Metrics Dashboard With User Responses Diagrams PDF
This slide showcases dashboard for lead conversion metrics that can help organization to filter out total leads interested from the leads who have responded to the phone calls by organization. It also showcases key metrics such as leads busiest hours, leads busiest days, phone number types and lead types. Showcasing this set of slides titled Lead Tracking Metrics Dashboard With User Responses Diagrams PDF. The topics addressed in these templates are Busiest Hours Leads, Conversion Metrics, Lead Types. All the content presented in this PPT design is completely editable. Download it and make adjustments in color, background, font etc. as per your unique business setting.
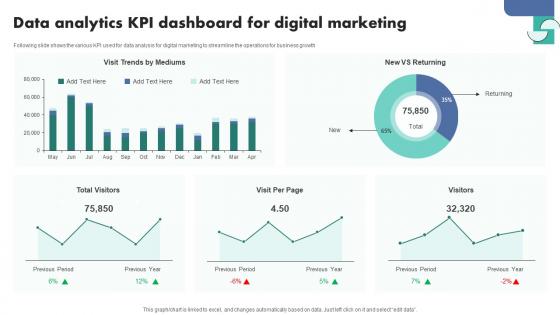
Data Analytics Kpi Dashboard For Digital Marketing Inspiration Pdf
Following slide shows the various KPI used for data analysis for digital marketing to streamline the operations for business growth.Showcasing this set of slides titled Data Analytics Kpi Dashboard For Digital Marketing Inspiration Pdf The topics addressed in these templates are Data Analytics KPI, Dashboard Digital Marketing All the content presented in this PPT design is completely editable. Download it and make adjustments in color, background, font etc. as per your unique business setting. Following slide shows the various KPI used for data analysis for digital marketing to streamline the operations for business growth.
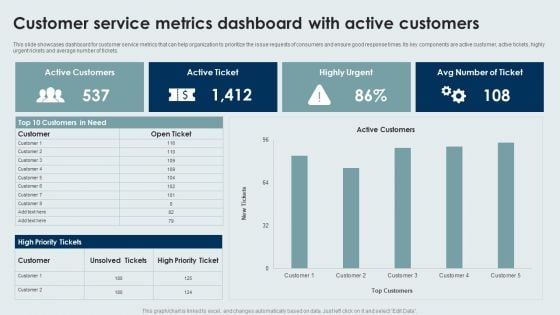
Customer Service Metrics Dashboard With Active Customers Ideas PDF
This slide showcases dashboard for customer service metrics that can help organization to prioritize the issue requests of consumers and ensure good response times. Its key components are active customer, active tickets, highly urgent rickets and average number of tickets. Showcasing this set of slides titled Customer Service Metrics Dashboard With Active Customers Ideas PDF. The topics addressed in these templates are Customer Service, Metrics Dashboard, Active Customers. All the content presented in this PPT design is completely editable. Download it and make adjustments in color, background, font etc. as per your unique business setting.
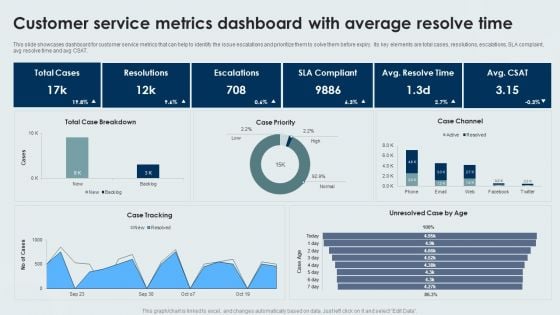
Customer Service Metrics Dashboard With Average Resolve Time Sample PDF
This slide showcases dashboard for customer service metrics that can help to identify the issue escalations and prioritize them to solve them before expiry. Its key elements are total cases, resolutions, escalations, SLA complaint, avg resolve time and avg CSAT. Showcasing this set of slides titled Customer Service Metrics Dashboard With Average Resolve Time Sample PDF. The topics addressed in these templates are Customer Service, Metrics Dashboard, Average Resolve Time. All the content presented in this PPT design is completely editable. Download it and make adjustments in color, background, font etc. as per your unique business setting.
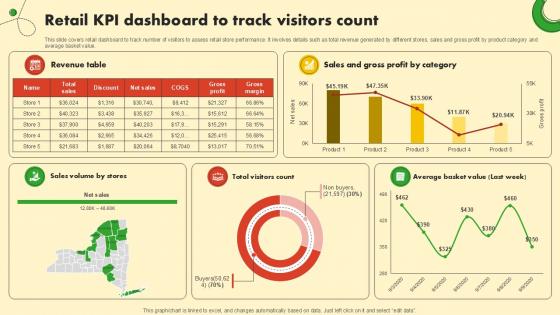
Retail KPI Dashboard To Track Food And Grocery Retail Ppt Slide
This slide covers retail dashboard to track number of visitors to assess retail store performance. It involves details such as total revenue generated by different stores, sales and gross profit by product category and average basket value. This Retail KPI Dashboard To Track Food And Grocery Retail Ppt Slide is perfect for any presentation, be it in front of clients or colleagues. It is a versatile and stylish solution for organizing your meetings. The Retail KPI Dashboard To Track Food And Grocery Retail Ppt Slide features a modern design for your presentation meetings. The adjustable and customizable slides provide unlimited possibilities for acing up your presentation. Slidegeeks has done all the homework before launching the product for you. So, do not wait, grab the presentation templates today This slide covers retail dashboard to track number of visitors to assess retail store performance. It involves details such as total revenue generated by different stores, sales and gross profit by product category and average basket value.
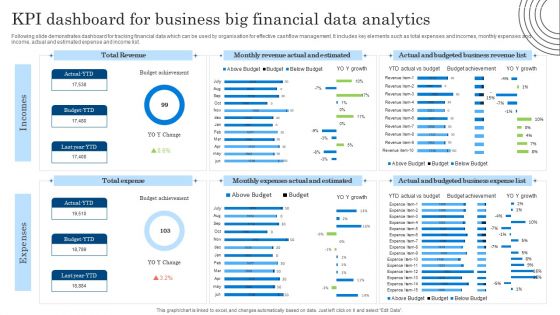
KPI Dashboard For Business Big Financial Data Analytics Diagrams PDF
Following slide demonstrates dashboard for tracking financial data which can be used by organisation for effective cashflow management. It includes key elements such as total expenses and incomes, monthly expenses and income, actual and estimated expense and income list. Showcasing this set of slides titled KPI Dashboard For Business Big Financial Data Analytics Diagrams PDF. The topics addressed in these templates are KPI Dashboard, Business Big Financial, Data Analytics. All the content presented in this PPT design is completely editable. Download it and make adjustments in color, background, font etc. as per your unique business setting.
Track Employee Training Plan KPI Dashboard Icons Pdf
Following slide shows KPI dashboard for tracking employee training plans which help in analyzing where the organization lagging behind in skill development program. It includes the KPI such as training status, budget allocation, monthly cost incurred, etc. Showcasing this set of slides titled Track Employee Training Plan KPI Dashboard Icons Pdf The topics addressed in these templates are Monthly Dashboard, Budget Allocation, Remaining All the content presented in this PPT design is completely editable. Download it and make adjustments in color, background, font etc. as per your unique business setting. Following slide shows KPI dashboard for tracking employee training plans which help in analyzing where the organization lagging behind in skill development program. It includes the KPI such as training status, budget allocation, monthly cost incurred, etc.

Freelance Content Marketing Dashboard With Metrics Demonstration PDF
The following slide highlights the freelance content marketing dashboard with metrics illustrating most visited content, monthly total visit, average content score. It depicts key metrics which includes content reach, unique visits, organic ranking, number of shares, rating, session time and repeat visitors. Showcasing this set of slides titled Freelance Content Marketing Dashboard With Metrics Demonstration PDF. The topics addressed in these templates are Organic Ranking, Manufacturing, Average Content Score. All the content presented in this PPT design is completely editable. Download it and make adjustments in color, background, font etc. as per your unique business setting.
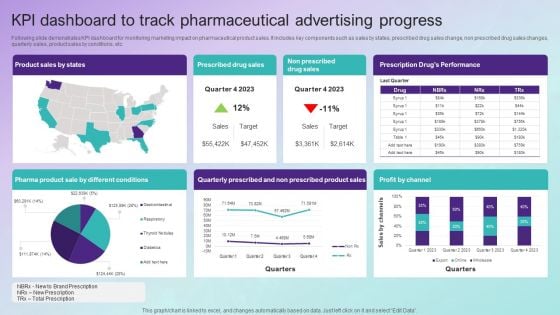
KPI Dashboard To Track Pharmaceutical Advertising Progress Topics PDF
Following slide demonstrates KPI dashboard for monitoring marketing impact on pharmaceutical product sales. It includes key components such as sales by states, prescribed drug sales change, non prescribed drug sales changes, quarterly sales, product sales by conditions, etc. Showcasing this set of slides titled KPI Dashboard To Track Pharmaceutical Advertising Progress Topics PDF. The topics addressed in these templates are Product Sales By States, Prescribed Drug Sales, Non Prescribed Drug Sales, Profit By Channel. All the content presented in this PPT design is completely editable. Download it and make adjustments in color, background, font etc. as per your unique business setting.
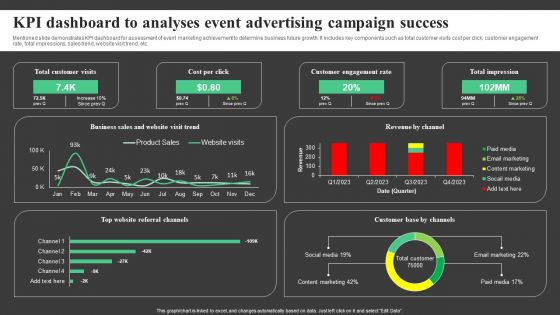
KPI Dashboard To Analyses Event Advertising Campaign Success Topics PDF
Mentioned slide demonstrates KPI dashboard for assessment of event marketing achievement to determine business future growth. It includes key components such as total customer visits cost per click, customer engagement rate, total impressions, sales trend, website visit trend, etc. Showcasing this set of slides titled KPI Dashboard To Analyses Event Advertising Campaign Success Topics PDF. The topics addressed in these templates are Total Customer Visits, Cost Per Click, Customer Engagement Rate . All the content presented in this PPT design is completely editable. Download it and make adjustments in color, background, font etc. as per your unique business setting.
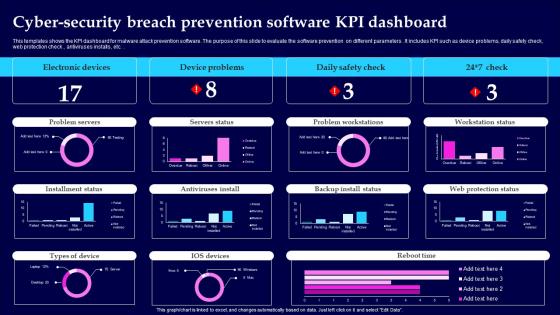
Cyber Security Breach Prevention Software KPI Dashboard Information Pdf
This templates shows the KPI dashboard for malware attack prevention software. The purpose of this slide to evaluate the software prevention on different parameters. It includes KPI such as device problems, daily safety check, web protection check, antiviruses installs , etc. Showcasing this set of slides titled Cyber Security Breach Prevention Software KPI Dashboard Information Pdf The topics addressed in these templates are Electronic Devices, Device Problems, Daily Safety Check All the content presented in this PPT design is completely editable. Download it and make adjustments in color, background, font etc. as per your unique business setting. This templates shows the KPI dashboard for malware attack prevention software. The purpose of this slide to evaluate the software prevention on different parameters. It includes KPI such as device problems, daily safety check, web protection check, antiviruses installs , etc.
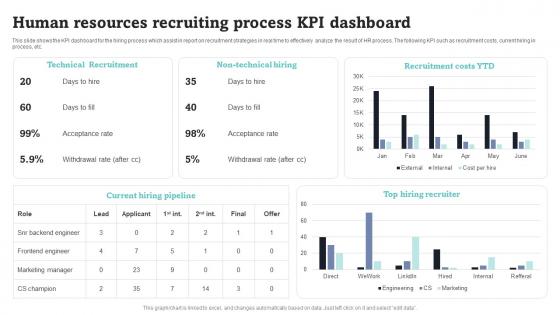
Human Resources Recruiting Process KPI Dashboard Summary Pdf
This slide shows the KPI dashboard for the hiring process which assist in report on recruitment strategies in real time to effectively analyze the result of HR process. The following KPI such as recruitment costs, current hiring in process, etc. Showcasing this set of slides titled Human Resources Recruiting Process KPI Dashboard Summary Pdf. The topics addressed in these templates are Technical Recruitment, Non Technical Hiring, Recruitment Costs. All the content presented in this PPT design is completely editable. Download it and make adjustments in color, background, font etc. as per your unique business setting. This slide shows the KPI dashboard for the hiring process which assist in report on recruitment strategies in real time to effectively analyze the result of HR process. The following KPI such as recruitment costs, current hiring in process, etc.
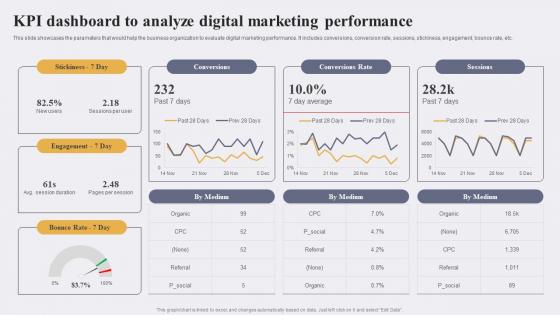
KPI Dashboard To Analyze Digital Marketing Enhancing Conversion Rate By Leveraging Background Pdf
This slide showcases the parameters that would help the business organization to evaluate digital marketing performance. It includes conversions, conversion rate, sessions, stickiness, engagement, bounce rate, etc.If you are looking for a format to display your unique thoughts, then the professionally designed KPI Dashboard To Analyze Digital Marketing Enhancing Conversion Rate By Leveraging Background Pdf is the one for you. You can use it as a Google Slides template or a PowerPoint template. Incorporate impressive visuals, symbols, images, and other charts. Modify or reorganize the text boxes as you desire. Experiment with shade schemes and font pairings. Alter, share or cooperate with other people on your work. Download KPI Dashboard To Analyze Digital Marketing Enhancing Conversion Rate By Leveraging Background Pdf and find out how to give a successful presentation. Present a perfect display to your team and make your presentation unforgettable. This slide showcases the parameters that would help the business organization to evaluate digital marketing performance. It includes conversions, conversion rate, sessions, stickiness, engagement, bounce rate, etc.
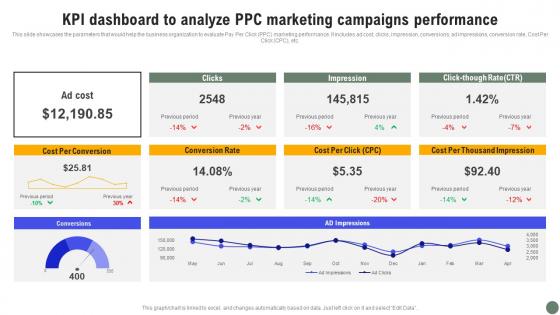
KPI Dashboard To Analyze PPC Exhaustive Guide Of Pay Per Click Advertising Initiatives Inspiration Pdf
This slide showcases the parameters that would help the business organization to evaluate Pay Per Click PPC marketing performance. It includes ad cost, clicks, impression, conversions, ad impressions, conversion rate, Cost Per Click CPC, etc. Formulating a presentation can take up a lot of effort and time, so the content and message should always be the primary focus. The visuals of the PowerPoint can enhance the presenters message, so our KPI Dashboard To Analyze PPC Exhaustive Guide Of Pay Per Click Advertising Initiatives Inspiration Pdf was created to help save time. Instead of worrying about the design, the presenter can concentrate on the message while our designers work on creating the ideal templates for whatever situation is needed. Slidegeeks has experts for everything from amazing designs to valuable content, we have put everything into KPI Dashboard To Analyze PPC Exhaustive Guide Of Pay Per Click Advertising Initiatives Inspiration Pdf This slide showcases the parameters that would help the business organization to evaluate Pay Per Click PPC marketing performance. It includes ad cost, clicks, impression, conversions, ad impressions, conversion rate, Cost Per Click CPC, etc.
Employees Learning And Improvement KPI Courses Dashboard Icon Introduction Pdf
Showcasing this set of slides titled Employees Learning And Improvement KPI Courses Dashboard Icon Introduction Pdf. The topics addressed in these templates are Employees Learning, Improvement KPI, Courses Dashboard Icon. All the content presented in this PPT design is completely editable. Download it and make adjustments in color, background, font etc. as per your unique business setting. Our Employees Learning And Improvement KPI Courses Dashboard Icon Introduction Pdf are topically designed to provide an attractive backdrop to any subject. Use them to look like a presentation pro.
Learning And Improvement KPI Training Dashboard Icon Graphics Pdf
Pitch your topic with ease and precision using this Learning And Improvement KPI Training Dashboard Icon Graphics Pdf. This layout presents information on Learning And Improvement KPI, Training Dashboard Icon. It is also available for immediate download and adjustment. So, changes can be made in the color, design, graphics or any other component to create a unique layout. Our Learning And Improvement KPI Training Dashboard Icon Graphics Pdf are topically designed to provide an attractive backdrop to any subject. Use them to look like a presentation pro.

KPI Dashboard For Estimating Monthly Cash Flow Infographics Pdf
Following slide demonstrates KPI dashboard to forecast monthly business money flow for cash flow management planning. It includes components such as projected profit before tax, net operating cash flow, net financial cash flow, net investing cash flow, etc. Showcasing this set of slides titled KPI Dashboard For Estimating Monthly Cash Flow Infographics Pdf. The topics addressed in these templates are KPI Dashboard, Estimating Monthly Cash Flow, Net Financial Cash Flow. All the content presented in this PPT design is completely editable. Download it and make adjustments in color, background, font etc. as per your unique business setting. Following slide demonstrates KPI dashboard to forecast monthly business money flow for cash flow management planning. It includes components such as projected profit before tax, net operating cash flow, net financial cash flow, net investing cash flow, etc.
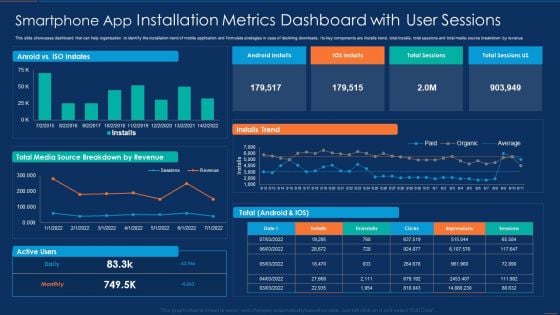
Smartphone App Installation Metrics Dashboard With User Sessions Microsoft PDF
This slide showcases dashboard that can help organization to identify the installation trend of mobile application and formulate strategies in case of declining downloads. Its key components are installs trend, total installs, total sessions and total media source breakdown by revenue. Pitch your topic with ease and precision using this Smartphone App Installation Metrics Dashboard With User Sessions Microsoft PDF. This layout presents information on Smartphone App Installation Metrics Dashboard With User Sessions. It is also available for immediate download and adjustment. So, changes can be made in the color, design, graphics or any other component to create a unique layout.
Kpi Dashboard For Tracking Social Media Campaign Results Powerful Marketing Techniques Strategy SS V
This slide covers the dashboard for analyzing social media marketing campaigns. It includes metrics such as tweets, followers, followings, listed favorites, reach, views, Facebook engagement, clicks, likes, Instagram photos, etc. This Kpi Dashboard For Tracking Social Media Campaign Results Powerful Marketing Techniques Strategy SS V from Slidegeeks makes it easy to present information on your topic with precision. It provides customization options, so you can make changes to the colors, design, graphics, or any other component to create a unique layout. It is also available for immediate download, so you can begin using it right away. Slidegeeks has done good research to ensure that you have everything you need to make your presentation stand out. Make a name out there for a brilliant performance. This slide covers the dashboard for analyzing social media marketing campaigns. It includes metrics such as tweets, followers, followings, listed favorites, reach, views, Facebook engagement, clicks, likes, Instagram photos, etc.
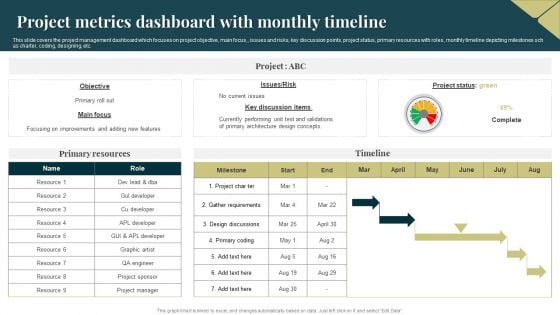
Project Metrics Dashboard With Monthly Timeline Pictures PDF
This slide covers the project management dashboard which focuses on project objective, main focus,, issues and risks, key discussion points, project status, primary resources with roles, monthly timeline depicting milestones sch as charter, coding, designing, etc. Showcasing this set of slides titled Project Metrics Dashboard With Monthly Timeline Pictures PDF. The topics addressed in these templates are Primary Resources, Risk, Requirements. All the content presented in this PPT design is completely editable. Download it and make adjustments in color, background, font etc. as per your unique business setting.
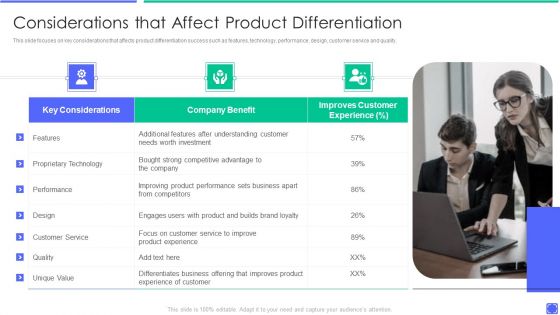
Best Techniques To Enhance New Product Management Efficiency Considerations That Affect Product Diagrams PDF
This slide focuses on key considerations that affects product differentiation success such as features, technology, performance, design, customer service and quality. This is a best techniques to enhance new product management efficiency comparing product metrics themes pdf template with various stages. Focus and dispense information on three stages using this creative set, that comes with editable features. It contains large content boxes to add your information on topics like proprietary technology, performance, customer service. You can also showcase facts, figures, and other relevant content using this PPT layout. Grab it now.
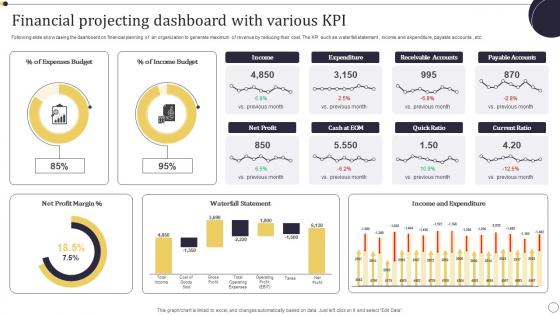
Financial Projecting Dashboard With Various KPI Themes Pdf
Following slide showcasing the dashboard on financial planning of an organization to generate maximum of revenue by reducing their cost. The KPI such as waterfall statement , income and expenditure, payable accounts , etc . Pitch your topic with ease and precision using this Financial Projecting Dashboard With Various KPI Themes Pdf. This layout presents information on Income Budget, Expenses Budget, Net Profit Margin. It is also available for immediate download and adjustment. So, changes can be made in the color, design, graphics or any other component to create a unique layout. Following slide showcasing the dashboard on financial planning of an organization to generate maximum of revenue by reducing their cost. The KPI such as waterfall statement , income and expenditure, payable accounts , etc .
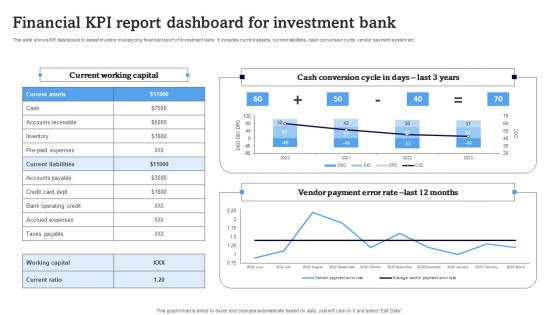
Financial KPI Report Dashboard For Investment Bank Structure Pdf
This slide shows KPI dashboard to assist investor in analyzing financial report of investment bank. It includes current assets, current liabilities, cash conversion cycle, vendor payment system etc. Showcasing this set of slides titled Financial KPI Report Dashboard For Investment Bank Structure Pdf. The topics addressed in these templates are Current Working Capital, Cash Conversion Cycle Days, Vendor Payment Error Rate. All the content presented in this PPT design is completely editable. Download it and make adjustments in color, background, font etc. as per your unique business setting. This slide shows KPI dashboard to assist investor in analyzing financial report of investment bank. It includes current assets, current liabilities, cash conversion cycle, vendor payment system etc.
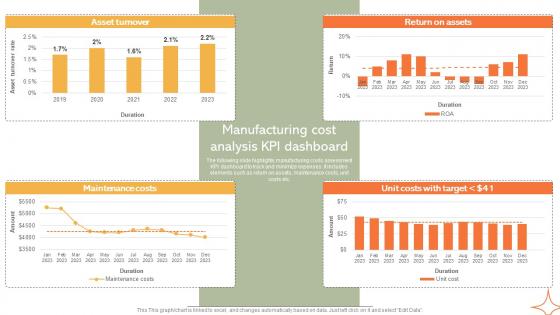
Manufacturing Cost Analysis KPI Dashboard Implementing Manufacturing Strategy SS V
The following slide highlights manufacturing costs assessment KPI dashboard to track and minimize expenses. It includes elements such as return on assets, maintenance costs, unit costs etc. Make sure to capture your audiences attention in your business displays with our gratis customizable Manufacturing Cost Analysis KPI Dashboard Implementing Manufacturing Strategy SS V. These are great for business strategies, office conferences, capital raising or task suggestions. If you desire to acquire more customers for your tech business and ensure they stay satisfied, create your own sales presentation with these plain slides. The following slide highlights manufacturing costs assessment KPI dashboard to track and minimize expenses. It includes elements such as return on assets, maintenance costs, unit costs etc.
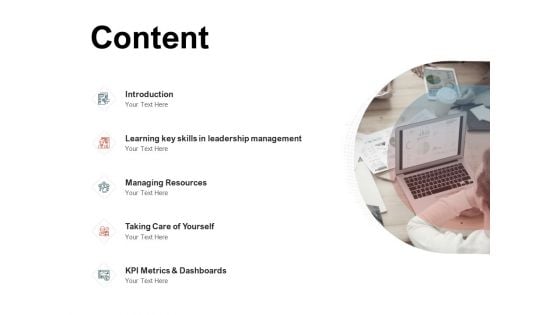
Team Manager Administration Content Microsoft Pdf
This is a team manager administration content microsoft pdf. template with various stages. Focus and dispense information on five stages using this creative set, that comes with editable features. It contains large content boxes to add your information on topics like introduction, managing resources, taking care yourself, kpi metrics and dashboards, learning key skills leadership management. You can also showcase facts, figures, and other relevant content using this PPT layout. Grab it now.
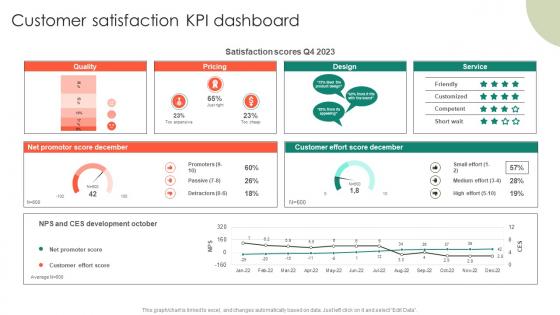
Customer Satisfaction KPI Dashboard Entrepreneurs Roadmap To Effective Demonstration Pdf
If your project calls for a presentation, then Slidegeeks is your go-to partner because we have professionally designed, easy-to-edit templates that are perfect for any presentation. After downloading, you can easily edit Customer Satisfaction KPI Dashboard Entrepreneurs Roadmap To Effective Demonstration Pdf and make the changes accordingly. You can rearrange slides or fill them with different images. Check out all the handy templates Our Customer Satisfaction KPI Dashboard Entrepreneurs Roadmap To Effective Demonstration Pdf are topically designed to provide an attractive backdrop to any subject. Use them to look like a presentation pro.
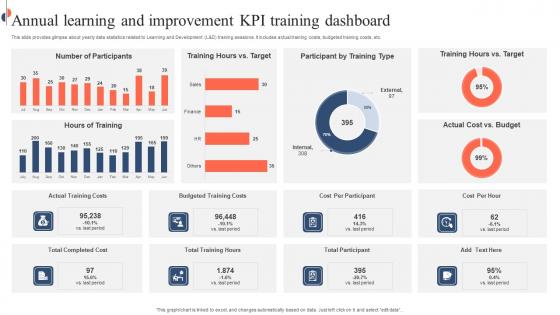
Annual Learning And Improvement KPI Training Dashboard Formats Pdf
This slide provides glimpse about yearly data statistics related to Learning and Development L and D training sessions. It includes actual training costs, budgeted training costs, etc. Showcasing this set of slides titled Annual Learning And Improvement KPI Training Dashboard Formats Pdf. The topics addressed in these templates are Annual Learning, Improvement KPI, Training Dashboard, Budgeted Training Costs. All the content presented in this PPT design is completely editable. Download it and make adjustments in color, background, font etc. as per your unique business setting. This slide provides glimpse about yearly data statistics related to Learning and Development L and D training sessions. It includes actual training costs, budgeted training costs, etc.

Learning And Improvement KPI Activities For Workforce Dashboard Formats Pdf
This slide provides glimpse about statistics related to progress status of training activities for employees. It includes activities, current courses status, etc. Pitch your topic with ease and precision using this Learning And Improvement KPI Activities For Workforce Dashboard Formats Pdf. This layout presents information on Learning And Improvement KPI, Workforce Dashboard, Current Courses Status. It is also available for immediate download and adjustment. So, changes can be made in the color, design, graphics or any other component to create a unique layout. This slide provides glimpse about statistics related to progress status of training activities for employees. It includes activities, current courses status, etc.
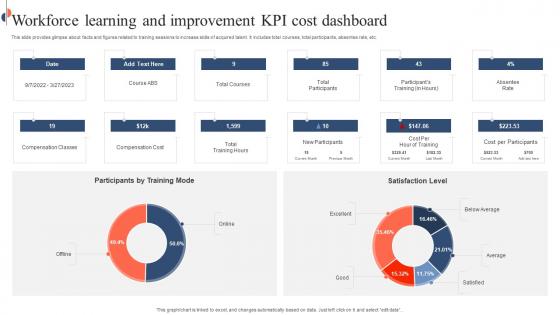
Workforce Learning And Improvement KPI Cost Dashboard Rules Pdf
This slide provides glimpse about facts and figures related to training sessions to increase skills of acquired talent. It includes total courses, total participants, absentee rate, etc. Pitch your topic with ease and precision using this Workforce Learning And Improvement KPI Cost Dashboard Rules Pdf. This layout presents information on Workforce Learning, Improvement KPI, Cost Dashboard. It is also available for immediate download and adjustment. So, changes can be made in the color, design, graphics or any other component to create a unique layout. This slide provides glimpse about facts and figures related to training sessions to increase skills of acquired talent. It includes total courses, total participants, absentee rate, etc.
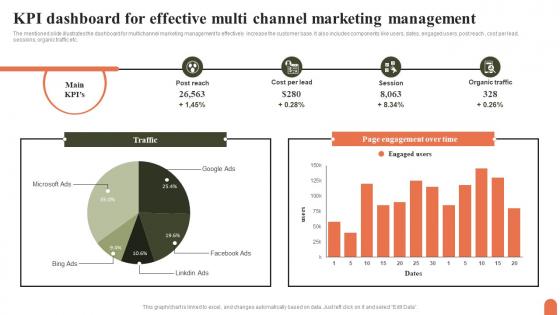
KPI Dashboard For Effective Multi Channel Marketing Management Topics Pdf
The mentioned slide illustrates the dashboard for multichannel marketing management to effectively increase the customer base. It also includes components like users, dates, engaged users, post reach , cost per lead, sessions, organic traffic etc. Showcasing this set of slides titled KPI Dashboard For Effective Multi Channel Marketing Management Topics Pdf. The topics addressed in these templates are KPI Dashboard, Effective Multi Channel, Marketing Management. All the content presented in this PPT design is completely editable. Download it and make adjustments in color, background, font etc. as per your unique business setting. The mentioned slide illustrates the dashboard for multichannel marketing management to effectively increase the customer base. It also includes components like users, dates, engaged users, post reach , cost per lead, sessions, organic traffic etc.
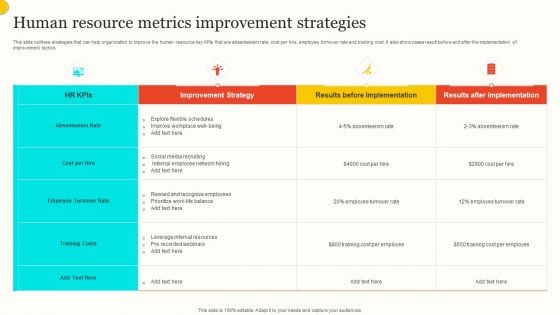
Human Resource Metrics Improvement Strategies Themes PDF
This slide outlines strategies that can help organization to improve the human resource key KPIs that are absenteeism rate, cost per hire, employee turnover rate and training cost. It also showcases result before and after the implementation of improvement tactics. Showcasing this set of slides titled Human Resource Metrics Improvement Strategies Themes PDF. The topics addressed in these templates are Absenteeism Rate, Employee Turnover Rate, Cost Per Hire. All the content presented in this PPT design is completely editable. Download it and make adjustments in color, background, font etc. as per your unique business setting.
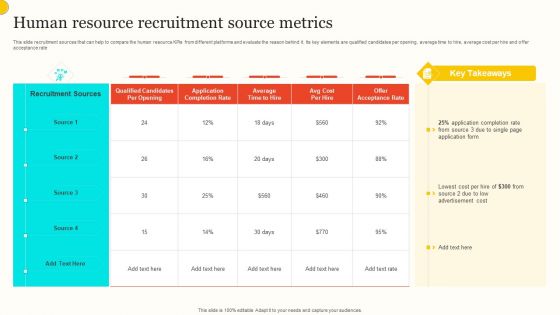
Human Resource Recruitment Source Metrics Portrait PDF
This slide recruitment sources that can help to compare the human resource KPIs from different platforms and evaluate the reason behind it. Its key elements are qualified candidates per opening, average time to hire, average cost per hire and offer acceptance rate. Pitch your topic with ease and precision using this Human Resource Recruitment Source Metrics Portrait PDF. This layout presents information on Application Completion, Lowest Cost Per, Advertisement Cost. It is also available for immediate download and adjustment. So, changes can be made in the color, design, graphics or any other component to create a unique layout.
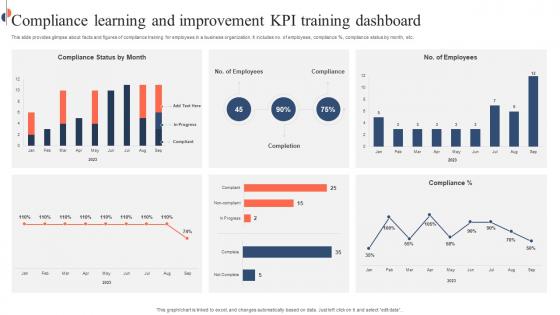
Compliance Learning And Improvement KPI Training Dashboard Sample Pdf
This slide provides glimpse about facts and figures of compliance training for employees in a business organization. It includes no. of employees, compliance percent, compliance status by month, etc. Pitch your topic with ease and precision using this Compliance Learning And Improvement KPI Training Dashboard Sample Pdf. This layout presents information on Compliance Learning, Improvement KPI, Training Dashboard, Compliance Training. It is also available for immediate download and adjustment. So, changes can be made in the color, design, graphics or any other component to create a unique layout. This slide provides glimpse about facts and figures of compliance training for employees in a business organization. It includes no. of employees, compliance percent, compliance status by month, etc.
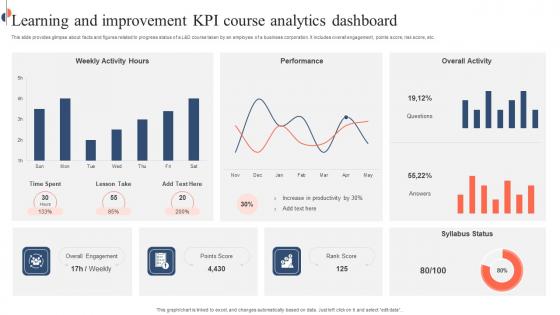
Learning And Improvement KPI Course Analytics Dashboard Inspiration Pdf
This slide provides glimpse about facts and figures related to progress status of a L and D course taken by an employee of a business corporation. It includes overall engagement, points score, risk score, etc. Showcasing this set of slides titled Learning And Improvement KPI Course Analytics Dashboard Inspiration Pdf. The topics addressed in these templates are Learning And Improvement KPI, Course Analytics Dashboard, Risk Score. All the content presented in this PPT design is completely editable. Download it and make adjustments in color, background, font etc. as per your unique business setting. This slide provides glimpse about facts and figures related to progress status of a L and D course taken by an employee of a business corporation. It includes overall engagement, points score, risk score, etc.
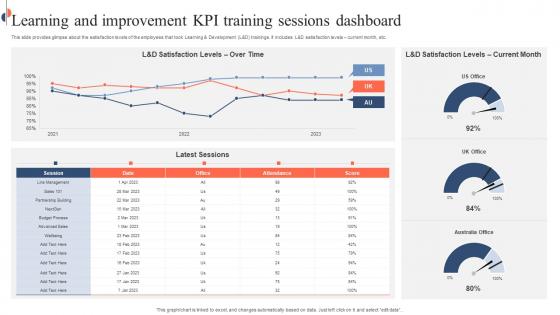
Learning And Improvement KPI Training Sessions Dashboard Mockup Pdf
This slide provides glimpse about the satisfaction levels of the employees that took Learning and Development L and D trainings. It includes L and D satisfaction levels current month, etc. Showcasing this set of slides titled Learning And Improvement KPI Training Sessions Dashboard Mockup Pdf. The topics addressed in these templates are Learning And Improvement KPI, Training Sessions Dashboard, Learning And Development. All the content presented in this PPT design is completely editable. Download it and make adjustments in color, background, font etc. as per your unique business setting. This slide provides glimpse about the satisfaction levels of the employees that took Learning and Development L and D trainings. It includes L and D satisfaction levels current month, etc.
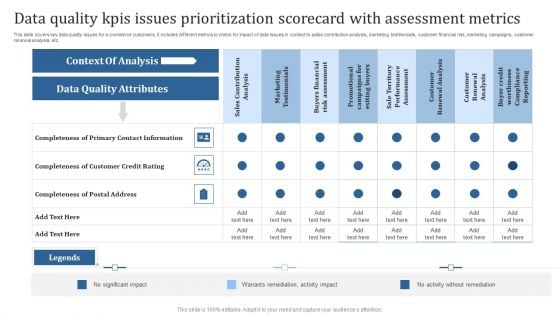
Data Quality Kpis Issues Prioritization Scorecard With Assessment Metrics Ideas PDF
This slide covers key data quality issues for e-commerce customers. It includes different metrics to check for impact of data issues in context to sales contribution analysis, marketing testimonials, customer financial risk, marketing campaigns, customer renewal analysis, etc. Showcasing this set of slides titled Data Quality Kpis Issues Prioritization Scorecard With Assessment Metrics Ideas PDF. The topics addressed in these templates are Context Of Analysis, Data Quality Attributes. All the content presented in this PPT design is completely editable. Download it and make adjustments in color, background, font etc. as per your unique business setting.
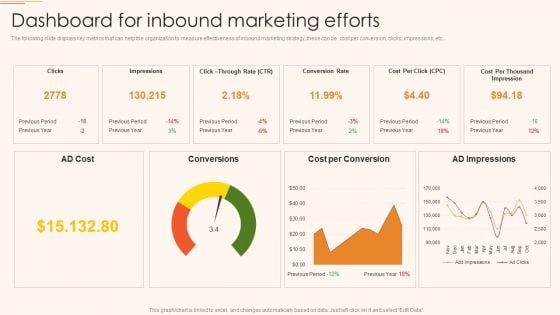
B2C And B2B Business Promotion Strategy Dashboard For Inbound Marketing Efforts Diagrams PDF
The following slide displays key metrics that can help the organization to measure effectiveness of inbound marketing strategy, these can be cost per conversion, clicks, impressions, etc. Deliver an awe inspiring pitch with this creative B2C And B2B Business Promotion Strategy Dashboard For Inbound Marketing Efforts Diagrams PDF bundle. Topics like Conversion Rate, Cost per Conversion, AD Impressions can be discussed with this completely editable template. It is available for immediate download depending on the needs and requirements of the user.
Online Learning And Improvement KPI Training Sessions Dashboard Icon Graphics Pdf
Pitch your topic with ease and precision using this Online Learning And Improvement KPI Training Sessions Dashboard Icon Graphics Pdf. This layout presents information on Online Learning, Improvement KPI, Training Sessions, Dashboard Icon. It is also available for immediate download and adjustment. So, changes can be made in the color, design, graphics or any other component to create a unique layout. Our Online Learning And Improvement KPI Training Sessions Dashboard Icon Graphics Pdf are topically designed to provide an attractive backdrop to any subject. Use them to look like a presentation pro.
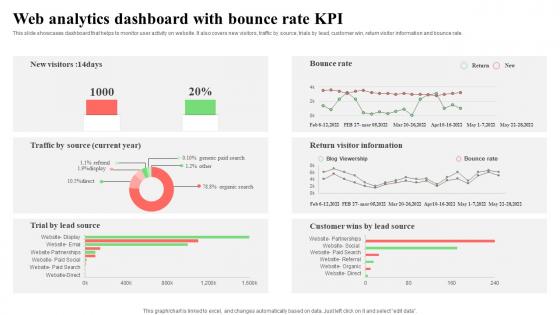
Web Analytics Dashboard With Bounce Rate KPI Elements Pdf
This slide showcases dashboard that helps to monitor user activity on website. It also covers new visitors, traffic by source, trials by lead, customer win, return visitor information and bounce rate. Showcasing this set of slides titled Web Analytics Dashboard With Bounce Rate KPI Elements Pdf. The topics addressed in these templates are Lead, Customer Win, Return Visitor Information. All the content presented in this PPT design is completely editable. Download it and make adjustments in color, background, font etc. as per your unique business setting. This slide showcases dashboard that helps to monitor user activity on website. It also covers new visitors, traffic by source, trials by lead, customer win, return visitor information and bounce rate.


 Continue with Email

 Home
Home


