Average
QA Modification For Product Quality Development And Consumer Satisfaction Average Product Delivery Time Template PDF
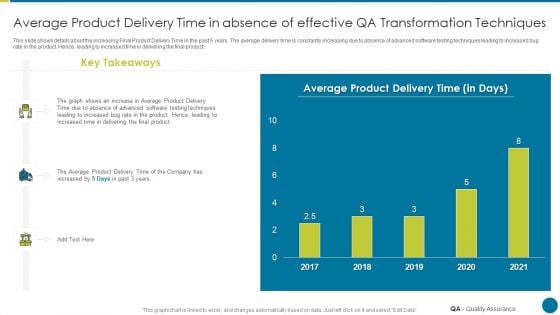
This slide shows details about the increasing Final Product Delivery Time in the past 5 years. The average delivery time is constantly increasing due to absence of advanced software testing techniques leading to increased bug rate in the product. Hence, leading to increased time in delivering the final product. Deliver an awe inspiring pitch with this creative qa modification for product quality development and consumer satisfaction average product delivery time template pdf bundle. Topics like average product delivery time in absence of effective qa transformation techniques can be discussed with this completely editable template. It is available for immediate download depending on the needs and requirements of the user.
QA Modification For Product Quality Development And Consumer Satisfaction Estimated Average Product Delivery Graphics PDF
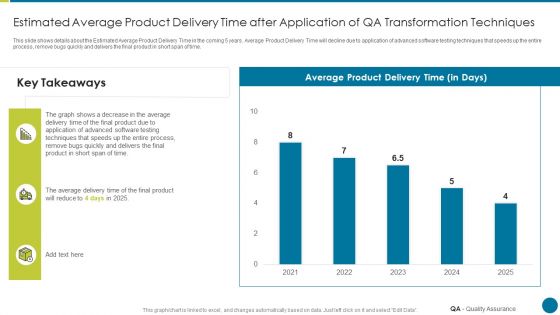
This slide shows details about the Estimated Average Product Delivery Time in the coming 5 years. Average Product Delivery Time will decline due to application of advanced software testing techniques that speeds up the entire process, remove bugs quickly and delivers the final product in short span of time. Deliver and pitch your topic in the best possible manner with this qa modification for product quality development and consumer satisfaction estimated average product delivery graphics pdf. Use them to share invaluable insights on process, techniques and impress your audience. This template can be altered and modified as per your expectations. So, grab it now.

Upskill Training For Employee Performance Improvement Forecasted Employee Efficiency And Average Productivity Mockup PDF
This slide shows the forecasted data of average production per employee in tonne and employee efficiency in percentage for the next five years 2022 to 2026. Deliver and pitch your topic in the best possible manner with this upskill training for employee performance improvement forecasted employee efficiency and average productivity mockup pdf. Use them to share invaluable insights on forecasted employee efficiency and average productivity and impress your audience. This template can be altered and modified as per your expectations. So, grab it now.
Agile Professional Certification PMI IT Stats Highlighting Average Salary Elements PDF
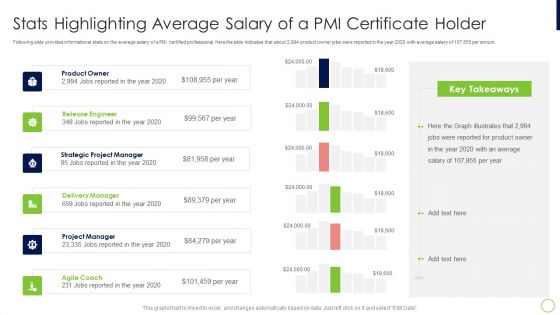
Following slide provides informational stats on the average salary of a PMI certified professional. Here the slide indicates that about 2,994 product owner jobs were reported in the year 2020 with average salary of 107,855 per annum.Deliver an awe inspiring pitch with this creative agile professional certification pmi it stats highlighting average salary elements pdf bundle. Topics like release engineer, strategic project manager, delivery manager can be discussed with this completely editable template. It is available for immediate download depending on the needs and requirements of the user.
Successful Quality Assurance Transition Techniques To Enhance Product Quality Average Product Delivery Time Microsoft PDF
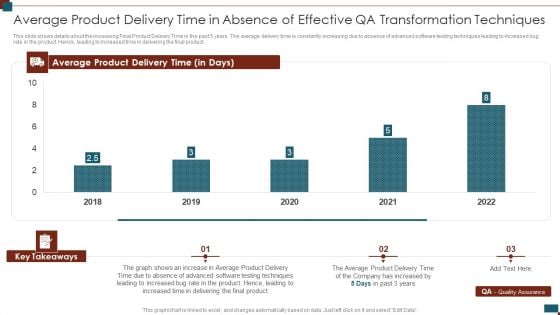
This slide shows details about the increasing Final Product Delivery Time in the past 5 years. The average delivery time is constantly increasing due to absence of advanced software testing techniques leading to increased bug rate in the product. Hence, leading to increased time in delivering the final product. Deliver an awe inspiring pitch with this creative successful quality assurance transition techniques to enhance product quality average product delivery time microsoft pdf bundle. Topics like average product delivery time, key takeaways can be discussed with this completely editable template. It is available for immediate download depending on the needs and requirements of the user.
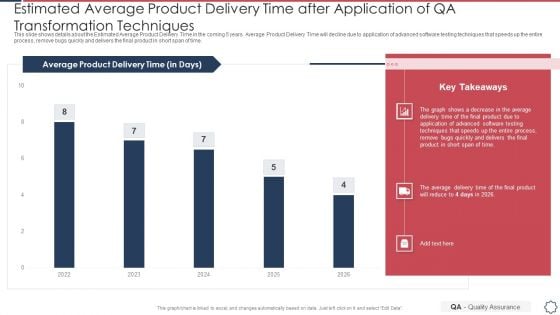
Quality Assurance Transformation Strategies To Improve Business Performance Efficiency Estimated Average Product Delivery Brochure PDF
This slide shows details about the Estimated Average Product Delivery Time in the coming 5 years. Average Product Delivery Time will decline due to application of advanced software testing techniques that speeds up the entire process, remove bugs quickly and delivers the final product in short span of time. Deliver an awe inspiring pitch with this creative quality assurance transformation strategies to improve business performance efficiency estimated average product delivery brochure pdf bundle. Topics like product delivery time can be discussed with this completely editable template. It is available for immediate download depending on the needs and requirements of the user.
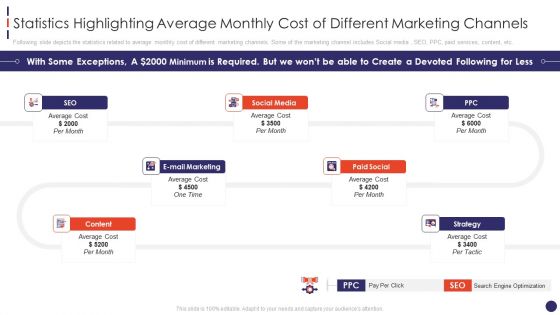
Social Network Firm Pitch Deck Statistics Highlighting Average Monthly Cost Of Demonstration PDF
Following slide depicts the statistics related to average monthly cost of different marketing channels. Some of the marketing channel includes Social media , SEO, PPC, paid services, content, etc.Deliver an awe inspiring pitch with this creative social network firm pitch deck statistics highlighting average monthly cost of demonstration pdf bundle. Topics like statistics highlighting average monthly cost of different marketing channels can be discussed with this completely editable template. It is available for immediate download depending on the needs and requirements of the user.
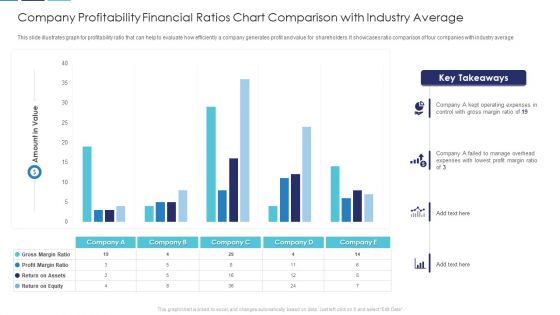
Company Profitability Financial Ratios Chart Comparison With Industry Average Download PDF
This slide illustrates graph for profitability ratio that can help to evaluate how efficiently a company generates profit and value for shareholders. It showcases ratio comparison of four companies with industry average Showcasing this set of slides titled company profitability financial ratios chart comparison with industry average download pdf. The topics addressed in these templates are company profitability financial ratios chart comparison with industry average. All the content presented in this PPT design is completely editable. Download it and make adjustments in color, background, font etc. as per your unique business setting.
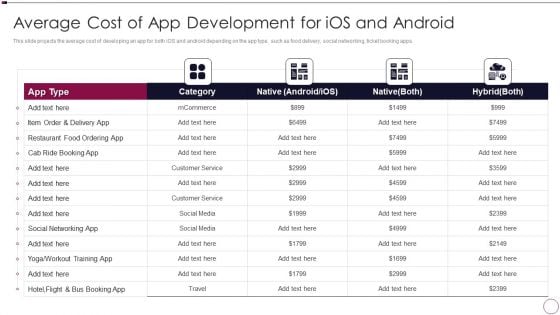
Application Development Average Cost Of App Development For Ios And Android Structure PDF
This slide projects the average cost of developing an app for both iOS and android depending on the app type, such as food delivery, social networking, ticket booking apps.Deliver an awe inspiring pitch with this creative Application Development Average Cost Of App Development For Ios And Android Structure PDF bundle. Topics like Average Cost Of App Development For Ios And Android can be discussed with this completely editable template. It is available for immediate download depending on the needs and requirements of the user.
Deploying Quality Assurance QA Transformation Average Product Delivery Time In Absence Of Effective Icons PDF
This slide shows details about the increasing Final Product Delivery Time in the past 5 years. The average delivery time is constantly increasing due to absence of advanced software testing techniques leading to increased bug rate in the product. Hence, leading to increased time in delivering the final product.Deliver an awe inspiring pitch with this creative Deploying Quality Assurance QA Transformation Average Product Delivery Time In Absence Of Effective Icons PDF bundle. Topics like Average Product Delivery Time In Absence Of Effective QA Transformation Techniques can be discussed with this completely editable template. It is available for immediate download depending on the needs and requirements of the user.
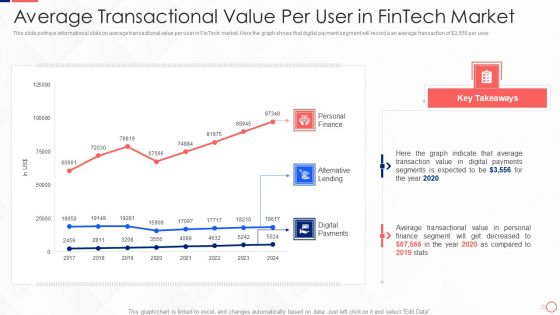
Investing In Tech Innovation Average Transactional Value Per User In Fintech Market Graphics PDF
This slide portrays informational stats on average transactional value per user in FinTech market. Here the graph shows that digital payment segment will record a an average transaction of Dollar 3,556 per user. Deliver and pitch your topic in the best possible manner with this Investing In Tech Innovation Average Transactional Value Per User In Fintech Market Graphics PDF. Use them to share invaluable insights on Personal Finance, Alternative Lending, Digital Payments and impress your audience. This template can be altered and modified as per your expectations. So, grab it now.
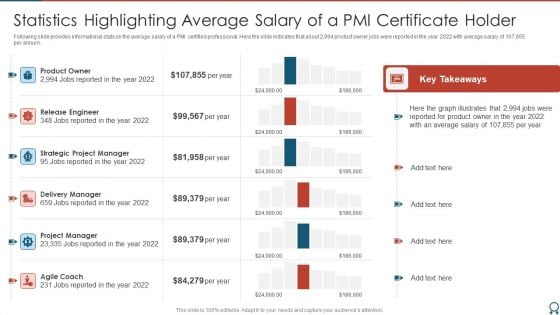
Agile Certified Professional Statistics Highlighting Average Salary Of A PMI Formats PDF
Following slide provides informational stats on the average salary of a PMI certified professional. Here the slide indicates that about 2,994 product owner jobs were reported in the year 2022 with average salary of 107,855 per annum. Deliver an awe inspiring pitch with this creative Agile Certified Professional Statistics Highlighting Average Salary Of A PMI Formats PDF bundle. Topics like Release Engineer, Product Owner, Strategic Project Manager can be discussed with this completely editable template. It is available for immediate download depending on the needs and requirements of the user.
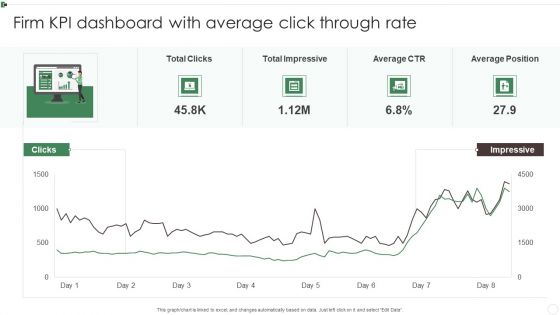
Firm KPI Dashboard With Average Click Through Rate Ppt Inspiration Sample PDF
This graph or chart is linked to excel, and changes automatically based on data. Just left click on it and select Edit Data. Pitch your topic with ease and precision using this Firm KPI Dashboard With Average Click Through Rate Ppt Inspiration Sample PDF. This layout presents information on Total Clicks, Total Impressive, Average CTR, Average Position. It is also available for immediate download and adjustment. So, changes can be made in the color, design, graphics or any other component to create a unique layout.
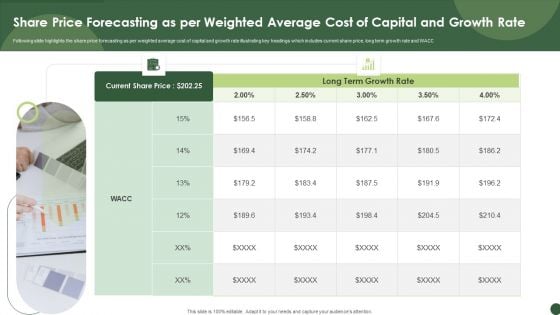
Share Price Forecasting As Per Weighted Average Cost Of Capital And Growth Rate Template PDF
Following slide highlights the share price forecasting as per weighted average cost of capital and growth rate illustrating key headings which includes current share price, long term growth rate and WACC.Showcasing this set of slides titled Share Price Forecasting As Per Weighted Average Cost Of Capital And Growth Rate Template PDF. The topics addressed in these templates are Share Price Forecasting, Per Weighted Average Cost, Capital Growth Rate. All the content presented in this PPT design is completely editable. Download it and make adjustments in color, background, font etc. as per your unique business setting.
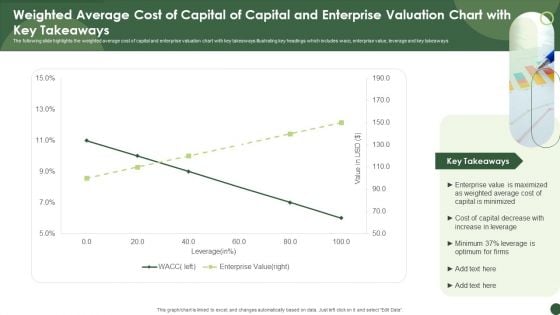
Weighted Average Cost Of Capital Of Capital And Enterprise Valuation Chart With Key Takeaways Inspiration PDF
The following slide highlights the weighted average cost of capital and enterprise valuation chart with key takeaways illustrating key headings which includes wacc, enterprise value, leverage and key takeaways. Pitch your topic with ease and precision using this Weighted Average Cost Of Capital Of Capital And Enterprise Valuation Chart With Key Takeaways Inspiration PDF. This layout presents information on Enterprise Value, Weighted Average, Capital Is Minimized. It is also available for immediate download and adjustment. So, changes can be made in the color, design, graphics or any other component to create a unique layout.
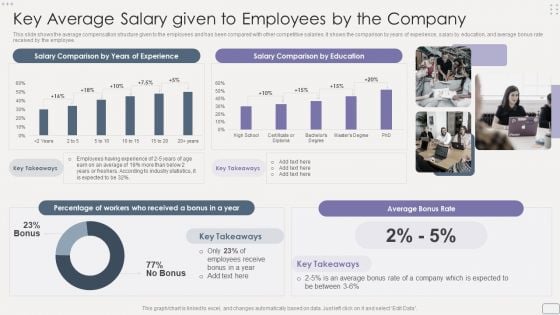
Income Assessment Report Key Average Salary Given To Employees By The Company Download PDF
This slide shows the average compensation structure given to the employees and has been compared with other competitive salaries. It shows the comparison by years of experience, salary by education, and average bonus rate received by the employee.Deliver an awe inspiring pitch with this creative Income Assessment Report Key Average Salary Given To Employees By The Company Download PDF bundle. Topics like Junior Level, Management, Senior Level can be discussed with this completely editable template. It is available for immediate download depending on the needs and requirements of the user.
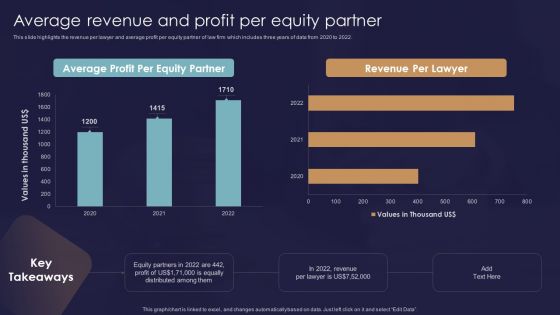
Legal And Law Assistance LLP Business Average Revenue And Profit Per Equity Brochure PDF
This slide highlights the revenue per lawyer and average profit per equity partner of law firm which includes three years of data from 2020 to 2022. Deliver and pitch your topic in the best possible manner with this Legal And Law Assistance LLP Business Average Revenue And Profit Per Equity Brochure PDF. Use them to share invaluable insights on Average Profit, Per Equity Partner, Revenue Per Lawyer and impress your audience. This template can be altered and modified as per your expectations. So, grab it now.
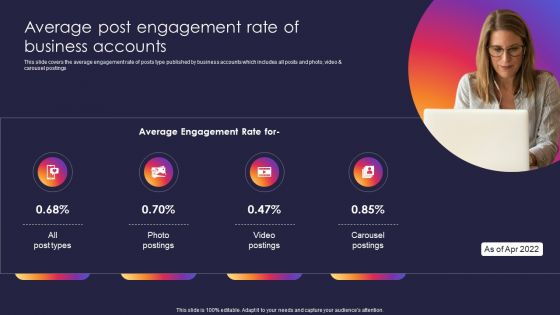
Instagram Company Details Average Post Engagement Rate Of Business Accounts Diagrams PDF
This slide covers the average engagement rate of posts type published by business accounts which includes all posts and photo, video and carousel postings. Presenting Instagram Company Details Average Post Engagement Rate Of Business Accounts Diagrams PDF to provide visual cues and insights. Share and navigate important information on four stages that need your due attention. This template can be used to pitch topics like Average Post Engagement Rate, Business Accounts. In addtion, this PPT design contains high resolution images, graphics, etc, that are easily editable and available for immediate download.
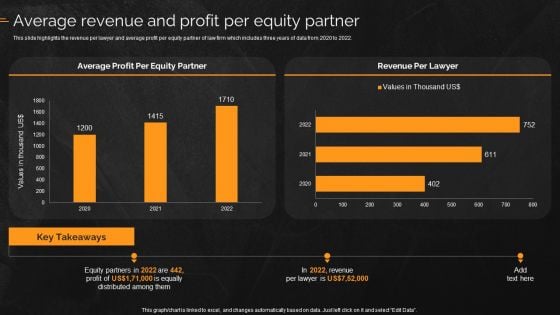
Law And Enforcement Company Profile Average Revenue And Profit Per Equity Partner Summary PDF
This slide highlights the revenue per lawyer and average profit per equity partner of law firm which includes three years of data from 2020 to 2022. Deliver and pitch your topic in the best possible manner with this Law And Enforcement Company Profile Average Revenue And Profit Per Equity Partner Summary PDF. Use them to share invaluable insights on Average Profit, Equity Partner, Revenue Per Lawyer and impress your audience. This template can be altered and modified as per your expectations. So, grab it now.
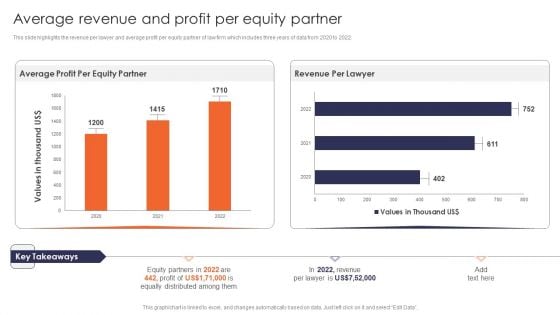
Average Revenue And Profit Per Equity Partner Multinational Legal Firm Company Profile Inspiration PDF
This slide highlights the revenue per lawyer and average profit per equity partner of law firm which includes three years of data from 2020 to 2022. Deliver and pitch your topic in the best possible manner with this Average Revenue And Profit Per Equity Partner Multinational Legal Firm Company Profile Inspiration PDF. Use them to share invaluable insights on Average Profit, Equity Partner, Revenue Per Lawyer and impress your audience. This template can be altered and modified as per your expectations. So, grab it now.
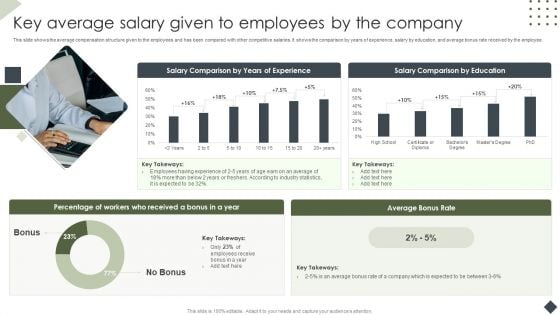
Income Assessment Document Key Average Salary Given To Employees By Introduction PDF
This slide shows the average compensation structure given to the employees and has been compared with other competitive salaries. It shows the comparison by years of experience, salary by education, and average bonus rate received by the employee. Deliver and pitch your topic in the best possible manner with this Income Assessment Document Key Average Salary Given To Employees By Introduction PDF. Use them to share invaluable insights on Salary Comparison, Years Experience, Salary Comparison Education and impress your audience. This template can be altered and modified as per your expectations. So, grab it now.
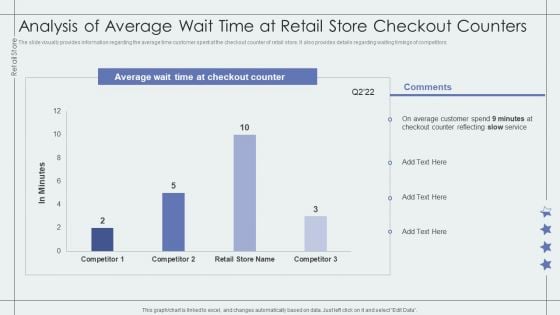
Analysis Of Average Wait Time At Retail Store Checkout Counters Retail Outlet Performance Assessment Mockup PDF
The slide visually provides information regarding the average time customer spent at the checkout counter of retail store. It also provides details regarding waiting timings of competitors.Deliver and pitch your topic in the best possible manner with this Analysis Of Average Wait Time At Retail Store Checkout Counters Retail Outlet Performance Assessment Mockup PDF. Use them to share invaluable insights on Average Customer, Counter Reflecting, Checkout Counter and impress your audience. This template can be altered and modified as per your expectations. So, grab it now.

Staff Succession Planning And Development Determining Employee Headcount Average Elements PDF
Following slide displays informational stats about employee headcount and average tenure. It also includes a graph that shows stats about hiring and turnover rate.Get a simple yet stunning designed Staff Succession Planning And Development Determining Employee Headcount Average Elements PDF. It is the best one to establish the tone in your meetings. It is an excellent way to make your presentations highly effective. So, download this PPT today from Slidegeeks and see the positive impacts. Our easy-to-edit Staff Succession Planning And Development Determining Employee Headcount Average Elements PDF can be your go-to option for all upcoming conferences and meetings. So, what are you waiting for Grab this template today.
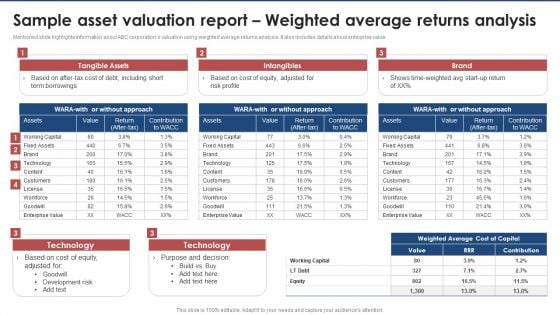
Sample Asset Valuation Report Weighted Average Returns Analysis Brand Value Estimation Guide Rules PDF
Mentioned slide highlights information about ABC corporations valuation using weighted average returns analysis. It also includes details about enterprise value.Get a simple yet stunning designed Sample Asset Valuation Report Weighted Average Returns Analysis Brand Value Estimation Guide Rules PDF. It is the best one to establish the tone in your meetings. It is an excellent way to make your presentations highly effective. So, download this PPT today from Slidegeeks and see the positive impacts. Our easy-to-edit Sample Asset Valuation Report Weighted Average Returns Analysis Brand Value Estimation Guide Rules PDF can be your go-to option for all upcoming conferences and meetings. So, what are you waiting for Grab this template today.
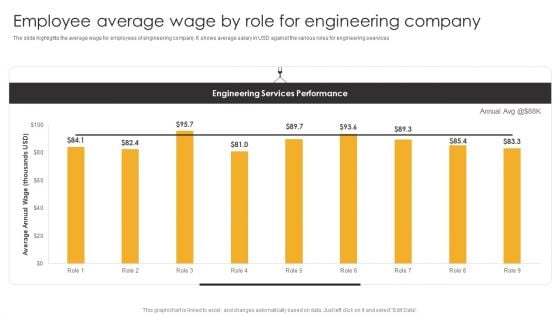
Product Engineering Services Employee Average Wage By Role For Engineering Company Portrait PDF
The slide highlights the average wage for employees of engineering company. It shows average salary in USD against the various roles for engineering seervices. Boost your pitch with our creative Product Engineering Services Employee Average Wage By Role For Engineering Company Portrait PDF. Deliver an awe-inspiring pitch that will mesmerize everyone. Using these presentation templates you will surely catch everyones attention. You can browse the ppts collection on our website. We have researchers who are experts at creating the right content for the templates. So you dont have to invest time in any additional work. Just grab the template now and use them.
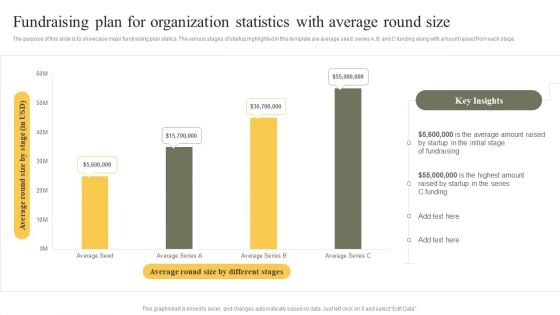
Fundraising Plan For Organization Statistics With Average Round Size Topics PDF
The purpose of this slide is to showcase major fundraising plan statics. The various stages of startup highlighted in this template are average seed, series A, B and C funding along with amount raised from each stage. Pitch your topic with ease and precision using this Fundraising Plan For Organization Statistics With Average Round Size Topics PDF. This layout presents information on Key Insights, Fundraising, Average. It is also available for immediate download and adjustment. So, changes can be made in the color, design, graphics or any other component to create a unique layout.
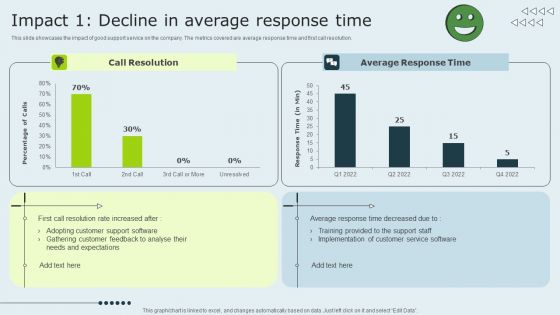
Enhancing Client Experience Impact 1 Decline In Average Response Time Summary PDF
This slide showcases the impact of good support service on the company. The metrics covered are average response time and first call resolution. Get a simple yet stunning designed Enhancing Client Experience Impact 1 Decline In Average Response Time Summary PDF. It is the best one to establish the tone in your meetings. It is an excellent way to make your presentations highly effective. So, download this PPT today from Slidegeeks and see the positive impacts. Our easy-to-edit Enhancing Client Experience Impact 1 Decline In Average Response Time Summary PDF can be your go-to option for all upcoming conferences and meetings. So, what are you waiting for Grab this template today.
Yearly Status Report For Average Customer Effort Score Assessment Ppt Icon Layout Ideas PDF
The slide carries a summary report to assess average CES for predicting the customer behaviour and purchasing habits. Various elements included are average rating, yearly graphs and key takeaways. Pitch your topic with ease and precision using this Yearly Status Report For Average Customer Effort Score Assessment Ppt Icon Layout Ideas PDF. This layout presents information on Good Customer Experience, Easy To Purchase, Processes, Increase Churn Rate. It is also available for immediate download and adjustment. So, changes can be made in the color, design, graphics or any other component to create a unique layout.
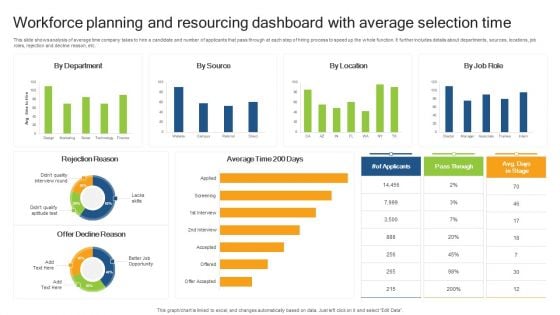
Workforce Planning And Resourcing Dashboard With Average Selection Time Demonstration PDF
This slide shows analysis of average time company takes to hire a candidate and number of applicants that pass through at each step of hiring process to speed up the whole function. It further includes details about departments, sources, locations, job roles, rejection and decline reason, etc. Showcasing this set of slides titled Workforce Planning And Resourcing Dashboard With Average Selection Time Demonstration PDF. The topics addressed in these templates are Rejection Reason, Offer Decline Reason, Average Time. All the content presented in this PPT design is completely editable. Download it and make adjustments in color, background, font etc. as per your unique business setting.
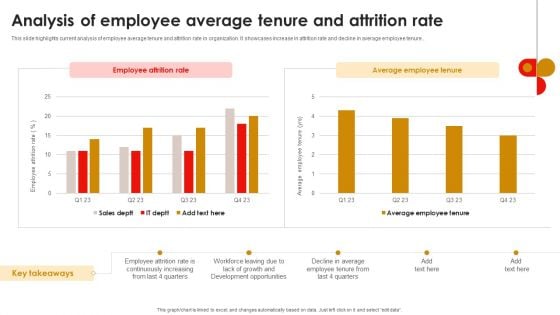
Strategic Talent Development Analysis Of Employee Average Tenure And Attrition Rate Download PDF
This slide highlights current analysis of employee average tenure and attrition rate in organization. It showcases increase in attrition rate and decline in average employee tenure. Slidegeeks is one of the best resources for PowerPoint templates. You can download easily and regulate Strategic Talent Development Analysis Of Employee Average Tenure And Attrition Rate Download PDF for your personal presentations from our wonderful collection. A few clicks is all it takes to discover and get the most relevant and appropriate templates. Use our Templates to add a unique zing and appeal to your presentation and meetings. All the slides are easy to edit and you can use them even for advertisement purposes.
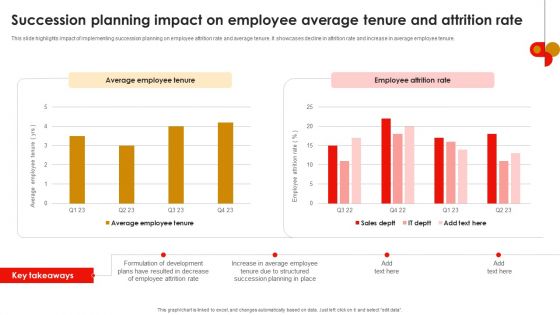
Strategic Talent Development Succession Planning Impact On Employee Average Tenure Ideas PDF
This slide highlights impact of implementing succession planning on employee attrition rate and average tenure. It showcases decline in attrition rate and increase in average employee tenure. Want to ace your presentation in front of a live audience Our Strategic Talent Development Succession Planning Impact On Employee Average Tenure Ideas PDF can help you do that by engaging all the users towards you.. Slidegeeks experts have put their efforts and expertise into creating these impeccable powerpoint presentations so that you can communicate your ideas clearly. Moreover, all the templates are customizable, and easy-to-edit and downloadable. Use these for both personal and commercial use.
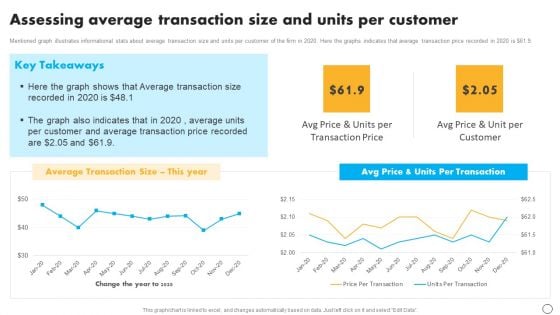
Retail Business Optimization Through Operational Excellence Strategy Assessing Average Transaction Size Microsoft PDF
Mentioned graph illustrates informational stats about average transaction size and units per customer of the firm in 2020. Here the graphs indicates that average transaction price recorded in 2020 is doller 61.9. Want to ace your presentation in front of a live audience Our Retail Business Optimization Through Operational Excellence Strategy Assessing Average Transaction Size Microsoft PDF can help you do that by engaging all the users towards you. Slidegeeks experts have put their efforts and expertise into creating these impeccable powerpoint presentations so that you can communicate your ideas clearly. Moreover, all the templates are customizable, and easy to edit and downloadable. Use these for both personal and commercial use.
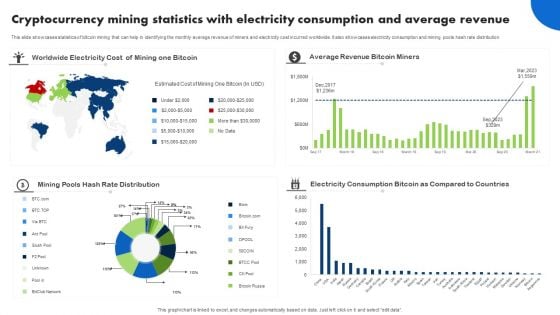
Cryptocurrency Mining Statistics With Electricity Consumption And Average Revenue Clipart PDF
This slide showcases statistics of bitcoin mining that can help in identifying the monthly average revenue of miners and electricity cost incurred worldwide. It also showcases electricity consumption and mining pools hash rate distribution. Showcasing this set of slides titled Cryptocurrency Mining Statistics With Electricity Consumption And Average Revenue Clipart PDF. The topics addressed in these templates are Average Revenue Bitcoin Miners, Mining Pools Hash Rate, Electricity Consumption Bitcoin. All the content presented in this PPT design is completely editable. Download it and make adjustments in color, background, font etc. as per your unique business setting.
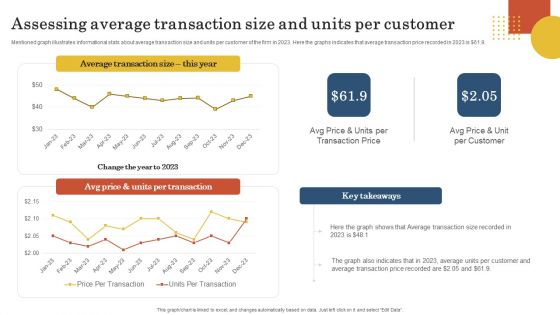
Retail Business Operation Management To Optimize Customer Experience Assessing Average Transaction Size Information PDF
Mentioned graph illustrates informational stats about average transaction size and units per customer of the firm in 2023. Here the graphs indicates that average transaction price recorded in 2023 is 61.9. There are so many reasons you need a Retail Business Operation Management To Optimize Customer Experience Assessing Average Transaction Size Information PDF. The first reason is you cannot spend time making everything from scratch, Thus, Slidegeeks has made presentation templates for you too. You can easily download these templates from our website easily.
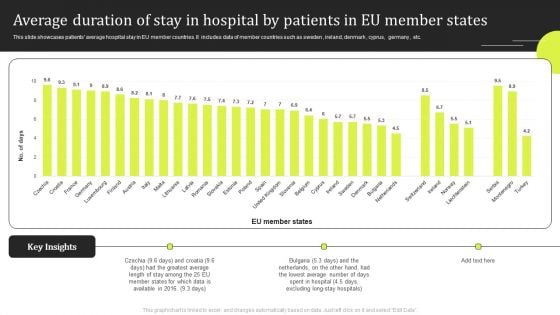
Average Duration Of Stay In Hospital By Patients In EU Member States Slides PDF
This slide showcases patients average hospital stay in EU member countries. It includes data of member countries such as sweden , ireland, denmark , cyprus, germany , etc. Pitch your topic with ease and precision using this Average Duration Of Stay In Hospital By Patients In EU Member States Slides PDF. This layout presents information on Greatest Average, Key Insights. It is also available for immediate download and adjustment. So, changes can be made in the color, design, graphics or any other component to create a unique layout.
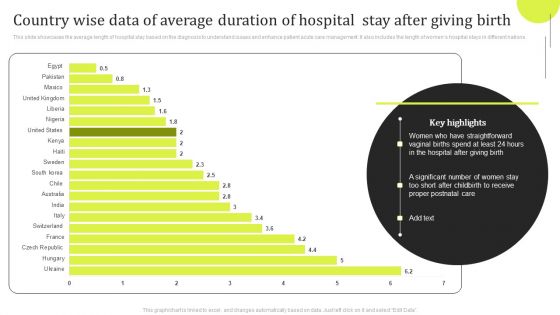
Country Wise Data Of Average Duration Of Hospital Stay After Giving Birth Designs PDF
This slide showcases the average length of hospital stay based on the diagnosis to understand issues and enhance patient acute care management. It also includes the length of womens hospital stays in different nations. Pitch your topic with ease and precision using this Country Wise Data Of Average Duration Of Hospital Stay After Giving Birth Designs PDF. This layout presents information on Country Wise Data, Average Duration. It is also available for immediate download and adjustment. So, changes can be made in the color, design, graphics or any other component to create a unique layout.
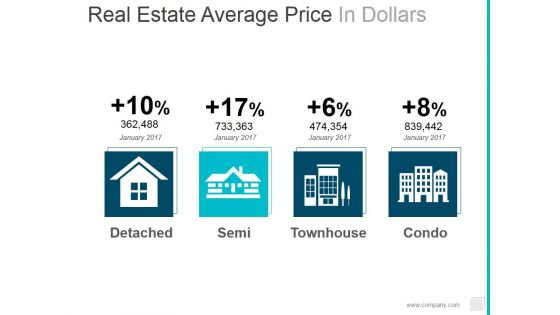
Real Estate Average Price In Dollars Ppt PowerPoint Presentation Infographics Templates
This is a real estate average price in dollars ppt powerpoint presentation infographics templates. This is a four stage process. The stages in this process are detached, semi, townhouse, condo.
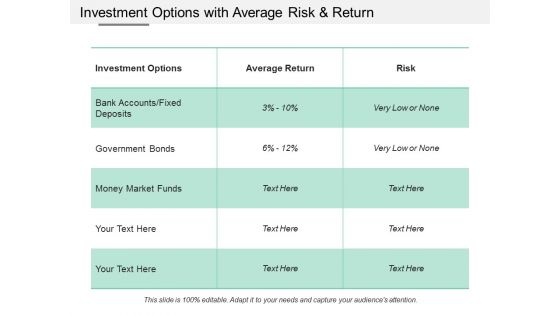
Investment Options With Average Risk And Return Ppt PowerPoint Presentation File Clipart Images
This is a investment options with average risk and return ppt powerpoint presentation file clipart images. This is a three stage process. The stages in this process are mutual funds, funds to buy, investment slide.
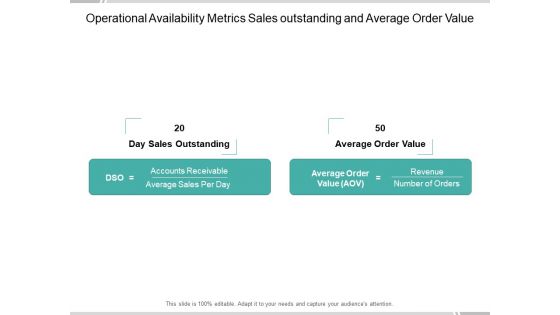
Operational Availability Metrics Sales Outstanding And Average Order Value Ppt Powerpoint Presentation Infographic Template Introduction
This is a operational availability metrics sales outstanding and average order value ppt powerpoint presentation infographic template introduction. This is a two stage process. The stages in this process are availability kpi, availability dashboard, availability metrics.
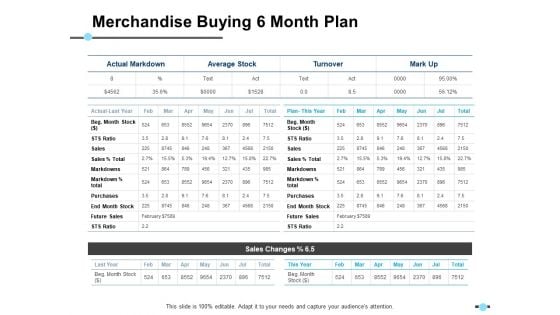
Merchandise Buying 6 Month Plan Average Stock Ppt PowerPoint Presentation Gallery Example File
This is a merchandise buying 6 month plan average stock ppt powerpoint presentation gallery example file. This is a four stage process. The stages in this process are business, management, strategy, analysis, marketing.

Retail KPI Metrics Showing Average Purchase Value Ppt PowerPoint Presentation Outline Example
This is a retail kpi metrics showing average purchase value ppt powerpoint presentation outline example. This is a four stage process. The stages in this process are online sales, customers satisfied, retail, planning, marketing.
Retail KPI Metrics Showing Average Sales Ppt PowerPoint Presentation Show Icon
This is a retail kpi metrics showing average sales ppt powerpoint presentation show icon. This is a four stage process. The stages in this process are customer retention, retail, planning, strategy, business.

Retail Kpi Metrics Showing Average Purchase Value And Online Sales Ppt PowerPoint Presentation Styles Background Image
This is a retail kpi metrics showing average purchase value and online sales ppt powerpoint presentation styles background image. This is a four stage process. The stages in this process are marketing, business, management, planning, strategy.

Retail Kpi Metrics Showing Average Sales And Sell Through Rates Ppt PowerPoint Presentation Ideas Influencers
This is a retail kpi metrics showing average sales and sell through rates ppt powerpoint presentation ideas influencers. This is a four stage process. The stages in this process are marketing, business, management, planning, strategy.
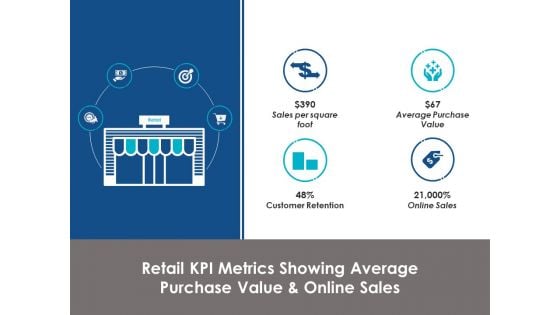
Retail Kpi Metrics Showing Average Purchase Value And Online Sales Ppt Powerpoint Presentation File Master Slide
This is a retail kpi metrics showing average purchase value and online sales ppt powerpoint presentation file master slide. This is a four stage process. The stages in this process are marketing, business, management, planning, strategy.
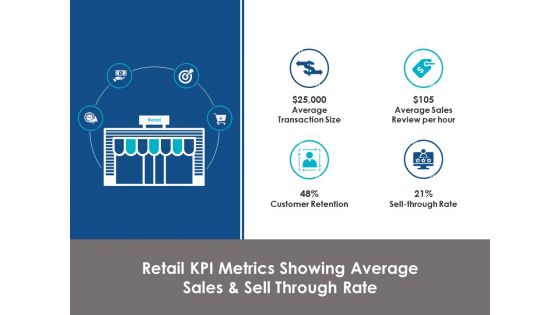
Retail Kpi Metrics Showing Average Sales And Sell Through Rate Ppt Powerpoint Presentation Styles Designs
This is a retail kpi metrics showing average sales and sell through rate ppt powerpoint presentation styles designs. This is a four stage process. The stages in this process are marketing, business, management, planning, strategy.
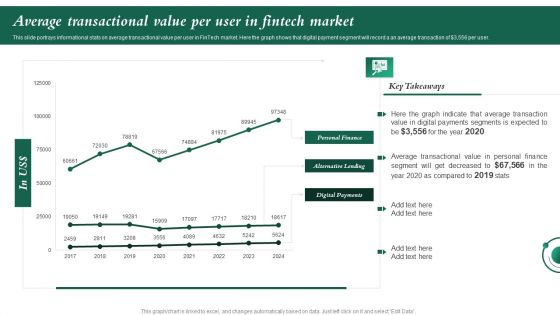
Average Transactional Value Per User In Fintech Market Investment In Latest Technology To Ensure Guidelines PDF
This slide portrays informational stats on average transactional value per user in FinTech market. Here the graph shows that digital payment segment will record a an average transaction of dollar3,precentprecent6 per user.Here you can discover an assortment of the finest PowerPoint and Google Slides templates. With these templates, you can create presentations for a variety of purposes while simultaneously providing your audience with an eye-catching visual experience. Download Average Transactional Value Per User In Fintech Market Investment In Latest Technology To Ensure Guidelines PDF to deliver an impeccable presentation. These templates will make your job of preparing presentations much quicker, yet still, maintain a high level of quality. Slidegeeks has experienced researchers who prepare these templates and write high-quality content for you. Later on, you can personalize the content by editing the Average Transactional Value Per User In Fintech Market Investment In Latest Technology To Ensure Guidelines PDF.
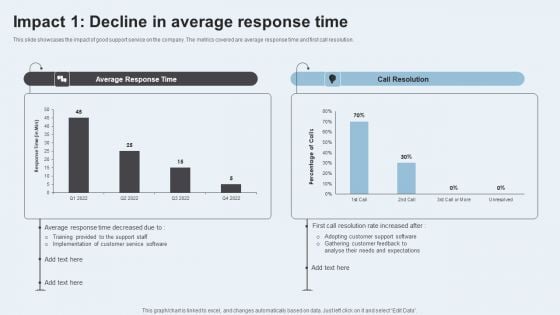
Action Plan To Enhance Client Service Impact 1 Decline In Average Response Time Rules PDF
This slide showcases the impact of good support service on the company. The metrics covered are average response time and first call resolution. Presenting this PowerPoint presentation, titled Action Plan To Enhance Client Service Impact 1 Decline In Average Response Time Rules PDF, with topics curated by our researchers after extensive research. This editable presentation is available for immediate download and provides attractive features when used. Download now and captivate your audience. Presenting this Action Plan To Enhance Client Service Impact 1 Decline In Average Response Time Rules PDF. Our researchers have carefully researched and created these slides with all aspects taken into consideration. This is a completely customizable Action Plan To Enhance Client Service Impact 1 Decline In Average Response Time Rules PDF that is available for immediate downloading. Download now and make an impact on your audience. Highlight the attractive features available with our PPTs.
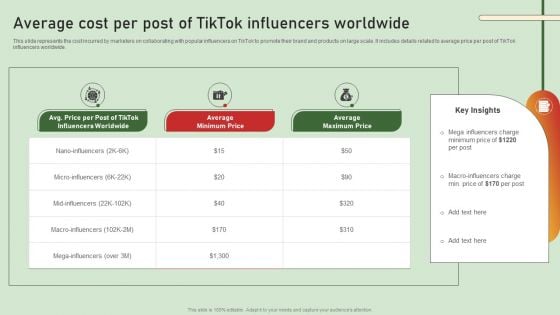
Comprehensive Influencer Promotional Guide Average Cost Per Post Of Tiktok Influencers Worldwide Topics PDF
This slide represents the cost incurred by marketers on collaborating with popular influencers on TikTok to promote their brand and products on large scale. It includes details related to average price per post of TikTok influencers worldwide. Presenting this PowerPoint presentation, titled Comprehensive Influencer Promotional Guide Average Cost Per Post Of Tiktok Influencers Worldwide Topics PDF, with topics curated by our researchers after extensive research. This editable presentation is available for immediate download and provides attractive features when used. Download now and captivate your audience. Presenting this Comprehensive Influencer Promotional Guide Average Cost Per Post Of Tiktok Influencers Worldwide Topics PDF. Our researchers have carefully researched and created these slides with all aspects taken into consideration. This is a completely customizable Comprehensive Influencer Promotional Guide Average Cost Per Post Of Tiktok Influencers Worldwide Topics PDF that is available for immediate downloading. Download now and make an impact on your audience. Highlight the attractive features available with our PPTs.
AOV Average Order Value Ppt PowerPoint Presentation Slides Graphics Pictures Cpb
Presenting this set of slides with name aov average order value ppt powerpoint presentation slides graphics pictures cpb. This is an editable Powerpoint four stages graphic that deals with topics like aov average order value to help convey your message better graphically. This product is a premium product available for immediate download and is 100 percent editable in Powerpoint. Download this now and use it in your presentations to impress your audience.
Short Run Average Cost Curve Ppt PowerPoint Presentation Portfolio Guide Cpb
Presenting this set of slides with name short run average cost curve ppt powerpoint presentation portfolio guide cpb. This is an editable Powerpoint three stages graphic that deals with topics like short run average cost curve to help convey your message better graphically. This product is a premium product available for immediate download and is 100 percent editable in Powerpoint. Download this now and use it in your presentations to impress your audience.
Average Cost Customer Acquisition Ppt PowerPoint Presentation Slides Example Introduction Cpb
Presenting this set of slides with name average cost customer acquisition ppt powerpoint presentation slides example introduction cpb. This is an editable Powerpoint five stages graphic that deals with topics like average cost customer acquisition to help convey your message better graphically. This product is a premium product available for immediate download and is 100 percent editable in Powerpoint. Download this now and use it in your presentations to impress your audience.
Average Cost Open Business Ppt PowerPoint Presentation Slides Background Image Cpb Pdf
Presenting this set of slides with name average cost open business ppt powerpoint presentation slides background image cpb pdf. This is an editable Powerpoint three stages graphic that deals with topics like average cost open business to help convey your message better graphically. This product is a premium product available for immediate download and is 100 percent editable in Powerpoint. Download this now and use it in your presentations to impress your audience.
Average Cost Per Click Display Advertising Ppt PowerPoint Presentation Portfolio Layout Ideas Cpb Pdf
Presenting this set of slides with name average cost per click display advertising ppt powerpoint presentation portfolio layout ideas cpb pdf. This is an editable Powerpoint three stages graphic that deals with topics like average cost per click display advertising to help convey your message better graphically. This product is a premium product available for immediate download and is 100 percent editable in Powerpoint. Download this now and use it in your presentations to impress your audience.
Average Small Business Growth Rate New Market Ppt PowerPoint Presentation Styles Show Cpb Pdf
Presenting this set of slides with name average small business growth rate new market ppt powerpoint presentation styles show cpb pdf. This is an editable Powerpoint five stages graphic that deals with topics like average small business growth rate new market to help convey your message better graphically. This product is a premium product available for immediate download and is 100 percent editable in Powerpoint. Download this now and use it in your presentations to impress your audience.
Average Revenue Per User Ppt PowerPoint Presentation Styles Ideas Cpb Pdf
Presenting this set of slides with name average revenue per user ppt powerpoint presentation styles ideas cpb pdf. This is an editable Powerpoint six stages graphic that deals with topics like average revenue per user to help convey your message better graphically. This product is a premium product available for immediate download and is 100 percent editable in Powerpoint. Download this now and use it in your presentations to impress your audience.
Ending Inventory Average Cost Method Ppt PowerPoint Presentation Professional Elements Cpb Pdf
Presenting this set of slides with name ending inventory average cost method ppt powerpoint presentation professional elements cpb pdf. This is an editable Powerpoint two stages graphic that deals with topics like ending inventory average cost method to help convey your message better graphically. This product is a premium product available for immediate download and is 100 percent editable in Powerpoint. Download this now and use it in your presentations to impress your audience.
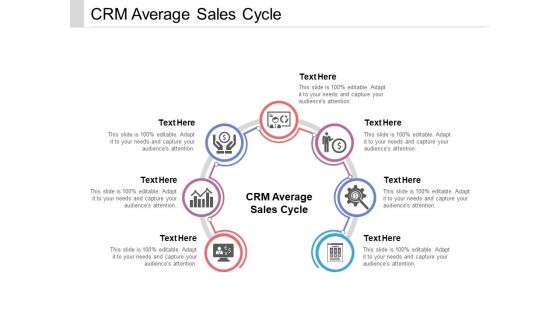
CRM Average Sales Cycle Ppt PowerPoint Presentation Infographic Template Styles Cpb Pdf
Presenting this set of slides with name crm average sales cycle ppt powerpoint presentation infographic template styles cpb pdf. This is an editable Powerpoint seven stages graphic that deals with topics like crm average sales cycle to help convey your message better graphically. This product is a premium product available for immediate download and is 100 percent editable in Powerpoint. Download this now and use it in your presentations to impress your audience.
Average App Marketing Budget Ppt PowerPoint Presentation Professional Summary Cpb Pdf
Presenting this set of slides with name average app marketing budget ppt powerpoint presentation professional summary cpb pdf. This is an editable Powerpoint three stages graphic that deals with topics like average app marketing budget to help convey your message better graphically. This product is a premium product available for immediate download and is 100 percent editable in Powerpoint. Download this now and use it in your presentations to impress your audience.
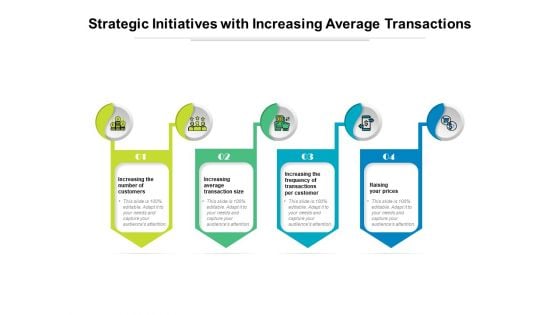
Strategic Initiatives With Increasing Average Transactions Ppt PowerPoint Presentation Gallery Show PDF
Persuade your audience using this strategic initiatives with increasing average transactions ppt powerpoint presentation gallery show pdf. This PPT design covers four stages, thus making it a great tool to use. It also caters to a variety of topics including increasing the number of customers, increasing average transaction size, increasing the frequency of transactions per customer, raising your prices. Download this PPT design now to present a convincing pitch that not only emphasizes the topic but also showcases your presentation skills.

 Home
Home