Average
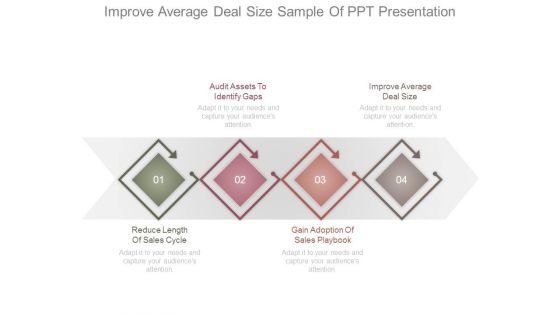
Improve Average Deal Size Sample Of Ppt Presentation
This is a improve average deal size sample of ppt presentation. This is a four stage process. The stages in this process are audit assets to identify gaps, improve average deal size, reduce length of sales cycle, gain adoption of sales playbook.
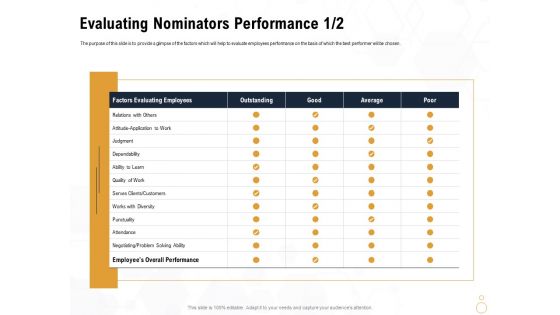
Star Employee Evaluating Nominators Performance Average Portrait PDF
Presenting this set of slides with name star employee evaluating nominators performance average portrait pdf. The topics discussed in these slides are factors evaluating employees, outstanding, good, average, poor. This is a completely editable PowerPoint presentation and is available for immediate download. Download now and impress your audience.
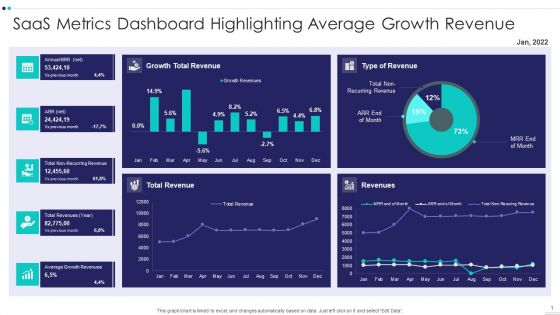
Saas Metrics Dashboard Highlighting Average Growth Revenue Diagrams PDF
Showcasing this set of slides titled Saas Metrics Dashboard Highlighting Average Growth Revenue Diagrams PDF The topics addressed in these templates are Saas Metrics Dashboard Highlighting Average Growth Revenue All the content presented in this PPT design is completely editable. Download it and make adjustments in color, background, font etc. as per your unique business setting.
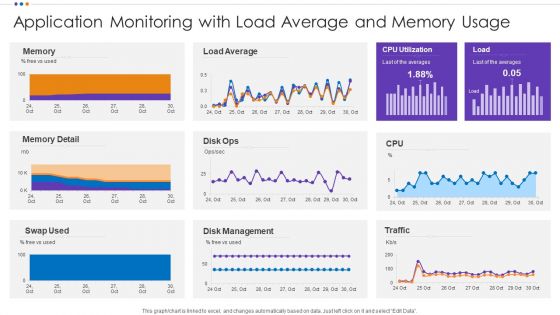
Application Monitoring With Load Average And Memory Usage Topics PDF
Showcasing this set of slides titled Application Monitoring With Load Average And Memory Usage Topics PDF. The topics addressed in these templates are Application Monitoring With Load Average And Memory Usage. All the content presented in this PPT design is completely editable. Download it and make adjustments in color, background, font etc. as per your unique business setting.
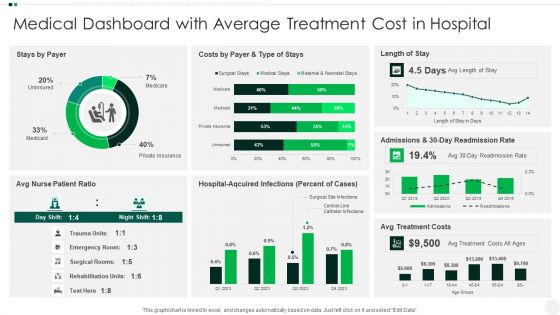
Medical Dashboard With Average Treatment Cost In Hospital Summary PDF
Showcasing this set of slides titled Medical Dashboard With Average Treatment Cost In Hospital Summary PDF. The topics addressed in these templates are Medical Dashboard With Average Treatment Cost In Hospital. All the content presented in this PPT design is completely editable. Download it and make adjustments in color, background, font etc. as per your unique business setting.

Employee Production Scorecard With Average Earning Wage Rate Diagrams PDF
Deliver an awe inspiring pitch with this creative Employee Production Scorecard With Average Earning Wage Rate Diagrams PDF bundle. Topics like Employee Production Scorecard, Average Earning, Wage Rate can be discussed with this completely editable template. It is available for immediate download depending on the needs and requirements of the user.
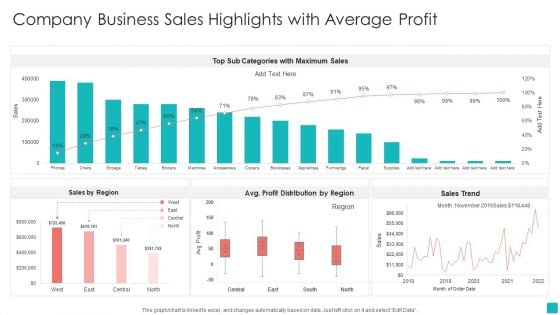
Company Business Sales Highlights With Average Profit Rules PDF
Showcasing this set of slides titled Company Business Sales Highlights With Average Profit Rules PDF. The topics addressed in these templates are Company Business Sales Highlights, Average Profit. All the content presented in this PPT design is completely editable. Download it and make adjustments in color, background, font etc. as per your unique business setting.
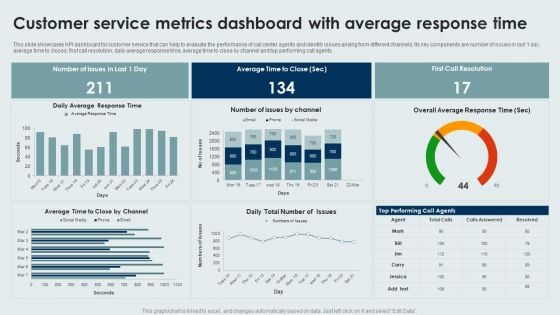
Customer Service Metrics Dashboard With Average Response Time Formats PDF
This slide showcases KPI dashboard for customer service that can help to evaluate the performance of call center agents and identify issues arising from different channels. Its key components are number of issues in last 1 day, average time to closes, first call resolution, daily average response time, average time to close by channel and top performing call agents. Pitch your topic with ease and precision using this Customer Service Metrics Dashboard With Average Response Time Formats PDF. This layout presents information on Customer Service, Metrics Dashboard, Average Response Time. It is also available for immediate download and adjustment. So, changes can be made in the color, design, graphics or any other component to create a unique layout.
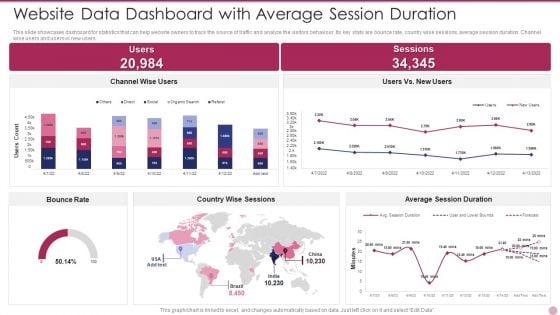
Website Data Dashboard With Average Session Duration Ideas PDF
This slide showcases dashboard for statistics that can help website owners to track the source of traffic and analyze the visitors behaviour. Its key stats are bounce rate, country wise sessions, average session duration. Channel wise users and users vs new users. Pitch your topic with ease and precision using this Website Data Dashboard With Average Session Duration Ideas PDF. This layout presents information on Website Data Dashboard With Average Session Duration. It is also available for immediate download and adjustment. So, changes can be made in the color, design, graphics or any other component to create a unique layout.
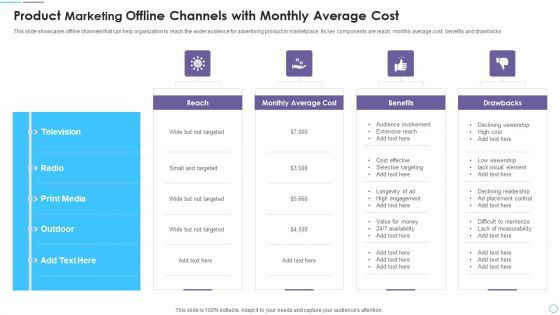
Product Marketing Offline Channels With Monthly Average Cost Slides PDF
This slide showcases offline channels that can help organization to reach the wider audience for advertising product in marketplace. Its key components are reach, monthly average cost, benefits and drawbacks. Pitch your topic with ease and precision using this Product Marketing Offline Channels With Monthly Average Cost Slides PDF. This layout presents information on Reach, Monthly Average Cost, Benefits. It is also available for immediate download and adjustment. So, changes can be made in the color, design, graphics or any other component to create a unique layout.
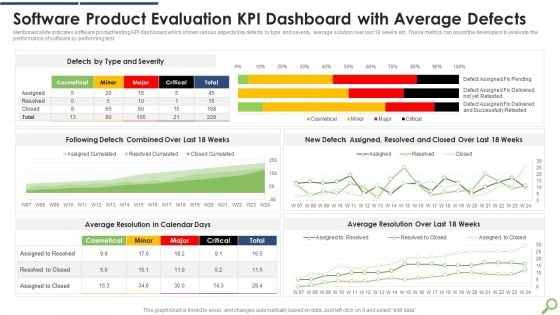
Software Product Evaluation KPI Dashboard With Average Defects Infographics PDF
Mentioned slide indicates software product testing KPI dashboard which shows various aspects like defects by type and severity, average solution over last 18 weeks etc. These metrics can assist the developers to evaluate the performance of software by performing test.Showcasing this set of slides titled Software Product Evaluation KPI Dashboard With Average Defects Infographics PDF The topics addressed in these templates are Software Product, Evaluation Dashboard, Average Defects All the content presented in this PPT design is completely editable. Download it and make adjustments in color, background, font etc. as per your unique business setting.

Project Metrics Dashboard With Average Margin Sample PDF
This slide focuses on project management dashboard which covers number of active projects, average margin, revenues, costs, tasks status, resources with planned and actual efforts, available hours, tasks assignments with project deadlines, client, etc. Pitch your topic with ease and precision using this Project Metrics Dashboard With Average Margin Sample PDF. This layout presents information on Average Margin, Revenue, Cost. It is also available for immediate download and adjustment. So, changes can be made in the color, design, graphics or any other component to create a unique layout.
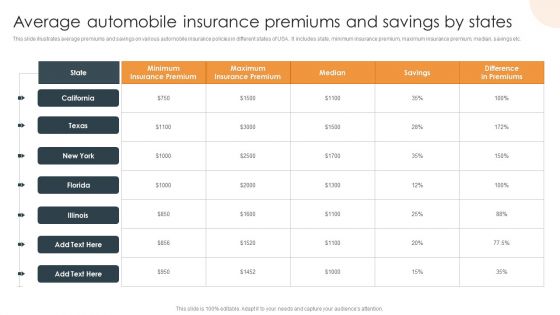
Average Automobile Insurance Premiums And Savings By States Rules PDF
This slide illustrates average premiums and savings on various automobile insurance policies in different states of USA. It includes state, minimum insurance premium, maximum insurance premium, median, savings etc. Showcasing this set of slides titled Average Automobile Insurance Premiums And Savings By States Rules PDF. The topics addressed in these templates are Average Automobile, Insurance Premiums, Savings By States. All the content presented in this PPT design is completely editable. Download it and make adjustments in color, background, font etc. as per your unique business setting.
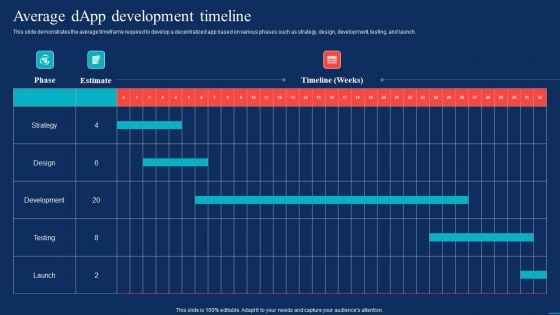
Decentralized Applications Average Dapp Development Timeline Graphics PDF
This slide demonstrates the average timeframe required to develop a decentralized app based on various phases such as strategy, design, development, testing, and launch. Create an editable Decentralized Applications Average Dapp Development Timeline Graphics PDF that communicates your idea and engages your audience. Whether you are presenting a business or an educational presentation, pre designed presentation templates help save time. Decentralized Applications Average Dapp Development Timeline Graphics PDF is highly customizable and very easy to edit, covering many different styles from creative to business presentations. Slidegeeks has creative team members who have crafted amazing templates. So, go and get them without any delay.
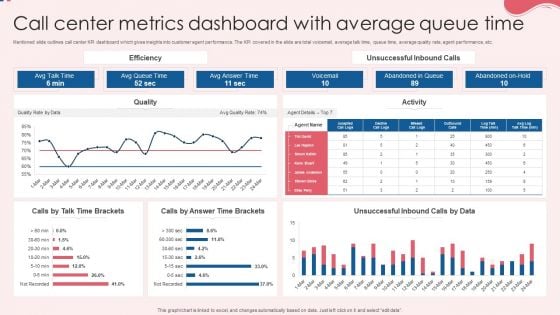
Call Center Metrics Dashboard With Average Queue Time Topics PDF
Mentioned slide outlines call center KPI dashboard which gives insights into customer agent performance. The KPI covered in the slide are total voicemail, average talk time, queue time, average quality rate, agent performance, etc. Pitch your topic with ease and precision using this Call Center Metrics Dashboard With Average Queue Time Topics PDF. This layout presents information on Efficiency, Quality, Activity. It is also available for immediate download and adjustment. So, changes can be made in the color, design, graphics or any other component to create a unique layout.
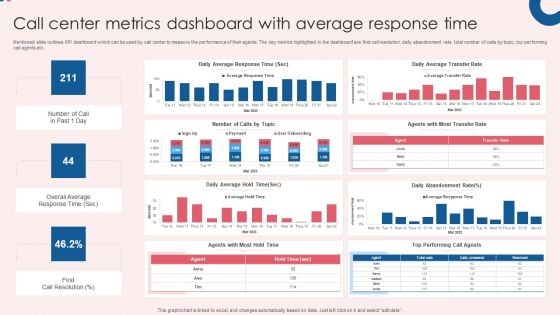
Call Center Metrics Dashboard With Average Response Time Inspiration PDF
Mentioned slide outlines KPI dashboard which can be used by call center to measure the performance of their agents. The key metrics highlighted in the dashboard are first call resolution, daily abandonment rate, total number of calls by topic, top performing call agents etc. Showcasing this set of slides titled Call Center Metrics Dashboard With Average Response Time Inspiration PDF. The topics addressed in these templates are Efficiency, Quality, Activity, Daily Average Response, Daily Average Transfer. All the content presented in this PPT design is completely editable. Download it and make adjustments in color, background, font etc. as per your unique business setting.
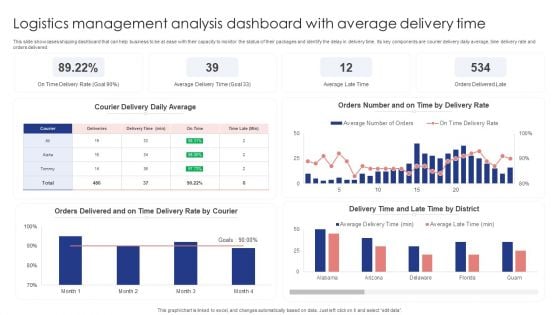
Logistics Management Analysis Dashboard With Average Delivery Time Themes PDF
This slide showcases shipping dashboard that can help business to be at ease with their capacity to monitor the status of their packages and identify the delay in delivery time. Its key components are courier delivery daily average, time delivery rate and orders delivered. Showcasing this set of slides titled Logistics Management Analysis Dashboard With Average Delivery Time Themes PDF. The topics addressed in these templates are Courier Delivery Daily Average, Delivery Rate, Orders Delivered. All the content presented in this PPT design is completely editable. Download it and make adjustments in color, background, font etc. as per your unique business setting.
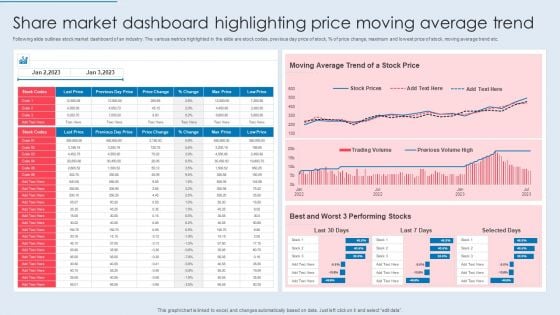
Share Market Dashboard Highlighting Price Moving Average Trend Themes PDF
Following slide outlines stock market dashboard of an industry. The various metrics highlighted in the slide are stock codes, previous day price of stock, percent of price change, maximum and lowest price of stock, moving average trend etc. Pitch your topic with ease and precision using this Share Market Dashboard Highlighting Price Moving Average Trend Themes PDF. This layout presents information on Moving Average, Stock Price, Performing Stocks. It is also available for immediate download and adjustment. So, changes can be made in the color, design, graphics or any other component to create a unique layout.
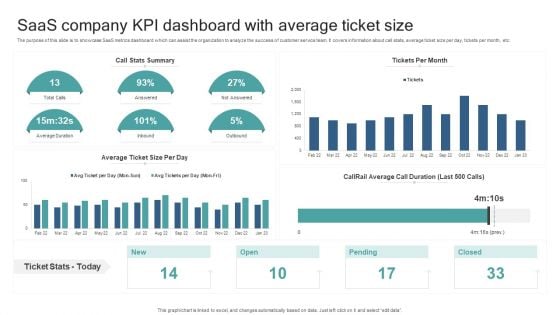
Saas Company KPI Dashboard With Average Ticket Size Sample PDF
The purpose of this slide is to showcase SaaS metrics dashboard which can assist the organization to analyze the success of customer service team. It covers information about call stats, average ticket size per day, tickets per month, etc. Showcasing this set of slides titled Saas Company KPI Dashboard With Average Ticket Size Sample PDF. The topics addressed in these templates are Saas Company Kpi, Dashboard, Average Ticket Size. All the content presented in this PPT design is completely editable. Download it and make adjustments in color, background, font etc. as per your unique business setting.

Average Cost Of Employee Turnover According To Position Topics PDF
This slide showcase a survey report of multi-national companies about employee turnover cost or the average cost of replacing a candidate from an organization. It includes positions such as entry level candidate, production officer, clerical staff, skilled hourly paid worker etc. Pitch your topic with ease and precision using this Average Cost Of Employee Turnover According To Position Topics PDF. This layout presents information on Average Cost, Employee Turnover, According To Position. It is also available for immediate download and adjustment. So, changes can be made in the color, design, graphics or any other component to create a unique layout.
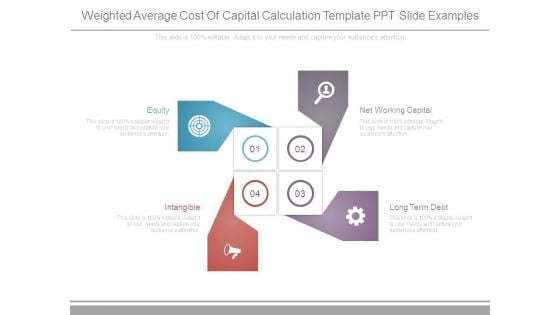
Weighted Average Cost Of Capital Calculation Template Ppt Slide Examples
This is a weighted average cost of capital calculation template ppt slide examples. This is a four stage process. The stages in this process are equity, net working capital, long term debt, intangible.
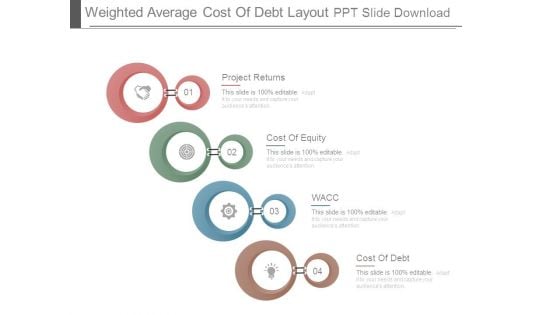
Weighted Average Cost Of Debt Layout Ppt Slide Download
This is a weighted average cost of debt layout ppt slide download. This is a four stage process. The stages in this process are project returns, cost of equity, wacc, cost of debt.
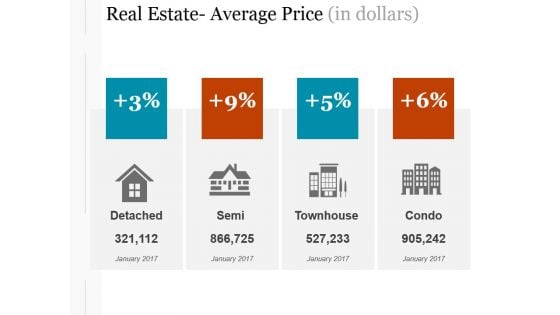
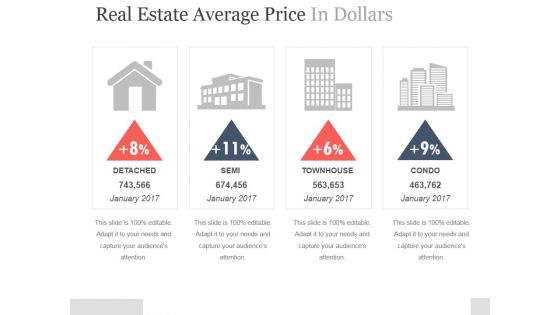
Real Estate Average Price In Dollars Ppt PowerPoint Presentation Templates
This is a real estate average price in dollars ppt powerpoint presentation templates. This is a four stage process. The stages in this process are detached, semi, townhouse, condo.
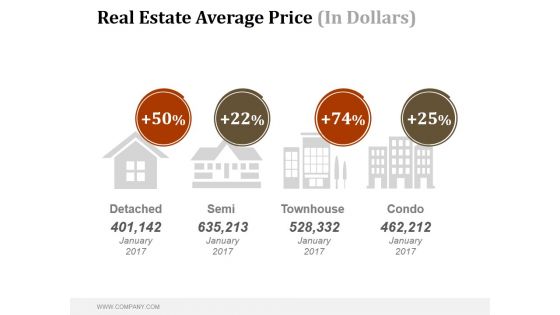
Real Estate Average Price In Dollars Ppt PowerPoint Presentation Slides
This is a real estate average price in dollars ppt powerpoint presentation slides. This is a four stage process. The stages in this process are detached, townhouse, condo, semi.
Real Estate Average Price In Dollars Ppt PowerPoint Presentation Inspiration
This is a real estate average price in dollars ppt powerpoint presentation inspiration. This is a four stage process. The stages in this process are detached, semi, townhouse, condo.
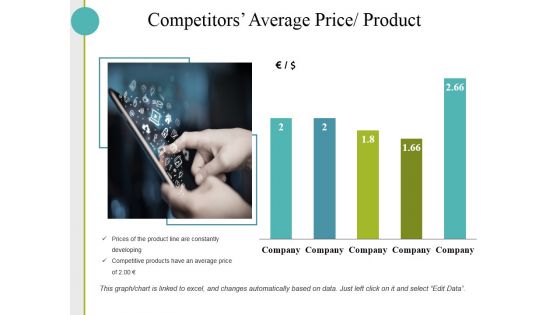
Competitors Average Price Product Ppt PowerPoint Presentation Inspiration Templates
This is a competitors average price product ppt powerpoint presentation inspiration templates. This is a five stage process. The stages in this process are business, finance, analysis, growth, investment, bar graph.
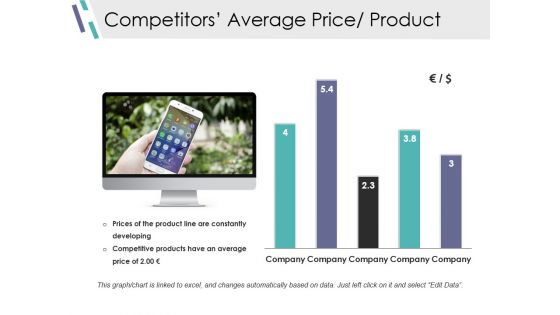
Competitors Average Price Product Ppt PowerPoint Presentation File Show
This is a competitors average price product ppt powerpoint presentation file show. This is a two stage process. The stages in this process are bar graph, marketing, strategy, finance, planning.
Competitors Average Price Product Ppt PowerPoint Presentation Layouts Infographic Template
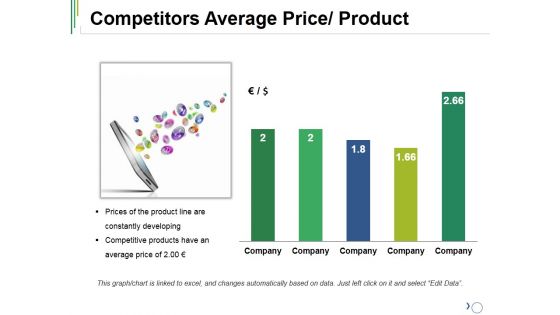
This is a competitors average price product ppt powerpoint presentation layouts infographic template. This is a five stage process. The stages in this process are company, bar graph, success, growth, business.
Competitors Average Price Product Ppt PowerPoint Presentation File Pictures
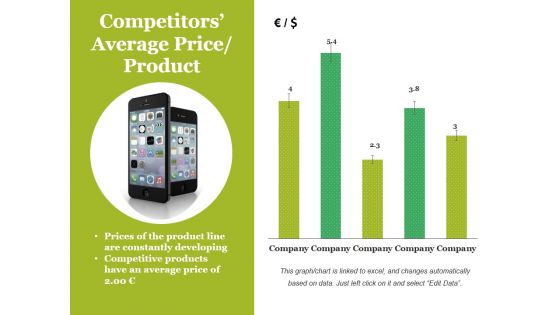
This is a competitors average price product ppt powerpoint presentation file pictures. This is a five stage process. The stages in this process are bar graph, business, marketing, finance, company.
Competitors Average Price Product Ppt PowerPoint Presentation Ideas Layouts
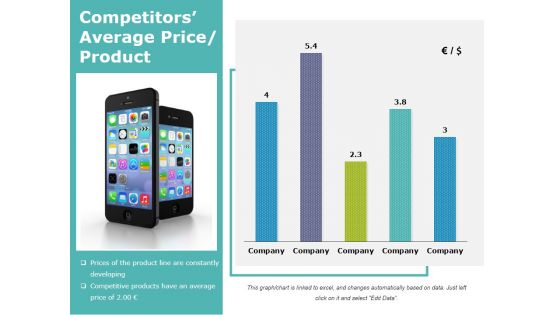
This is a competitors average price product ppt powerpoint presentation ideas layouts. This is a five stage process. The stages in this process are business, bar graph, finance, marketing, analysis.
Competitors Average Price Product Ppt PowerPoint Presentation Styles Ideas
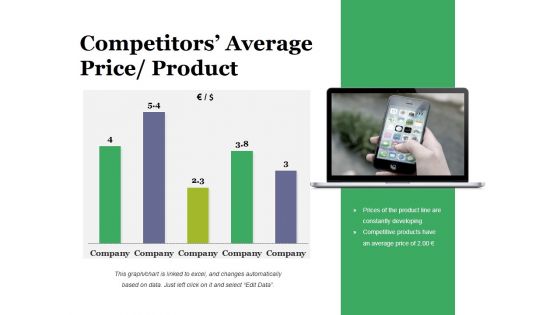
This is a competitors average price product ppt powerpoint presentation styles ideas. This is a five stage process. The stages in this process are business, bar graph, finance, marketing, strategy, analysis.
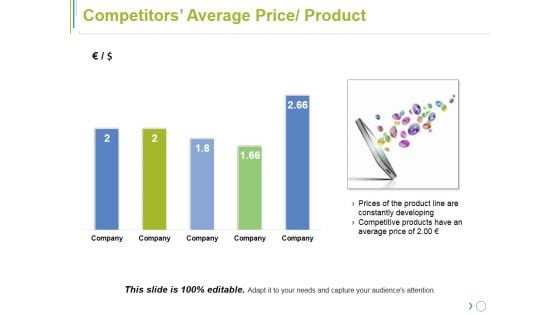
Competitors Average Price Product Ppt PowerPoint Presentation Visual Aids Summary
This is a competitors average price product ppt powerpoint presentation visual aids summary. This is a five stage process. The stages in this process are business, marketing, strategy, planning, finance.
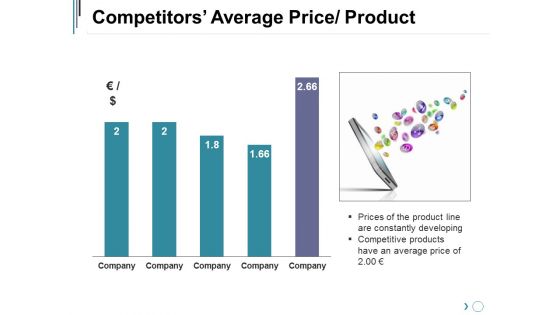
Competitors Average Price Product Ppt PowerPoint Presentation Summary Deck
This is a competitors average price product ppt powerpoint presentation summary deck. This is a five stage process. The stages in this process are business, marketing, strategy, graph, finance.
Competitors Average Price Product Ppt PowerPoint Presentation Icon Layout
This is a competitors average price product ppt powerpoint presentation icon layout. This is a five stage process. The stages in this process are company, bar graph, finance, business, marketing.
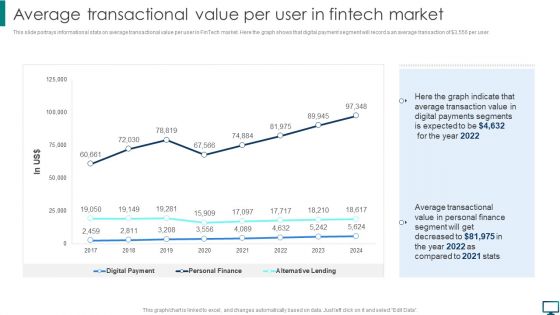
Average Transactional Value Per User In Fintech Market Guidelines PDF
This slide portrays informational stats on average transactional value per user in FinTech market. Here the graph shows that digital payment segment will record a an average transaction of dollar 3,556 per user. Here you can discover an assortment of the finest PowerPoint and Google Slides templates. With these templates, you can create presentations for a variety of purposes while simultaneously providing your audience with an eye-catching visual experience. Download Average Transactional Value Per User In Fintech Market Guidelines PDF to deliver an impeccable presentation. These templates will make your job of preparing presentations much quicker, yet still, maintain a high level of quality. Slidegeeks has experienced researchers who prepare these templates and write high quality content for you. Later on, you can personalize the content by editing the Average Transactional Value Per User In Fintech Market Guidelines PDF.
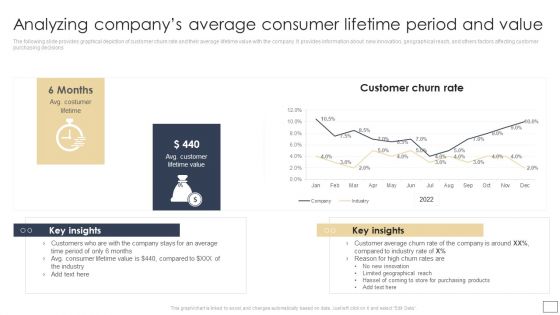
Analyzing Companys Average Consumer Lifetime Period And Value Portrait PDF
The following slide provides graphical depiction of customer churn rate and their average lifetime value with the company. It provides information about new innovation, geographical reach, and others factors affecting customer purchasing decisions.Presenting this PowerPoint presentation, titled Analyzing Companys Average Consumer Lifetime Period And Value Portrait PDF, with topics curated by our researchers after extensive research. This editable presentation is available for immediate download and provides attractive features when used. Download now and captivate your audience. Presenting this Analyzing Companys Average Consumer Lifetime Period And Value Portrait PDF. Our researchers have carefully researched and created these slides with all aspects taken into consideration. This is a completely customizable Analyzing Companys Average Consumer Lifetime Period And Value Portrait PDF that is available for immediate downloading. Download now and make an impact on your audience. Highlight the attractive features available with our PPTs.
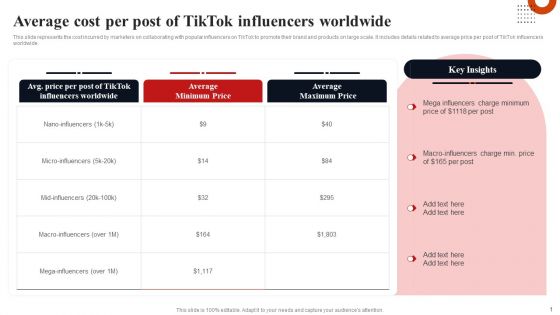
Average Cost Per Post Of Tiktok Influencers Worldwide Diagrams PDF
This slide represents the cost incurred by marketers on collaborating with popular influencers on TikTok to promote their brand and products on large scale. It includes details related to average price per post of TikTok influencers worldwide. Presenting this PowerPoint presentation, titled Average Cost Per Post Of Tiktok Influencers Worldwide Diagrams PDF, with topics curated by our researchers after extensive research. This editable presentation is available for immediate download and provides attractive features when used. Download now and captivate your audience. Presenting this Average Cost Per Post Of Tiktok Influencers Worldwide Diagrams PDF. Our researchers have carefully researched and created these slides with all aspects taken into consideration. This is a completely customizable Average Cost Per Post Of Tiktok Influencers Worldwide Diagrams PDF that is available for immediate downloading. Download now and make an impact on your audience. Highlight the attractive features available with our PPTs.
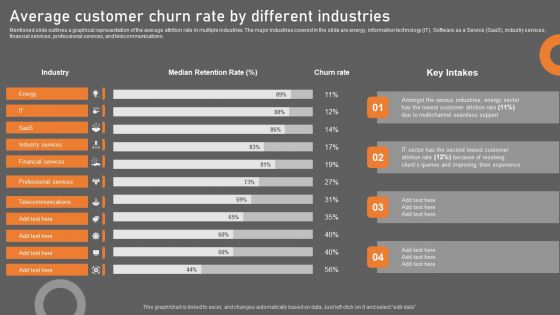
Average Customer Churn Rate By Different Industries Diagrams PDF
Mentioned slide outlines a graphical representation of the average attrition rate in multiple industries. The major industries covered in the slide are energy, information technology IT, Software as a Service SaaS, industry services, financial services, professional services, and telecommunications. Presenting this PowerPoint presentation, titled Average Customer Churn Rate By Different Industries Diagrams PDF, with topics curated by our researchers after extensive research. This editable presentation is available for immediate download and provides attractive features when used. Download now and captivate your audience. Presenting this Average Customer Churn Rate By Different Industries Diagrams PDF. Our researchers have carefully researched and created these slides with all aspects taken into consideration. This is a completely customizable Average Customer Churn Rate By Different Industries Diagrams PDF that is available for immediate downloading. Download now and make an impact on your audience. Highlight the attractive features available with our PPTs.
Average Tax Deductions Ppt PowerPoint Presentation Icon Layout Cpb Pdf
Presenting this set of slides with name average tax deductions ppt powerpoint presentation icon layout cpb pdf. This is an editable Powerpoint three stages graphic that deals with topics like average tax deductions to help convey your message better graphically. This product is a premium product available for immediate download and is 100 percent editable in Powerpoint. Download this now and use it in your presentations to impress your audience.
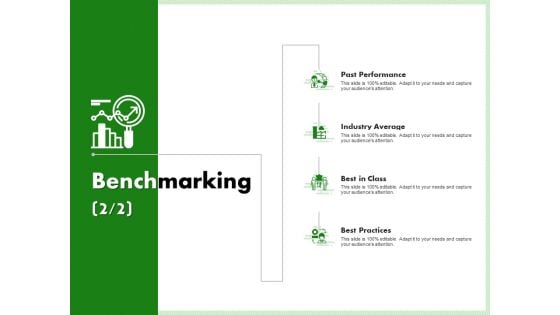
Eco Friendly And Feasibility Management Benchmarking Average Sample PDF
This is a eco friendly and feasibility management benchmarking average sample pdf. template with various stages. Focus and dispense information on four stages using this creative set, that comes with editable features. It contains large content boxes to add your information on topics like past performance, industry average, best class, best practices. You can also showcase facts, figures, and other relevant content using this PPT layout. Grab it now.
Profitability Analysis Average Market Scenario Ppt Icon Mockup PDF
The slide shows the profitability of the company after implementing the strategy in case the market remains average. Key factors include additional users, additional revenue, total cost and profit estimation etc. Deliver an awe inspiring pitch with this creative profitability analysis average market scenario ppt icon mockup pdf bundle. Topics like additional revenue, implementing strategy, 2020 2024 can be discussed with this completely editable template. It is available for immediate download depending on the needs and requirements of the user.
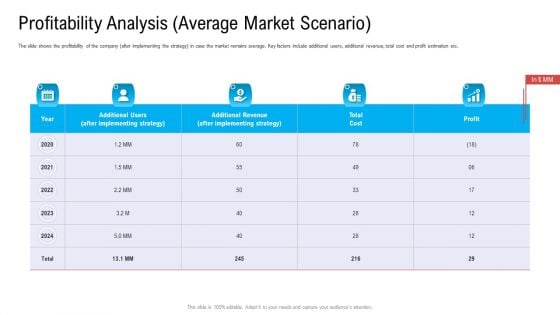
Profitability Analysis Average Market Scenario Ppt Diagram Graph Charts PDF
The slide shows the profitability of the company after implementing the strategy in case the market remains average. Key factors include additional users, additional revenue, total cost and profit estimation etc. Deliver an awe inspiring pitch with this creative profitability analysis average market scenario ppt diagram graph charts pdf bundle. Topics like implementing strategy, additional revenue, total cost, profit can be discussed with this completely editable template. It is available for immediate download depending on the needs and requirements of the user.
Profitability Analysis Average Market Scenario Ppt Icon Shapes PDF
The slide shows the profitability of the company after implementing the strategy. Key factors include additional products sold, additional revenue, total cost and profit estimation etc. Deliver and pitch your topic in the best possible manner with this profitability analysis average market scenario ppt icon shapes pdf. Use them to share invaluable insights on profitability analysis average market scenario and impress your audience. This template can be altered and modified as per your expectations. So, grab it now.
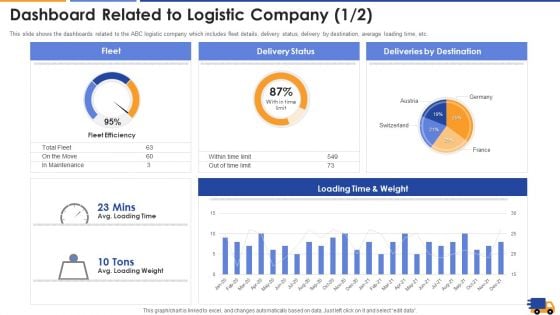
Dashboard Related To Logistic Company Average Structure PDF
This slide shows the dashboards related to the ABC logistic company which includes fleet details, delivery status, delivery by destination, average loading time, etc. Deliver an awe inspiring pitch with this creative dashboard related to logistic company average structure pdf bundle. Topics like dashboard related to logistic company can be discussed with this completely editable template. It is available for immediate download depending on the needs and requirements of the user.
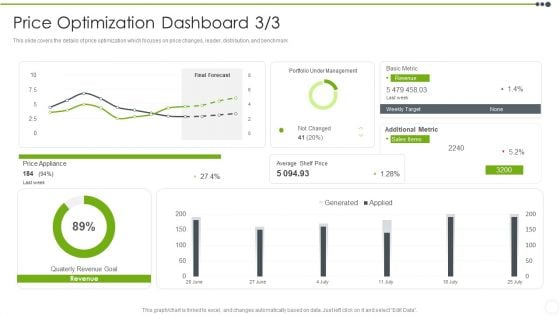
Estimating The Price Price Optimization Dashboard Average Rules PDF
This slide covers the details of price optimization which focuses on price changes, leader, distribution, and benchmark. Deliver an awe inspiring pitch with this creative Estimating The Price Price Optimization Dashboard Average Rules PDF bundle. Topics like Metric, Target, Sales, Average, Price can be discussed with this completely editable template. It is available for immediate download depending on the needs and requirements of the user.
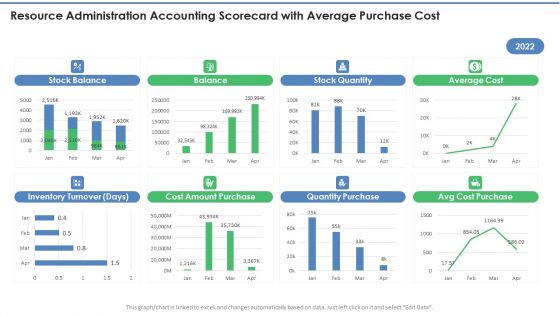
Resource Administration Accounting Scorecard With Average Purchase Cost Structure PDF
This graph or chart is linked to excel, and changes automatically based on data. Just left click on it and select Edit Data. Deliver and pitch your topic in the best possible manner with this Resource Administration Accounting Scorecard With Average Purchase Cost Structure PDF. Use them to share invaluable insights on Stock Balance, Stock Quantity, Average Cost and impress your audience. This template can be altered and modified as per your expectations. So, grab it now.
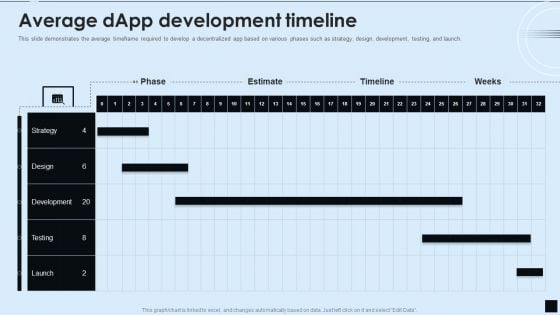
Decentralized Applications IT Average Dapp Development Timeline Ideas PDF
This slide demonstrates the average timeframe required to develop a decentralized app based on various phases such as strategy, design, development, testing, and launch. Deliver an awe inspiring pitch with this creative Decentralized Applications IT Average Dapp Development Timeline Ideas PDF bundle. Topics like Strategy, Design, Development can be discussed with this completely editable template. It is available for immediate download depending on the needs and requirements of the user.
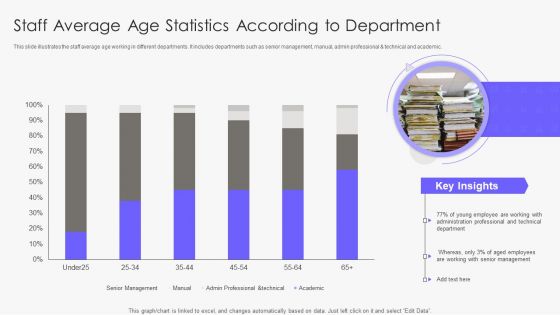
Staff Average Age Statistics According To Department Demonstration PDF
This slide illustrates the staff average age working in different departments. It includes departments such as senior management, manual, admin professional and technical and academic. Showcasing this set of slides titled Staff Average Age Statistics According To Department Demonstration PDF. The topics addressed in these templates are Administration Professional, Management, Employee. All the content presented in this PPT design is completely editable. Download it and make adjustments in color, background, font etc. as per your unique business setting.
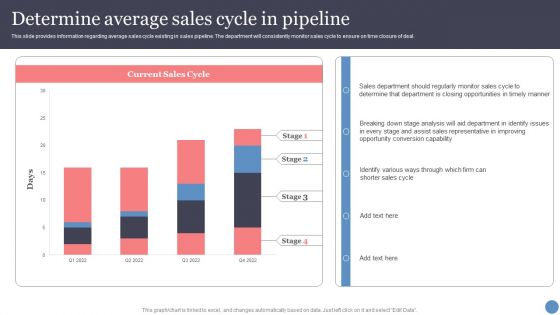
Determine Average Sales Cycle In Pipeline Information PDF
This slide provides information regarding average sales cycle existing in sales pipeline. The department will consistently monitor sales cycle to ensure on time closure of deal. Deliver and pitch your topic in the best possible manner with this Determine Average Sales Cycle In Pipeline Information PDF. Use them to share invaluable insights on Opportunity Conversion Capability, Sales Department, Sales Cycle and impress your audience. This template can be altered and modified as per your expectations. So, grab it now.
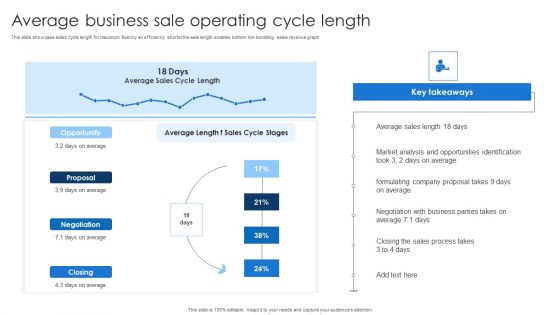
Average Business Sale Operating Cycle Length Ideas PDF
This slide showcase sales cycle length for maximum fluency an efficiency shorter the sale length enables bottom line boosting sales revenue graph.Showcasing this set of slides titled Average Business Sale Operating Cycle Length Ideas PDF. The topics addressed in these templates are Average Sales, Opportunities Identification, Negotiation Business. All the content presented in this PPT design is completely editable. Download it and make adjustments in color, background, font etc. as per your unique business setting.
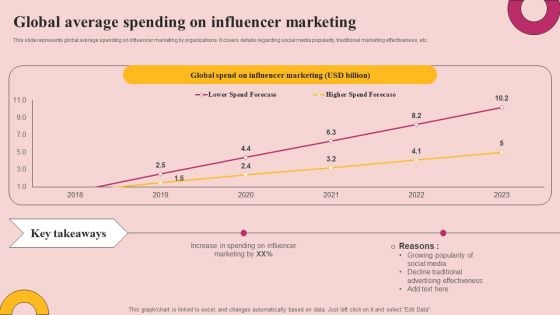
Global Average Spending On Influencer Marketing Pictures PDF
This slide represents global average spending on influencer marketing by organizations. It covers details regarding social media popularity, traditional marketing effectiveness, etc. Find a pre designed and impeccable Global Average Spending On Influencer Marketing Pictures PDF. The templates can ace your presentation without additional effort. You can download these easy to edit presentation templates to make your presentation stand out from others. So, what are you waiting for Download the template from Slidegeeks today and give a unique touch to your presentation.

Average Duration Of Stay In Hospital Of Patients Brochure PDF
Persuade your audience using this Average Duration Of Stay In Hospital Of Patients Brochure PDF. This PPT design covers three stages, thus making it a great tool to use. It also caters to a variety of topics including Average Duration, Hospital Of Patients. Download this PPT design now to present a convincing pitch that not only emphasizes the topic but also showcases your presentation skills.
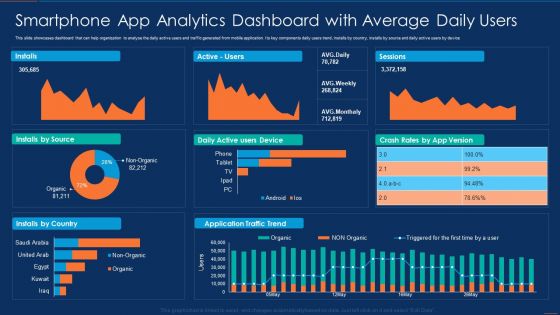
Smartphone App Analytics Dashboard With Average Daily Users Microsoft PDF
This slide showcases dashboard that can help organization to analyse the daily active users and traffic generated from mobile application. Its key components daily users trend, installs by country, installs by source and daily active users by device. Showcasing this set of slides titled Smartphone App Analytics Dashboard With Average Daily Users Microsoft PDF. The topics addressed in these templates are Smartphone App Analytics Dashboard With Average Daily Users. All the content presented in this PPT design is completely editable. Download it and make adjustments in color, background, font etc. as per your unique business setting.
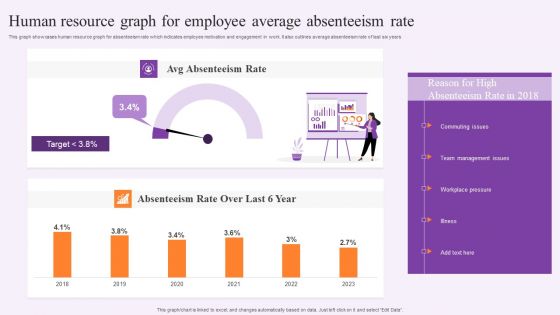
Human Resource Graph For Employee Average Absenteeism Rate Information PDF
This graph showcases human resource graph for absenteeism rate which indicates employee motivation and engagement in work. It also outlines average absenteeism rate of last six years. Showcasing this set of slides titled Human Resource Graph For Employee Average Absenteeism Rate Information PDF. The topics addressed in these templates are Team Management Issues, Workplace Pressure, Absenteeism Rate. All the content presented in this PPT design is completely editable. Download it and make adjustments in color, background, font etc. as per your unique business setting.
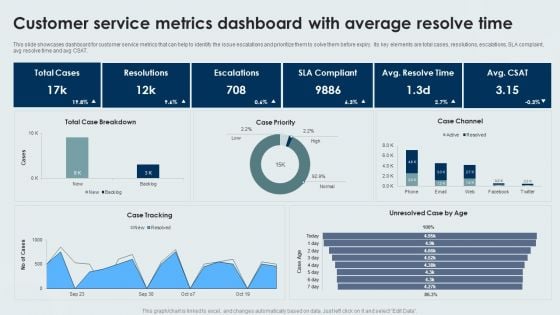
Customer Service Metrics Dashboard With Average Resolve Time Sample PDF
This slide showcases dashboard for customer service metrics that can help to identify the issue escalations and prioritize them to solve them before expiry. Its key elements are total cases, resolutions, escalations, SLA complaint, avg resolve time and avg CSAT. Showcasing this set of slides titled Customer Service Metrics Dashboard With Average Resolve Time Sample PDF. The topics addressed in these templates are Customer Service, Metrics Dashboard, Average Resolve Time. All the content presented in this PPT design is completely editable. Download it and make adjustments in color, background, font etc. as per your unique business setting.
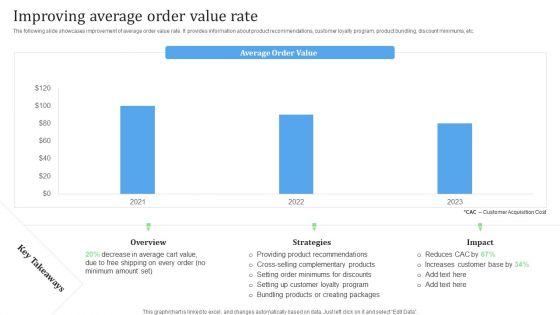
Improving Average Order Value Rate Financial Management Strategies Download PDF
The following slide showcases improvement of average order value rate. It provides information about product recommendations, customer loyalty program, product bundling, discount minimums, etc. Make sure to capture your audiences attention in your business displays with our gratis customizable Improving Average Order Value Rate Financial Management Strategies Download PDF. These are great for business strategies, office conferences, capital raising or task suggestions. If you desire to acquire more customers for your tech business and ensure they stay satisfied, create your own sales presentation with these plain slides.
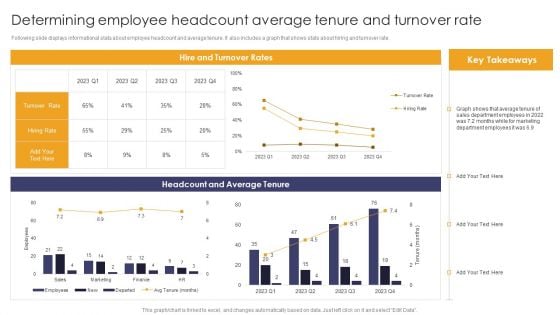
Implementing Succession Planning Determining Employee Headcount Average Tenure Template PDF
Following slide displays informational stats about employee headcount and average tenure. It also includes a graph that shows stats about hiring and turnover rate. Present like a pro with Implementing Succession Planning Determining Employee Headcount Average Tenure Template PDF Create beautiful presentations together with your team, using our easy-to-use presentation slides. Share your ideas in real-time and make changes on the fly by downloading our templates. So whether youre in the office, on the go, or in a remote location, you can stay in sync with your team and present your ideas with confidence. With Slidegeeks presentation got a whole lot easier. Grab these presentations today.
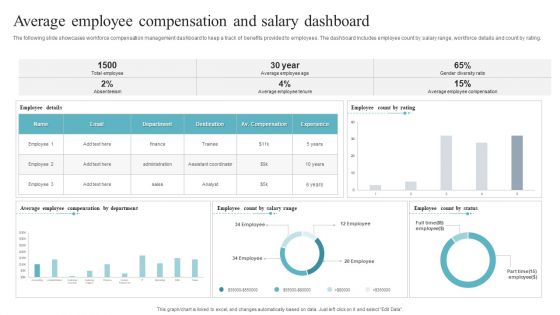
Average Employee Compensation And Salary Dashboard Download PDF
The following slide showcases workforce compensation management dashboard to keep a track of benefits provided to employees. The dashboard includes employee count by salary range, workforce details and count by rating. Showcasing this set of slides titled Average Employee Compensation And Salary Dashboard Download PDF. The topics addressed in these templates are Average Employee Compensation, Salary Dashboard. All the content presented in this PPT design is completely editable. Download it and make adjustments in color, background, font etc. as per your unique business setting.
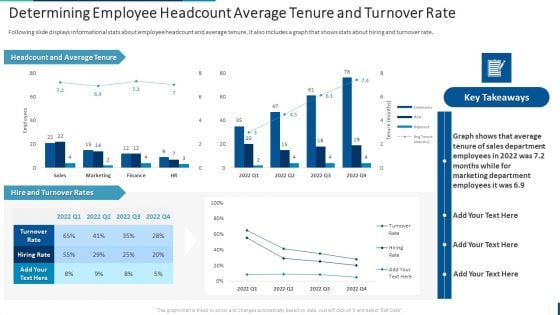
Internal Employee Succession Determining Employee Headcount Average Tenure Inspiration PDF
Following slide displays informational stats about employee headcount and average tenure. It also includes a graph that shows stats about hiring and turnover rate. Present like a pro with Internal Employee Succession Determining Employee Headcount Average Tenure Inspiration PDF Create beautiful presentations together with your team, using our easy-to-use presentation slides. Share your ideas in real-time and make changes on the fly by downloading our templates. So whether youre in the office, on the go, or in a remote location, you can stay in sync with your team and present your ideas with confidence. With Slidegeeks presentation got a whole lot easier. Grab these presentations today.
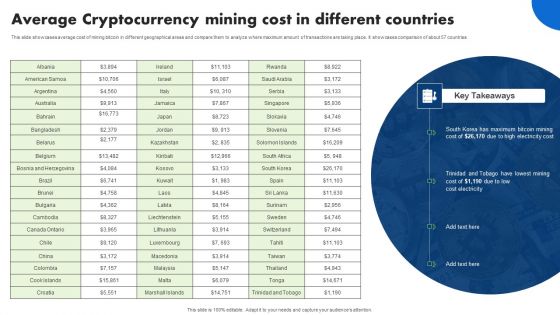
Average Cryptocurrency Mining Cost In Different Countries Professional PDF
This slide showcases average cost of mining bitcoin in different geographical areas and compare them to analyze where maximum amount of transactions are taking place. It showcases comparison of about 57 countries. Showcasing this set of slides titled Average Cryptocurrency Mining Cost In Different Countries Professional PDF. The topics addressed in these templates are High Electricity Cost, Bitcoin Mining, Trinidad And Tobago. All the content presented in this PPT design is completely editable. Download it and make adjustments in color, background, font etc. as per your unique business setting.

 Home
Home