Comparison Bar Graph
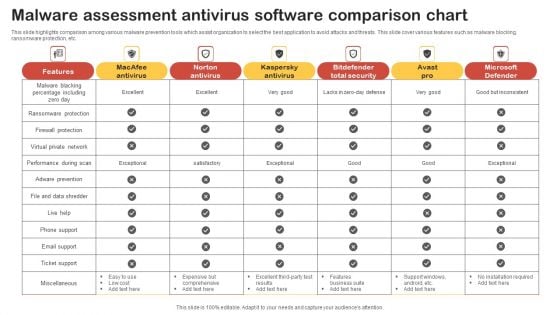
Malware Assessment Antivirus Software Comparison Chart Template PDF
This slide highlights comparison among various malware prevention tools which assist organization to select the best application to avoid attacks and threats. This slide cover various features such as malware blocking, ransomware protection, etc. Showcasing this set of slides titled Malware Assessment Antivirus Software Comparison Chart Template PDF. The topics addressed in these templates are Features, Macafee Antivirus, Norton Antivirus. All the content presented in this PPT design is completely editable. Download it and make adjustments in color, background, font etc. as per your unique business setting.
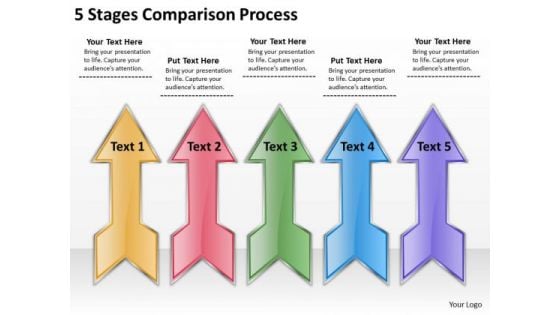
5 Stages Comparison Process Easy Business Plan PowerPoint Slides
We present our 5 stages comparison process easy business plan PowerPoint Slides.Download our Finance PowerPoint Templates because our bewitching PowerPoint Templates and Slides will delight your audience with the magic of your words. Use our Arrows PowerPoint Templates because Our PowerPoint Templates and Slides will provide weight to your words. They will bring out the depth of your thought process. Download our Business PowerPoint Templates because Timeline crunches are a fact of life. Meet all deadlines using our PowerPoint Templates and Slides. Present our Process and Flows PowerPoint Templates because Your ideas provide food for thought. Our PowerPoint Templates and Slides will help you create a dish to tickle the most discerning palate. Present our Success PowerPoint Templates because Our PowerPoint Templates and Slides will let your team Walk through your plans. See their energy levels rise as you show them the way.Use these PowerPoint slides for presentations relating to 3d, Arrow, Banner, Business, Business Concept, Chart, Description, Development, Diagram, Direction, Element, Empty, Financial, Flow, Flowchart, Future, Gradient, Graph, Graphic, Illustration, Isolated, Mirrored, Object, Placeholder, Presentation, Process, Section, Segment, Set, Shape, Sign, Steps, Symbol, Template, Topic, Vector. The prominent colors used in the PowerPoint template are Pink, Green, Blue. Presenters tell us our 5 stages comparison process easy business plan PowerPoint Slides are second to none. We assure you our Business PowerPoint templates and PPT Slides will make the presenter successul in his career/life. Professionals tell us our 5 stages comparison process easy business plan PowerPoint Slides are second to none. We assure you our Banner PowerPoint templates and PPT Slides are topically designed to provide an attractive backdrop to any subject. People tell us our 5 stages comparison process easy business plan PowerPoint Slides will impress their bosses and teams. The feedback we get is that our Banner PowerPoint templates and PPT Slides are effectively colour coded to prioritise your plans They automatically highlight the sequence of events you desire. Deal with the matter in an even handed way. Continue to be cool with our 5 Stages Comparison Process Easy Business Plan PowerPoint Slides.

Comparison Between Agile And Devops It Linear Process Sample PDF
Presenting comparison between agile and devops it linear process sample pdf to provide visual cues and insights. Share and navigate important information on five stages that need your due attention. This template can be used to pitch topics like linear process. In addtion, this PPT design contains high resolution images, graphics, etc, that are easily editable and available for immediate download.
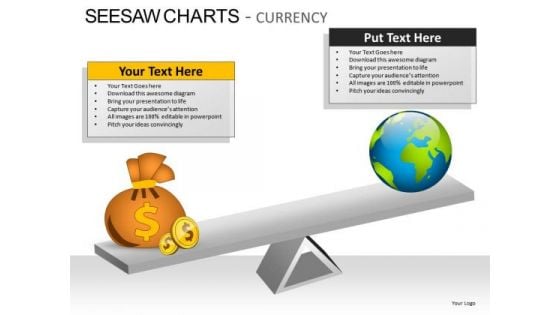
Comparison Seesaw Charts Currency PowerPoint Slides And Ppt Diagram Templates
Comparison Seesaw Charts Currency PowerPoint Slides And PPT Diagram Templates-These high quality powerpoint pre-designed slides and powerpoint templates have been carefully created by our professional team to help you impress your audience. All slides have been created and are 100% editable in powerpoint. Each and every property of any graphic - color, size, orientation, shading, outline etc. can be modified to help you build an effective powerpoint presentation. Any text can be entered at any point in the powerpoint template or slide. Simply DOWNLOAD, TYPE and PRESENT! Empowerment is the aim of our Comparison Seesaw Charts Currency PowerPoint Slides And Ppt Diagram Templates. They put their all behind your thoughts.
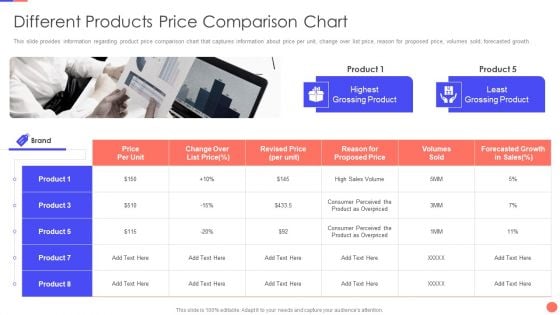
Sales Techniques Playbook Different Products Price Comparison Chart Demonstration PDF
This slide provides information regarding product price comparison chart that captures information about price per unit, change over list price, reason for proposed price, volumes sold, forecasted growth. This is a sales techniques playbook different products price comparison chart demonstration pdf template with various stages. Focus and dispense information on two stages using this creative set, that comes with editable features. It contains large content boxes to add your information on topics like product, consumer, price, growth. You can also showcase facts, figures, and other relevant content using this PPT layout. Grab it now.
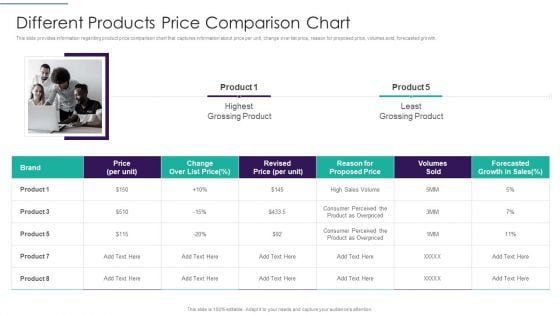
Sales Techniques Playbook Different Products Price Comparison Chart Graphics PDF
This slide provides information regarding product price comparison chart that captures information about price per unit, change over list price, reason for proposed price, volumes sold, forecasted growth. This is a sales techniques playbook different products price comparison chart graphics pdf template with various stages. Focus and dispense information on one stage using this creative set, that comes with editable features. It contains large content boxes to add your information on topics like ensuring effective communication among sales management team You can also showcase facts, figures, and other relevant content using this PPT layout. Grab it now.

Data Augmentation Software Comparison Chart Ppt Visual Aids Show PDF
The slide covers the feature comparison table for data enrichment tools. It includes significant features such as real-time enrichment, data appending services, automatic lead segmentation, etc. Showcasing this set of slides titled Data Augmentation Software Comparison Chart Ppt Visual Aids Show PDF. The topics addressed in these templates are Real Time Enrichment, Data Appending Service, Automatic Lead Segmentation. All the content presented in this PPT design is completely editable. Download it and make adjustments in color, background, font etc. as per your unique business setting.
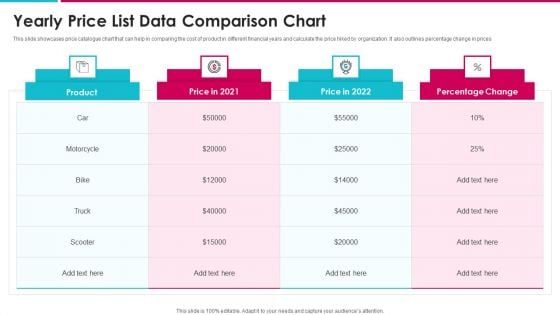
Yearly Price List Data Comparison Chart Structure PDF
This slide showcases price catalogue chart that can help in comparing the cost of product in different financial years and calculate the price hiked by organization. It also outlines percentage change in prices Showcasing this set of slides titled yearly price list data comparison chart structure pdf. The topics addressed in these templates are yearly price list data comparison chart. All the content presented in this PPT design is completely editable. Download it and make adjustments in color, background, font etc. as per your unique business setting.

CRM Different Software Product Comparison Chart Portrait PDF
This slide indicates product comparison of two different software. It includes variables like free trial, contact management, deal management, task management, social integration, email integration, analytics and dashboards, etc. Presenting CRM Different Software Product Comparison Chart Portrait PDF to dispense important information. This template comprises three stages. It also presents valuable insights into the topics including Deal Management, Task Management, Advertising Management. This is a completely customizable PowerPoint theme that can be put to use immediately. So, download it and address the topic impactfully.
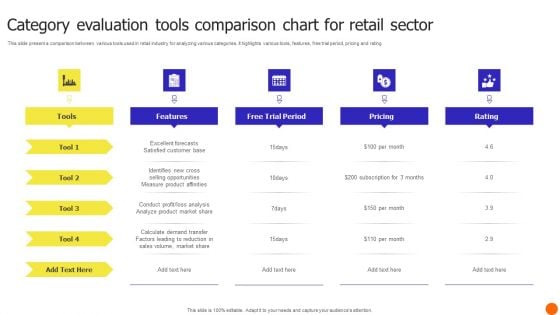
Category Evaluation Tools Comparison Chart For Retail Sector Download PDF
This slide present a comparison between various tools used in retail industry for analyzing various categories. It highlights various tools, features, free trial period, pricing and rating. Pitch your topic with ease and precision using this Category Evaluation Tools Comparison Chart For Retail Sector Download PDF. This layout presents information on Analysis, Market Share, Demand Transfer. It is also available for immediate download and adjustment. So, changes can be made in the color, design, graphics or any other component to create a unique layout.

Half Yearly Employees Comparison Roadmap Based On Sales Performance Template
We present our half yearly employees comparison roadmap based on sales performance template. This PowerPoint layout is easy to edit so you can change the font size, font type, color, and shape conveniently. In addition to this, the PowerPoint layout is Google Slides compatible, so you can share it with your audience and give them access to edit it. Therefore, download and save this well researched half yearly employees comparison roadmap based on sales performance template in different formats like PDF, PNG, and JPG to smoothly execute your business plan.
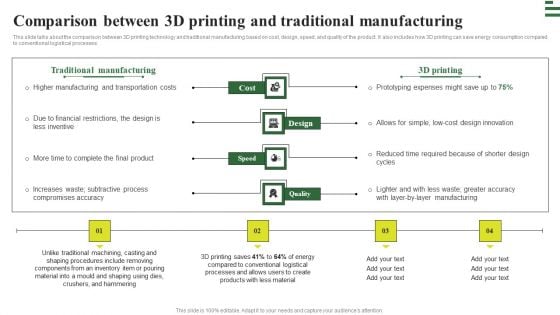
Transforming Manufacturing With Automation Comparison Between 3D Printing Elements PDF
This slide talks about the comparison between 3D printing technology and traditional manufacturing based on cost, design, speed, and quality of the product. It also includes how 3D printing can save energy consumption compared to conventional logistical processes. Do you have an important presentation coming up Are you looking for something that will make your presentation stand out from the rest Look no further than Transforming Manufacturing With Automation Comparison Between 3D Printing Elements PDF. With our professional designs, you can trust that your presentation will pop and make delivering it a smooth process. And with Slidegeeks, you can trust that your presentation will be unique and memorable. So why wait Grab Transforming Manufacturing With Automation Comparison Between 3D Printing Elements PDF today and make your presentation stand out from the rest.
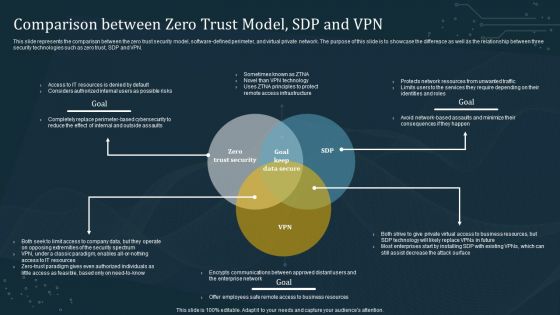
Comparison Between Zero Trust Model SDP And VPN Template PDF
This slide represents the comparison between the zero trust security model, software-defined perimeter, and virtual private network. The purpose of this slide is to showcase the difference as well as the relationship between three security technologies such as zero trust, SDP and VPN. If you are looking for a format to display your unique thoughts, then the professionally designed Comparison Between Zero Trust Model SDP And VPN Template PDF is the one for you. You can use it as a Google Slides template or a PowerPoint template. Incorporate impressive visuals, symbols, images, and other charts. Modify or reorganize the text boxes as you desire. Experiment with shade schemes and font pairings. Alter, share or cooperate with other people on your work. Download Comparison Between Zero Trust Model SDP And VPN Template PDF and find out how to give a successful presentation. Present a perfect display to your team and make your presentation unforgettable.
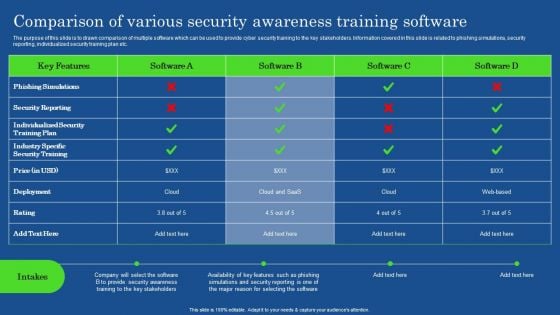
Comparison Of Various Security Awareness Training Software Demonstration PDF
The purpose of this slide is to drawn comparison of multiple software which can be used to provide cyber security training to the key stakeholders. Information covered in this slide is related to phishing simulations, security reporting, individualized security training plan etc. If you are looking for a format to display your unique thoughts, then the professionally designed Comparison Of Various Security Awareness Training Software Demonstration PDF is the one for you. You can use it as a Google Slides template or a PowerPoint template. Incorporate impressive visuals, symbols, images, and other charts. Modify or reorganize the text boxes as you desire. Experiment with shade schemes and font pairings. Alter, share or cooperate with other people on your work. Download Comparison Of Various Security Awareness Training Software Demonstration PDF and find out how to give a successful presentation. Present a perfect display to your team and make your presentation unforgettable.
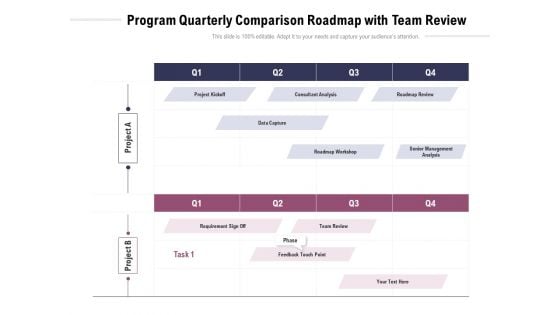
Program Quarterly Comparison Roadmap With Team Review Microsoft
We present our program quarterly comparison roadmap with team review microsoft. This PowerPoint layout is easy to edit so you can change the font size, font type, color, and shape conveniently. In addition to this, the PowerPoint layout is Google Slides compatible, so you can share it with your audience and give them access to edit it. Therefore, download and save this well researched program quarterly comparison roadmap with team review microsoft in different formats like PDF, PNG, and JPG to smoothly execute your business plan.
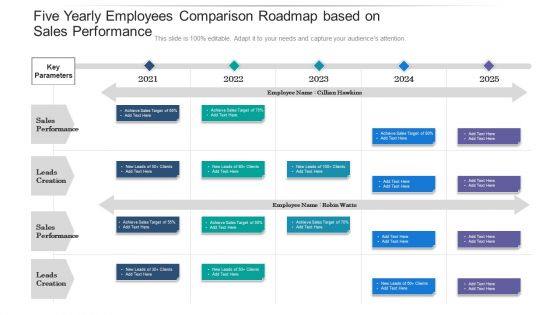
Five Yearly Employees Comparison Roadmap Based On Sales Performance Summary
We present our five yearly employees comparison roadmap based on sales performance summary. This PowerPoint layout is easy to edit so you can change the font size, font type, color, and shape conveniently. In addition to this, the PowerPoint layout is Google Slides compatible, so you can share it with your audience and give them access to edit it. Therefore, download and save this well researched five yearly employees comparison roadmap based on sales performance summary in different formats like PDF, PNG, and JPG to smoothly execute your business plan.
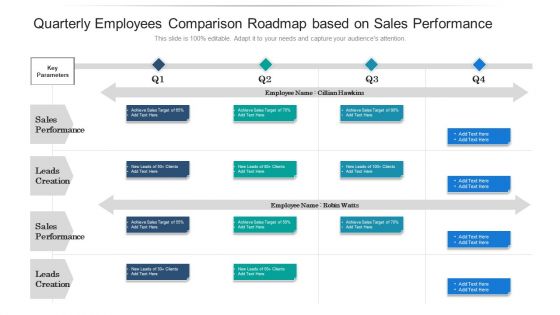
Quarterly Employees Comparison Roadmap Based On Sales Performance Slides
We present our quarterly employees comparison roadmap based on sales performance slides. This PowerPoint layout is easy to edit so you can change the font size, font type, color, and shape conveniently. In addition to this, the PowerPoint layout is Google Slides compatible, so you can share it with your audience and give them access to edit it. Therefore, download and save this well researched quarterly employees comparison roadmap based on sales performance slides in different formats like PDF, PNG, and JPG to smoothly execute your business plan.
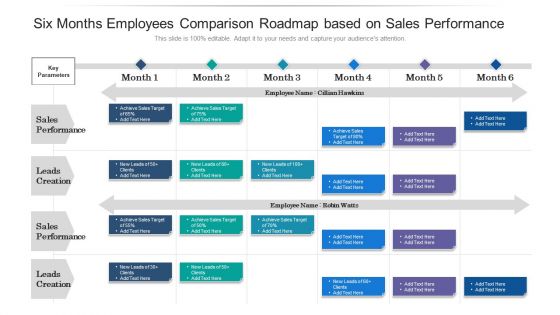
Six Months Employees Comparison Roadmap Based On Sales Performance Background
We present our six months employees comparison roadmap based on sales performance background. This PowerPoint layout is easy to edit so you can change the font size, font type, color, and shape conveniently. In addition to this, the PowerPoint layout is Google Slides compatible, so you can share it with your audience and give them access to edit it. Therefore, download and save this well researched six months employees comparison roadmap based on sales performance background in different formats like PDF, PNG, and JPG to smoothly execute your business plan.
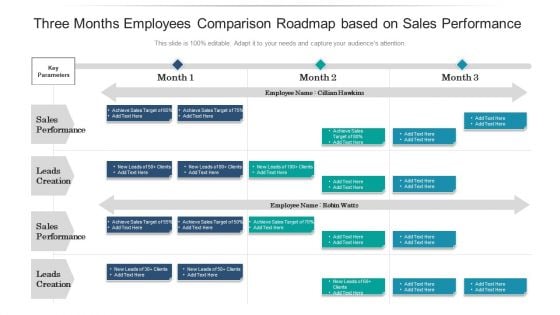
Three Months Employees Comparison Roadmap Based On Sales Performance Designs
We present our three months employees comparison roadmap based on sales performance designs. This PowerPoint layout is easy to edit so you can change the font size, font type, color, and shape conveniently. In addition to this, the PowerPoint layout is Google Slides compatible, so you can share it with your audience and give them access to edit it. Therefore, download and save this well researched three months employees comparison roadmap based on sales performance designs in different formats like PDF, PNG, and JPG to smoothly execute your business plan.
Comparison Of Multiple IT Automation Frameworks Icons PDF
This slide presents comparison of multiple technology automation frameworks based on their objective , approach, pros and cons helpful for organizations to select suitable framework that makes processes and applications easier to test. It includes linear, data driven and keyword driven frameworks. Pitch your topic with ease and precision using this Comparison Of Multiple IT Automation Frameworks Icons PDF. This layout presents information on Objective, Complexity, Development Time. It is also available for immediate download and adjustment. So, changes can be made in the color, design, graphics or any other component to create a unique layout.
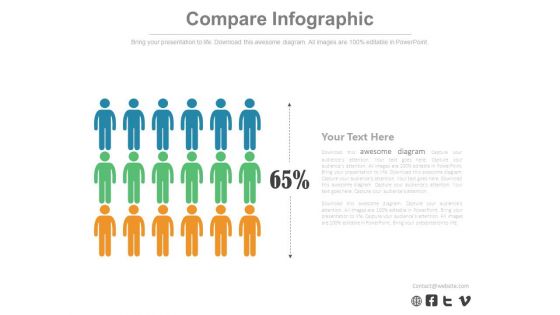
Three Teams Skill Analysis Comparison Chart Powerpoint Slides
Create visually stunning and define your PPT presentations in a unique and inspiring manner using our above template. It contains graphics of comparison chart. This business slide helps to display teams skill analysis. Deliver amazing presentations to mesmerize your audience by using this PPT slide design.
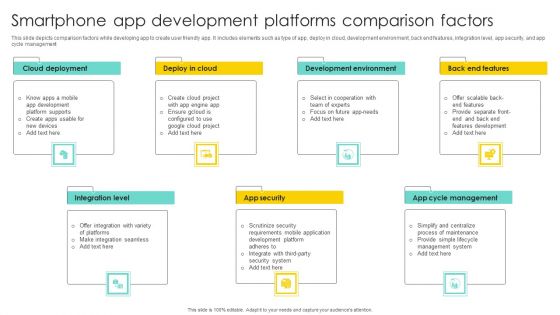
Smartphone App Development Platforms Comparison Factors Portrait PDF
This slide depicts comparison factors while developing app to create user friendly app. It includes elements such as type of app, deploy in cloud, development environment, back end features, integration level, app security, and app cycle management. Persuade your audience using this Smartphone App Development Platforms Comparison Factors Portrait PDF. This PPT design covers seven stages, thus making it a great tool to use. It also caters to a variety of topics including Cloud Deployment, Development Environment, Integration Level. Download this PPT design now to present a convincing pitch that not only emphasizes the topic but also showcases your presentation skills.
Feature Listing Price Comparison Chart Ppt PowerPoint Presentation Outline Icons
Presenting this set of slides with name feature listing price comparison chart ppt powerpoint presentation outline icons. The topics discussed in these slides are free, standard, premium, our plan. This is a completely editable PowerPoint presentation and is available for immediate download. Download now and impress your audience.
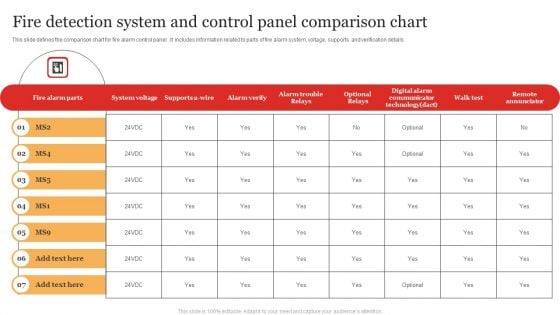
Fire Detection System And Control Panel Comparison Chart Information PDF
Pitch your topic with ease and precision using this Fire Detection System And Control Panel Comparison Chart Information PDF. This layout presents information on Digital Communicator, System Voltage, Remote Annunciator. It is also available for immediate download and adjustment. So, changes can be made in the color, design, graphics or any other component to create a unique layout.
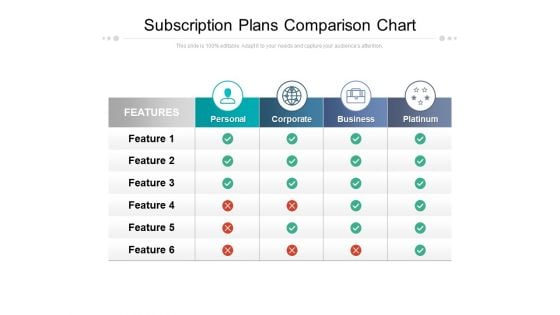
Subscription Plans Comparison Chart Ppt PowerPoint Presentationmodel Brochure
Presenting this set of slides with name subscription plans comparison chart ppt powerpoint presentationmodel brochure. The topics discussed in these slides are features, personal, corporate, business, platinum. This is a completely editable PowerPoint presentation and is available for immediate download. Download now and impress your audience.
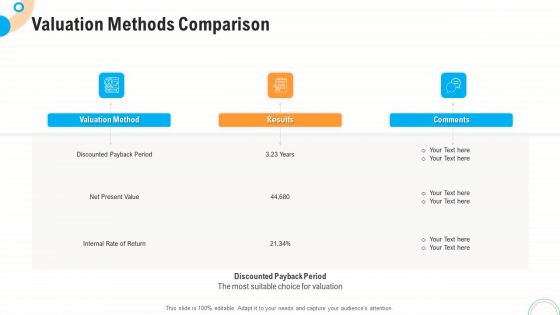
Fiscal And Operational Assessment Valuation Methods Comparison Rules PDF
Presenting fiscal and operational assessment valuation methods comparison rules pdf to provide visual cues and insights. Share and navigate important information on three stages that need your due attention. This template can be used to pitch topics like valuation method, results, comments. In addtion, this PPT design contains high resolution images, graphics, etc, that are easily editable and available for immediate download.
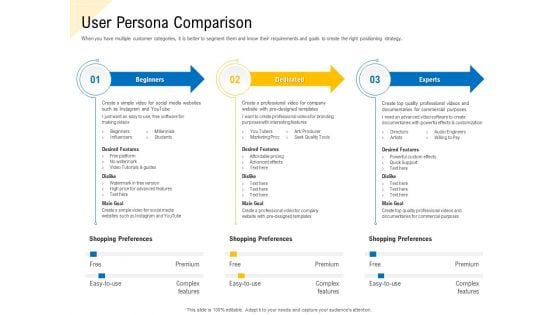
Developing Market Positioning Strategy User Persona Comparison Themes PDF
Presenting this set of slides with name developing market positioning strategy user persona comparison themes pdf. This is a three stage process. The stages in this process are beginners, dedicated, experts. This is a completely editable PowerPoint presentation and is available for immediate download. Download now and impress your audience.
Comparison Of Equity Fundraising Options Developing Fundraising Techniques Icons PDF
This slide showcases criteria that can help organization to evaluate venture capitalists before raising funds. Its key elements are reputation of venture capitalist, development phase of company, industry of VC and firm, required financial volume and location of venture capitalist.Explore a selection of the finest Comparison Of Equity Fundraising Options Developing Fundraising Techniques Icons PDF here. With a plethora of professionally designed and pre-made slide templates, you can quickly and easily find the right one for your upcoming presentation. You can use our Comparison Of Equity Fundraising Options Developing Fundraising Techniques Icons PDF to effectively convey your message to a wider audience. Slidegeeks has done a lot of research before preparing these presentation templates. The content can be personalized and the slides are highly editable. Grab templates today from Slidegeeks.
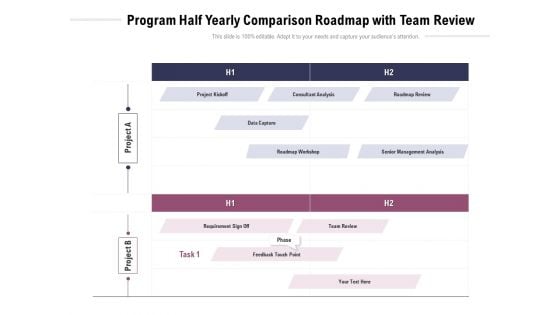
Program Half Yearly Comparison Roadmap With Team Review Microsoft
Presenting our jaw dropping program half yearly comparison roadmap with team review microsoft. You can alternate the color, font size, font type, and shapes of this PPT layout according to your strategic process. This PPT presentation is compatible with Google Slides and is available in both standard screen and widescreen aspect ratios. You can also download this well researched PowerPoint template design in different formats like PDF, JPG, and PNG. So utilize this visually appealing design by clicking the download button given below.
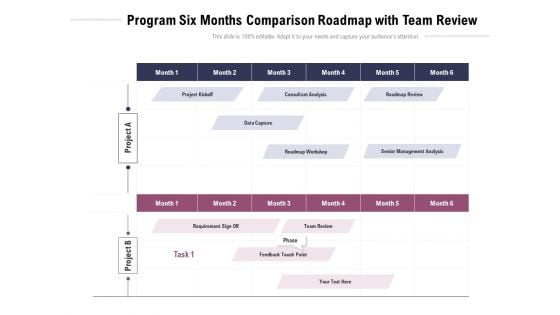
Program Six Months Comparison Roadmap With Team Review Summary
Presenting our innovatively structured program six months comparison roadmap with team review summary Template. Showcase your roadmap process in different formats like PDF, PNG, and JPG by clicking the download button below. This PPT design is available in both Standard Screen and Widescreen aspect ratios. It can also be easily personalized and presented with modified font size, font type, color, and shapes to measure your progress in a clear way.
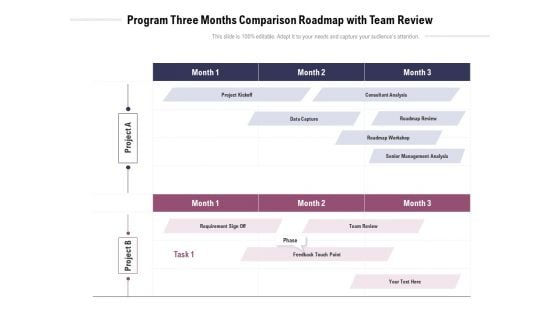
Program Three Months Comparison Roadmap With Team Review Download
Introducing our program three months comparison roadmap with team review download. This PPT presentation is Google Slides compatible, therefore, you can share it easily with the collaborators for measuring the progress. Also, the presentation is available in both standard screen and widescreen aspect ratios. So edit the template design by modifying the font size, font type, color, and shapes as per your requirements. As this PPT design is fully editable it can be presented in PDF, JPG and PNG formats.
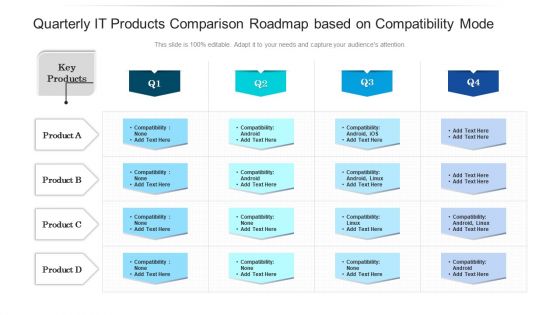
Quarterly IT Products Comparison Roadmap Based On Compatibility Mode Download
Presenting our innovatively structured quarterly it products comparison roadmap based on compatibility mode download Template. Showcase your roadmap process in different formats like PDF, PNG, and JPG by clicking the download button below. This PPT design is available in both Standard Screen and Widescreen aspect ratios. It can also be easily personalized and presented with modified font size, font type, color, and shapes to measure your progress in a clear way.
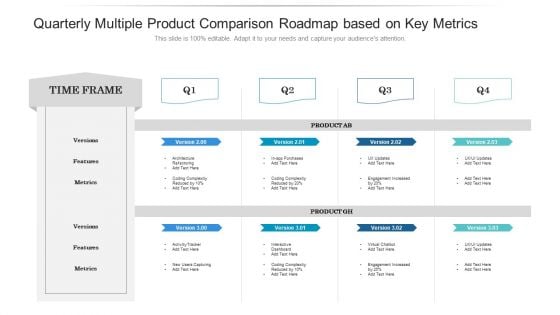
Quarterly Multiple Product Comparison Roadmap Based On Key Metrics Structure
Introducing our quarterly multiple product comparison roadmap based on key metrics structure. This PPT presentation is Google Slides compatible, therefore, you can share it easily with the collaborators for measuring the progress. Also, the presentation is available in both standard screen and widescreen aspect ratios. So edit the template design by modifying the font size, font type, color, and shapes as per your requirements. As this PPT design is fully editable it can be presented in PDF, JPG and PNG formats.
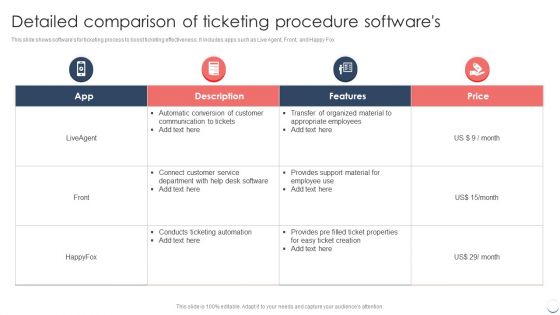
Detailed Comparison Of Ticketing Procedure Softwares Portrait PDF
This slide shows softwares for ticketing process to boost ticketing effectiveness. It includes apps such as Live Agent, Front, and Happy Fox. Presenting Detailed Comparison Of Ticketing Procedure Softwares Portrait PDF to dispense important information. This template comprises four stages. It also presents valuable insights into the topics including Communication, Connect Customer Service, Support Material. This is a completely customizable PowerPoint theme that can be put to use immediately. So, download it and address the topic impactfully.
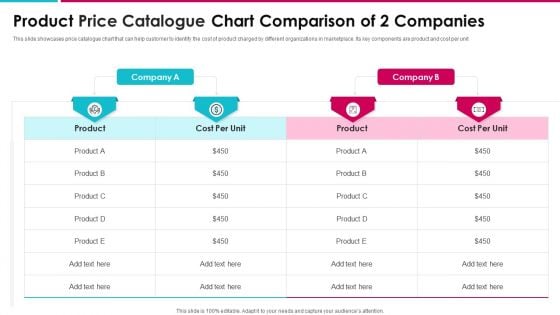
Product Price Catalogue Chart Comparison Of 2 Companies Elements PDF
This slide showcases price catalogue chart that can help customer to identify the cost of product charged by different organizations in marketplace. Its key components are product and cost per unit Showcasing this set of slides titled product price catalogue chart comparison of 2 companies elements pdf. The topics addressed in these templates are product, cost per unit, company. All the content presented in this PPT design is completely editable. Download it and make adjustments in color, background, font etc. as per your unique business setting.
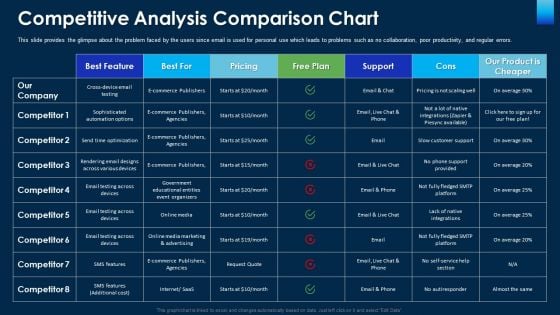
Competitive Analysis Comparison Chart Ppt Infographic Template Guide PDF
This slide provides the glimpse about the problem faced by the users since email is used for personal use which leads to problems such as no collaboration, poor productivity, and regular errors. Deliver and pitch your topic in the best possible manner with this competitive analysis comparison chart ppt infographic template guide pdf. Use them to share invaluable insights on e commerce, average, email, pricing and impress your audience. This template can be altered and modified as per your expectations. So, grab it now.
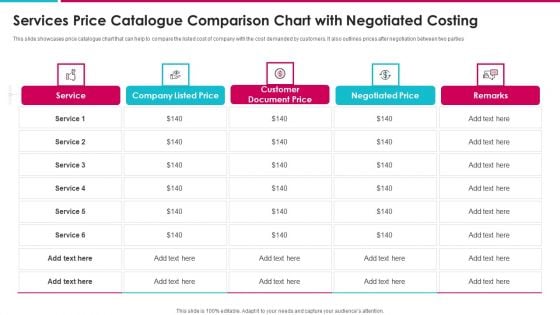
Services Price Catalogue Comparison Chart With Negotiated Costing Topics PDF
This slide showcases price catalogue chart that can help to compare the listed cost of company with the cost demanded by customers. It also outlines prices after negotiation between two parties Pitch your topic with ease and precision using this services price catalogue comparison chart with negotiated costing topics pdf. This layout presents information on service, company listed price, customer document price, negotiated price. It is also available for immediate download and adjustment. So, changes can be made in the color, design, graphics or any other component to create a unique layout.
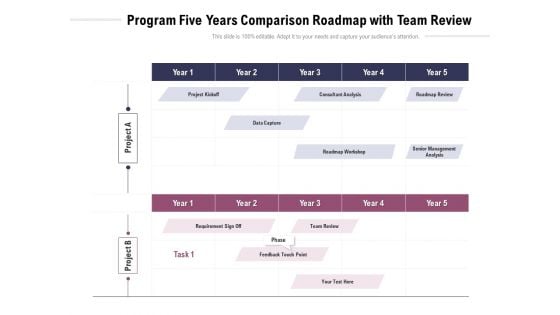
Program Five Years Comparison Roadmap With Team Review Ideas
Presenting the program five years comparison roadmap with team review ideas. The template includes a roadmap that can be used to initiate a strategic plan. Not only this, the PowerPoint slideshow is completely editable and you can effortlessly modify the font size, font type, and shapes according to your needs. This PPT slide can be easily reached in standard screen and widescreen aspect ratios. The set is also available in various formats like PDF, PNG, and JPG. So download and use it multiple times as per your knowledge.
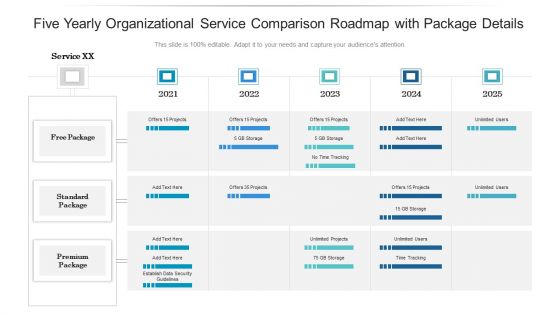
Five Yearly Organizational Service Comparison Roadmap With Package Details Sample
Presenting the five yearly organizational service comparison roadmap with package details sample. The template includes a roadmap that can be used to initiate a strategic plan. Not only this, the PowerPoint slideshow is completely editable and you can effortlessly modify the font size, font type, and shapes according to your needs. This PPT slide can be easily reached in standard screen and widescreen aspect ratios. The set is also available in various formats like PDF, PNG, and JPG. So download and use it multiple times as per your knowledge.
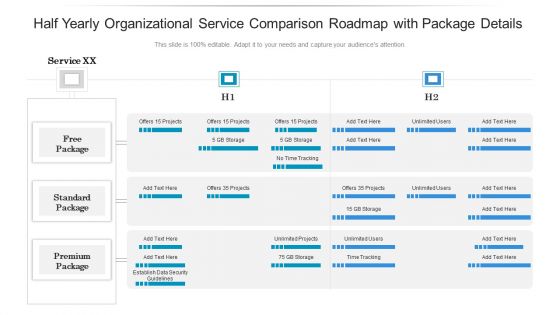
Half Yearly Organizational Service Comparison Roadmap With Package Details Diagrams
Presenting the half yearly organizational service comparison roadmap with package details diagrams. The template includes a roadmap that can be used to initiate a strategic plan. Not only this, the PowerPoint slideshow is completely editable and you can effortlessly modify the font size, font type, and shapes according to your needs. This PPT slide can be easily reached in standard screen and widescreen aspect ratios. The set is also available in various formats like PDF, PNG, and JPG. So download and use it multiple times as per your knowledge.
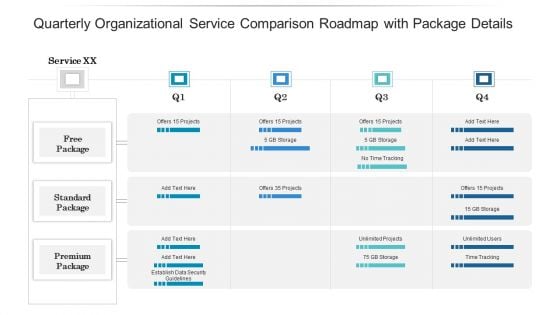
Quarterly Organizational Service Comparison Roadmap With Package Details Mockup
Presenting the quarterly organizational service comparison roadmap with package details mockup. The template includes a roadmap that can be used to initiate a strategic plan. Not only this, the PowerPoint slideshow is completely editable and you can effortlessly modify the font size, font type, and shapes according to your needs. This PPT slide can be easily reached in standard screen and widescreen aspect ratios. The set is also available in various formats like PDF, PNG, and JPG. So download and use it multiple times as per your knowledge.
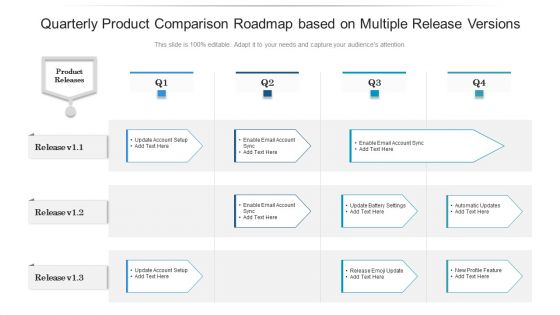
Quarterly Product Comparison Roadmap Based On Multiple Release Versions Sample
Presenting our jaw dropping quarterly product comparison roadmap based on multiple release versions sample. You can alternate the color, font size, font type, and shapes of this PPT layout according to your strategic process. This PPT presentation is compatible with Google Slides and is available in both standard screen and widescreen aspect ratios. You can also download this well researched PowerPoint template design in different formats like PDF, JPG, and PNG. So utilize this visually appealing design by clicking the download button given below.
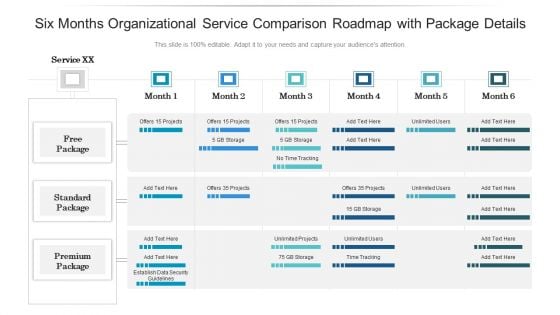
Six Months Organizational Service Comparison Roadmap With Package Details Mockup
Presenting the six months organizational service comparison roadmap with package details mockup. The template includes a roadmap that can be used to initiate a strategic plan. Not only this, the PowerPoint slideshow is completely editable and you can effortlessly modify the font size, font type, and shapes according to your needs. This PPT slide can be easily reached in standard screen and widescreen aspect ratios. The set is also available in various formats like PDF, PNG, and JPG. So download and use it multiple times as per your knowledge.
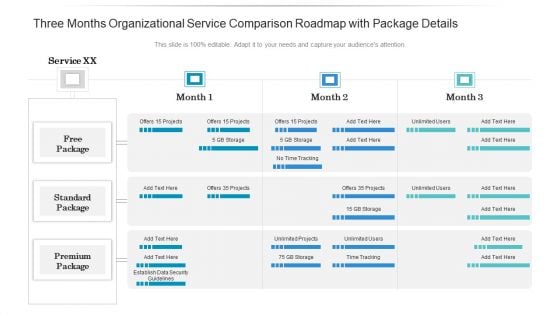
Three Months Organizational Service Comparison Roadmap With Package Details Guidelines
Presenting the three months organizational service comparison roadmap with package details guidelines. The template includes a roadmap that can be used to initiate a strategic plan. Not only this, the PowerPoint slideshow is completely editable and you can effortlessly modify the font size, font type, and shapes according to your needs. This PPT slide can be easily reached in standard screen and widescreen aspect ratios. The set is also available in various formats like PDF, PNG, and JPG. So download and use it multiple times as per your knowledge.
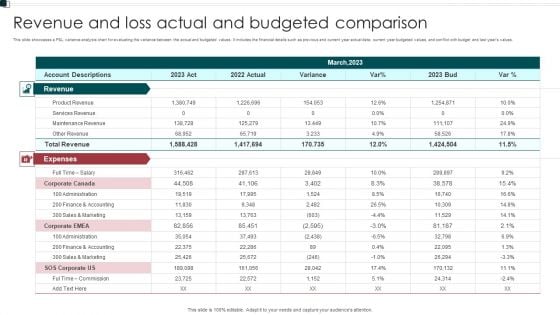
Revenue And Loss Actual And Budgeted Comparison Elements PDF
This slide showcases a P and L variance analysis chart for evaluating the variance between the actual and budgeted values. It includes the financial details such as previous and current year actual data current year budgeted values, and conflict with budget and last years values. Showcasing this set of slides titled Revenue And Loss Actual And Budgeted Comparison Elements PDF. The topics addressed in these templates are Expenses, Administration, Commission. All the content presented in this PPT design is completely editable. Download it and make adjustments in color, background, font etc. as per your unique business setting.
Annual Comparison Chart Ppt PowerPoint Presentation Complete Deck With Slides
Improve your presentation delivery using this Annual Comparison Chart Ppt PowerPoint Presentation Complete Deck With Slides. Support your business vision and objectives using this well structured PPT deck. This template offers a great starting point for delivering beautifully designed presentations on the topic of your choice. Comprising fifteen this professionally designed template is all you need to host discussion and meetings with collaborators. Each slide is self explanatory and equipped with high quality graphics that can be adjusted to your needs. Therefore, you will face no difficulty in portraying your desired content using this PPT slideshow. This PowerPoint slideshow contains every important element that you need for a great pitch. It is not only editable but also available for immediate download and utilization. The color, font size, background, shapes everything can be modified to create your unique presentation layout. Therefore, download it now.
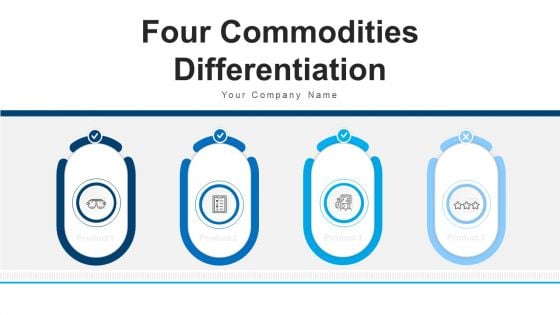
Four Commodities Differentiation Efficient Comparison Ppt PowerPoint Presentation Complete Deck
Improve your presentation delivery using this four commodities differentiation efficient comparison ppt powerpoint presentation complete deck. Support your business vision and objectives using this well-structured PPT deck. This template offers a great starting point for delivering beautifully designed presentations on the topic of your choice. Comprising twelve this professionally designed template is all you need to host discussion and meetings with collaborators. Each slide is self-explanatory and equipped with high-quality graphics that can be adjusted to your needs. Therefore, you will face no difficulty in portraying your desired content using this PPT slideshow. This PowerPoint slideshow contains every important element that you need for a great pitch. It is not only editable but also available for immediate download and utilization. The color, font size, background, shapes everything can be modified to create your unique presentation layout. Therefore, download it now.
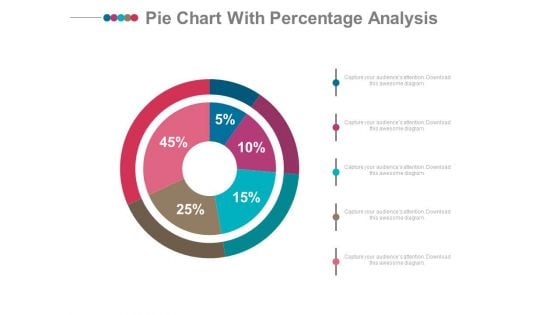
Pie Chart With Financial Data Comparison Powerpoint Slides
Emphatically define your message with our above template which contains graphics of pie chart. This PowerPoint template may be used to display financial data comparison. Grab the attention of your listeners with this slide.
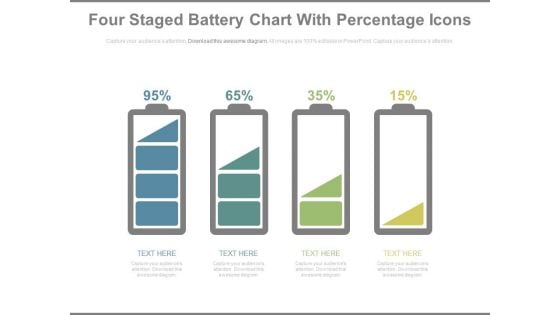
Battery Chart With Percentage Values For Comparison PowerPoint Slides
This year?s sales has matched up with your expectations. Now match this slide with your presentation to show the same. Show your company?s performance or business growth with this four staged battery chart PowerPoint template. With this slide, you can easily convince your colleagues how your company gave a tremendous growth over the years or months. Perfect illustration to show that the targets are achieved. This PPT template is easy to edit. You can choose the color of your choice. Your colleagues are already impressed with the sales growth. Now impress others and choose this PPT innovative designed template.
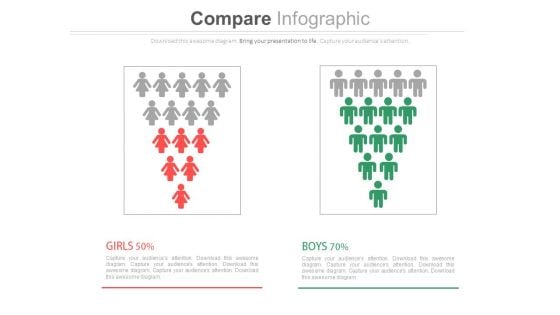
Male Female Gender Ratio Analysis Comparison Chart Powerpoint Slides
This PowerPoint template has been designed with graphics of male and female icons. Download this PPT slide to depict gender ratio analysis. Grab the attention of your team with this eye catching template.
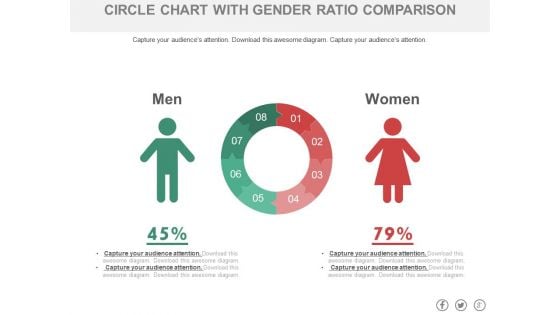
Circle Chart With Man And Woman Ratio Comparison Powerpoint Slides
This PowerPoint template has been designed with graphics of circle chart. You may download this PPT slide to depict man and woman ratio analysis. Add this slide to your presentation and impress your superiors.
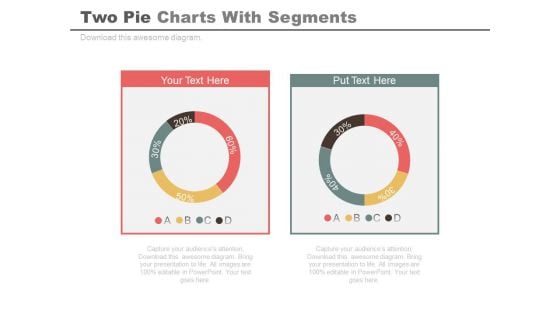
Two Pie Charts For Comparison And Analysis Powerpoint Slides
Develop competitive advantage with our above template of two pie charts. This PowerPoint diagram provides an effective way of displaying business information. You can edit text, color, shade and style as per you need.
Comparison Map Chart With Social Media Icons Powerpoint Slides
This PowerPoint template has been designed with map diagram and social media icons. Each and every property of any region - color, size, shading etc can be modified to help you build an effective PowerPoint presentation. You may use this map slide to display sales territories, business and new office locations, travel planning etc in your presentations.
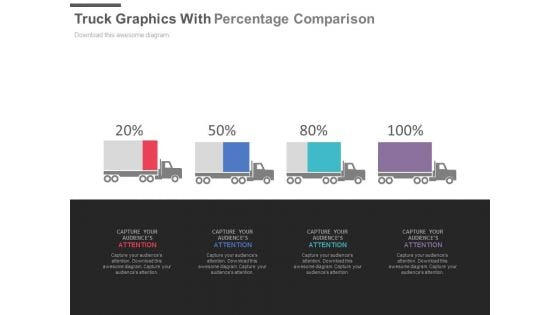
Four Trucks With Percentage Values For Comparison Powerpoint Slides
This PPT slide displays graphics of four trucks with percentage values. Use this PPT design to display logistics compare chart. This PowerPoint template can be customized as per requirements of business presentation.
Man With Bar Chart Vector Icon Ppt PowerPoint Presentation Inspiration Graphics PDF
Pitch your topic with ease and precision using this man with bar chart vector icon ppt powerpoint presentation inspiration graphics pdf. This layout presents information on man with bar chart vector icon. It is also available for immediate download and adjustment. So, changes can be made in the color, design, graphics or any other component to create a unique layout.
Business Assessment Vector With Bar Chart Icon Ppt PowerPoint Presentation File Background Designs PDF
Pitch your topic with ease and precision using this business assessment vector with bar chart icon ppt powerpoint presentation file background designs pdf. This layout presents information on business assessment vector with bar chart icon. It is also available for immediate download and adjustment. So, changes can be made in the color, design, graphics or any other component to create a unique layout.
Icon Presenting Demographic Statistics Of Population With Bar Chart Inspiration PDF
Pitch your topic with ease and precision using this Icon Presenting Demographic Statistics Of Population With Bar Chart Inspiration PDF. This layout presents information on Icon Presenting, Demographic Statistics, Population Chart. It is also available for immediate download and adjustment. So, changes can be made in the color, design, graphics or any other component to create a unique layout.
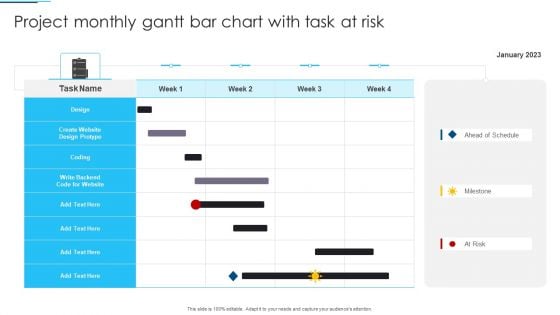
Project Monthly Gantt Bar Chart With Task At Risk Sample PDF
Pitch your topic with ease and precision using this Project Monthly Gantt Bar Chart With Task At Risk Sample PDF. This layout presents information on Design, Project, Risk. It is also available for immediate download and adjustment. So, changes can be made in the color, design, graphics or any other component to create a unique layout.
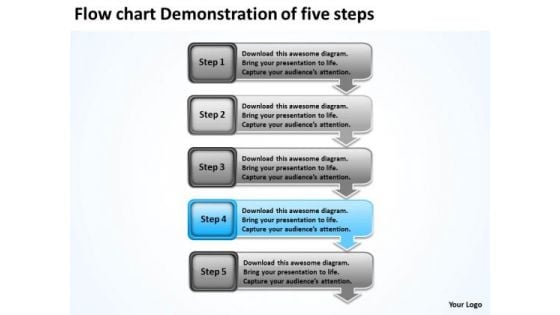
Flow Chart Demonstration Of Five Steps Business Plan For Bar PowerPoint Slides
We present our flow chart demonstration of five steps business plan for bar PowerPoint Slides.Download and present our Business PowerPoint Templates because you should Lay down the fundamentals to build upon. Download and present our Boxes PowerPoint Templates because it depicts Rolling along while gathering profits along the way is the aim. Use our Arrows PowerPoint Templates because with the help of our Slides you can Illustrate your plans on using the many social media modes available to inform soceity at large of the benefits of your product. Use our Process and Flows PowerPoint Templates because getting it done in time is the key to success. Use our Shapes PowerPoint Templates because they are truly some of the wonders of our life.Use these PowerPoint slides for presentations relating to Arrow, Background, Business, Chart, Diagram, Financial, Graphic, Gray, Icon, Illustration, Management, Orange, Perspective, Planning, Process, Stages, Steps, Text. The prominent colors used in the PowerPoint template are Blue light, Gray, Black. We assure you our flow chart demonstration of five steps business plan for bar PowerPoint Slides are the best it can get when it comes to presenting. We assure you our Gray PowerPoint templates and PPT Slides are specially created by a professional team with vast experience. They diligently strive to come up with the right vehicle for your brilliant Ideas. Customers tell us our flow chart demonstration of five steps business plan for bar PowerPoint Slides will get their audience's attention. Presenters tell us our Graphic PowerPoint templates and PPT Slides are Elevated. You can be sure our flow chart demonstration of five steps business plan for bar PowerPoint Slides are Cheerful. The feedback we get is that our Graphic PowerPoint templates and PPT Slides are Classic. Well begun is half done. Get a dream beginning with our Flow Chart Demonstration Of Five Steps Business Plan For Bar PowerPoint Slides.
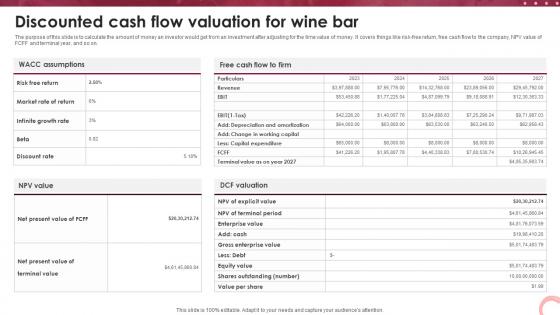
Wine Lounge Business Plan Discounted Cash Flow Valuation For Wine Bar BP SS V
The purpose of this slide is to calculate the amount of money an investor would get from an investment after adjusting for the time value of money. It covers things like risk-free return, free cash flow to the company, NPV value of FCFF and terminal year, and so on. If you are looking for a format to display your unique thoughts, then the professionally designed Wine Lounge Business Plan Discounted Cash Flow Valuation For Wine Bar BP SS V is the one for you. You can use it as a Google Slides template or a PowerPoint template. Incorporate impressive visuals, symbols, images, and other charts. Modify or reorganize the text boxes as you desire. Experiment with shade schemes and font pairings. Alter, share or cooperate with other people on your work. Download Wine Lounge Business Plan Discounted Cash Flow Valuation For Wine Bar BP SS V and find out how to give a successful presentation. Present a perfect display to your team and make your presentation unforgettable. The purpose of this slide is to calculate the amount of money an investor would get from an investment after adjusting for the time value of money. It covers things like risk-free return, free cash flow to the company, NPV value of FCFF and terminal year, and so on.


 Continue with Email

 Home
Home


