Comparison Bar Graph
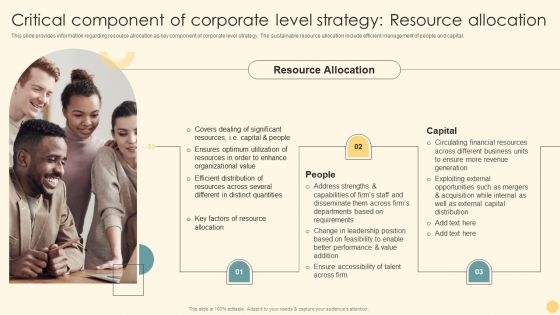
Critical Component Of Corporate Level Strategy Resource Allocation Ppt PowerPoint Presentation Diagram Graph Charts PDF
This slide provides information regarding resource allocation as key component of corporate level strategy. The sustainable resource allocation include efficient management of people and capital. From laying roadmaps to briefing everything in detail, our templates are perfect for you. You can set the stage with your presentation slides. All you have to do is download these easy to edit and customizable templates. Critical Component Of Corporate Level Strategy Resource Allocation Ppt PowerPoint Presentation Diagram Graph Charts PDF will help you deliver an outstanding performance that everyone would remember and praise you for. Do download this presentation today.
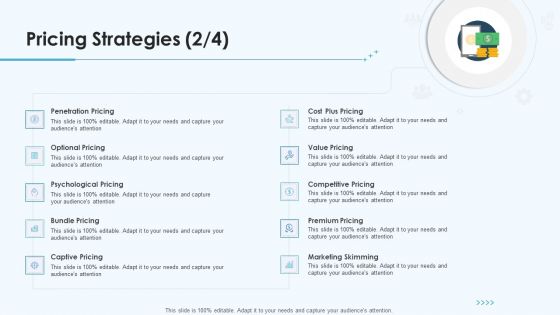
Product Pricing Strategies Pricing Strategies Skimming Ppt Diagram Graph Charts PDF
This is a product pricing strategies pricing strategies skimming ppt diagram graph charts pdf template with various stages. Focus and dispense information on ten stages using this creative set, that comes with editable features. It contains large content boxes to add your information on topics like psychological pricing, captive pricing, marketing skimming, premium pricing, value pricing. You can also showcase facts, figures, and other relevant content using this PPT layout. Grab it now.
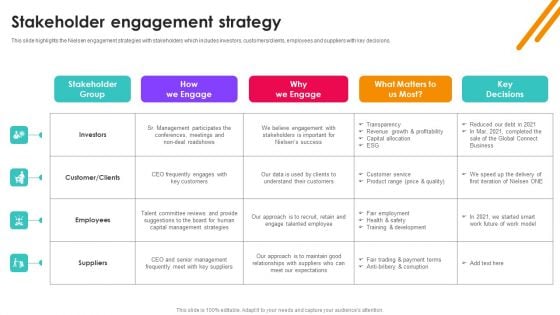
Nielsen Business Profile Stakeholder Engagement Strategy Ppt PowerPoint Presentation Diagram Graph Charts PDF
This slide highlights the Nielsen engagement strategies with stakeholders which includes investors, customers or clients, employees and suppliers with key decisions. The Nielsen Business Profile Stakeholder Engagement Strategy Ppt PowerPoint Presentation Diagram Graph Charts PDF is a compilation of the most recent design trends as a series of slides. It is suitable for any subject or industry presentation, containing attractive visuals and photo spots for businesses to clearly express their messages. This template contains a variety of slides for the user to input data, such as structures to contrast two elements, bullet points, and slides for written information. Slidegeeks is prepared to create an impression.
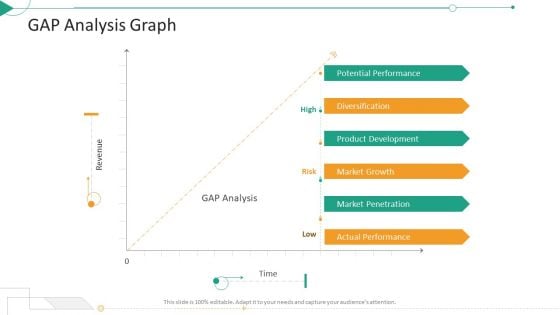
Strategic Planning Needs Evaluation Gap Analysis Graph Ppt Inspiration Templates PDF
This is a strategic planning needs evaluation gap analysis graph ppt inspiration templates pdf template with various stages. Focus and dispense information on three stages using this creative set, that comes with editable features. It contains large content boxes to add your information on topics like product development, market growth, potential performance. You can also showcase facts, figures, and other relevant content using this PPT layout. Grab it now.
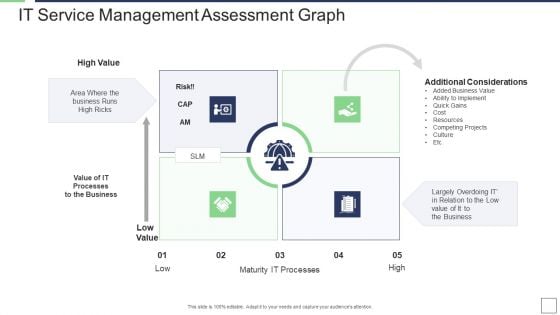
IT Service Incorporation And Administration IT Service Management Assessment Graph Value Sample PDF
This is a it service incorporation and administration it service management assessment graph value sample pdf template with various stages. Focus and dispense information on four stages using this creative set, that comes with editable features. It contains large content boxes to add your information on topics like business, processes, implement, value resources. You can also showcase facts, figures, and other relevant content using this PPT layout. Grab it now.
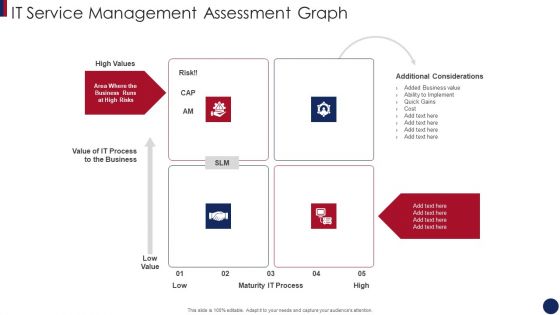
Post Merger Information Technology Service Delivery Amalgamation IT Service Management Assessment Graph Formats PDF
This is a post merger information technology service delivery amalgamation it service management assessment graph formats pdf template with various stages. Focus and dispense information on four stages using this creative set, that comes with editable features. It contains large content boxes to add your information on topics like it process, business, maturity it process, additional considerations . You can also showcase facts, figures, and other relevant content using this PPT layout. Grab it now.
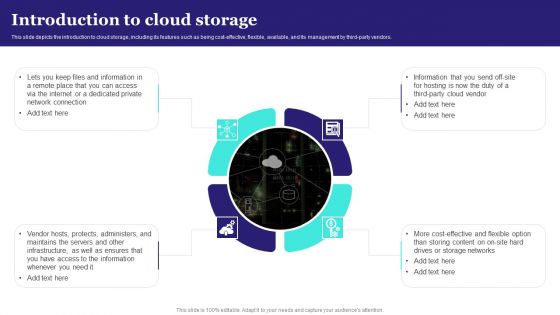
Introduction To Cloud Storage Ppt PowerPoint Presentation Diagram Graph Charts PDF
This slide depicts the introduction to cloud storage, including its features such as being cost-effective, flexible, available, and its management by third party vendors. This modern and well arranged Introduction To Cloud Storage Ppt PowerPoint Presentation Diagram Graph Charts PDF provides lots of creative possibilities. It is very simple to customize and edit with the Powerpoint Software. Just drag and drop your pictures into the shapes. All facets of this template can be edited with Powerpoint no extra software is necessary. Add your own material, put your images in the places assigned for them, adjust the colors, and then you can show your slides to the world, with an animated slide included.

Potential Segment Analysis For Amazon Customer Base Ppt PowerPoint Presentation Diagram Graph Charts PDF
This slide provides information regarding potential segments assessed across the customer base in terms of market size, recurring purchases, percent of online buyers, conversion rate, and purchasing power. Present like a pro with Potential Segment Analysis For Amazon Customer Base Ppt PowerPoint Presentation Diagram Graph Charts PDF Create beautiful presentations together with your team, using our easy to use presentation slides. Share your ideas in real time and make changes on the fly by downloading our templates. So whether you are in the office, on the go, or in a remote location, you can stay in sync with your team and present your ideas with confidence. With Slidegeeks presentation got a whole lot easier. Grab these presentations today.
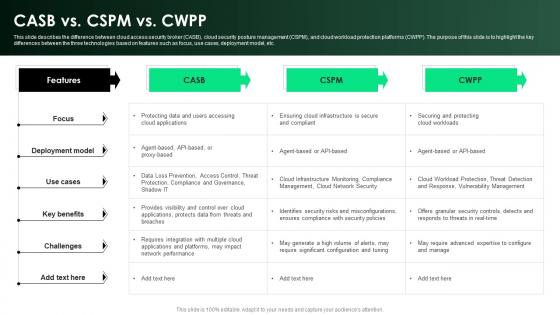
CASB 2 0 IT CASB Vs CSPM Vs CWPP Ppt Diagram Graph Charts
This slide describes the difference between cloud access security broker CASB , cloud security posture management CSPM , and cloud workload protection platforms CWPP . The purpose of this slide is to highlight the key differences between the three technologies based on features such as focus, use cases, deployment model, etc. Are you in need of a template that can accommodate all of your creative concepts This one is crafted professionally and can be altered to fit any style. Use it with Google Slides or PowerPoint. Include striking photographs, symbols, depictions, and other visuals. Fill, move around, or remove text boxes as desired. Test out color palettes and font mixtures. Edit and save your work, or work with colleagues. Download CASB 2 0 IT CASB Vs CSPM Vs CWPP Ppt Diagram Graph Charts and observe how to make your presentation outstanding. Give an impeccable presentation to your group and make your presentation unforgettable. This slide describes the difference between cloud access security broker CASB , cloud security posture management CSPM , and cloud workload protection platforms CWPP . The purpose of this slide is to highlight the key differences between the three technologies based on features such as focus, use cases, deployment model, etc.
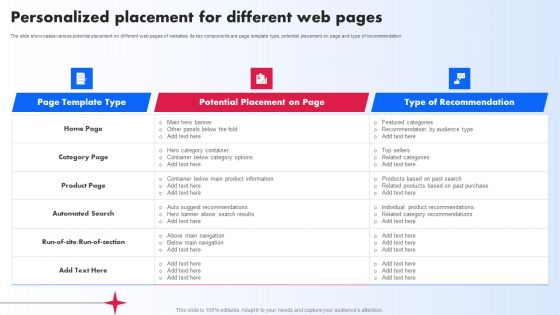
Personalized Placement For Different Web Pages Ppt PowerPoint Presentation Diagram Graph Charts PDF
The slide showcases various potential placement on different web pages of websites. Its key components are page template type, potential placement on page and type of recommendation. Do you know about Slidesgeeks Personalized Placement For Different Web Pages Ppt PowerPoint Presentation Diagram Graph Charts PDF. These are perfect for delivering any kind od presentation. Using it, create PowerPoint presentations that communicate your ideas and engage audiences. Save time and effort by using our pre designed presentation templates that are perfect for a wide range of topic. Our vast selection of designs covers a range of styles, from creative to business, and are all highly customizable and easy to edit. Download as a PowerPoint template or use them as Google Slides themes.
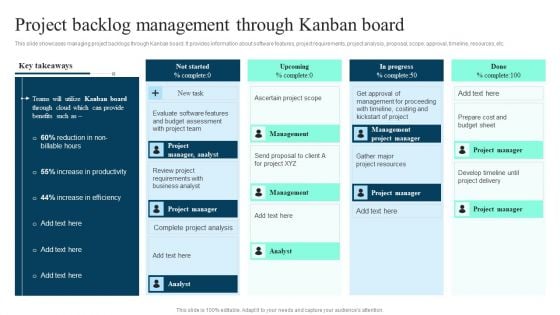
Project Backlog Management Through Kanban Board Ppt PowerPoint Presentation Diagram Graph Charts PDF
This slide showcases managing project backlogs through Kanban board. It provides information about software features, project requirements, project analysis, proposal, scope, approval, timeline, resources, etc. Slidegeeks is here to make your presentations a breeze with Project Backlog Management Through Kanban Board Ppt PowerPoint Presentation Diagram Graph Charts PDF With our easy to use and customizable templates, you can focus on delivering your ideas rather than worrying about formatting. With a variety of designs to choose from, you are sure to find one that suits your needs. And with animations and unique photos, illustrations, and fonts, you can make your presentation pop. So whether you are giving a sales pitch or presenting to the board, make sure to check out Slidegeeks first.
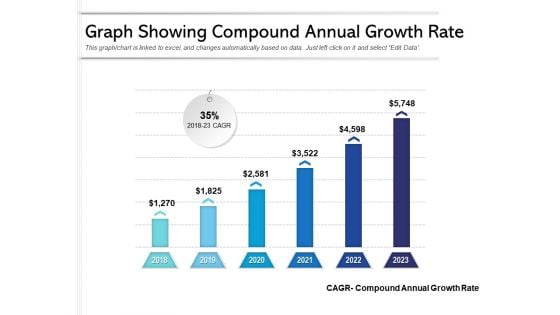
Graph Showing Compound Annual Growth Rate Ppt PowerPoint Presentation Inspiration Slide Download PDF
Pitch your topic with ease and precision using this primary data analysis, secondary data analysis, tertiary data analysis. This layout presents information on cagr compound annual growth rate, 2018 to 2023. It is also available for immediate download and adjustment. So, changes can be made in the color, design, graphics or any other component to create a unique layout.
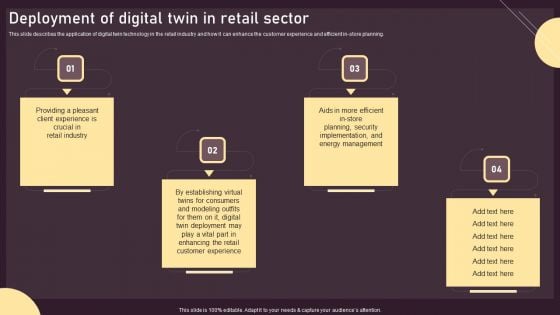
Deployment Of Digital Twin In Retail Sector Ppt PowerPoint Presentation Diagram Graph Charts PDF
This slide describes the application of digital twin technology in the retail industry and how it can enhance the customer experience and efficient in store planning. This Deployment Of Digital Twin In Retail Sector Ppt PowerPoint Presentation Diagram Graph Charts PDF from Slidegeeks makes it easy to present information on your topic with precision. It provides customization options, so you can make changes to the colors, design, graphics, or any other component to create a unique layout. It is also available for immediate download, so you can begin using it right away. Slidegeeks has done good research to ensure that you have everything you need to make your presentation stand out. Make a name out there for a brilliant performance.
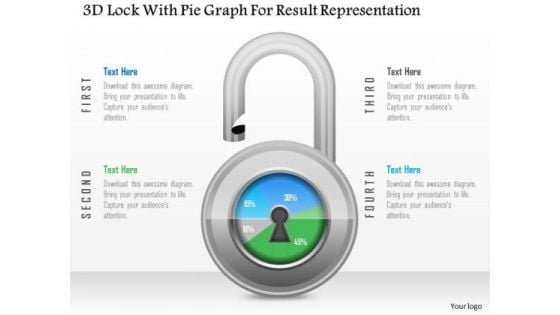
Business Diagram 3d Lock With Pie Graph For Result Representation PowerPoint Slide
This Power Point diagram has been crafted with pie chart in shape of lock. It contains diagram of lock pie chart to compare and present data in an effective manner. Use this diagram to build professional presentations for your viewers.

Business Diagram Three Staged Pencil Diagram For Graph Formation PowerPoint Slide
This business diagram displays set of pencils. This Power Point template has been designed to compare and present business data. Download this diagram to represent stages of business growth.
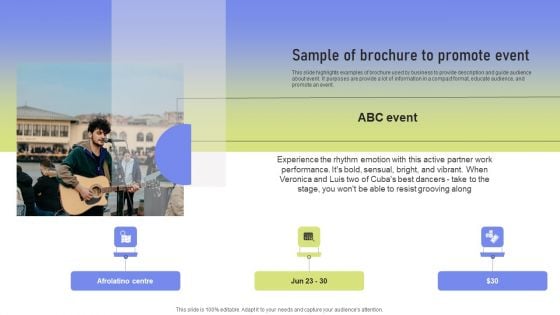
Sample Of Brochure To Promote Event Ppt PowerPoint Presentation Diagram Graph Charts PDF
This slide highlights examples of brochure used by business to provide description and guide audience about event. It purposes are provide a lot of information in a compact format, educate audience, and promote an event. This Sample Of Brochure To Promote Event Ppt PowerPoint Presentation Diagram Graph Charts PDF from Slidegeeks makes it easy to present information on your topic with precision. It provides customization options, so you can make changes to the colors, design, graphics, or any other component to create a unique layout. It is also available for immediate download, so you can begin using it right away. Slidegeeks has done good research to ensure that you have everything you need to make your presentation stand out. Make a name out there for a brilliant performance.
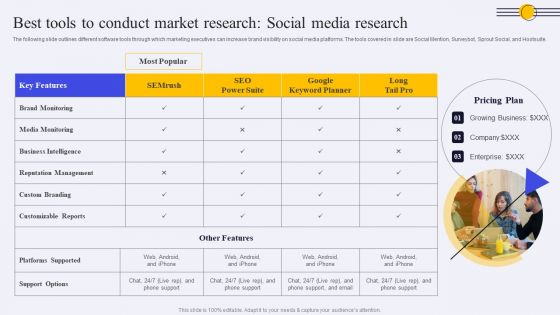
Best Tools To Conduct Market Research Social Media Research Ppt PowerPoint Presentation Diagram Graph Charts PDF
The following slide outlines different software tools through which marketing executives can increase brand visibility on social media platforms. The tools covered in slide are Social Mention, Surveybot, Sprout Social, and Hootsuite. This Best Tools To Conduct Market Research Social Media Research Ppt PowerPoint Presentation Diagram Graph Charts PDF from Slidegeeks makes it easy to present information on your topic with precision. It provides customization options, so you can make changes to the colors, design, graphics, or any other component to create a unique layout. It is also available for immediate download, so you can begin using it right away. Slidegeeks has done good research to ensure that you have everything you need to make your presentation stand out. Make a name out there for a brilliant performance.
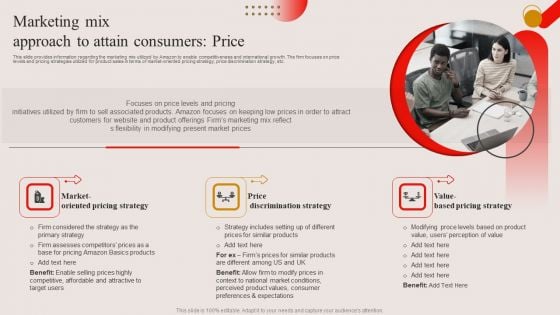
Marketing Mix Approach To Attain Consumers Price Ppt PowerPoint Presentation Diagram Graph Charts PDF
This slide provides information regarding the marketing mix utilized by Amazon to enable competitiveness and international growth. The firm focuses on price levels and pricing strategies utilized for product sales in terms of market-oriented pricing strategy, price discrimination strategy, etc. This Marketing Mix Approach To Attain Consumers Price Ppt PowerPoint Presentation Diagram Graph Charts PDF from Slidegeeks makes it easy to present information on your topic with precision. It provides customization options, so you can make changes to the colors, design, graphics, or any other component to create a unique layout. It is also available for immediate download, so you can begin using it right away. Slidegeeks has done good research to ensure that you have everything you need to make your presentation stand out. Make a name out there for a brilliant performance.
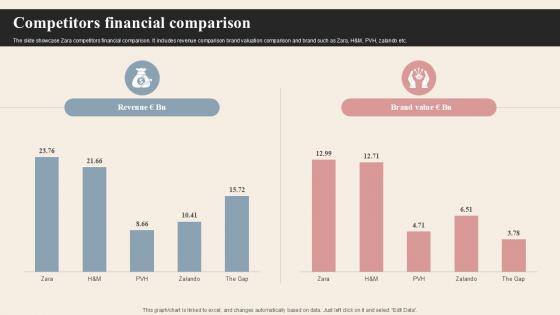
Competitors Financial Comparison Branded Clothing Company Profile PPT Example CP SS V
The slide showcase Zara competitors financial comparison. It includes revenue comparison brand valuation comparison and brand such as Zara, H and M, PVH, zalando etc. There are so many reasons you need a Competitors Financial Comparison Branded Clothing Company Profile PPT Example CP SS V. The first reason is you can not spend time making everything from scratch, Thus, Slidegeeks has made presentation templates for you too. You can easily download these templates from our website easily. The slide showcase Zara competitors financial comparison. It includes revenue comparison brand valuation comparison and brand such as Zara, H and M, PVH, zalando etc.
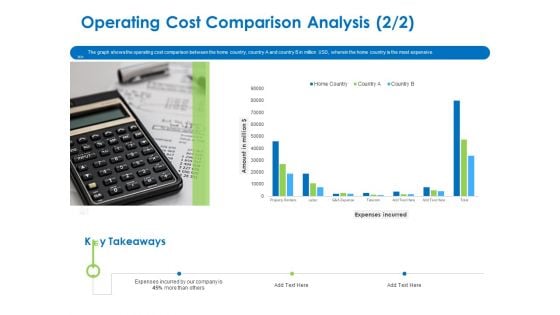
Relocation Of Business Process Offshoring Operating Cost Comparison Analysis Expenses Professional PDF
The graph shows the operating cost comparison between the home country, country A and country B in million USD, wherein the home country is the most expensive. Deliver an awe-inspiring pitch with this creative relocation of business process offshoring operating cost comparison analysis expenses professional pdf bundle. Topics like expenses incurred, property rentals, labor, g and a expense, telecom can be discussed with this completely editable template. It is available for immediate download depending on the needs and requirements of the user.

Cloud Kitchen And Dine In Restaurant Sales Comparison Global Virtual Restaurant Infographics Pdf
The following slide highlights comparison of cloud kitchen and dine in restaurants based on gross food sales of previous years. It presents yearly sales growth of cloud kitchen and direct restaurant. Find highly impressive Cloud Kitchen And Dine In Restaurant Sales Comparison Global Virtual Restaurant Infographics Pdf on Slidegeeks to deliver a meaningful presentation. You can save an ample amount of time using these presentation templates. No need to worry to prepare everything from scratch because Slidegeeks experts have already done a huge research and work for you. You need to download Cloud Kitchen And Dine In Restaurant Sales Comparison Global Virtual Restaurant Infographics Pdf for your upcoming presentation. All the presentation templates are 100 percent editable and you can change the color and personalize the content accordingly. Download now. The following slide highlights comparison of cloud kitchen and dine in restaurants based on gross food sales of previous years. It presents yearly sales growth of cloud kitchen and direct restaurant.
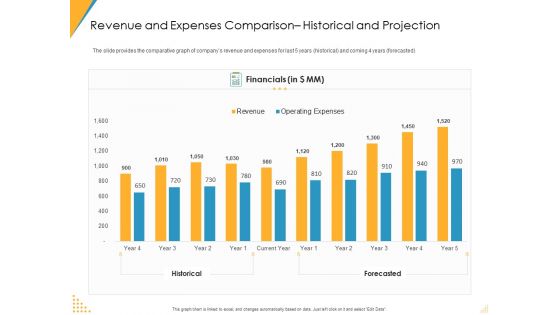
Revenue And Expenses Comparison Historical And Projection Ppt Ideas Slide Download PDF
The slide provides the comparative graph of companys revenue and expenses for last 5 years historical and coming 4 years forecasted. Deliver an awe-inspiring pitch with this creative revenue and expenses comparison historical and projection ppt ideas slide download pdf bundle. Topics like revenue, operating expenses, historical, forecasted can be discussed with this completely editable template. It is available for immediate download depending on the needs and requirements of the user.
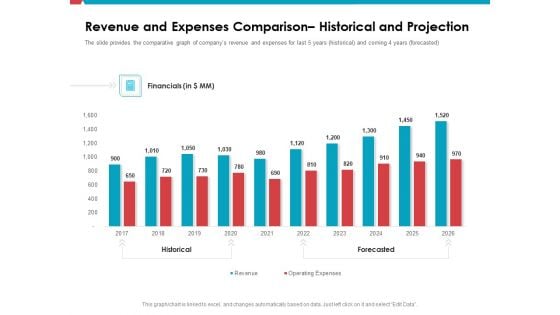
Revenue And Expenses Comparison Historical And Projection Ppt Show Format PDF
The slide provides the comparative graph of companys revenue and expenses for last 5 years historical and coming 4 years forecasted. Deliver an awe-inspiring pitch with this creative revenue and expenses comparison historical and projection ppt show format pdf bundle. Topics like historical, forecasted, financials can be discussed with this completely editable template. It is available for immediate download depending on the needs and requirements of the user.
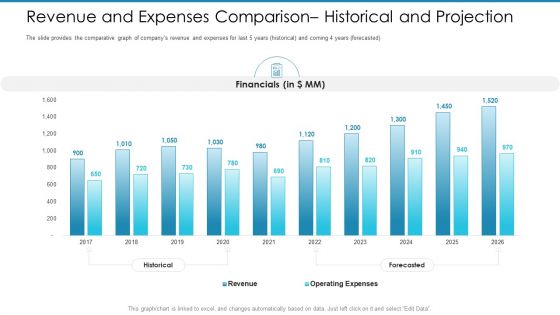
Post Initial Pubic Offering Market Pitch Deck Revenue And Expenses Comparison Historical And Projection Sample PDF
The slide provides the comparative graph of companys revenue and expenses for last 5 years historical and coming 4 years forecasted.Deliver an awe-inspiring pitch with this creative post initial pubic offering market pitch deck revenue and expenses comparison historical and projection sample pdf. bundle. Topics like financials, 2017 to 2026 can be discussed with this completely editable template. It is available for immediate download depending on the needs and requirements of the user.
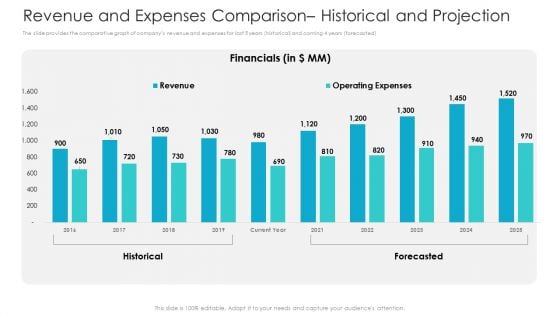
Private Equity Fundraising Pitch Deck Revenue And Expenses Comparison Historical And Projection Clipart PDF
The slide provides the comparative graph of companys revenue and expenses for last 5 years historical and coming 4 years forecasted. Deliver and pitch your topic in the best possible manner with this private equity fundraising pitch deck revenue and expenses comparison historical and projection clipart pdf. Use them to share invaluable insights on financials, revenue, operating expenses, 2016 to 2025 and impress your audience. This template can be altered and modified as per your expectations. So, grab it now.
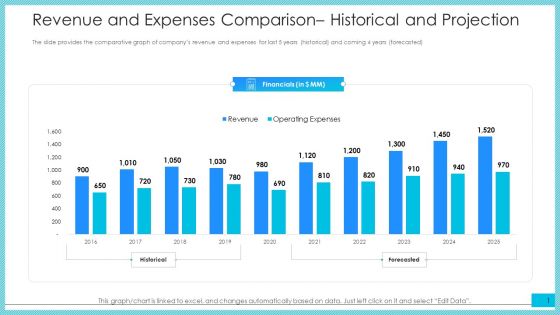
Revenue And Expenses Comparison Historical And Projection Ppt Summary Example Introduction PDF
The slide provides the comparative graph of companys revenue and expenses for last 5 years historical and coming 4 years forecasted.Deliver and pitch your topic in the best possible manner with this revenue and expenses comparison historical and projection ppt summary example introduction pdf. Use them to share invaluable insights on financials, 2016 to 2025, revenue, operating expenses and impress your audience. This template can be altered and modified as per your expectations. So, grab it now.
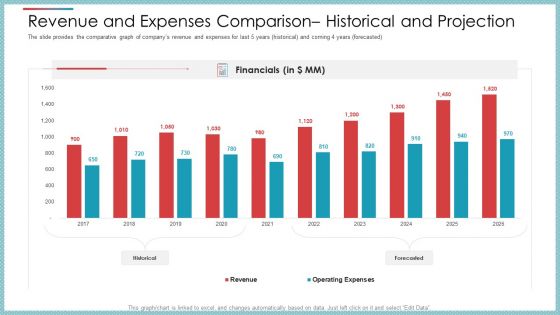
Revenue And Expenses Comparison Historical And Projection Ppt Styles Graphics Design PDF
The slide provides the comparative graph of companys revenue and expenses for last 5 years historical and coming 4 years forecasted.Deliver an awe-inspiring pitch with this creative revenue and expenses comparison historical and projection ppt styles graphics design pdf. bundle. Topics like financials, 2016 to 2025, revenue, operating expenses can be discussed with this completely editable template. It is available for immediate download depending on the needs and requirements of the user.
Revenue And Expenses Comparison Historical And Projection Ppt Show Slide Download PDF
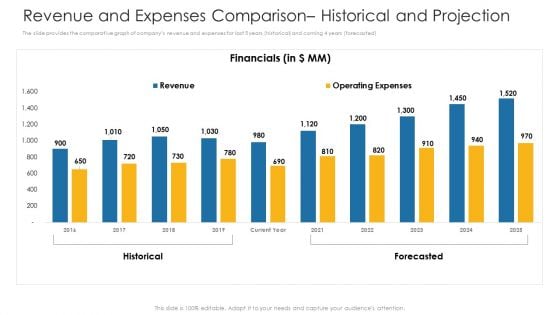
The slide provides the comparative graph of companys revenue and expenses for last 5 years historical and coming 4 years forecasted.Deliver and pitch your topic in the best possible manner with this revenue and expenses comparison historical and projection ppt show slide download pdf. Use them to share invaluable insights on financials, 2016 to 2025, revenue, operating expenses and impress your audience. This template can be altered and modified as per your expectations. So, grab it now.
Funding Pitch To Raise Funds From PE Revenue And Expenses Comparison Historical And Projection Summary PDF
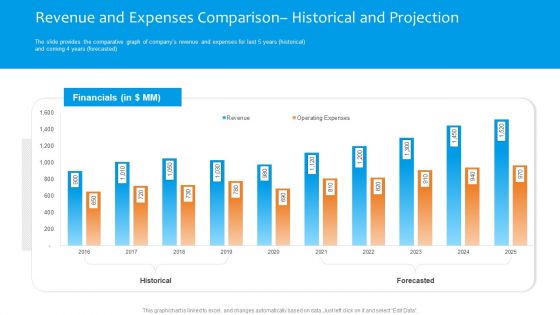
The slide provides the comparative graph of companys revenue and expenses for last 5 years historical and coming 4 years forecasted. Deliver an awe inspiring pitch with this creative funding pitch to raise funds from pe revenue and expenses comparison historical and projection summary pdf bundle. Topics like financials, historical, forecasted, revenue, expenses can be discussed with this completely editable template. It is available for immediate download depending on the needs and requirements of the user.
Cash Market Investor Deck Revenue And Expenses Comparison Historical And Projection Ppt Professional Information PDF
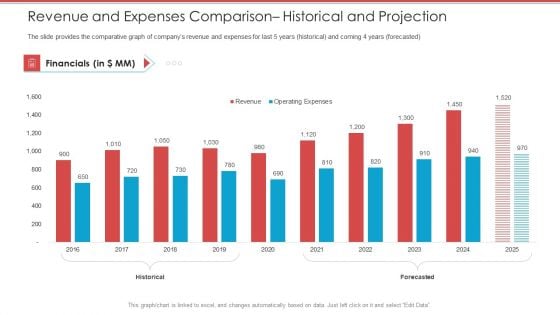
The slide provides the comparative graph of companys revenue and expenses for last 5 years historical and coming 4 years forecasted. Deliver and pitch your topic in the best possible manner with this cash market investor deck revenue and expenses comparison historical and projection ppt professional information pdf. Use them to share invaluable insights on financials, revenue, operating expenses, 2016 to 2025 and impress your audience. This template can be altered and modified as per your expectations. So, grab it now.
Revenue And Expenses Comparison Historical And Projection Ppt Layouts Grid PDF
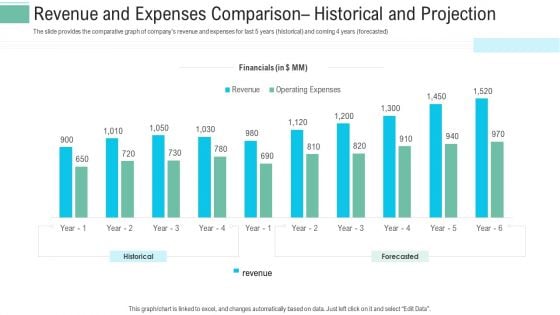
The slide provides the comparative graph of companys revenue and expenses for last 5 years historical and coming 4 years forecasted. Deliver and pitch your topic in the best possible manner with this revenue and expenses comparison historical and projection ppt layouts grid pdf. Use them to share invaluable insights on financials, operating expenses, revenue and impress your audience. This template can be altered and modified as per your expectations. So, grab it now.
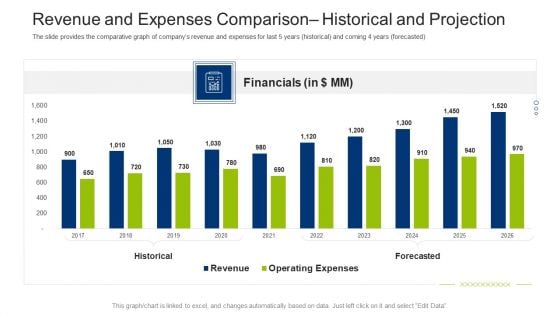
Investment Fundraising Pitch Deck From Stock Market Revenue And Expenses Comparison Historical And Projection Infographics PDF
The slide provides the comparative graph of companys revenue and expenses for last 5 years historical and coming 4 years forecasted. Deliver an awe inspiring pitch with this creative investment fundraising pitch deck from stock market revenue and expenses comparison historical and projection infographics pdf bundle. Topics like financials, historical, forecasted, revenue, expenses can be discussed with this completely editable template. It is available for immediate download depending on the needs and requirements of the user.
Revenue And Expenses Comparison Historical And Projection Ppt Icon Files PDF
The slide provides the comparative graph of companys revenue and expenses for last 5 years historical and coming 4 years forecasted.Deliver and pitch your topic in the best possible manner with this revenue and expenses comparison historical and projection ppt icon files pdf. Use them to share invaluable insights on financials, 2016 to 2025, revenue, operating expenses and impress your audience. This template can be altered and modified as per your expectations. So, grab it now.
Automobile Sales Scorecard Yoy Percentage Comparison For Auto Sales Icons PDF
This graph or chart is linked to excel, and changes automatically based on data. Just left click on it and select Edit Data.Deliver and pitch your topic in the best possible manner with this Automobile Sales Scorecard Yoy Percentage Comparison For Auto Sales Icons PDF. Use them to share invaluable insights on Electric Vehicle Full, Hybrid Electric Vehicle, Ybrid Electric Vehicle, 2020 TO 2021 and impress your audience. This template can be altered and modified as per your expectations. So, grab it now.
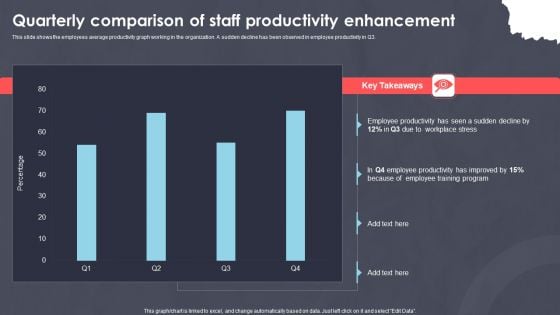
Quarterly Comparison Of Staff Productivity Enhancement Ppt PowerPoint Presentation Ideas Aids PDF
This slide shows the employees average productivity graph working in the organization. A sudden decline has been observed in employee productivity in Q3. Showcasing this set of slides titled Quarterly Comparison Of Staff Productivity Enhancement Ppt PowerPoint Presentation Ideas Aids PDF. The topics addressed in these templates are Employee Productivity, Sudden Decline, Workplace Stress. All the content presented in this PPT design is completely editable. Download it and make adjustments in color, background, font etc. as per your unique business setting.
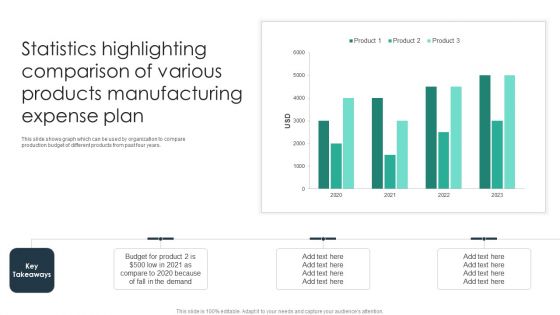
Statistics Highlighting Comparison Of Various Products Manufacturing Expense Plan Formats PDF
This slide shows graph which can be used by organization to compare production budget of different products from past four years. Pitch your topic with ease and precision using this Statistics Highlighting Comparison Of Various Products Manufacturing Expense Plan Formats PDF. This layout presents information on Budget For Product, Demand, Organization. It is also available for immediate download and adjustment. So, changes can be made in the color, design, graphics or any other component to create a unique layout.
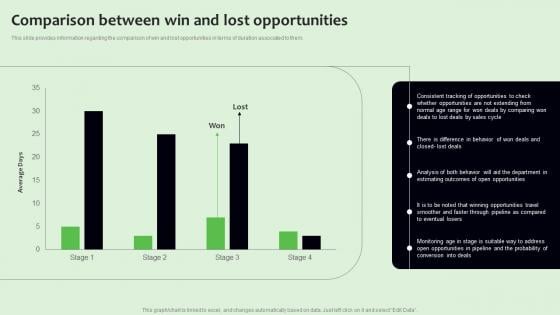
Comparison Between Win And Lost Opportunities Strategies To Manage Sales Funnel Slides Pdf
This slide provides information regarding the comparison of win and lost opportunities in terms of duration associated to them. Do you have an important presentation coming up Are you looking for something that will make your presentation stand out from the rest Look no further than Comparison Between Win And Lost Opportunities Strategies To Manage Sales Funnel Slides Pdf. With our professional designs, you can trust that your presentation will pop and make delivering it a smooth process. And with Slidegeeks, you can trust that your presentation will be unique and memorable. So why wait Grab Comparison Between Win And Lost Opportunities Strategies To Manage Sales Funnel Slides Pdf today and make your presentation stand out from the rest. This slide provides information regarding the comparison of win and lost opportunities in terms of duration associated to them.
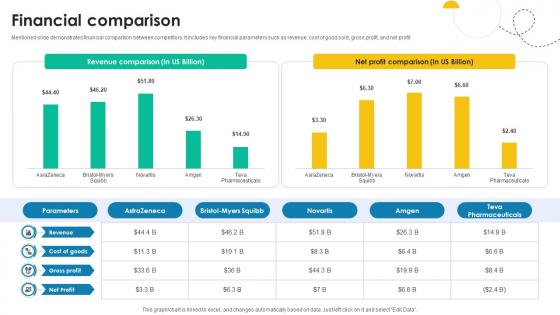
Financial Comparison Medical Research And Development Company Profile CP SS V
Mentioned slide demonstrates financial comparison between competitors. It includes key financial parameters such as revenue, cost of good sold, gross profit, and net profit. Are you in need of a template that can accommodate all of your creative concepts This one is crafted professionally and can be altered to fit any style. Use it with Google Slides or PowerPoint. Include striking photographs, symbols, depictions, and other visuals. Fill, move around, or remove text boxes as desired. Test out color palettes and font mixtures. Edit and save your work, or work with colleagues. Download Financial Comparison Medical Research And Development Company Profile CP SS V and observe how to make your presentation outstanding. Give an impeccable presentation to your group and make your presentation unforgettable. Mentioned slide demonstrates financial comparison between competitors. It includes key financial parameters such as revenue, cost of good sold, gross profit, and net profit.
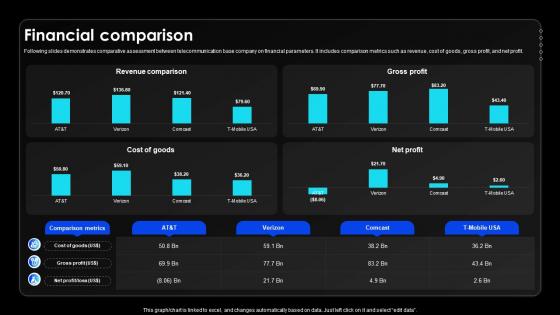
Financial Comparison Wireless Communication Services Provider Company Profile CP SS V
Following slides demonstrates comparative assessment between telecommunication base company on financial parameters. It includes comparison metrics such as revenue, cost of goods, gross profit, and net profit.If your project calls for a presentation, then Slidegeeks is your go-to partner because we have professionally designed, easy-to-edit templates that are perfect for any presentation. After downloading, you can easily edit Financial Comparison Wireless Communication Services Provider Company Profile CP SS V and make the changes accordingly. You can rearrange slides or fill them with different images. Check out all the handy templates Following slides demonstrates comparative assessment between telecommunication base company on financial parameters. It includes comparison metrics such as revenue, cost of goods, gross profit, and net profit.
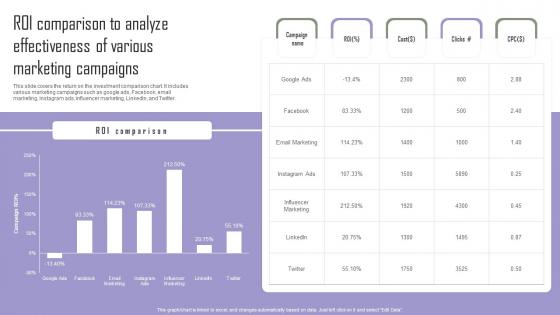
ROI Comparison To Analyze Implementing Marketing Tactics To Drive Graphics Pdf
This slide covers the return on the investment comparison chart. It includes various marketing campaigns such as google ads, Facebook, email marketing, Instagram ads, influencer marketing, LinkedIn, and Twitter. Are you in need of a template that can accommodate all of your creative concepts This one is crafted professionally and can be altered to fit any style. Use it with Google Slides or PowerPoint. Include striking photographs, symbols, depictions, and other visuals. Fill, move around, or remove text boxes as desired. Test out color palettes and font mixtures. Edit and save your work, or work with colleagues. Download ROI Comparison To Analyze Implementing Marketing Tactics To Drive Graphics Pdf and observe how to make your presentation outstanding. Give an impeccable presentation to your group and make your presentation unforgettable. This slide covers the return on the investment comparison chart. It includes various marketing campaigns such as google ads, Facebook, email marketing, Instagram ads, influencer marketing, LinkedIn, and Twitter.
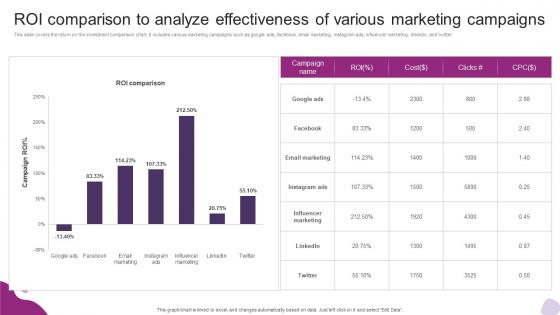
Roi Comparison To Analyze Effectiveness Of Various Powerful Marketing Techniques Strategy SS V
This slide covers the return on the investment comparison chart. It includes various marketing campaigns such as google ads, facebook, email marketing, instagram ads, influencer marketing, linkedin, and twitter. Are you in need of a template that can accommodate all of your creative concepts This one is crafted professionally and can be altered to fit any style. Use it with Google Slides or PowerPoint. Include striking photographs, symbols, depictions, and other visuals. Fill, move around, or remove text boxes as desired. Test out color palettes and font mixtures. Edit and save your work, or work with colleagues. Download Roi Comparison To Analyze Effectiveness Of Various Powerful Marketing Techniques Strategy SS V and observe how to make your presentation outstanding. Give an impeccable presentation to your group and make your presentation unforgettable. This slide covers the return on the investment comparison chart. It includes various marketing campaigns such as google ads, facebook, email marketing, instagram ads, influencer marketing, linkedin, and twitter.
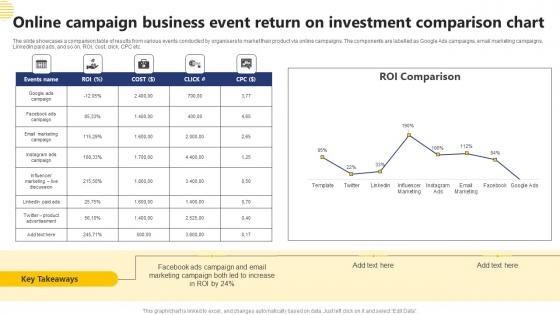
Online Campaign Business Event Return On Investment Comparison Chart Demonstration Pdf
The slide showcases a comparison table of results from various events conducted by organisers to market their product via online campaigns. The components are labelled as Google Ads campaigns, email marketing campaigns, LinkedIn paid ads, and so on. ROI, cost, click, CPC etc. Pitch your topic with ease and precision using this Online Campaign Business Event Return On Investment Comparison Chart Demonstration Pdf This layout presents information on Google Ads Campaign, Email Marketing Campaign It is also available for immediate download and adjustment. So, changes can be made in the color, design, graphics or any other component to create a unique layout. The slide showcases a comparison table of results from various events conducted by organisers to market their product via online campaigns. The components are labelled as Google Ads campaigns, email marketing campaigns, LinkedIn paid ads, and so on. ROI, cost, click, CPC etc.
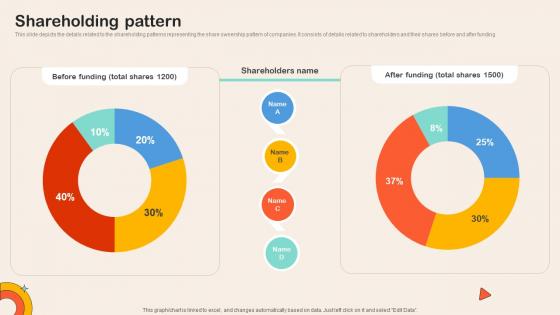
Shareholding Pattern Childcare Service Comparison Platform Investor Funding Elevator Pitch Deck
This slide depicts the details related to the shareholding patterns representing the share ownership pattern of companies. It consists of details related to shareholders and their shares before and after funding.This Shareholding Pattern Childcare Service Comparison Platform Investor Funding Elevator Pitch Deck is perfect for any presentation, be it in front of clients or colleagues. It is a versatile and stylish solution for organizing your meetings. The Shareholding Pattern Childcare Service Comparison Platform Investor Funding Elevator Pitch Deck features a modern design for your presentation meetings. The adjustable and customizable slides provide unlimited possibilities for acing up your presentation. Slidegeeks has done all the homework before launching the product for you. So, do not wait, grab the presentation templates today This slide depicts the details related to the shareholding patterns representing the share ownership pattern of companies. It consists of details related to shareholders and their shares before and after funding.
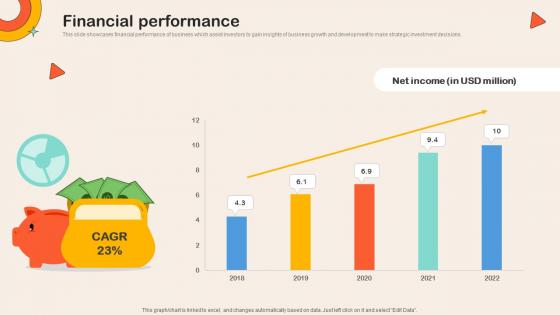
Financial Performance Childcare Service Comparison Platform Investor Funding Elevator Pitch Deck
This slide showcases financial performance of business which assist investors to gain insights of business growth and development to make strategic investment decisions. From laying roadmaps to briefing everything in detail, our templates are perfect for you. You can set the stage with your presentation slides. All you have to do is download these easy-to-edit and customizable templates. Financial Performance Childcare Service Comparison Platform Investor Funding Elevator Pitch Deck will help you deliver an outstanding performance that everyone would remember and praise you for. Do download this presentation today. This slide showcases financial performance of business which assist investors to gain insights of business growth and development to make strategic investment decisions.
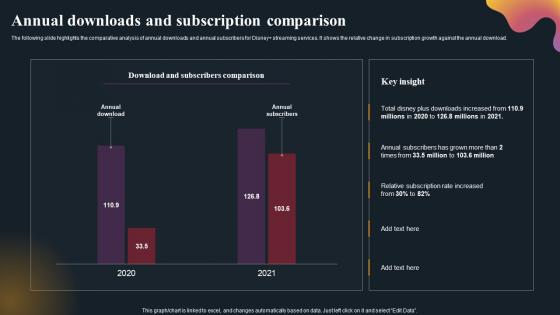
Annual Downloads And Subscription Comparison OTT Platform Company Outline Mockup Pdf
The following slide highlights the comparative analysis of annual downloads and annual subscribers for DisneyPlus streaming services. It shows the relative change in subscription growth against the annual download. Find a pre-designed and impeccable Annual Downloads And Subscription Comparison OTT Platform Company Outline Mockup Pdf The templates can ace your presentation without additional effort. You can download these easy-to-edit presentation templates to make your presentation stand out from others. So, what are you waiting for Download the template from Slidegeeks today and give a unique touch to your presentation. The following slide highlights the comparative analysis of annual downloads and annual subscribers for DisneyPlus streaming services. It shows the relative change in subscription growth against the annual download.
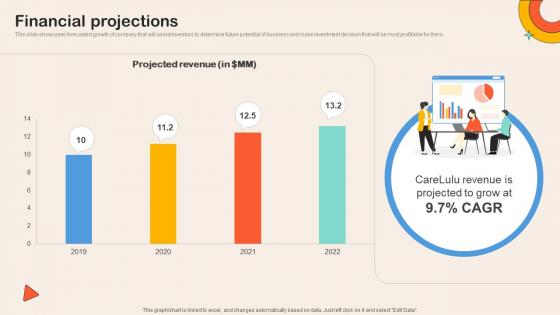
Financial Projections Childcare Service Comparison Platform Investor Funding Elevator Pitch Deck
This slide showcases forecasted growth of company that will assist investors to determine future potential of business and make investment decision that will be most profitable for them.Present like a pro with Financial Projections Childcare Service Comparison Platform Investor Funding Elevator Pitch Deck. Create beautiful presentations together with your team, using our easy-to-use presentation slides. Share your ideas in real-time and make changes on the fly by downloading our templates. So whether you are in the office, on the go, or in a remote location, you can stay in sync with your team and present your ideas with confidence. With Slidegeeks presentation got a whole lot easier. Grab these presentations today. This slide showcases forecasted growth of company that will assist investors to determine future potential of business and make investment decision that will be most profitable for them.
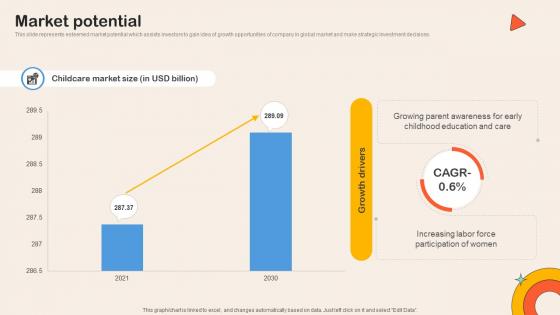
Market Potential Childcare Service Comparison Platform Investor Funding Elevator Pitch Deck
This slide represents esteemed market potential which assists investors to gain idea of growth opportunities of company in global market and make strategic investment decisions. Are you in need of a template that can accommodate all of your creative concepts This one is crafted professionally and can be altered to fit any style. Use it with Google Slides or PowerPoint. Include striking photographs, symbols, depictions, and other visuals. Fill, move around, or remove text boxes as desired. Test out color palettes and font mixtures. Edit and save your work, or work with colleagues. Download Market Potential Childcare Service Comparison Platform Investor Funding Elevator Pitch Deck and observe how to make your presentation outstanding. Give an impeccable presentation to your group and make your presentation unforgettable. This slide represents esteemed market potential which assists investors to gain idea of growth opportunities of company in global market and make strategic investment decisions.
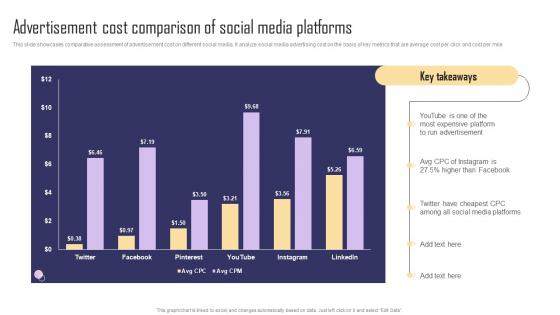
Advertisement Cost Comparison Of Social Media Paid Internet Marketing Strategy Information Pdf
This slide showcases comparative assessment of advertisement cost on different social media. It analyze social media advertising cost on the basis of key metrics that are average cost per click and cost per mile. Boost your pitch with our creative Advertisement Cost Comparison Of Social Media Paid Internet Marketing Strategy Information Pdf. Deliver an awe-inspiring pitch that will mesmerize everyone. Using these presentation templates you will surely catch everyones attention. You can browse the ppts collection on our website. We have researchers who are experts at creating the right content for the templates. So you do not have to invest time in any additional work. Just grab the template now and use them. This slide showcases comparative assessment of advertisement cost on different social media. It analyze social media advertising cost on the basis of key metrics that are average cost per click and cost per mile.
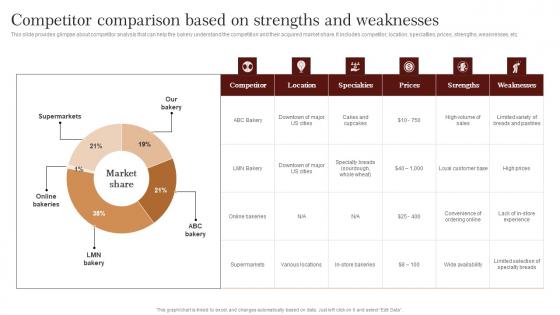
Competitor Comparison Based On Strengths Strategic Advertising Plan For Bakehouse Rules Pdf
This slide provides glimpse about competitor analysis that can help the bakery understand the competition and their acquired market share. It includes competitor, location, specialties, prices, strengths, weaknesses, etc.Boost your pitch with our creative Competitor Comparison Based On Strengths Strategic Advertising Plan For Bakehouse Rules Pdf. Deliver an awe inspiring pitch that will mesmerize everyone. Using these presentation templates you will surely catch everyones attention. You can browse the ppts collection on our website. We have researchers who are experts at creating the right content for the templates. So you do not have to invest time in any additional work. Just grab the template now and use them. This slide provides glimpse about competitor analysis that can help the bakery understand the competition and their acquired market share. It includes competitor, location, specialties, prices, strengths, weaknesses, etc.
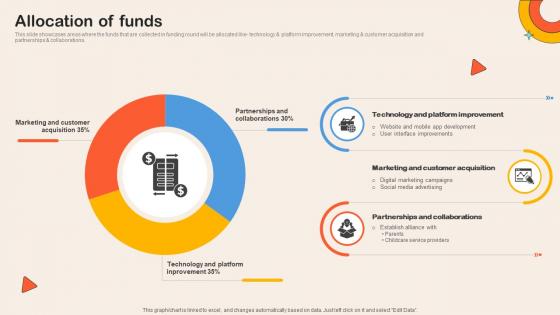
Allocation Of Funds Childcare Service Comparison Platform Investor Funding Elevator Pitch Deck
This slide showcases areas where the funds that are collected in funding round will be allocated like- technology and platform improvement, marketing and customer acquisition and partnerships and collaborations. Find a pre-designed and impeccable Allocation Of Funds Childcare Service Comparison Platform Investor Funding Elevator Pitch Deck. The templates can ace your presentation without additional effort. You can download these easy-to-edit presentation templates to make your presentation stand out from others. So, what are you waiting for Download the template from Slidegeeks today and give a unique touch to your presentation. This slide showcases areas where the funds that are collected in funding round will be allocated like- technology and platform improvement, marketing and customer acquisition and partnerships and collaborations.
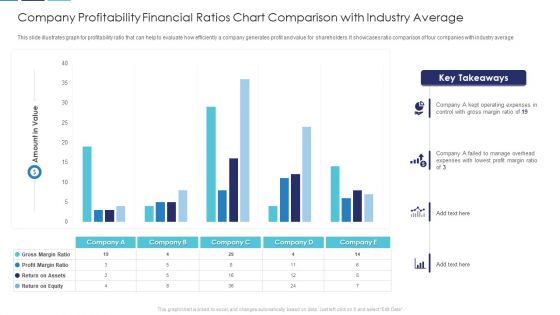
Company Profitability Financial Ratios Chart Comparison With Industry Average Download PDF
This slide illustrates graph for profitability ratio that can help to evaluate how efficiently a company generates profit and value for shareholders. It showcases ratio comparison of four companies with industry average Showcasing this set of slides titled company profitability financial ratios chart comparison with industry average download pdf. The topics addressed in these templates are company profitability financial ratios chart comparison with industry average. All the content presented in this PPT design is completely editable. Download it and make adjustments in color, background, font etc. as per your unique business setting.
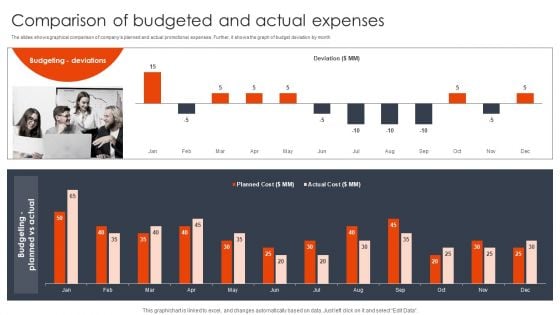
Comparison Of Budgeted And Actual Expenses Client Acquisition Techniques To Boost Sales Designs PDF
The slides shows graphical comparison of companys planned and actual promotional expenses. Further, it shows the graph of budget deviation by month. Create an editable Comparison Of Budgeted And Actual Expenses Client Acquisition Techniques To Boost Sales Designs PDF that communicates your idea and engages your audience. Whether you are presenting a business or an educational presentation, pre-designed presentation templates help save time. Comparison Of Budgeted And Actual Expenses Client Acquisition Techniques To Boost Sales Designs PDF is highly customizable and very easy to edit, covering many different styles from creative to business presentations. Slidegeeks has creative team members who have crafted amazing templates. So, go and get them without any delay.
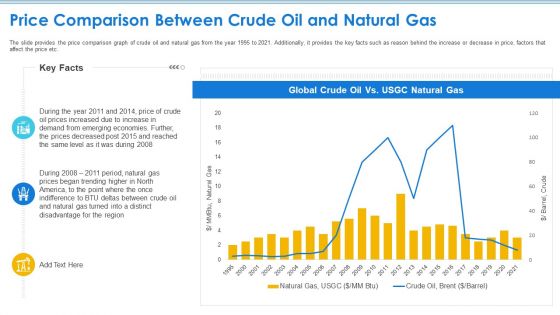
Case Competition Petroleum Sector Issues Price Comparison Between Crude Oil And Natural Gas Introduction PDF
The slide provides the price comparison graph of crude oil and natural gas from the year 1995 to 2021. Additionally, it provides the key facts such as reason behind the increase or decrease in price, factors that affect the price etc. Deliver an awe inspiring pitch with this creative case competition petroleum sector issues price comparison between crude oil and natural gas introduction pdf bundle. Topics like price comparison between crude oil and natural gas can be discussed with this completely editable template. It is available for immediate download depending on the needs and requirements of the user.
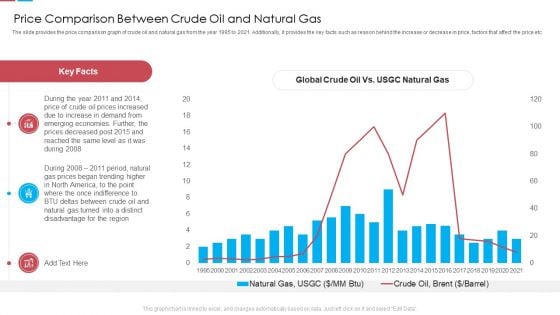
Price Comparison Between Crude Oil And Natural Gas Ppt Outline Background Image PDF
The slide provides the price comparison graph of crude oil and natural gas from the year 1995 to 2021. Additionally, it provides the key facts such as reason behind the increase or decrease in price, factors that affect the price etc. Deliver an awe inspiring pitch with this creative price comparison between crude oil and natural gas ppt outline background image pdf bundle. Topics like price comparison between crude oil and natural gas can be discussed with this completely editable template. It is available for immediate download depending on the needs and requirements of the user.
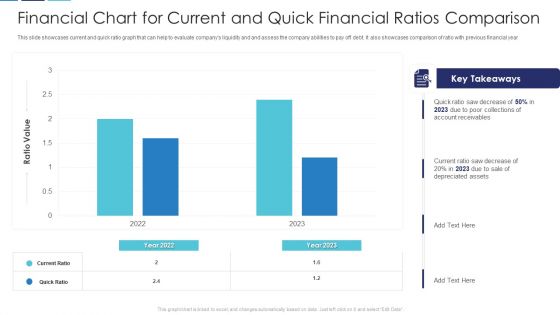
Financial Chart For Current And Quick Financial Ratios Comparison Brochure PDF
This slide showcases current and quick ratio graph that can help to evaluate companys liquidity and and assess the company abilities to pay off debt. It also showcases comparison of ratio with previous financial year Pitch your topic with ease and precision using this financial chart for current and quick financial ratios comparison brochure pdf. This layout presents information on financial chart for current and quick financial ratios comparison. It is also available for immediate download and adjustment. So, changes can be made in the color, design, graphics or any other component to create a unique layout.
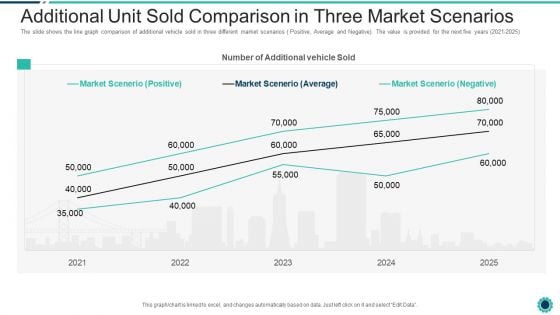
Declining Of A Motor Vehicle Company Additional Unit Sold Comparison In Three Market Scenarios Topics PDF
The slide shows the line graph comparison of additional vehicle sold in three different market scenarios Positive, Average and Negative. The value is provided for the next five years 2021 2025. Deliver an awe inspiring pitch with this creative declining of a motor vehicle company additional unit sold comparison in three market scenarios topics pdf bundle. Topics like market scenarios positive, average, negative can be discussed with this completely editable template. It is available for immediate download depending on the needs and requirements of the user.
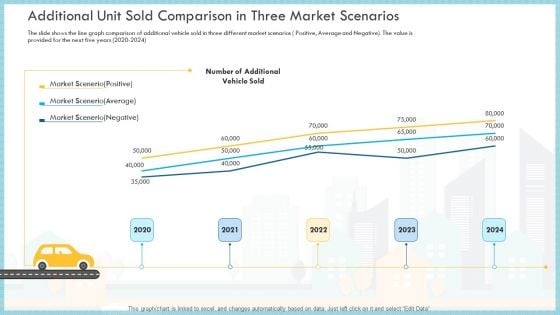
Additional Unit Sold Comparison In Three Market Scenarios Sold Themes PDF
The slide shows the line graph comparison of additional vehicle sold in three different market scenarios Positive, Average and Negative. The value is provided for the next five years 2020 to 2024 Deliver an awe inspiring pitch with this creative additional unit sold comparison in three market scenarios sold themes pdf bundle. Topics like market scenario positive, market scenario average, market scenario negative can be discussed with this completely editable template. It is available for immediate download depending on the needs and requirements of the user.
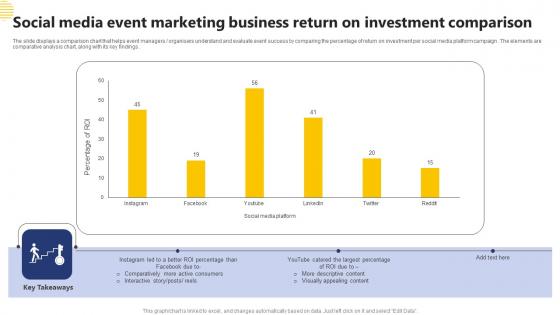
Social Media Event Marketing Business Return On Investment Comparison Microsoft Pdf
The slide displays a comparison chart that helps event managers organisers understand and evaluate event success by comparing the percentage of return on investment per social media platform campaign. The elements are comparative analysis chart, along with its key findings. Showcasing this set of slides titled Social Media Event Marketing Business Return On Investment Comparison Microsoft Pdf The topics addressed in these templates are Social Media Event, Marketing Business, Investment Comparison All the content presented in this PPT design is completely editable. Download it and make adjustments in color, background, font etc. as per your unique business setting. The slide displays a comparison chart that helps event managers organisers understand and evaluate event success by comparing the percentage of return on investment per social media platform campaign. The elements are comparative analysis chart, along with its key findings.
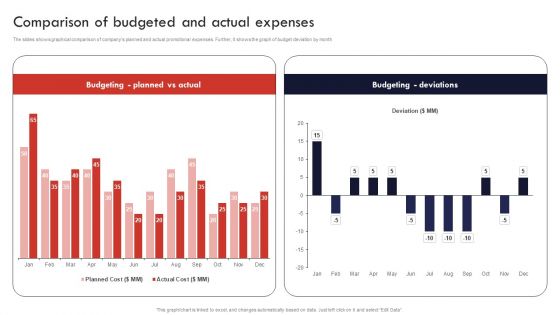
Product And Services Promotion Comparison Of Budgeted And Actual Expenses Template PDF
The slides shows graphical comparison of companys planned and actual promotional expenses. Further, it shows the graph of budget deviation by month. Make sure to capture your audiences attention in your business displays with our gratis customizable Product And Services Promotion Comparison Of Budgeted And Actual Expenses Template PDF. These are great for business strategies, office conferences, capital raising or task suggestions. If you desire to acquire more customers for your tech business and ensure they stay satisfied, create your own sales presentation with these plain slides.
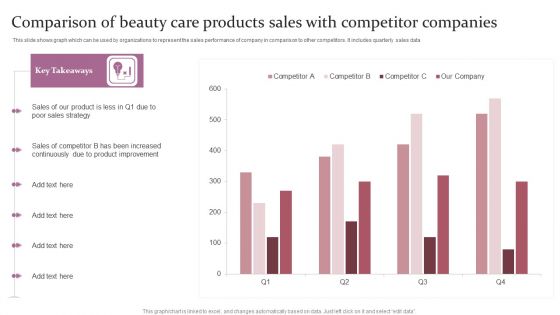
Comparison Of Beauty Care Products Sales With Competitor Companies Ppt Slides Samples PDF
This slide shows graph which can be used by organizations to represent the sales performance of company in comparison to other competitors. It includes quarterly sales data Showcasing this set of slides titled Comparison Of Beauty Care Products Sales With Competitor Companies Ppt Slides Samples PDF. The topics addressed in these templates are Our Product, Poor Sales Strategy, Product Improvement. All the content presented in this PPT design is completely editable. Download it and make adjustments in color, background, font etc. as per your unique business setting.


 Continue with Email

 Home
Home


