Comparison Chart
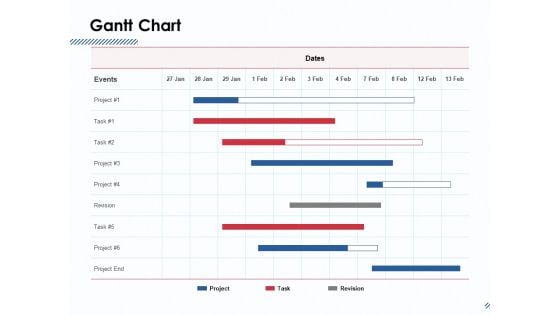
Gantt Chart Ppt PowerPoint Presentation Infographic Template Influencers
Make a highly optimized project management report using this content-ready Gantt Chart PPT Diagram. Effortless yet very clear, this layout proves a useful tool to present the professional details of a task or activity. Showcase the activities and allotted time to the business executives with this Gantt Chart PowerPoint theme. List down the column tasks in various timeframes and the activities associated with each of them here. Further, plot time allocation for various tasks, monitor their actual time and make comparisons to interpret the final progress with this well-structured Gantt Chart Excel Template. You can add all the significant details of a particular project in this chart and showcase it to all the project members so that they can participate in the overall development. Not only this but also our PPT template can help you showcase the work breakdown structure of your project.
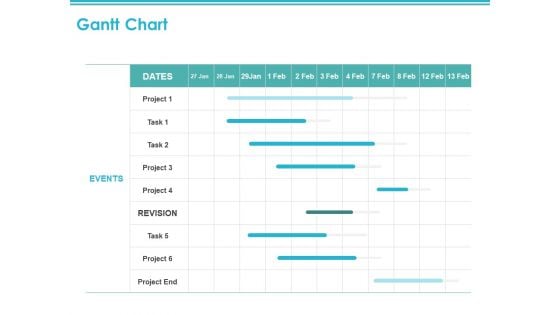
Gantt Chart Events Ppt PowerPoint Presentation Portfolio Graphics
Make a highly optimized project management report using this content-ready Gantt Chart PPT Diagram. Effortless yet very clear, this layout proves a useful tool to present the professional details of a task or activity. Showcase the activities and allotted time to the business executives with this Gantt Chart PowerPoint theme. List down the column tasks in various timeframes and the activities associated with each of them here. Further, plot time allocation for various tasks, monitor their actual time and make comparisons to interpret the final progress with this well-structured Gantt Chart Excel Template. You can add all the significant details of a particular project in this chart and showcase it to all the project members so that they can participate in the overall development. Not only this but also our PPT template can help you showcase the work breakdown structure of your project.
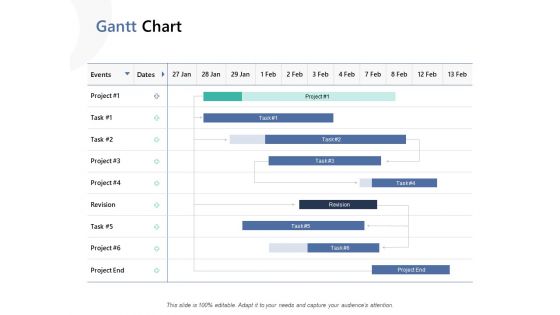
Gantt Chart Ppt PowerPoint Presentation Model Design Inspiration
Make a highly optimized project management report using this content-ready Gantt Chart PPT Diagram. Effortless yet very clear, this layout proves a useful tool to present the professional details of a task or activity. Showcase the activities and allotted time to the business executives with this Gantt Chart PowerPoint theme. List down the column tasks in various timeframes and the activities associated with each of them here. Further, plot time allocation for various tasks, monitor their actual time and make comparisons to interpret the final progress with this well-structured Gantt Chart Excel Template. You can add all the significant details of a particular project in this chart and showcase it to all the project members so that they can participate in the overall development. Not only this but also our PPT template can help you showcase the work breakdown structure of your project.
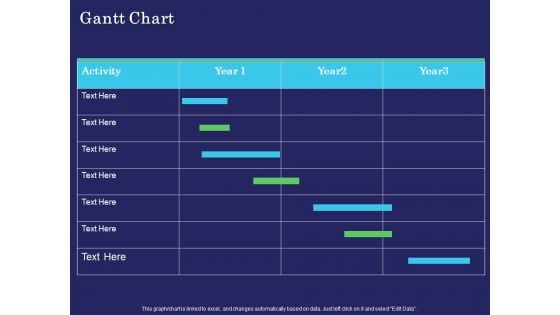
Business Coaching Gantt Chart Ppt PowerPoint Presentation Layouts Files PDF
Make a highly optimized project management report using this content-ready Gantt Chart PPT Diagram. Effortless yet very clear, this layout proves a useful tool to present the professional details of a task or activity. Showcase the activities and allotted time to the business executives with this Gantt Chart PowerPoint theme. List down the column tasks in various timeframes and the activities associated with each of them here. Further, plot time allocation for various tasks, monitor their actual time and make comparisons to interpret the final progress with this well-structured Gantt Chart Excel Template. You can add all the significant details of a particular project in this chart and showcase it to all the project members so that they can participate in the overall development. Not only this but also our PPT template can help you showcase the work breakdown structure of your project.
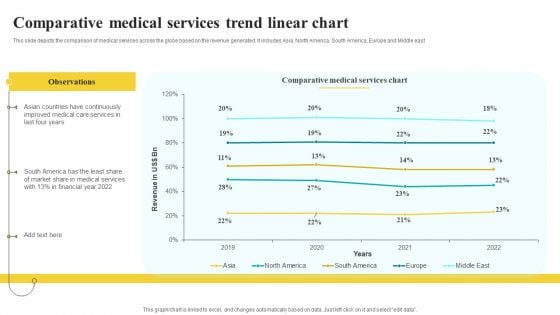
Comparative Medical Services Trend Linear Chart Mockup PDF
This slide depicts the comparison of medical services across the globe based on the revenue generated. It includes Asia, North America, South America, Europe and Middle east Showcasing this set of slides titled Comparative Medical Services Trend Linear Chart Mockup PDF. The topics addressed in these templates are Observations, Comparative Medical Services, Linear Chart. All the content presented in this PPT design is completely editable. Download it and make adjustments in color, background, font etc. as per your unique business setting.
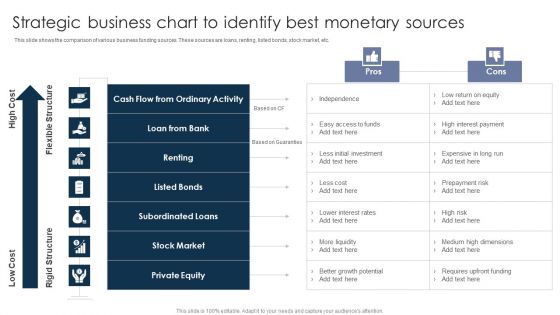
Strategic Business Chart To Identify Best Monetary Sources Microsoft PDF
This slide shows the comparison of various business funding sources. These sources are loans, renting, listed bonds, stock market, etc. Showcasing this set of slides titled Strategic Business Chart To Identify Best Monetary Sources Microsoft PDF. The topics addressed in these templates are Loan From Bank, Renting, Listed Bonds. All the content presented in this PPT design is completely editable. Download it and make adjustments in color, background, font etc. as per your unique business setting.
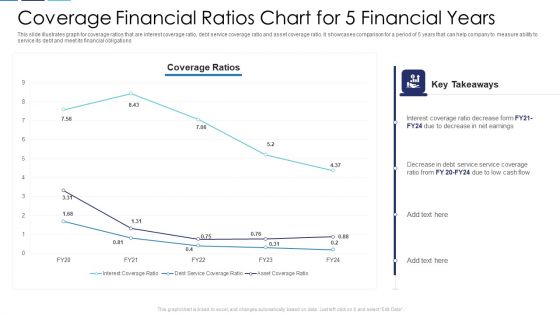
Coverage Financial Ratios Chart For 5 Financial Years Themes PDF
This slide illustrates graph for coverage ratios that are interest coverage ratio, debt service coverage ratio and asset coverage ratio. It showcases comparison for a period of 5 years that can help company to measure ability to service its debt and meet its financial obligations Showcasing this set of slides titled coverage financial ratios chart for 5 financial years themes pdf. The topics addressed in these templates are coverage financial ratios chart for 5 financial years. All the content presented in this PPT design is completely editable. Download it and make adjustments in color, background, font etc. as per your unique business setting.
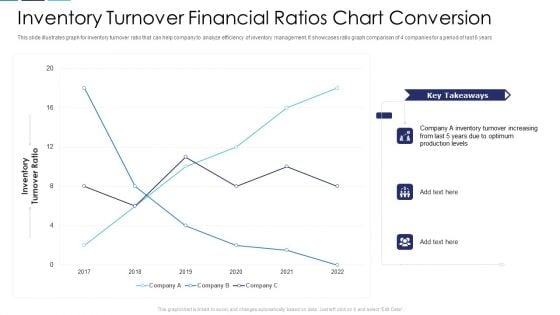
Inventory Turnover Financial Ratios Chart Conversion Portrait PDF
This slide illustrates graph for inventory turnover ratio that can help company to analyze efficiency of inventory management. It showcases ratio graph comparison of 4 companies for a period of last 6 years Pitch your topic with ease and precision using this inventory turnover financial ratios chart conversion portrait pdf. This layout presents information on inventory turnover financial ratios chart conversion. It is also available for immediate download and adjustment. So, changes can be made in the color, design, graphics or any other component to create a unique layout.
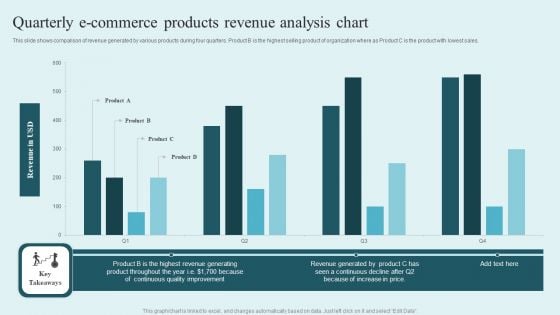
Quarterly E Commerce Products Revenue Analysis Chart Guidelines PDF
This slide shows comparison of revenue generated by various products during four quarters. Product B is the highest selling product of organization where as Product C is the product with lowest sales. Showcasing this set of slides titled Quarterly E Commerce Products Revenue Analysis Chart Guidelines PDF. The topics addressed in these templates are Revenue USD, Product, Continuous Quality Improvement. All the content presented in this PPT design is completely editable. Download it and make adjustments in color, background, font etc. as per your unique business setting.

Price Catalogue Chart For Supplier Services Assessment Inspiration PDF
This slide showcases price catalogue chart that can help organization to make comparative assessment of transportation and warehousing costs of different suppliers. It also outlines cost per unit comparison of raw materials of Showcasing this set of slides titled price catalogue chart for supplier services assessment inspiration pdf. The topics addressed in these templates are price catalogue chart for supplier services assessment. All the content presented in this PPT design is completely editable. Download it and make adjustments in color, background, font etc. as per your unique business setting.
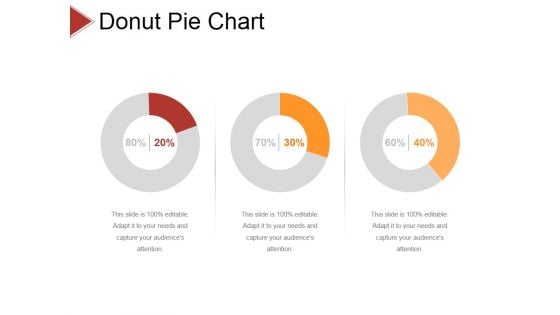
Donut Pie Chart Ppt PowerPoint Presentation Infographic Template Diagrams
This is a donut pie chart ppt powerpoint presentation infographic template diagrams. This is a three stage process. The stages in this process are business, strategy, analysis, pretention, comparison.
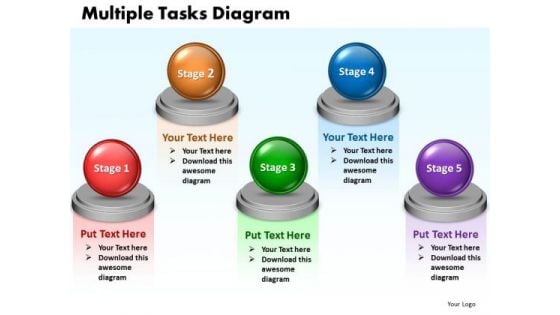
Ppt Multiple Tasks Chart 5 Stages PowerPoint Templates 2003
PPT multiple tasks chart 5 stages powerpoint templates 2003 0812-This diagram will help you to organize information, organize and run effective meetings, and generate useful member contributions.-PPT multiple tasks chart 5 stages powerpoint templates 2003 0812-3d, Abstract, Backgrounds, Ball, Business, Choice, Comparison, Concept, Descriptive, Equilibrium, Grow, Illustrations, Instrument, Measurement, Metallic, Part, Partnership, Pattern, Progress, Reflections, Scales, Several, Sphere, Strategy, Success Start driving productivity gains with our Ppt Multiple Tasks Chart 5 Stages PowerPoint Templates 2003. They will make you look good.
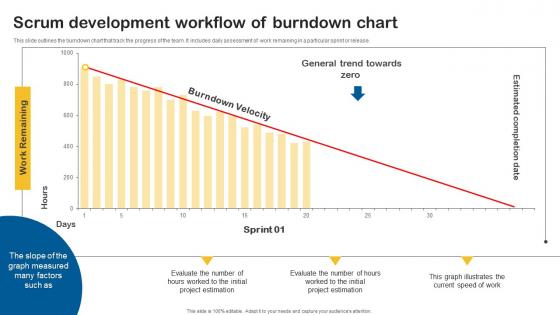
Scrum Development Workflow Of Burndown Chart Designs Pdf
This slide outlines the burndown chart that track the progress of the team. It includes daily assessment of work remaining in a particular sprint or release.Pitch your topic with ease and precision using this Scrum Development Workflow Of Burndown Chart Designs Pdf This layout presents information on Project Estimation, General Trend Towards, Graph Measured It is also available for immediate download and adjustment. So, changes can be made in the color, design, graphics or any other component to create a unique layout. This slide outlines the burndown chart that track the progress of the team. It includes daily assessment of work remaining in a particular sprint or release.
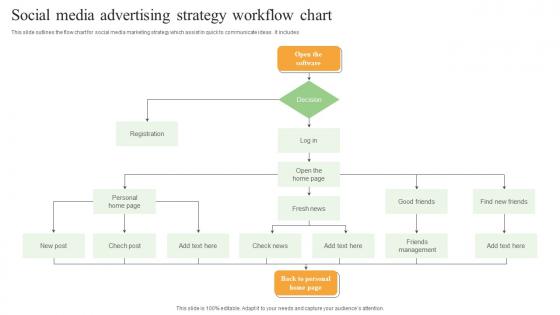
Social Media Advertising Strategy Workflow Chart Inspiration Pdf
This slide outlines the flow chart for social media marketing strategy which assist in quick to communicate ideas . It includes. Pitch your topic with ease and precision using this Social Media Advertising Strategy Workflow Chart Inspiration Pdf. This layout presents information on Decision, Registration, Fresh News. It is also available for immediate download and adjustment. So, changes can be made in the color, design, graphics or any other component to create a unique layout. This slide outlines the flow chart for social media marketing strategy which assist in quick to communicate ideas . It includes.
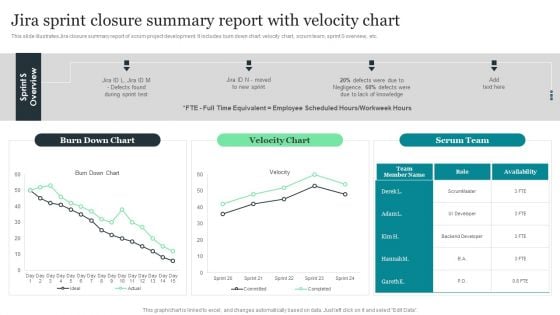
Jira Sprint Closure Summary Report With Velocity Chart Designs PDF
This slide illustrates Jira closure summary report of scrum project development. It includes burn down chart, velocity chart, scrum team, sprint S overview, etc. Pitch your topic with ease and precision using this Jira Sprint Closure Summary Report With Velocity Chart Designs PDF. This layout presents information on Jira Sprint Closure, Summary Report, Velocity Chart. It is also available for immediate download and adjustment. So, changes can be made in the color, design, graphics or any other component to create a unique layout.
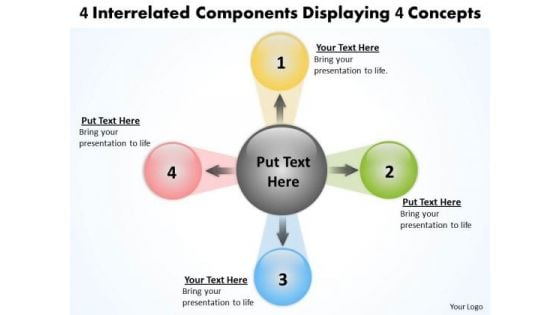
4 Interrelated Components Displaying Concepts Circular Flow Chart PowerPoint Slides
We present our 4 interrelated components displaying concepts Circular Flow Chart PowerPoint Slides.Download our Circle Charts PowerPoint Templates because your brain is always churning out ideas like cogs in a wheel. Download and present our Abstract PowerPoint Templates because you have what it takes to grow. Download and present our Arrows PowerPoint Templates because this slide illuminates the spiritual brilliance of Jesus and showers the love for mankind he showed even while being crucified. Present our Business PowerPoint Templates because the great Bald headed Eagle embodies your personality. the eagle eye to seize upon the smallest of opportunities. Present our Flow Charts PowerPoint Templates because your quicksilver ideas are the arrows in your quiver.Use these PowerPoint slides for presentations relating to 3d, architecture, blue, business, chat, chatting, communication, community, component, computer, concept, connection, contact, digital, display, equipment, global, globalization, group, information, internet, interrelation, isolated, link, media, medium, network,organization, scope, social, society, sphere, spherical, structure, symbol, technology, telecommunication, television, union, unity, virtual, web, white, www. The prominent colors used in the PowerPoint template are Red, Yellow, Green. Presenters tell us our 4 interrelated components displaying concepts Circular Flow Chart PowerPoint Slides are Charming. You can be sure our component PowerPoint templates and PPT Slides are Detailed. Professionals tell us our 4 interrelated components displaying concepts Circular Flow Chart PowerPoint Slides are Quaint. People tell us our business PowerPoint templates and PPT Slides are Spiffy. People tell us our 4 interrelated components displaying concepts Circular Flow Chart PowerPoint Slides are Elevated. Professionals tell us our blue PowerPoint templates and PPT Slides are Cheerful. Everyone can with our 4 Interrelated Components Displaying Concepts Circular Flow Chart PowerPoint Slides. They aim them in the correct direction.
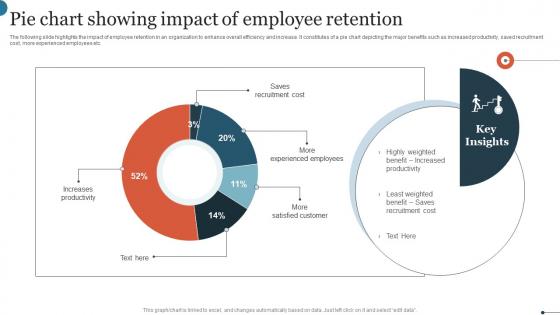
Pie Chart Showing Impact Of Employee Retention Mockup Pdf
The following slide highlights the impact of employee retention in an organization to enhance overall efficiency and increase. It constitutes of a pie chart depicting the major benefits such as increased productivity, saved recruitment cost, more experienced employees etc. Showcasing this set of slides titled Pie Chart Showing Impact Of Employee Retention Mockup Pdf. The topics addressed in these templates are Saves Recruitment Cost, More Experienced Employees, More Satisfied Customer. All the content presented in this PPT design is completely editable. Download it and make adjustments in color, background, font etc. as per your unique business setting. The following slide highlights the impact of employee retention in an organization to enhance overall efficiency and increase. It constitutes of a pie chart depicting the major benefits such as increased productivity, saved recruitment cost, more experienced employees etc.
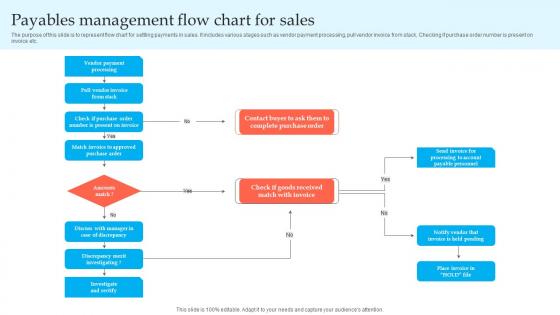
Payables Management Flow Chart For Sales Themes Pdf
The purpose of this slide is to represent flow chart for settling payments in sales. It includes various stages such as vendor payment processing, pull vendor invoice from stack, Checking if purchase order number is present on invoice etc.Pitch your topic with ease and precision using this Payables Management Flow Chart For Sales Themes Pdf This layout presents information on Payable Personnel, Processing Account, Notify Vendor It is also available for immediate download and adjustment. So, changes can be made in the color, design, graphics or any other component to create a unique layout. The purpose of this slide is to represent flow chart for settling payments in sales. It includes various stages such as vendor payment processing, pull vendor invoice from stack, Checking if purchase order number is present on invoice etc.
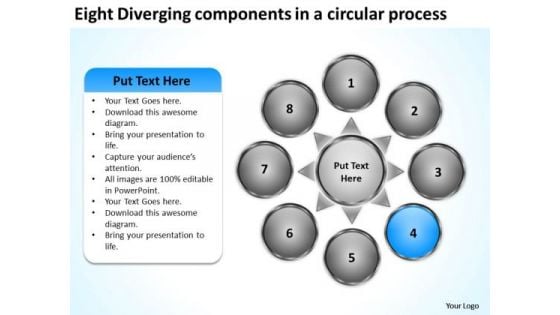
Eight Diverging Components A Circular Process Pie Chart PowerPoint Slides
We present our eight diverging components a circular process Pie Chart PowerPoint Slides.Download our Business PowerPoint Templates because this is the unerring accuracy in reaching the target. the effortless ability to launch into flight. Present our Circle Charts PowerPoint Templates because you have the entire picture in mind. Use our Arrows PowerPoint Templates because this template helps you to put your finger on the pulse of your business and sense the need to re-align a bit. Use our Shapes PowerPoint Templates because this can explain the various related aspects of these varied tracks and how they will, on hitting their own targets, cumulatively contribute to hitting GOLD. Download our Flow charts PowerPoint Templates because this is an appropriate layout to convince your team that they have the ability to score a tEN every time.Use these PowerPoint slides for presentations relating to Arrows, blank, business, central, centralized, chart, circle, circular, circulation concept, conceptual, converging, design, diagram, empty, executive, icon, idea illustration, management, map, mapping, moa, model, numbers, organization outwards, pointing, procedure, process, radial, radiating, relationship, resource sequence, sequential, seven, square, strategy, template. The prominent colors used in the PowerPoint template are Blue, Gray, White. Presenters tell us our eight diverging components a circular process Pie Chart PowerPoint Slides will save the presenter time. Presenters tell us our business PowerPoint templates and PPT Slides are Zippy. PowerPoint presentation experts tell us our eight diverging components a circular process Pie Chart PowerPoint Slides are Appealing. We assure you our chart PowerPoint templates and PPT Slides are Pleasant. Customers tell us our eight diverging components a circular process Pie Chart PowerPoint Slides are Gorgeous. People tell us our business PowerPoint templates and PPT Slides are the best it can get when it comes to presenting. Discover new faith with our Eight Diverging Components A Circular Process Pie Chart PowerPoint Slides. Let extra dimensions in you emerge.
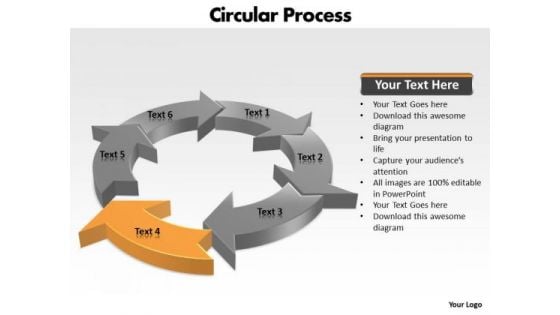
Ppt Components Of Circular PowerPoint Menu Template Process Chart Templates
PPT components of circular powerpoint menu template process chart Templates-This circular flow diagram can helps to illustrate the economic exchange that takes place in the building of wealth. Clarity of thought has been the key to your growth. Use our template to illustrate your ability.-PPT components of circular powerpoint menu template process chart Templates-Arrow, Chart, Circular, Color, Colorful, Connect, Connection, Design, Diagram, Finance, Graphic, Group, Growth, Icon, Illustration, Marketing, Pieces, Process, Recycle, Recycling, Round, Set, Strategy, Symbol, Wheel Consult experts with our Ppt Components Of Circular PowerPoint Menu Template Process Chart Templates. Download without worries with our money back guaranteee.
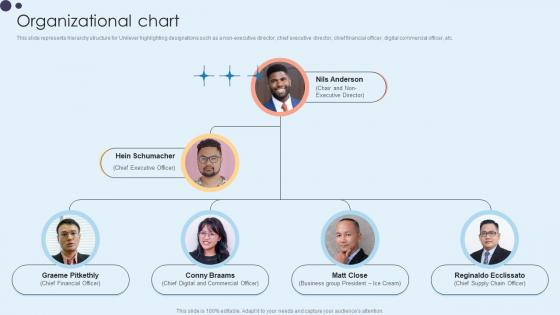
Organizational Chart Home Care Solutions Company Profile CP SS V
This slide represents hierarchy structure for Unilever highlighting designations such as a non-executive director, chief executive director, chief financial officer, digital commercial officer, etc.Presenting this PowerPoint presentation, titled Organizational Chart Home Care Solutions Company Profile CP SS V, with topics curated by our researchers after extensive research. This editable presentation is available for immediate download and provides attractive features when used. Download now and captivate your audience. Presenting this Organizational Chart Home Care Solutions Company Profile CP SS V. Our researchers have carefully researched and created these slides with all aspects taken into consideration. This is a completely customizable Organizational Chart Home Care Solutions Company Profile CP SS V that is available for immediate downloading. Download now and make an impact on your audience. Highlight the attractive features available with our PPTs. This slide represents hierarchy structure for Unilever highlighting designations such as a non-executive director, chief executive director, chief financial officer, digital commercial officer, etc.
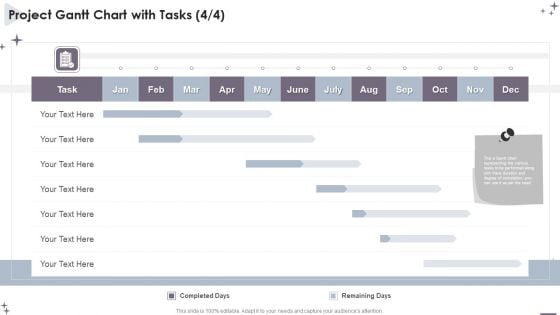
Project Administration Bundle Project Gantt Chart With Tasks Structure PDF
Plan, track and synchronize the most important tasks of any project with this exemplary Project Administration Bundle Project Gantt Chart With Tasks Structure PDF. This lucrative template can be used to manage the project efficiently. You can enter all the vital components of the project like the start date, duration, and status of each task to keep the owners accountability in check. Create a highly proficient scheduling plan and measure its progress with this elaborative layout. In addition, you can add your activities in the taskbar included in this template and edit it to handle your project effectively. This template is ideal for project management, business plans, student projects, and assignments. So download and captivate your audience.
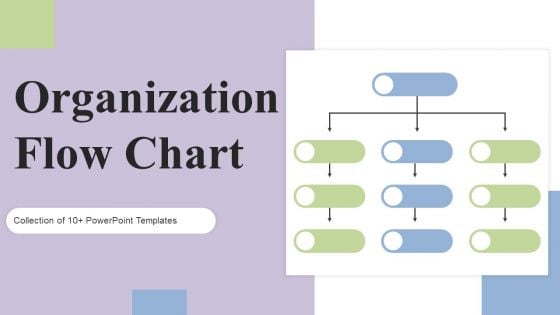
Organization Flow Chart Ppt PowerPoint Presentation Complete Deck With Slides
Boost your confidence and team morale with this well structured Organization Flow Chart Ppt PowerPoint Presentation Complete Deck With Slides. This prefabricated set gives a voice to your presentation because of its well researched content and graphics. Our experts have added all the components very carefully, thus helping you deliver great presentations with a single click. Not only that, it contains a set of seventeen slides that are designed using the right visuals, graphics, etc. Various topics can be discussed, and effective brainstorming sessions can be conducted using the wide variety of slides added in this complete deck. Apart from this, our PPT design contains clear instructions to help you restructure your presentations and create multiple variations. The color, format, design anything can be modified as deemed fit by the user. Not only this, it is available for immediate download. So, grab it now.
Scrum Kpis With Sprint Burndown Chart Ppt Icon Elements PDF
This slide illustrates scrum key performance indicators for individual sprints. It includes tasks, story points, bugs, burndown charts, statistics etc. Pitch your topic with ease and precision using this Scrum Kpis With Sprint Burndown Chart Ppt Icon Elements PDF. This layout presents information on Burndown Chart, Story Points, Cost, Bugs. It is also available for immediate download and adjustment. So, changes can be made in the color, design, graphics or any other component to create a unique layout.
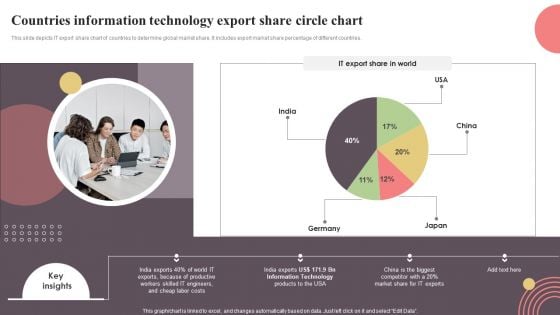
Countries Information Technology Export Share Circle Chart Inspiration PDF
This slide depicts IT export share chart of countries to determine global market share. It includes export market share percentage of different countries. Pitch your topic with ease and precision using this Countries Information Technology Export Share Circle Chart Inspiration PDF. This layout presents information on Countries Information Technology, Export Share Circle Chart. It is also available for immediate download and adjustment. So, changes can be made in the color, design, graphics or any other component to create a unique layout.
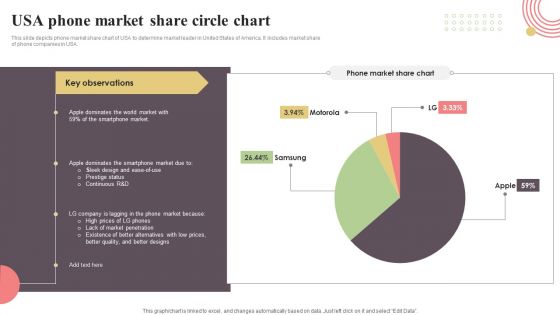
USA Phone Market Share Circle Chart Sample PDF
This slide depicts phone market share chart of USA to determine market leader in United States of America. It includes market share of phone companies in USA. Pitch your topic with ease and precision using this USA Phone Market Share Circle Chart Sample PDF. This layout presents information on USA Phone Market, Share Circle Chart. It is also available for immediate download and adjustment. So, changes can be made in the color, design, graphics or any other component to create a unique layout.
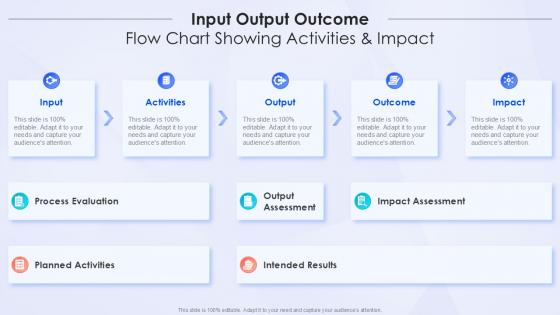
Input Output Outcome Flow Chart Showing Activities And Impact
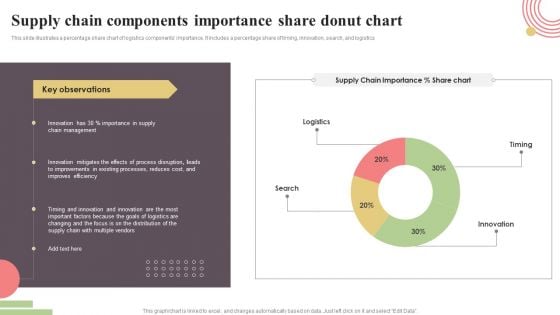
Supply Chain Components Importance Share Donut Chart Rules PDF
This slide illustrates a percentage share chart of logistics components importance. It includes a percentage share of timing, innovation, search, and logistics. Showcasing this set of slides titled Supply Chain Components Importance Share Donut Chart Rules PDF. The topics addressed in these templates are Timing, Innovation, Search, Logistics. All the content presented in this PPT design is completely editable. Download it and make adjustments in color, background, font etc. as per your unique business setting.
Consulting PowerPoint Template Compare And Contrast Chart Business Strategy Slides
When in doubt use our consulting PowerPoint template compare and contrast chart business strategy Slides. The way ahead will become crystal clear. With our Leadership PowerPoint Templates you will be doubly sure. They possess that stamp of authority. Our Finance PowerPoint Templates do it in double quick time. Speed up the process in a tangible way. Dream big wins with our Consulting PowerPoint Template Compare And Contrast Chart Business Strategy Slides. You will come out on top.
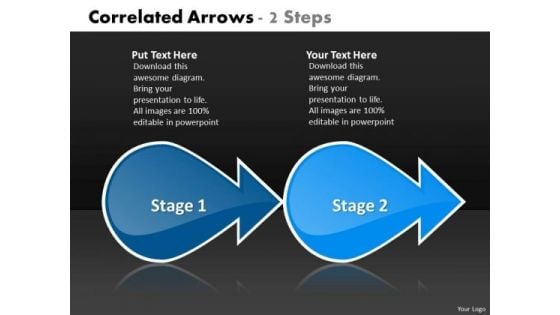
Correlated Arrows 2 Steps Technical Flow Chart PowerPoint Templates
We present our correlated arrows 2 steps technical flow chart PowerPoint templates.Use our Business PowerPoint Templates because, Infrastructure growth is an obvious requirement of today.Inform your group on how exactly this potential is tailor made for you Use our Arrows PowerPoint Templates because,This PPT slide helps you to measure key aspects of the current process and collect relevant data Use our Shapes PowerPoint Templates because,You have the ideas, you have got a brainwave. Use our Design PowerPoint Templates because,firing the arrows to emblazon the desired path will let you achieve anticipated results. Use our Abstract PowerPoint Templates because,Leading from the front is your preferred style. Use these PowerPoint slides for presentations relating to abstract, arrow, arrows, business, chart, design, development, diagram, direction, element, flow, flowchart, graph, linear, management, model, motion, organization, plan, process, program, section, segment, set, sign, solution, strategy, symbol, technology. The prominent colors used in the PowerPoint template are Blue, Blue navy, White. People tell us our correlated arrows 2 steps technical flow chart PowerPoint templates are Fantastic. The feedback we get is that our business PowerPoint templates and PPT Slides are Fabulous. People tell us our correlated arrows 2 steps technical flow chart PowerPoint templates are Playful. Presenters tell us our arrows PowerPoint templates and PPT Slides are Pretty. The feedback we get is that our correlated arrows 2 steps technical flow chart PowerPoint templates are Fashionable. Professionals tell us our chart PowerPoint templates and PPT Slides are aesthetically designed to attract attention. We guarantee that they will grab all the eyeballs you need. Compile it on our Correlated Arrows 2 Steps Technical Flow Chart PowerPoint Templates. Give your thoughts exclusive exposure.
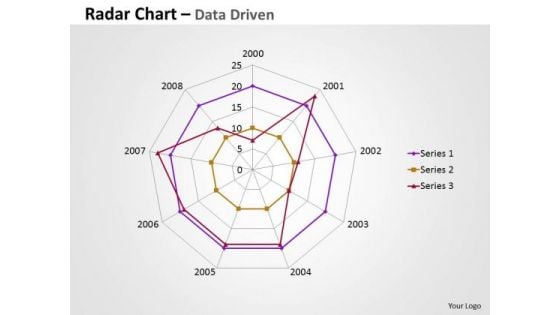
Business Data Analysis Chart Comparing Multiple Entities PowerPoint Templates
Analyze Ailments On Our business data analysis chart comparing multiple entities Powerpoint Templates. Bring Out The Thinking Doctor In You. Dock Your Thoughts With Our Financial Analysis . They Will Launch Them Into Orbit.
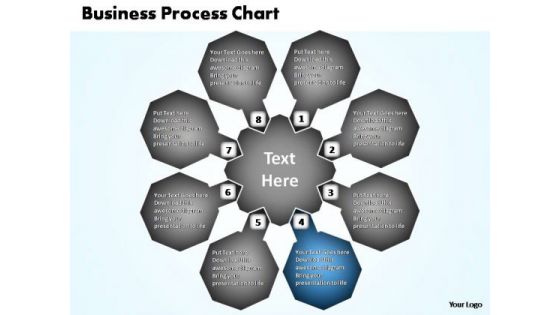
PowerPoint Template Global Business Process Chart Ppt Template
PowerPoint Template Global Business Process Chart PPT Template-Highlight the key components of your entire manufacturing/ business process. Illustrate how each element flows seamlessly onto the next stage. Emphasise on any critical or key factors within them. Demonstrate how they all combine to form the final product.-PowerPoint Template Global Business Process Chart PPT Template Make the boring bubbly with our PowerPoint Template Global Business Process Chart Ppt Template. Your thoughts will get them all agog and buzzing.
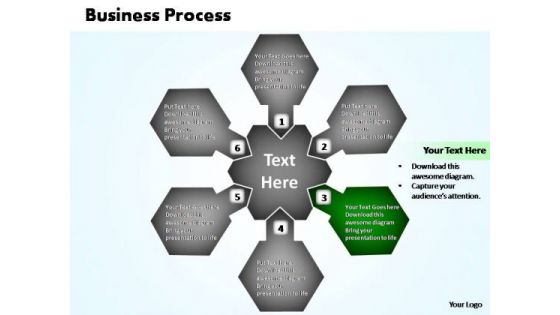
PowerPoint Design Slides Growth Business Process Chart Ppt Theme
PowerPoint Design Slides Growth Business Process Chart PPT Theme-Highlight the key components of your entire manufacturing/ business process. Illustrate how each element flows seamlessly onto the next stage. Emphasise on any critical or key factors within them. Demonstrate how they all combine to form the final product.-PowerPoint Design Slides Growth Business Process Chart PPT Theme The audience will be happy to pay any fee. They will be all agog to see our PowerPoint Design Slides Growth Business Process Chart Ppt Theme.
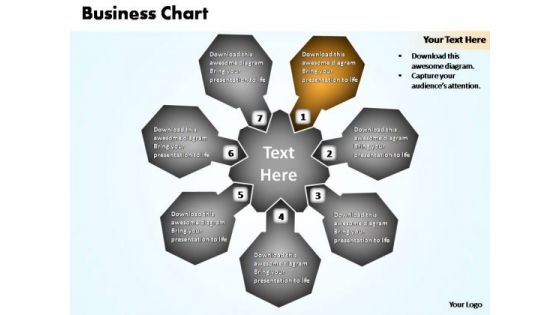
PowerPoint Design Slides Image Business Process Chart Ppt Themes
PowerPoint Design Slides Image Business Process Chart PPT Themes-Highlight the key components of your entire manufacturing/ business process. Illustrate how each element flows seamlessly onto the next stage. Emphasise on any critical or key factors within them. Demonstrate how they all combine to form the final product.-PowerPoint Design Slides Image Business Process Chart PPT Themes Excite your audience with our PowerPoint Design Slides Image Business Process Chart Ppt Themes. You will come out on top.
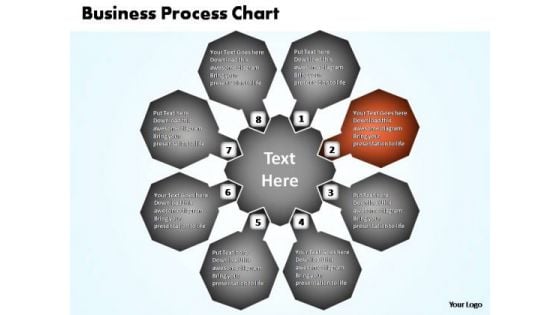
PowerPoint Process Diagram Business Process Chart Ppt Backgrounds
PowerPoint Process Diagram Business Process Chart PPT Backgrounds-Highlight the key components of your entire manufacturing/ business process. Illustrate how each element flows seamlessly onto the next stage. Emphasise on any critical or key factors within them. Demonstrate how they all combine to form the final product.-PowerPoint Process Diagram Business Process Chart PPT Backgrounds Exert some pressure with our PowerPoint Process Diagram Business Process Chart Ppt Backgrounds. Get the decision in your favour.
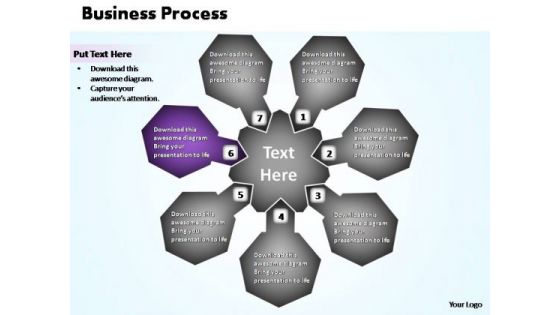
PowerPoint Backgrounds Leadership Business Process Chart Ppt Presentation
PowerPoint Backgrounds Leadership Business Process Chart PPT Presentation-Highlight the key components of your entire manufacturing/ business process. Illustrate how each element flows seamlessly onto the next stage. Emphasise on any critical or key factors within them. Demonstrate how they all combine to form the final product.-PowerPoint Backgrounds Leadership Business Process Chart PPT Presentation Arm yourself with our PowerPoint Backgrounds Leadership Business Process Chart Ppt Presentation. Carry your thoughts safely across.
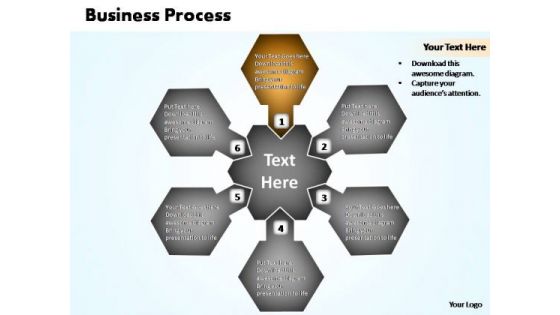
PowerPoint Backgrounds Sales Business Process Chart Ppt Slide Designs
PowerPoint Backgrounds Sales Business Process Chart PPT Slide Designs-Highlight the key components of your entire manufacturing/ business process. Illustrate how each element flows seamlessly onto the next stage. Emphasise on any critical or key factors within them. Demonstrate how they all combine to form the final product.-PowerPoint Backgrounds Sales Business Process Chart PPT Slide Designs Face the storm with our PowerPoint Backgrounds Sales Business Process Chart Ppt Slide Designs. Just download, type and present.
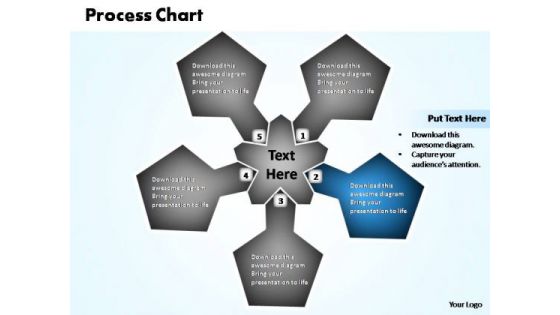
PowerPoint Design Download Business Process Chart Ppt Designs
PowerPoint Design Download Business Process Chart PPT Designs-Highlight the key components of your entire manufacturing/ business process. Illustrate how each element flows seamlessly onto the next stage. Emphasise on any critical or key factors within them. Demonstrate how they all combine to form the final product.-PowerPoint Design Download Business Process Chart PPT Designs Our PowerPoint Design Download Business Process Chart Ppt Designs are far from fictional. They are ardent admirers of actual facts.
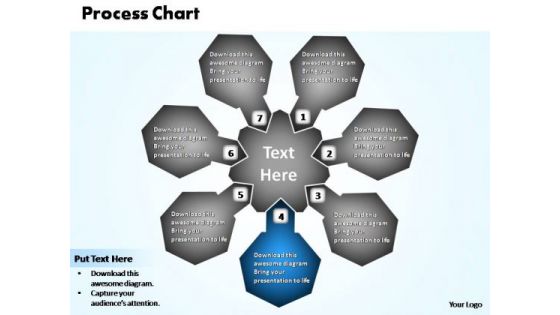
PowerPoint Design Graphic Business Process Chart Ppt Designs
PowerPoint Design Graphic Business Process Chart PPT Designs-Highlight the key components of your entire manufacturing/ business process. Illustrate how each element flows seamlessly onto the next stage. Emphasise on any critical or key factors within them. Demonstrate how they all combine to form the final product.-PowerPoint Design Graphic Business Process Chart PPT Designs Our PowerPoint Design Graphic Business Process Chart Ppt Designs team are great exponents of visual art. They have created some beauties for you.
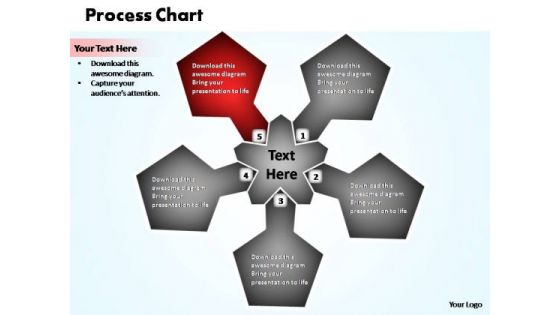
PowerPoint Presentation Leadership Business Process Chart Ppt Designs
PowerPoint Presentation Leadership Business Process Chart PPT Designs-Highlight the key components of your entire manufacturing/ business process. Illustrate how each element flows seamlessly onto the next stage. Emphasise on any critical or key factors within them. Demonstrate how they all combine to form the final product.-PowerPoint Presentation Leadership Business Process Chart PPT Designs Our PowerPoint Presentation Leadership Business Process Chart Ppt Designs help you think on your feet. They provide you with ready answers.
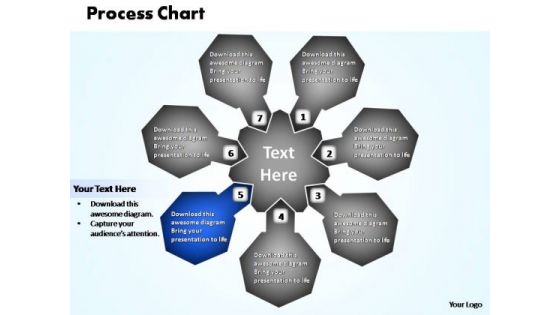
PowerPoint Presentation Success Business Process Chart Ppt Backgrounds
PowerPoint Presentation Success Business Process Chart PPT Backgrounds-Highlight the key components of your entire manufacturing/ business process. Illustrate how each element flows seamlessly onto the next stage. Emphasise on any critical or key factors within them. Demonstrate how they all combine to form the final product.-PowerPoint Presentation Success Business Process Chart PPT Backgrounds Our PowerPoint Presentation Success Business Process Chart Ppt Backgrounds pick up on many a fable. They contain the wisdom of business lore.
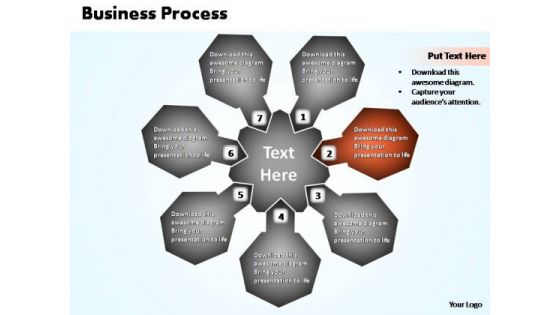
PowerPoint Process Global Business Process Chart Ppt Presentation
PowerPoint Process Global Business Process Chart PPT Presentation-Highlight the key components of your entire manufacturing/ business process. Illustrate how each element flows seamlessly onto the next stage. Emphasise on any critical or key factors within them. Demonstrate how they all combine to form the final product.-PowerPoint Process Global Business Process Chart PPT Presentation Enlist teams with our PowerPoint Process Global Business Process Chart Ppt Presentation. Download without worries with our money back guaranteee.
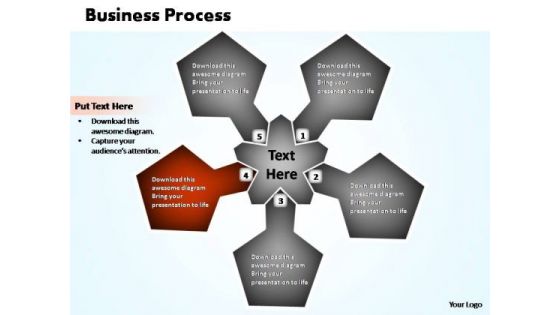
PowerPoint Slide Designs Graphic Business Process Chart Ppt Slide
PowerPoint Slide Designs Graphic Business Process Chart PPT Slide-Highlight the key components of your entire manufacturing/ business process. Illustrate how each element flows seamlessly onto the next stage. Emphasise on any critical or key factors within them. Demonstrate how they all combine to form the final product.-PowerPoint Slide Designs Graphic Business Process Chart PPT Slide Dive into the deep end with our PowerPoint Slide Designs Graphic Business Process Chart Ppt Slide. They assist you in staying afloat.
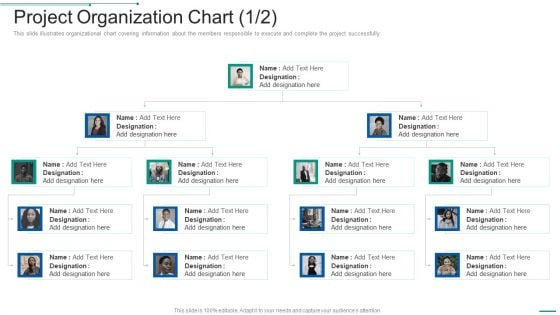
PMP Toolkit Project Organization Chart Ppt Portfolio Layout Ideas PDF
Following slide portrays organizational chart covering information about the members responsible to execute and complete the project successfully. This is a pmp toolkit project organization chart ppt portfolio layout ideas pdf template with various stages. Focus and dispense information on two stages using this creative set, that comes with editable features. It contains large content boxes to add your information on topics like project organization chart. You can also showcase facts, figures, and other relevant content using this PPT layout. Grab it now.
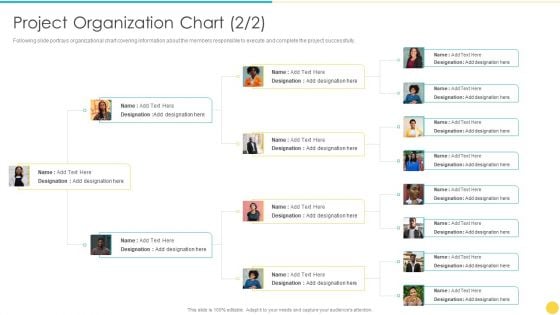
Project Management Professional Toolset IT Project Organization Chart Clipart PDF
This slide illustrates organizational chart covering information about the members responsible to execute and complete the project successfully. This is a project management professional toolset it project organization chart clipart pdf template with various stages. Focus and dispense information on two stages using this creative set, that comes with editable features. It contains large content boxes to add your information on topics like project organization chart. You can also showcase facts, figures, and other relevant content using this PPT layout. Grab it now.
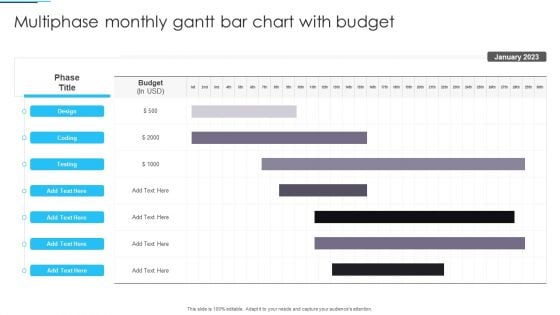
Multiphase Monthly Gantt Bar Chart With Budget Clipart PDF
Pitch your topic with ease and precision using this Multiphase Monthly Gantt Bar Chart With Budget Clipart PDF. This layout presents information on Gantt Bar Chart, Budget. It is also available for immediate download and adjustment. So, changes can be made in the color, design, graphics or any other component to create a unique layout.
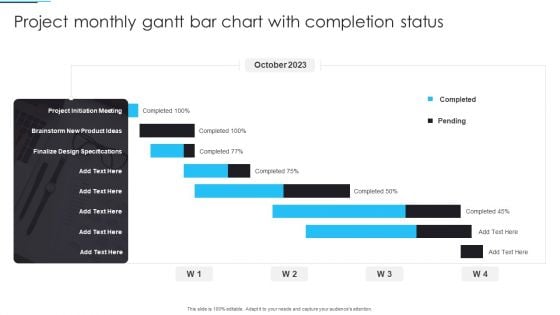
Project Monthly Gantt Bar Chart With Completion Status Infographics PDF
Pitch your topic with ease and precision using this Project Monthly Gantt Bar Chart With Completion Status Infographics PDF. This layout presents information on Project, Monthly Gantt Bar Chart. It is also available for immediate download and adjustment. So, changes can be made in the color, design, graphics or any other component to create a unique layout.
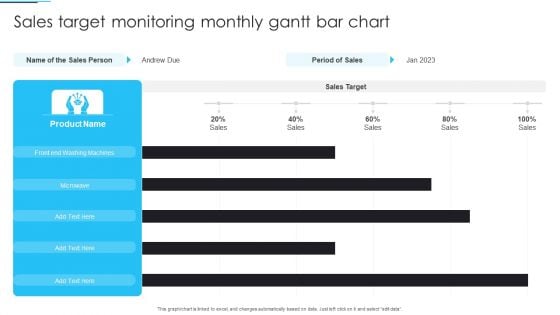
Sales Target Monitoring Monthly Gantt Bar Chart Ideas PDF
Pitch your topic with ease and precision using this Sales Target Monitoring Monthly Gantt Bar Chart Ideas PDF. This layout presents information on Sales Target Monitoring, Monthly Gantt Bar Chart. It is also available for immediate download and adjustment. So, changes can be made in the color, design, graphics or any other component to create a unique layout.
Unsatisfactory Performance Chart Icon With Downward Arrow Infographics PDF
Pitch your topic with ease and precision using this Unsatisfactory Performance Chart Icon With Downward Arrow Infographics PDF. This layout presents information on Unsatisfactory Performance, Chart Icon, Downward Arrow. It is also available for immediate download and adjustment. So, changes can be made in the color, design, graphics or any other component to create a unique layout.
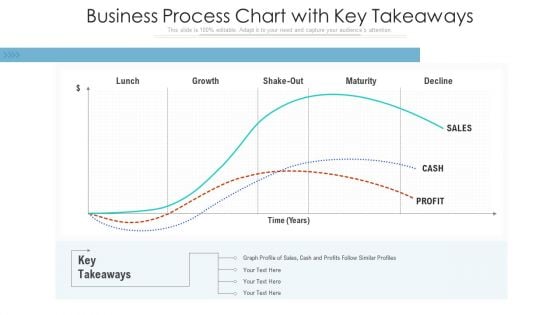
Business Process Chart With Key Takeaways Ppt Summary Files PDF
Pitch your topic with ease and precision using this business process chart with key takeaways ppt summary files pdf. This layout presents information on business process chart with key takeaways. It is also available for immediate download and adjustment. So, changes can be made in the color, design, graphics or any other component to create a unique layout.
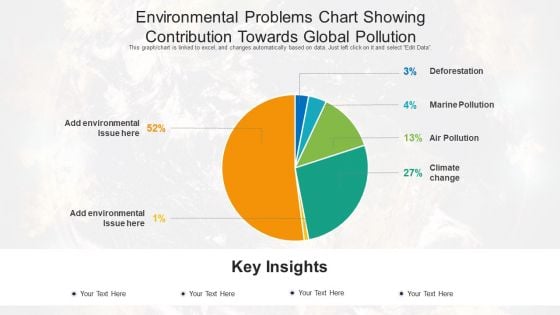
Environmental Problems Chart Showing Contribution Towards Global Pollution Elements PDF
Pitch your topic with ease and precision using this environmental problems chart showing contribution towards global pollution elements pdf. This layout presents information on environmental problems chart showing contribution towards global pollution. It is also available for immediate download and adjustment. So, changes can be made in the color, design, graphics or any other component to create a unique layout.
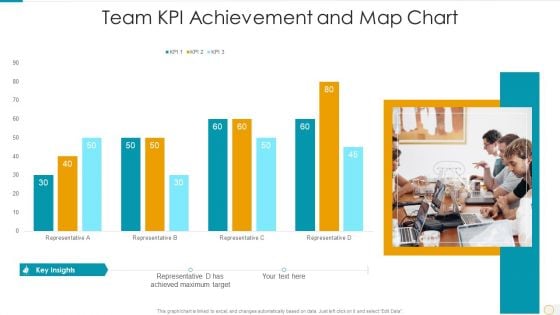
Team Kpi Achievement And Map Chart Portrait PDF
Pitch your topic with ease and precision using this team kpi achievement and map chart portrait pdf. This layout presents information on team kpi achievement and map chart. It is also available for immediate download and adjustment. So, changes can be made in the color, design, graphics or any other component to create a unique layout.
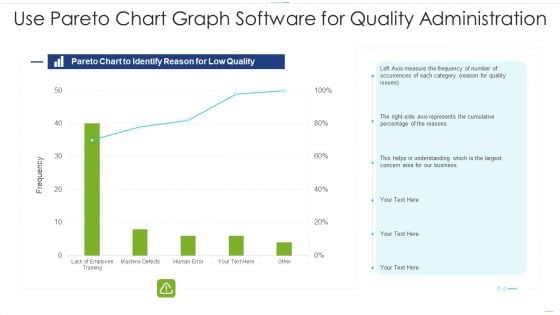
Use Pareto Chart Graph Software For Quality Administration Structure PDF
Pitch your topic with ease and precision using this use pareto chart graph software for quality administration structure pdf. This layout presents information on use pareto chart graph software for quality administration. It is also available for immediate download and adjustment. So, changes can be made in the color, design, graphics or any other component to create a unique layout.
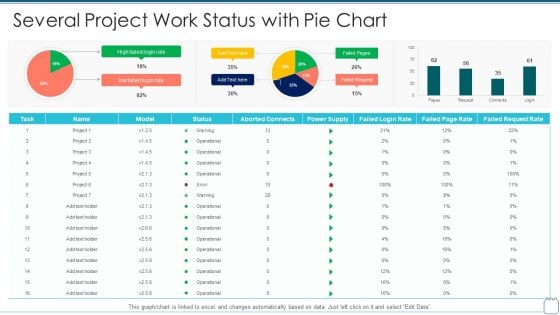
Several Project Work Status With Pie Chart Microsoft PDF
Pitch your topic with ease and precision using this several project work status with pie chart microsoft pdf . This layout presents information on several project work status with pie chart . It is also available for immediate download and adjustment. So, changes can be made in the color, design, graphics or any other component to create a unique layout.
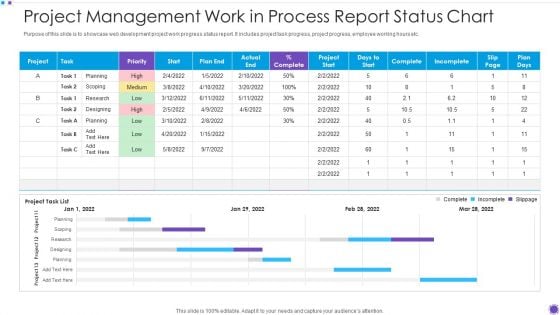
Project Management Work In Process Report Status Chart Microsoft PDF
Pitch your topic with ease and precision using this project management work in process report status chart microsoft pdf. This layout presents information on project management work in process report status chart. It is also available for immediate download and adjustment. So, changes can be made in the color, design, graphics or any other component to create a unique layout.
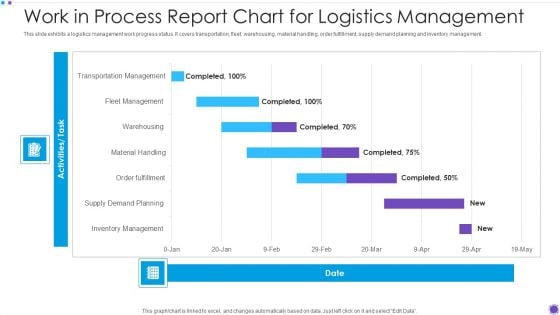
Work In Process Report Chart For Logistics Management Slides PDF
Pitch your topic with ease and precision using this work in process report chart for logistics management slides pdf. This layout presents information on work in process report chart for logistics management. It is also available for immediate download and adjustment. So, changes can be made in the color, design, graphics or any other component to create a unique layout.
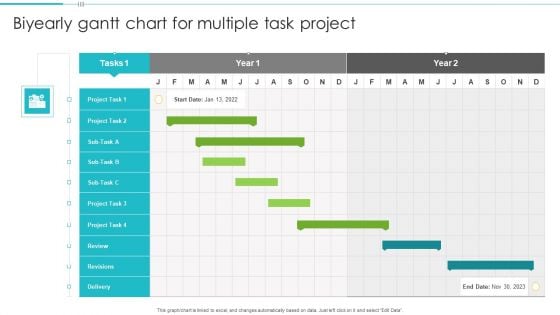
Biyearly Gantt Chart For Multiple Task Project Structure PDF
Pitch your topic with ease and precision using this Biyearly Gantt Chart For Multiple Task Project Structure PDF. This layout presents information on Biyearly Gantt Chart, Multiple Task Project. It is also available for immediate download and adjustment. So, changes can be made in the color, design, graphics or any other component to create a unique layout.

Sprint Monitoring Summary With Burndown Chart Portrait PDF
Pitch your topic with ease and precision using this Sprint Monitoring Summary With Burndown Chart Portrait PDF. This layout presents information on Sprint Monitoring Summary, Burndown Chart . It is also available for immediate download and adjustment. So, changes can be made in the color, design, graphics or any other component to create a unique layout.
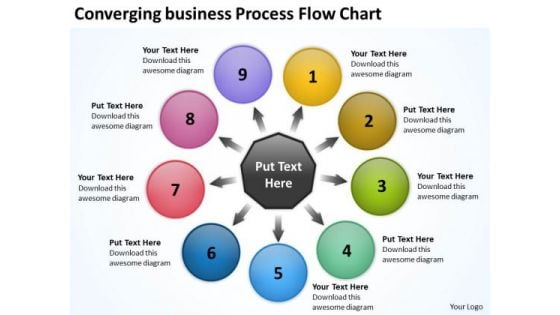
Templates Download Process Flow Chart Circular Layout Diagram PowerPoint Slides
We present our templates download process flow chart Circular Layout Diagram PowerPoint Slides.Download and present our Circle Charts PowerPoint Templates because you have the right arrows in your quiver. Present our Arrows PowerPoint Templates because with the help of our Slides you can Illustrate your ideas one by one and demonstrate how each is an important cog in running the entire wheel. Use our Business PowerPoint Templates because your fledgling career is in the chrysallis stage. Nurture it and watch it grow into a beautiful butterfly. Use our Shapes PowerPoint Templates because with the help of our Slides you can Illustrate your plans on using the many social media modes available to inform soceity at large of the benefits of your product. Use our Flow Charts PowerPoint Templates because with the help of our Slides you can Illustrate your plans to your listeners with the same accuracy.Use these PowerPoint slides for presentations relating to abstract, arrows, blank, business, central, centralized, chart, circle, circular, circulation, concept, conceptual, converging, design, diagram, empty, executive, icon, idea, illustration, management, map, mapping, mba, model, numbers, organization, outwards, pointing, procedure, process, radial, radiating, relationship, resource, sequence, sequential, seven, square, strategy, template. The prominent colors used in the PowerPoint template are Red, Purple, Pink. Customers tell us our templates download process flow chart Circular Layout Diagram PowerPoint Slides are Elevated. PowerPoint presentation experts tell us our central PowerPoint templates and PPT Slides are Tasteful. People tell us our templates download process flow chart Circular Layout Diagram PowerPoint Slides are Second to none. People tell us our circle PowerPoint templates and PPT Slides are Handsome. Customers tell us our templates download process flow chart Circular Layout Diagram PowerPoint Slides are Whimsical. People tell us our central PowerPoint templates and PPT Slides are Splendid. Become an expert presenter with our Templates Download Process Flow Chart Circular Layout Diagram PowerPoint Slides. Dont waste time struggling with PowerPoint. Let us do it for you.
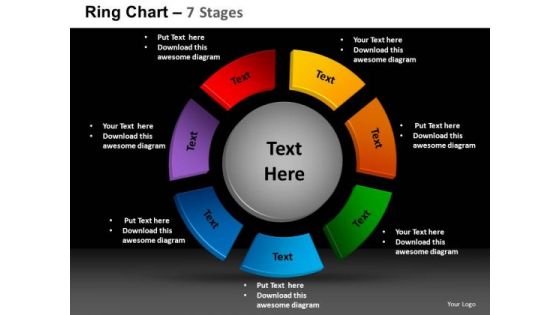
PowerPoint Design Slides Process Ring Chart Ppt Template
PowerPoint Design Slides Process Ring Chart PPT Template-These high quality powerpoint pre-designed slides and powerpoint templates have been carefully created by our professional team to help you impress your audience. All slides have been created and are 100% editable in powerpoint. Each and every property of any graphic - color, size, orientation, shading, outline etc. can be modified to help you build an effective powerpoint presentation. Any text can be entered at any point in the powerpoint template or slide. Simply DOWNLOAD, TYPE and PRESENT! Our PowerPoint Design Slides Process Ring Chart Ppt Template provide a key feature. They help the audience concentrate in your thoughts.


 Continue with Email

 Home
Home


