Comparison Chart
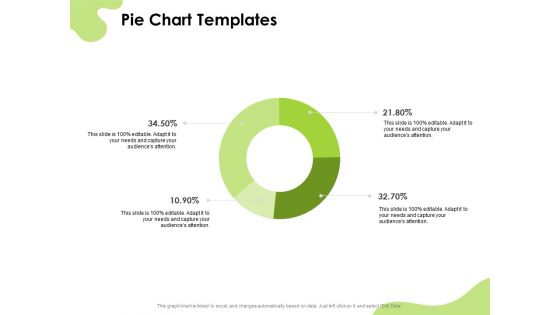
Reach Your Target Audience Pie Chart Ppt Show Model PDF
This is a reach your target audience pie chart ppt show model pdf template with various stages. Focus and dispense information on four stages using this creative set, that comes with editable features. It contains large content boxes to add your information on topics like pie chart. You can also showcase facts, figures, and other relevant content using this PPT layout. Grab it now.
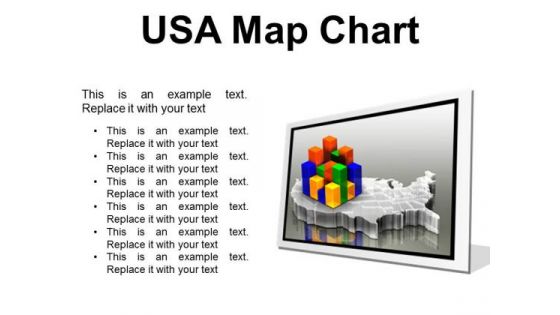
Usa Map Chart Americana PowerPoint Presentation Slides F
Microsoft PowerPoint Slides and Backgrounds with of a multicolored bar chart sitting on top of a transparent extruded map of the united states on a medium gray reflective surface Our Usa Map Chart Americana PowerPoint Presentation Slides F provide an attractive backdrop. Your thoughts will be the main feature.
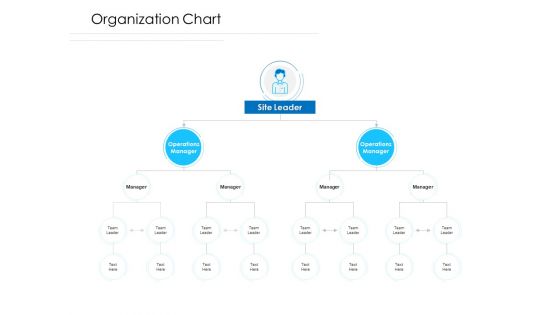
Unconventional Monetary Policy Organization Chart Ppt Outline Graphic Images PDF
This is a unconventional monetary policy organization chart ppt outline graphic images pdf template with various stages. Focus and dispense information on four stages using this creative set, that comes with editable features. It contains large content boxes to add your information on topics like organization chart. You can also showcase facts, figures, and other relevant content using this PPT layout. Grab it now.
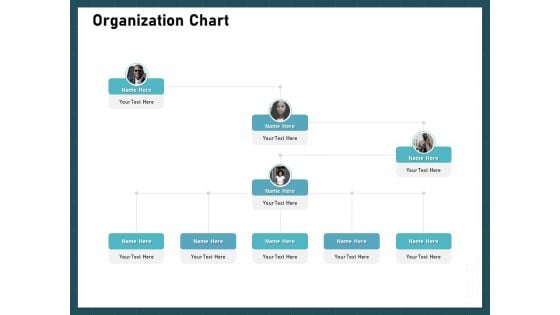
Strategies To Win Customers From Competitors Organization Chart Microsoft PDF
This is a strategies to win customers from competitors organization chart microsoft pdf template with various stages. Focus and dispense information on four stages using this creative set, that comes with editable features. It contains large content boxes to add your information on topics like organization chart. You can also showcase facts, figures, and other relevant content using this PPT layout. Grab it now.

Enterprise Review Management Organizational Chart Ppt Styles Guide PDF
This is a enterprise review management organizational chart ppt styles guide pdf template with various stages. Focus and dispense information on six stages using this creative set, that comes with editable features. It contains large content boxes to add your information on topics like management organizational chart. You can also showcase facts, figures, and other relevant content using this PPT layout. Grab it now.
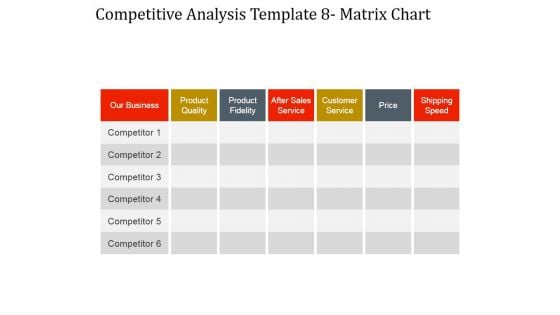
Competitive Analysis Matrix Chart Ppt PowerPoint Presentation Gallery
This is a competitive analysis matrix chart ppt powerpoint presentation gallery. This is a seven stage process. The stages in this process are our business, product quality, product fidelity, after sales service, customer service, price, shipping speed.
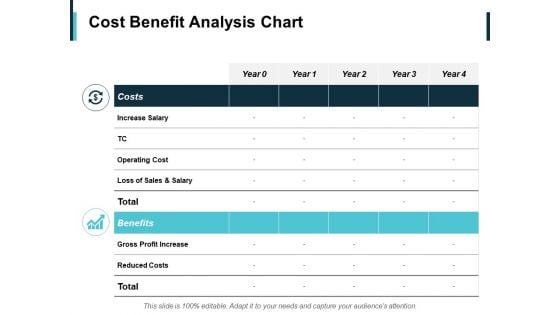
Cost Benefit Analysis Chart Ppt PowerPoint Presentation Ideas Shapes
This is a cost benefit analysis chart ppt powerpoint presentation ideas shapes. This is a two stage process. The stages in this process are reduced costs, operating cost, benefits, costs, increase salary.
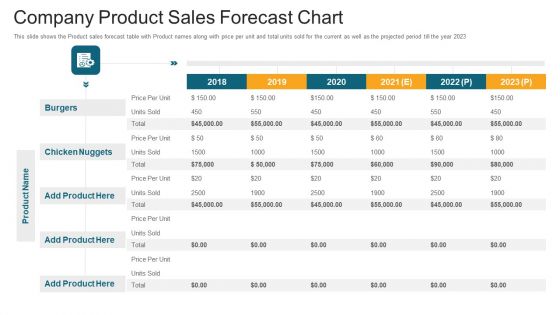
Company Product Sales Forecast Chart Ppt File Slide Portrait PDF
This slide shows the Product sales forecast table with Product names along with price per unit and total units sold for the current as well as the projected period till the year 2023. Deliver an awe inspiring pitch with this creative company product sales forecast chart ppt file slide portrait pdf bundle. Topics like company product sales forecast chart can be discussed with this completely editable template. It is available for immediate download depending on the needs and requirements of the user.
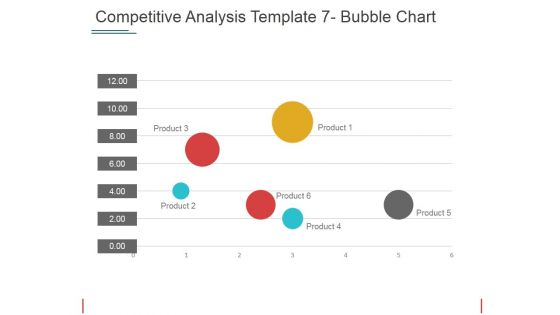
Competitive Analysis Bubble Chart Ppt PowerPoint Presentation Pictures Mockup
This is a competitive analysis bubble chart ppt powerpoint presentation pictures mockup. This is a six stage process. The stages in this process are product, table, business, marketing, management.
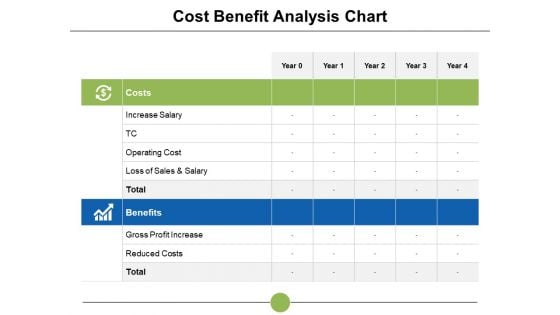
Cost Benefit Analysis Chart Ppt PowerPoint Presentation Slides Example File
This is a cost benefit analysis chart ppt powerpoint presentation slides example file. This is a two stage process. The stages in this process are increase salary, cost benefit, reduced costs, analysis, operating cost.
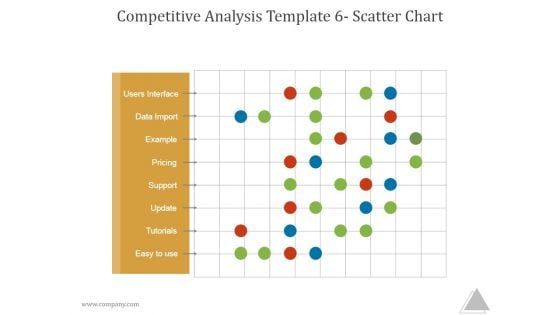
Competitive Analysis Template 6 Scatter Chart Ppt PowerPoint Presentation Shapes
This is a competitive analysis template 6 scatter chart ppt powerpoint presentation shapes. This is a one stage process. The stages in this process are users interface, data import, example, pricing, support update, tutorials, easy to use.
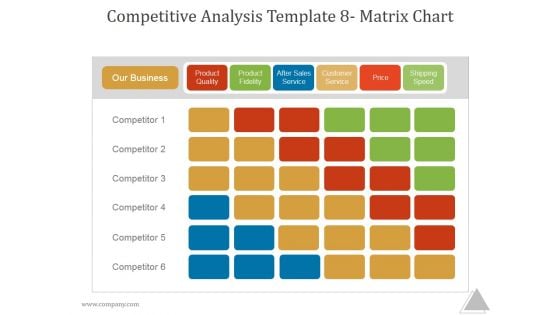
Competitive Analysis Template 8 Matrix Chart Ppt PowerPoint Presentation Templates
This is a competitive analysis template 8 matrix chart ppt powerpoint presentation templates. This is a six stage process. The stages in this process are our business, product quality, product fidelity, after sales service, customer service, price, shipping speed, competitor.
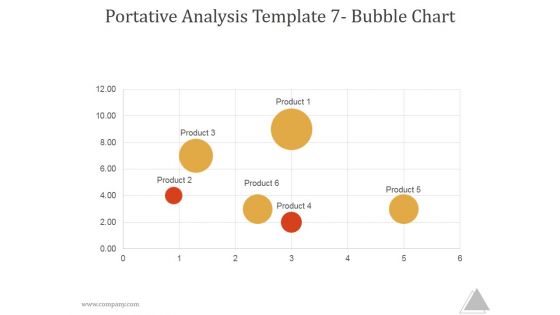
Portative Analysis Template 7 Bubble Chart Ppt PowerPoint Presentation Picture
This is a portative analysis template 7 bubble chart ppt powerpoint presentation picture. This is a six stage process. The stages in this process are product, business, marketing, management.
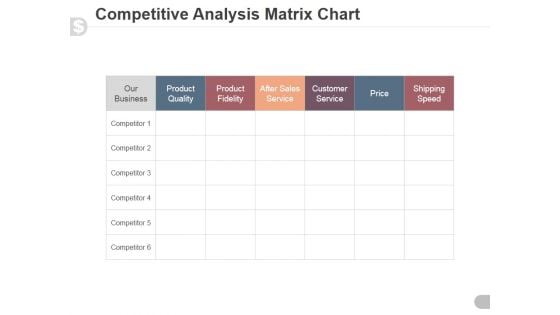
Competitive Analysis Matrix Chart Ppt PowerPoint Presentation Inspiration
This is a competitive analysis matrix chart ppt powerpoint presentation inspiration. This is a six stage process. The stages in this process are product quality, product fidelity, after sales service, customer service, price, shipping speed.
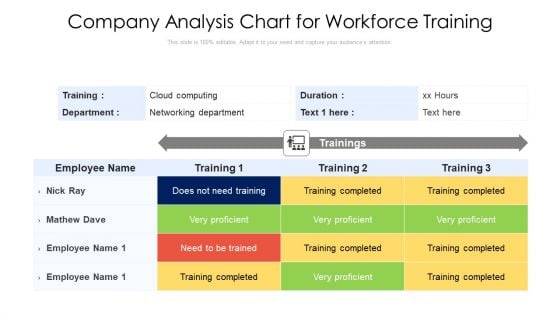
Company Analysis Chart For Workforce Training Ppt Infographics Show PDF
Showcasing this set of slides titled company analysis chart for workforce training ppt infographics show pdf. The topics addressed in these templates are cloud computing, duration, employee. All the content presented in this PPT design is completely editable. Download it and make adjustments in color, background, font etc. as per your unique business setting.
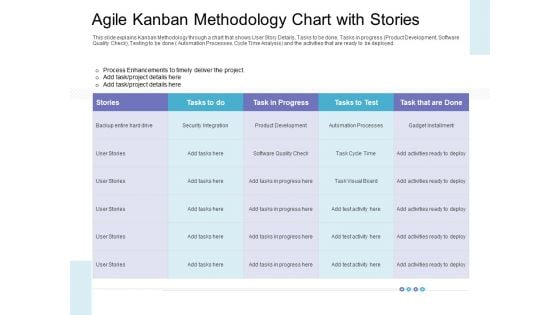
Agile Kanban Methodology Chart With Stories Formats PDF
This slide explains Kanban Methodology through a chart that shows User Story Details, Tasks to be done, Tasks in progress Product Development, Software Quality Check, Testing to be done Automation Processes, Cycle Time Analysis and the activities that are ready to be deployed. Deliver an awe-inspiring pitch with this creative agile kanban methodology chart with stories formats pdf bundle. Topics like agile kanban methodology chart with stories can be discussed with this completely editable template. It is available for immediate download depending on the needs and requirements of the user.
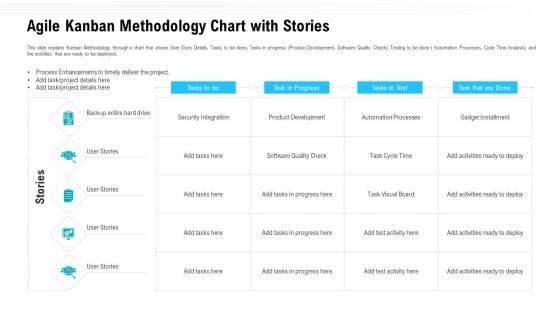
Agile Kanban Methodology Chart With Stories Ppt Model Show PDF
This slide explains Kanban Methodology through a chart that shows User Story Details, Tasks to be done, Tasks in progress Product Development, Software Quality Check, Testing to be done Automation Processes, Cycle Time Analysis and the activities that are ready to be deployed. Deliver an awe inspiring pitch with this creative agile kanban methodology chart with stories ppt model show pdf bundle. Topics like product development, process enhancements to timely deliver the project, agile kanban methodology chart with stories can be discussed with this completely editable template. It is available for immediate download depending on the needs and requirements of the user.
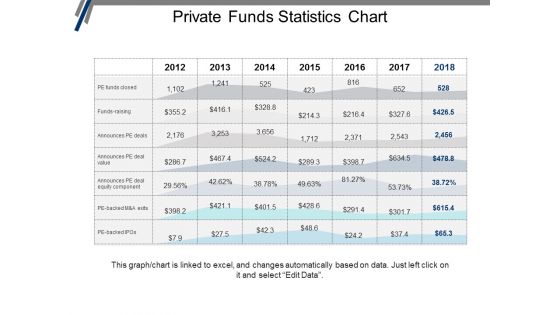
Private Funds Statistics Chart Ppt PowerPoint Presentation Portfolio Graphics Design
This is a private funds statistics chart ppt powerpoint presentation portfolio graphics design. This is a seven stage process. The stages in this process are investment, funding, private equity, venture capital.
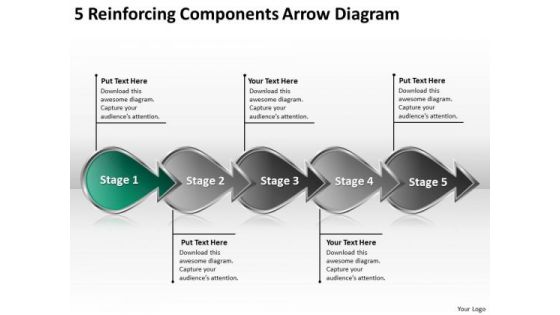
5 Reinforcing Components Arrow Diagram Typical Flow Chart PowerPoint Templates
We present our 5 reinforcing components arrow diagram typical flow chart PowerPoint templates.Download our Arrows PowerPoint Templates because they highlight the depth of your thought process. Download our Business PowerPoint Templates because you have had your share of being a goldfish in a small bowl.you are ready to launch out and spread your wings. Use our Competition PowerPoint Templates because this is an appropriate layout to convince your team that they have the ability to score a tEN every time. Download and present our Design PowerPoint Templates because it is all there in bits and pieces. Download our Shapes PowerPoint Templates because it Shines the light on your thoughts and motivates your team to improve the quality of celebration for all around you.Use these PowerPoint slides for presentations relating to arrow, arrows, block, business, chart, design, development, diagram, direction, element, flow, flowchart, graph, linear, management, organization, process, program, section, sign, solution, symbol. The prominent colors used in the PowerPoint template are Green, Gray, Black. Professionals tell us our 5 reinforcing components arrow diagram typical flow chart PowerPoint templates are Bright. The feedback we get is that our direction PowerPoint templates and PPT Slides are the best it can get when it comes to presenting. We assure you our 5 reinforcing components arrow diagram typical flow chart PowerPoint templates are Spectacular. Customers tell us our business PowerPoint templates and PPT Slides are Glamorous. Presenters tell us our 5 reinforcing components arrow diagram typical flow chart PowerPoint templates are Nostalgic. People tell us our block PowerPoint templates and PPT Slides are Second to none. Conduct meetings with our 5 Reinforcing Components Arrow Diagram Typical Flow Chart PowerPoint Templates. Download without worries with our money back guaranteee.

Donut Pie Chart Ppt PowerPoint Presentation Infographics Outfit
This is a donut pie chart ppt powerpoint presentation infographics outfit. This is a three stage process. The stages in this process are business, strategy, analysis, planning, dashboard, finance.
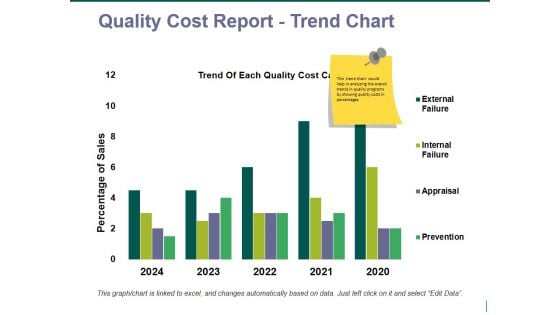
quality cost report trend chart ppt powerpoint presentation pictures vector
This is a quality cost report trend chart ppt powerpoint presentation pictures vector. This is a four stage process. The stages in this process are business, finance, marketing, strategy, analysis.
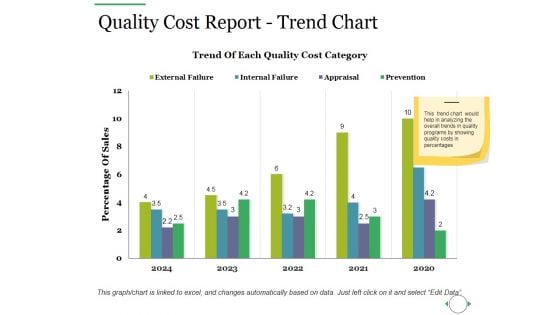
Quality Cost Report Trend Chart Ppt PowerPoint Presentation Outline Guidelines
This is a quality cost report trend chart ppt powerpoint presentation outline guidelines. This is a two stage process. The stages in this process are quality cost, appraisal cost, internal failure cost, external failure cost.
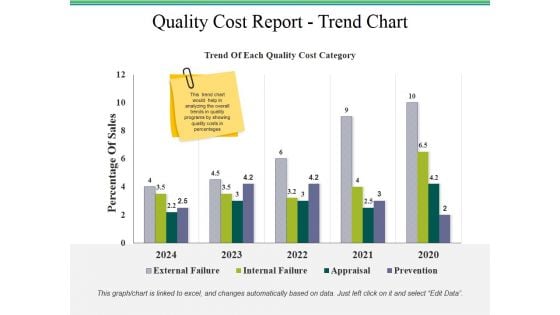
Quality Cost Report Trend Chart Ppt PowerPoint Presentation Styles Templates
This is a quality cost report trend chart ppt powerpoint presentation styles templates. This is a two stage process. The stages in this process are quality cost report, business, finance, marketing, strategy.
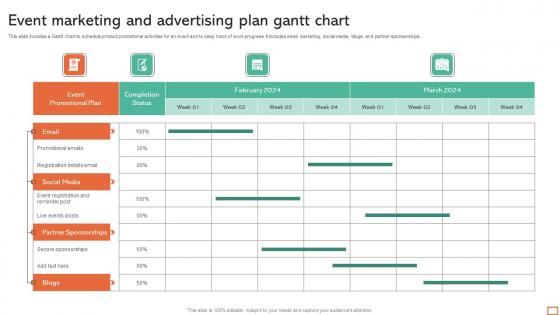
Event Marketing And Advertising Plan Gantt Chart Professional Pdf
This slide includes a Gantt chart to schedule product promotional activities for an event and to keep track of work progress. It includes email marketing, social media, blogs, and partner sponsorships. Pitch your topic with ease and precision using this Event Marketing And Advertising Plan Gantt Chart Professional Pdf. This layout presents information on Social Media, Partner Sponsorships. It is also available for immediate download and adjustment. So, changes can be made in the color, design, graphics or any other component to create a unique layout. This slide includes a Gantt chart to schedule product promotional activities for an event and to keep track of work progress. It includes email marketing, social media, blogs, and partner sponsorships.
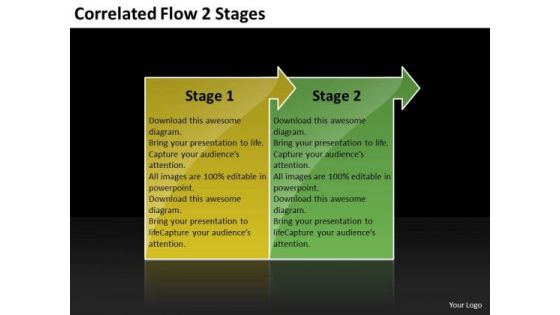
Correlated Flow 2 Stages Oil Chart PowerPoint Slides
We present our correlated flow 2 stages oil chart PowerPoint Slides. Use our Arrows PowerPoint Templates because, Weak Links & Chains:- Chain reactions and the element of teamwork add value to your efforts. Use our Symbol PowerPoint Templates because, However there is a key aspect to be emphasized. Use our Business PowerPoint Templates because, Marketing Strategy Business Template:- Maximizing sales of your product is the intended destination. Use our Metaphor PowerPoint Templates because, are truly some of the wonders of our life. Use our Process and Flows PowerPoint Templates because, you have understood the essence of this chain reaction like sequence of events. Use these PowerPoint slides for presentations relating to Arrow, Background, Banner, Blue, Bookmark, Card, Choice, Concept, Corporate, Creative, Design, Direction, Flow, Green, Illustration, Info graphic, Instruction, Label, Layout, Manual, Modern, Number, Offer, One, Options, Order, Page, Paper, Pointer, Product, Progress, Promotion, Red, Retro, Sequence, Simple, Special, Step, Symbol, Tab, Tag, Template, Three, Tutorial, Two, Vector, Version. The prominent colors used in the PowerPoint template are Green, Yellow, and Black Our Correlated Flow 2 Stages Oil Chart PowerPoint Slides capture the attention of your audience. With our money back guarantee you have nothing to lose.
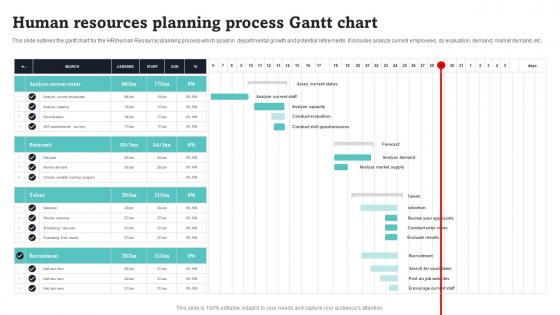
Human Resources Planning Process Gantt Chart Portrait Pdf
This slide outlines the gantt chart for the HRhuman Resource planning process which assist in departmental growth and potential retirements. It includes analyze current employees, do evaluation, demand, market demand, etc. Pitch your topic with ease and precision using this Human Resources Planning Process Gantt Chart Portrait Pdf. This layout presents information on Analyze Current Status, Forecast, Talent. It is also available for immediate download and adjustment. So, changes can be made in the color, design, graphics or any other component to create a unique layout. This slide outlines the gantt chart for the HRhuman Resource planning process which assist in departmental growth and potential retirements. It includes analyze current employees, do evaluation, demand, market demand, etc.
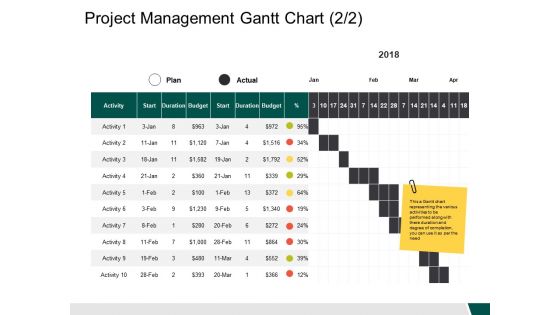
Project Management Gantt Chart Activity Ppt PowerPoint Presentation Inspiration Samples
This is a project management gantt chart activity ppt powerpoint presentation inspiration samples. This is a ten stage process. The stages in this process are business, management, strategy, analysis, marketing.
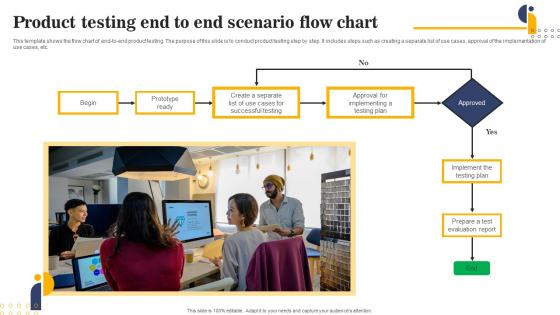
Product Testing End To End Scenario Flow Chart Download Pdf
This template shows the flow chart of end-to-end product testing. The purpose of this slide is to conduct product testing step by step. It includes steps such as creating a separate list of use cases, approval of the implementation of use cases, etc.Pitch your topic with ease and precision using this Product Testing End To End Scenario Flow Chart Download Pdf This layout presents information on Successful Testing, Prototype Ready, Approval Implementing It is also available for immediate download and adjustment. So, changes can be made in the color, design, graphics or any other component to create a unique layout. This template shows the flow chart of end to end product testing. The purpose of this slide is to conduct product testing step by step. It includes steps such as creating a separate list of use cases, approval of the implementation of use cases, etc.

SAP Implementation Process Gantt Chart Ppt Slides Sample Pdf
This slide represents the timeline or Gantt chart of the SAP implementation process. It further includes various stages of process such as build team and identify business goal, evaluate business process, implement business blueprint, etc. Pitch your topic with ease and precision using this SAP Implementation Process Gantt Chart Ppt Slides Sample Pdf. This layout presents information on Business Goal, Evaluate Business Process, Implement Business Blueprint. It is also available for immediate download and adjustment. So, changes can be made in the color, design, graphics or any other component to create a unique layout. This slide represents the timeline or Gantt chart of the SAP implementation process. It further includes various stages of process such as build team and identify business goal, evaluate business process, implement business blueprint, etc.
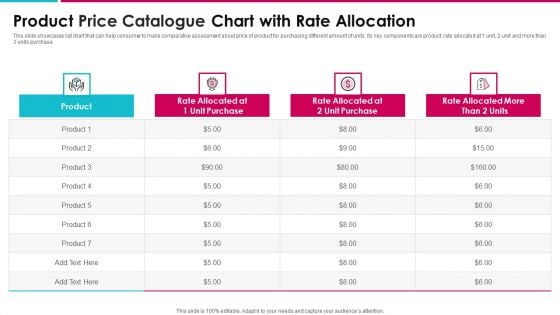
Product Price Catalogue Chart With Rate Allocation Infographics PDF
This slide showcases list chart that can help consumer to make comparative assessment about price of product for purchasing different amount of units. Its key components are product, rate allocated at 1 unit, 2 unit and more than 3 units purchase Pitch your topic with ease and precision using this product price catalogue chart with rate allocation infographics pdf. This layout presents information on product price catalogue chart with rate allocation. It is also available for immediate download and adjustment. So, changes can be made in the color, design, graphics or any other component to create a unique layout.
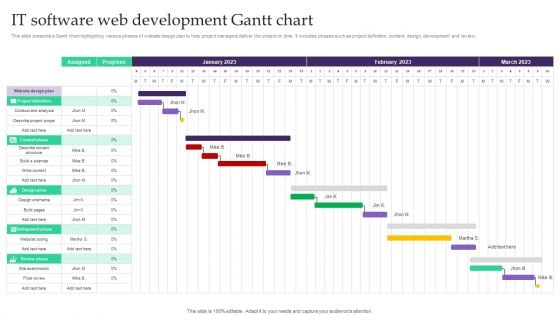
IT Software Web Development Gantt Chart Topics PDF
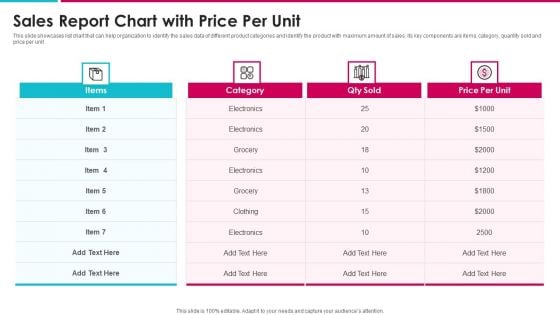
Sales Report Chart With Price Per Unit Information PDF
This slide showcases list chart that can help organization to identify the sales data of different product categories and identify the product with maximum amount of sales. Its key components are items, category, quantity sold and price per unit Showcasing this set of slides titled sales report chart with price per unit information pdf. The topics addressed in these templates are sales report chart with price per unit. All the content presented in this PPT design is completely editable. Download it and make adjustments in color, background, font etc. as per your unique business setting.

Comprehensive Solution Analysis Solution Assessment Criteria Analysis Chart Mockup PDF
This slide shows the solution assessment criteria analysis chart whose purpose is to evaluate the options available for a particular solution based on management receptivity, degree of risk and feasibility, solution cost etc.. along with the total score of each solution. This is a comprehensive solution analysis solution assessment criteria analysis chart mockup pdf template with various stages. Focus and dispense information on one stage using this creative set, that comes with editable features. It contains large content boxes to add your information on topics like solution assessment criteria analysis chart. You can also showcase facts, figures, and other relevant content using this PPT layout. Grab it now.
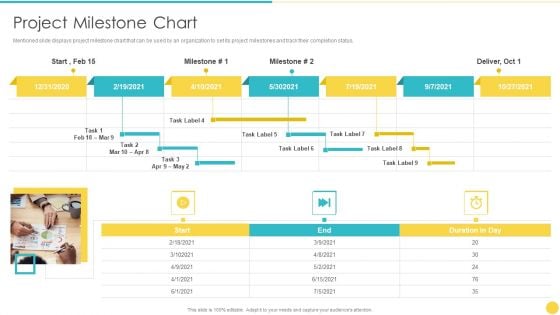
Project Management Professional Toolset IT Project Milestone Chart Download PDF
Mentioned slide displays project milestone chart that can be used by an organization to set its project milestones and track their completion status. This is a project management professional toolset it project milestone chart download pdf template with various stages. Focus and dispense information on one stages using this creative set, that comes with editable features. It contains large content boxes to add your information on topics like project milestone chart. You can also showcase facts, figures, and other relevant content using this PPT layout. Grab it now.

PowerPoint Design Slides Chart Rectangular Jigsaw Puzzle Ppt Designs
PowerPoint Design Slides Chart Rectangular Jigsaw Puzzle PPT Designs- It is all there in bits and pieces. Individual components well researched and understood in their place. Now you need to get it all together to form the complete picture and reach the goal. You have the ideas and plans on how to go about it. Use this template to illustrate your method, piece by piece, and interlock the whole process in the minds of your audience.-PowerPoint Design Slides Chart Rectangular Jigsaw Puzzle PPT Designs Electrify your audience with our PowerPoint Design Slides Chart Rectangular Jigsaw Puzzle Ppt Designs. Just download, type and present.
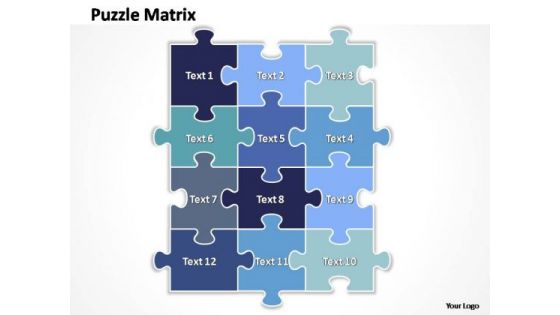
PowerPoint Slide Layout Chart Rectangular Jigsaw Puzzle Ppt Template
PowerPoint Slide layout Chart Rectangular Jigsaw Puzzle PPT Template- It is all there in bits and pieces. Individual components well researched and understood in their place. Now you need to get it all together to form the complete picture and reach the goal. You have the ideas and plans on how to go about it. Use this template to illustrate your method, piece by piece, and interlock the whole process in the minds of your audience.-PowerPoint Slide layout Chart Rectangular Jigsaw Puzzle PPT Template Address eco-clubs with our PowerPoint Slide Layout Chart Rectangular Jigsaw Puzzle Ppt Template. Advocate curbing of carbon emissions.
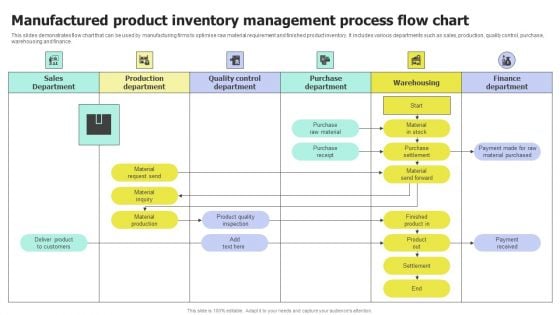
Manufactured Product Inventory Management Process Flow Chart Microsoft PDF
This slide demonstrates flow chart that can be used by manufacturing firms to optimise raw material requirement and finished product inventory. It includes various departments such as sales, production, quality control, purchase, warehousing and finance. Pitch your topic with ease and precision using this Manufactured Product Inventory Management Process Flow Chart Microsoft PDF. This layout presents information on Manufactured Product, Inventory Management, Process Flow Chart. It is also available for immediate download and adjustment. So, changes can be made in the color, design, graphics or any other component to create a unique layout.
PMP Toolkit Project Milestone Chart Ppt Layouts Templates PDF
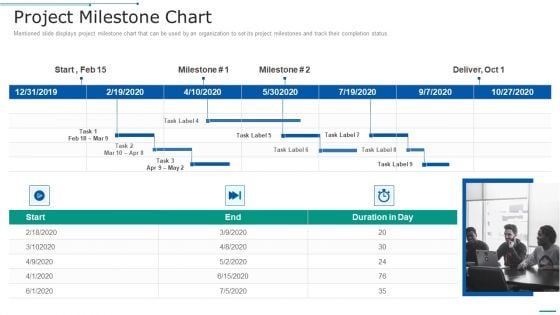
Mentioned slide displays project milestone chart that can be used by an organization to set its project milestones and track their completion status. This is a pmp toolkit project milestone chart ppt layouts templates pdf template with various stages. Focus and dispense information on one stages using this creative set, that comes with editable features. It contains large content boxes to add your information on topics like project milestone chart. You can also showcase facts, figures, and other relevant content using this PPT layout. Grab it now.
Team Structure Organizational Chart Ppt Infographics Example Introduction PDF
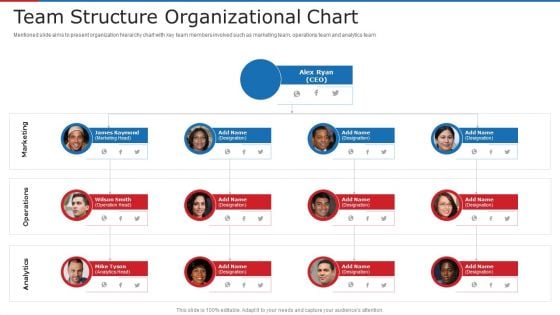
Mentioned slide aims to present organization hierarchy chart with key team members involved such as marketing team, operations team and analytics team. This is a team structure organizational chart ppt infographics example introduction pdf template with various stages. Focus and dispense information on four stages using this creative set, that comes with editable features. It contains large content boxes to add your information on topics like team structure organizational chart. You can also showcase facts, figures, and other relevant content using this PPT layout. Grab it now.

Cross Departmental Technology Skill Gaps Analysis Chart Introduction PDF
This slide covers the gaps in desired and actual skills scorecard of team members in various departments. It includes technical problem solving ability, updating to new innovation, required certification, meeting deadlines, etc. Pitch your topic with ease and precision using this cross departmental technology skill gaps analysis chart introduction pdf. This layout presents information on cross departmental technology skill gaps analysis chart. It is also available for immediate download and adjustment. So, changes can be made in the color, design, graphics or any other component to create a unique layout.
Strategic Performance Analysis And Management Meeting Chart Portrait PDF
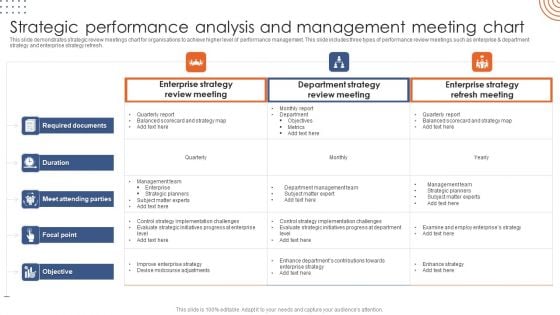
This slide demonstrates strategic review meetings chart for organisations to achieve higher level of performance management. This slide includes three types of performance review meetings such as enterprise and department strategy and enterprise strategy refresh. Pitch your topic with ease and precision using this Strategic Performance Analysis And Management Meeting Chart Portrait PDF. This layout presents information on Enterprise Strategy, Review Meeting, Department Strategy. It is also available for immediate download and adjustment. So, changes can be made in the color, design, graphics or any other component to create a unique layout.
Weekly Project Management Schedule Gantt Chart Information PDF
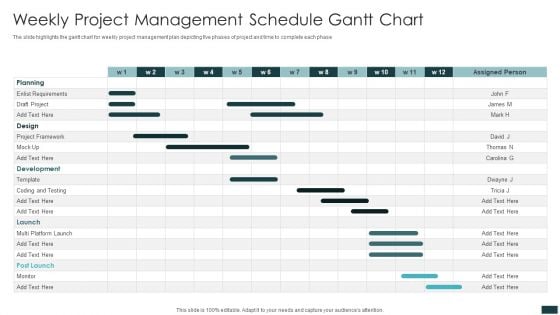
The slide highlights the gantt chart for weekly project management plan depicting five phases of project and time to complete each phase. Pitch your topic with ease and precision using this Weekly Project Management Schedule Gantt Chart Information PDF. This layout presents information on Project Framework, Design, Planning. It is also available for immediate download and adjustment. So, changes can be made in the color, design, graphics or any other component to create a unique layout.
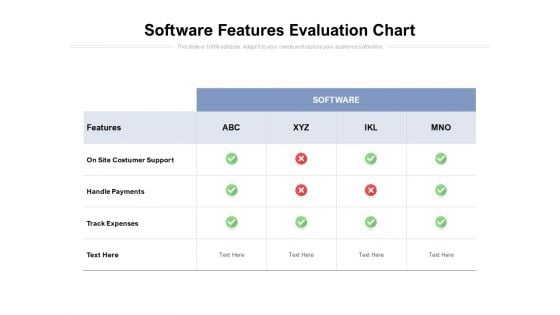
Software Features Evaluation Chart Ppt PowerPoint Presentation Layouts Files
Presenting this set of slides with name software features evaluation chart ppt powerpoint presentation layouts files. The topics discussed in these slides are features, on site costumer support, handle payments, track expenses. This is a completely editable PowerPoint presentation and is available for immediate download. Download now and impress your audience.
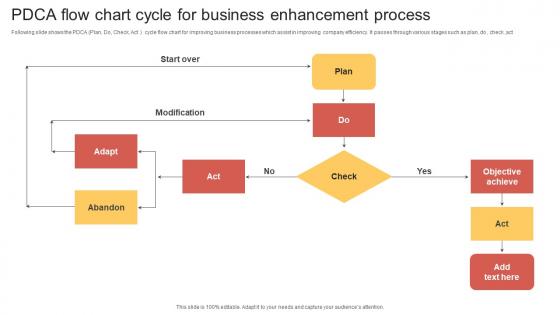
PDCA Flow Chart Cycle For Business Enhancement Process Clipart Pdf
Following slide shows the PDCA Plan, Do, Check, Act cycle flow chart for improving business processes which assist in improving company efficiency. It passes through various stages such as plan, do , check ,act Pitch your topic with ease and precision using this PDCA Flow Chart Cycle For Business Enhancement Process Clipart Pdf. This layout presents information on Modification, Abandon, Start Over. It is also available for immediate download and adjustment. So, changes can be made in the color, design, graphics or any other component to create a unique layout. Following slide shows the PDCA Plan, Do, Check, Act cycle flow chart for improving business processes which assist in improving company efficiency. It passes through various stages such as plan, do , check ,act
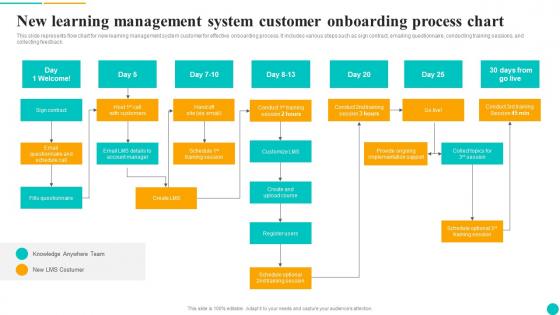
New Learning Management System Customer Onboarding Process Chart Introduction Pdf
This slide represents flow chart for new learning management system customer for effective onboarding process. It includes various steps such as sign contract, emailing questionnaire, conducting training sessions, and collecting feedback. Pitch your topic with ease and precision using this New Learning Management System Customer Onboarding Process Chart Introduction Pdf. This layout presents information on Fills Questionnaire, Create, Register Users. It is also available for immediate download and adjustment. So, changes can be made in the color, design, graphics or any other component to create a unique layout. This slide represents flow chart for new learning management system customer for effective onboarding process. It includes various steps such as sign contract, emailing questionnaire, conducting training sessions, and collecting feedback.
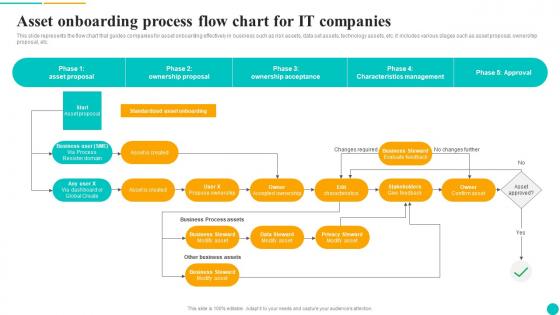
Asset Onboarding Process Flow Chart For IT Companies Formats Pdf
This slide represents the flow chart that guides companies for asset onboarding effectively in business such as risk assets, data set assets, technology assets, etc. it includes various stages such as asset proposal, ownership proposal, etc. Pitch your topic with ease and precision using this Asset Onboarding Process Flow Chart For IT Companies Formats Pdf. This layout presents information on Asset Proposal, Ownership Proposal, Ownership Acceptance. It is also available for immediate download and adjustment. So, changes can be made in the color, design, graphics or any other component to create a unique layout. This slide represents the flow chart that guides companies for asset onboarding effectively in business such as risk assets, data set assets, technology assets, etc. it includes various stages such as asset proposal, ownership proposal, etc.
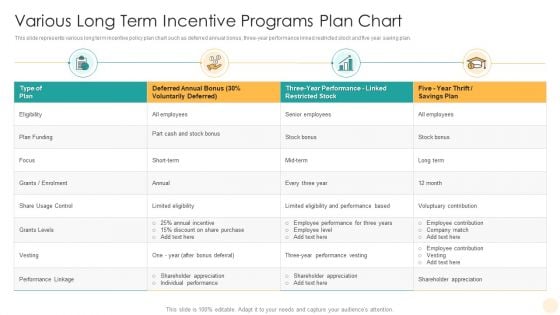
Various Long Term Incentive Programs Plan Chart Pictures PDF
This slide represents various long term incentive policy plan chart such as deferred annual bonus, three year performance linked restricted stock and five year saving plan. Pitch your topic with ease and precision using this Various Long Term Incentive Programs Plan Chart Pictures PDF. This layout presents information on Plan Funding, Restricted Stock, Stock Bonus. It is also available for immediate download and adjustment. So, changes can be made in the color, design, graphics or any other component to create a unique layout.

Business Information Application Protection Testing Flow Chart Themes PDF
This slide covers business application security testing flow chart which includes secure application model, security standard recognition and privacy testing.Pitch your topic with ease and precision using this Business Information Application Protection Testing Flow Chart Themes PDF. This layout presents information on Security Consistency, Target Weighting, Target Recognition. It is also available for immediate download and adjustment. So, changes can be made in the color, design, graphics or any other component to create a unique layout.
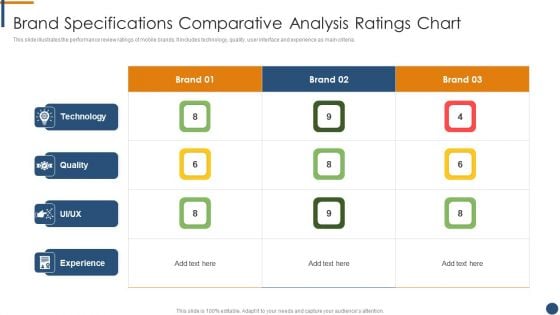
Brand Specifications Comparative Analysis Ratings Chart Demonstration PDF
This slide illustrates the performance review ratings of mobile brands. It includes technology, quality, user interface and experience as main criteria.Showcasing this set of slides titled Brand Specifications Comparative Analysis Ratings Chart Demonstration PDF. The topics addressed in these templates are Technology, Quality, Experience. All the content presented in this PPT design is completely editable. Download it and make adjustments in color, background, font etc. as per your unique business setting
Error Tracking With Priority And Status Analysis Chart Icons PDF
This template covers issues analysis reports based on problem status and priority level. It also includes KPIs such as department, reporting date, responsible person, the actual status of the issue, etc. Showcasing this set of slides titled Error Tracking With Priority And Status Analysis Chart Icons PDF. The topics addressed in these templates are Issue Description, Current Status Issues, Analysis Chart. All the content presented in this PPT design is completely editable. Download it and make adjustments in color, background, font etc. as per your unique business setting.
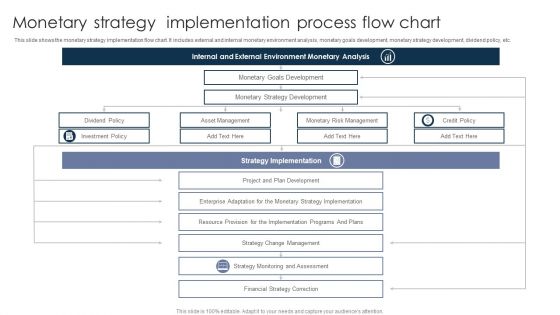
Monetary Strategy Implementation Process Flow Chart Brochure PDF
This slide shows the monetary strategy implementation flow chart. It includes external and internal monetary environment analysis, monetary goals development, monetary strategy development, dividend policy, etc. Pitch your topic with ease and precision using this Monetary Strategy Implementation Process Flow Chart Brochure PDF. This layout presents information on Dividend Policy, Investment Policy, Asset Management. It is also available for immediate download and adjustment. So, changes can be made in the color, design, graphics or any other component to create a unique layout.
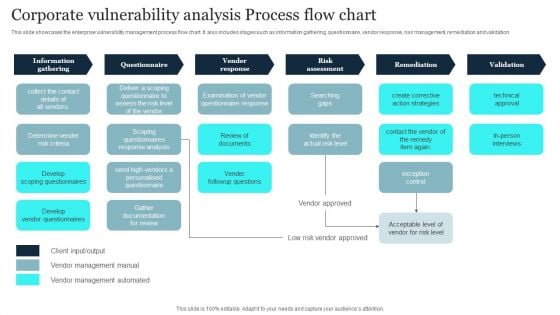
Corporate Vulnerability Analysis Process Flow Chart Summary PDF
This slide showcases the enterprise vulnerability management process flow chart. It also includes stages such as information gathering, questionnaire, vendor response, risk management, remediation and validation. Pitch your topic with ease and precision using this Corporate Vulnerability Analysis Process Flow Chart Summary PDF. This layout presents information on Vender Response, Risk Assessment, Information Gathering. It is also available for immediate download and adjustment. So, changes can be made in the color, design, graphics or any other component to create a unique layout.
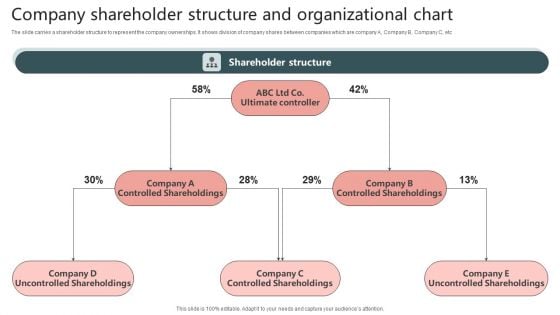
Company Shareholder Structure And Organizational Chart Graphics PDF
The slide carries a shareholder structure to represent the company ownerships. It shows division of company shares between companies which are company A, Company B, Company C, etc. Pitch your topic with ease and precision using this Company Shareholder Structure And Organizational Chart Graphics PDF. This layout presents information on Company Shareholder Structure, Organizational Chart. It is also available for immediate download and adjustment. So, changes can be made in the color, design, graphics or any other component to create a unique layout.
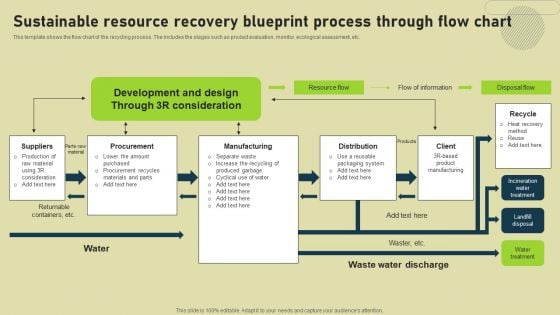
Sustainable Resource Recovery Blueprint Process Through Flow Chart Inspiration PDF
This template shows the flow chart of the recycling process. The includes the stages such as product evaluation, monitor, ecological assessment, etc. Pitch your topic with ease and precision using this Sustainable Resource Recovery Blueprint Process Through Flow Chart Inspiration PDF. This layout presents information on Procurement, Manufacturing, Suppliers. It is also available for immediate download and adjustment. So, changes can be made in the color, design, graphics or any other component to create a unique layout.
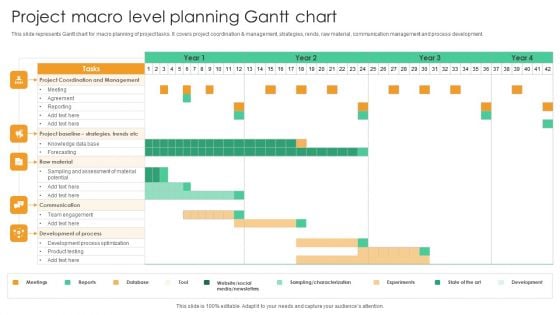
Project Macro Level Planning Gantt Chart Guidelines PDF
This slide represents Gantt chart for macro planning of project tasks. It covers project coordination and management, strategies, rends, raw material, communication management and process development. Pitch your topic with ease and precision using this Project Macro Level Planning Gantt Chart Guidelines PDF. This layout presents information on Project Coordination Management, Raw Material. It is also available for immediate download and adjustment. So, changes can be made in the color, design, graphics or any other component to create a unique layout.
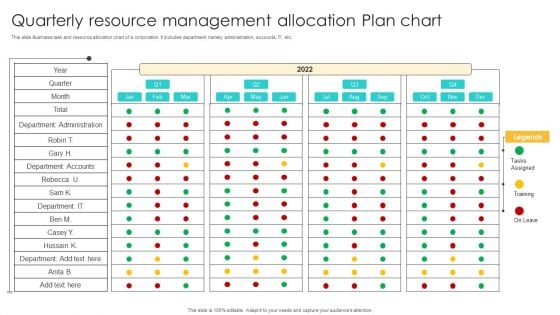
Quarterly Resource Management Allocation Plan Chart Ppt Summary Visuals PDF
This slide illustrates task and resource allocation chart of a corporation. It includes department namely administration, accounts, IT, etc. Pitch your topic with ease and precision using this Quarterly Resource Management Allocation Plan Chart Ppt Summary Visuals PDF. This layout presents information on Quarter, Year, Accounts. It is also available for immediate download and adjustment. So, changes can be made in the color, design, graphics or any other component to create a unique layout.
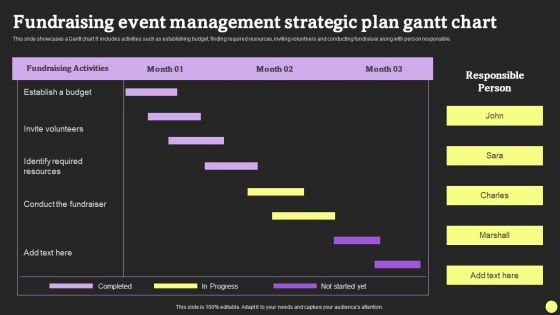
Fundraising Event Management Strategic Plan Gantt Chart Formats PDF
This slide showcases a Gantt chart It includes activities such as establishing budget, finding required resources, inviting volunteers and conducting fundraiser along with person responsible. Pitch your topic with ease and precision using this Fundraising Event Management Strategic Plan Gantt Chart Formats PDF. This layout presents information on Fundraising Activities, Invite Volunteers, Conduct The Fundraiser. It is also available for immediate download and adjustment. So, changes can be made in the color, design, graphics or any other component to create a unique layout.

Input Process Output Chart Analysis In Recruitment Process Sample PDF
This slide covers the IPO chart analysis used in recruitment process by the human resource department. The purpose of this table is improve the hiring process of an organization. It includes information related to the input, process, output and HR. Showcasing this set of slides titled Input Process Output Chart Analysis In Recruitment Process Sample PDF. The topics addressed in these templates are Business Leaders, Manager, Recruiter, Agency. All the content presented in this PPT design is completely editable. Download it and make adjustments in color, background, font etc. as per your unique business setting.
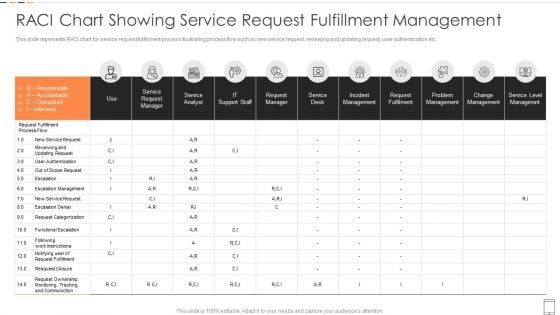
RACI Chart Showing Service Request Fulfillment Management Introduction PDF
This slide represents RACI chart for service request fulfillment process illustrating process flow such as new service request, reviewing and updating request, user authentication etc.Pitch your topic with ease and precision using this RACI Chart Showing Service Request Fulfillment Management Introduction PDF This layout presents information on Incident Management, Request Fulfilment, Problem Management It is also available for immediate download and adjustment. So, changes can be made in the color, design, graphics or any other component to create a unique layout.
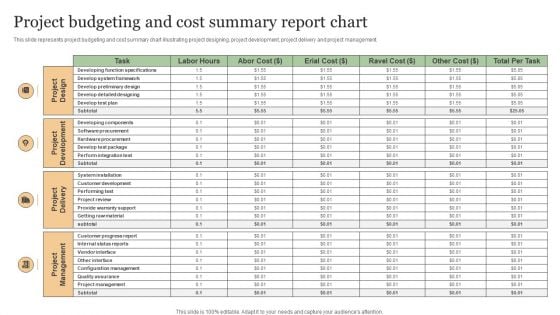
Project Budgeting And Cost Summary Report Chart Demonstration PDF
This slide represents project budgeting and cost summary chart illustrating project designing, project development, project delivery and project management. Pitch your topic with ease and precision using this Project Budgeting And Cost Summary Report Chart Demonstration PDF. This layout presents information on Project Management, Project Delivery, Project Development. It is also available for immediate download and adjustment. So, changes can be made in the color, design, graphics or any other component to create a unique layout.


 Continue with Email

 Home
Home


