Comparison Chart
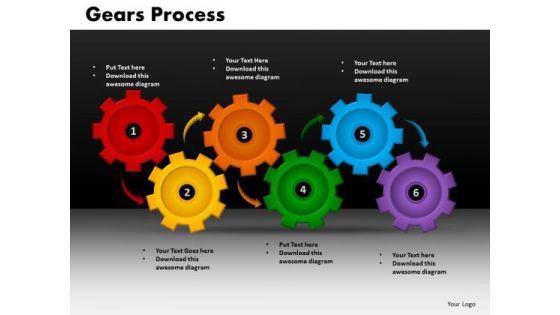
Business Circular Charts PowerPoint Templates Success Gears Process Ppt Slides
Business Circular Charts PowerPoint Templates Success Gears Process PPT Slides-Use this graphics for most important events during the event identification and analysis stage. -Business Circular Charts PowerPoint Templates Success Gears Process PPT Slides-This template can be used for presentations relating to 3d, Business, Circle, Circular, Clockwork, Cogs, Cogwheel, Colorful, Colors, Community, Component, Concept, Cooperate, Cooperation, Cycle, Cyclical, Different, Diverse, Diversity, Gear, Geometric, Hi-Tech, Idea, Industrial, Industry, Machine, Machinery, Mechanical, Mechanics, Round, Process,Progress Test boundaries of presenting with our Business Circular Charts PowerPoint Templates Success Gears Process Ppt Slides. Download without worries with our money back guaranteee.
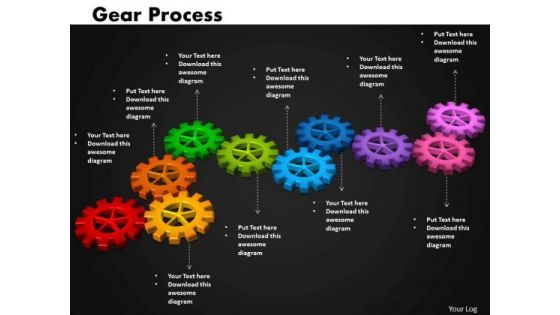
Business Cycle Charts PowerPoint Templates Business Gears Process Ppt Slides
Business Cycle Charts PowerPoint Templates Business Gears Process PPT Slides-Graphic gears Process is a mechanism or group of parts performing one function or serving one purpose in a complex situation-Business Cycle Charts PowerPoint Templates Business Gears Process PPT Slides-This template can be used for presentations relating to 3d, Business, Circle, Circular, Clockwork, Cogs, Cogwheel, Colorful, Colors, Community, Component, Concept, Cooperate, Cooperation, Cycle, Cyclical, Different, Diverse, Diversity, Gear, Geometric, Hi-Tech, Idea, Industrial, Industry, Machine, Machinery, Mechanical, Mechanics, Round, Process,Progress Throw a curveballwith our Business Cycle Charts PowerPoint Templates Business Gears Process Ppt Slides. You'll deliver your best presentation yet.
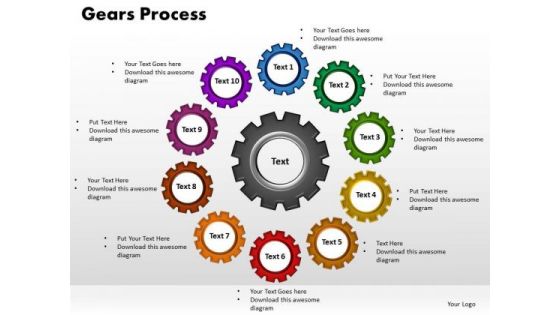
Business Cycle Charts PowerPoint Templates Growth Gears Process Ppt Slides
Business Cycle Charts PowerPoint Templates Growth Gears Process PPT Slides-Geared devices can change the speed, and direction of a power source. Use this graphic to explain sustainability objectives.-Business Cycle Charts PowerPoint Templates Growth Gears Process PPT Slides-This template can be used for presentations relating to 3d, Business, Circle, Circular, Clockwork, Cogs, Cogwheel, Colorful, Colors, Community, Component, Concept, Cooperate, Cooperation, Cycle, Cyclical, Different, Diverse, Diversity, Gear, Geometric, Hi-Tech, Idea, Industrial, Industry, Machine, Machinery, Mechanical, Mechanics, Round, Process,Progress Unite your team with our Business Cycle Charts PowerPoint Templates Growth Gears Process Ppt Slides. Download without worries with our money back guaranteee.
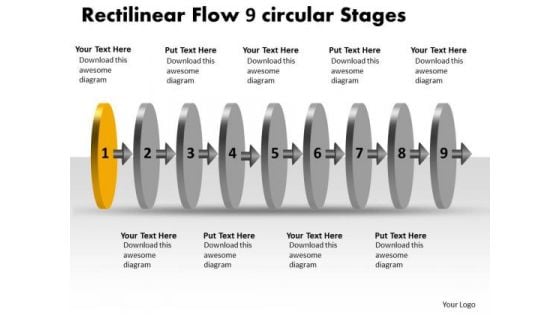
Rectilinear Flow 9 Circular Stages Free Charts PowerPoint Slides
We present our rectilinear flow 9 circular stages free charts PowerPoint Slides.Use our Circle Charts PowerPoint Templates because,The concept and strategy is your strength. Use our Arrows PowerPoint Templates because,You have the moves to sway the market. Use our Design PowerPoint Templates because,You are aware of some pitfalls ahead where you need to be cautious not to overrun and avoid a stall. Use our Shapes PowerPoint Templates because,They have fired the dreams of many fertile minds. Use our Process and Flows PowerPoint Templates because,Individual components well researched and understood in their place.Use these PowerPoint slides for presentations relating to abstract, arrow, blank, business, chart, circular, circulation, concept, conceptual, design, diagram, executive, flow, icon, idea, illustration, linear, management, model, numbers, organization, procedure, process, progression, resource, sequence, sequential, stages, steps, strategy. The prominent colors used in the PowerPoint template are Green, Gray, Black Our Rectilinear Flow 9 Circular Stages Free Charts PowerPoint Slides really apply themselves. They do everything to display your thoughts.
Business Charts PowerPoint Templates Shiney Emoticon Thinking Face Sales
Business Charts PowerPoint templates shiney emoticon thinking face Sales-Use this Thinking Face to make your PowerPoint Presentation more informative and Expressive. It imitates the concept of gleam, glimmer, glisten, glitter, glow, envision, esteem, estimate, expect, fancy, feature, feel, foresee, gather, guess, hold, image, imagine, judge, plan for, presume, project, realize, vision, visualize. Present like a film makerwith our Business Charts PowerPoint Templates Shiney Emoticon Thinking Face Sales. You'll deliver your best presentation yet.
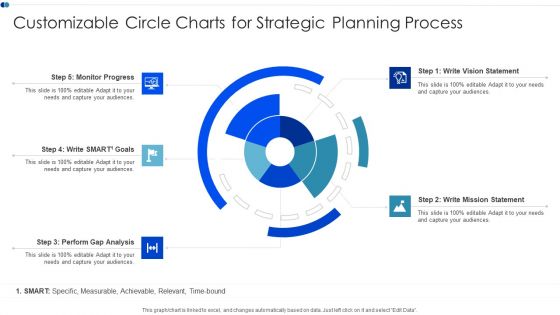
Customizable Circle Charts For Strategic Planning Process Clipart PDF
Pitch your topic with ease and precision using this Customizable Circle Charts For Strategic Planning Process Clipart PDF This layout presents information on Vision Statement, Mission Statement, Monitor Progress It is also available for immediate download and adjustment. So, changes can be made in the color, design, graphics or any other component to create a unique layout.
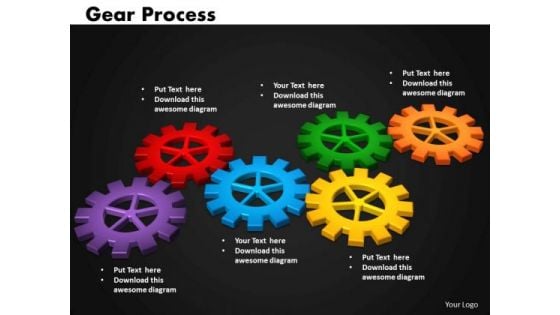
Business Circular Charts PowerPoint Templates Process Gears Process Ppt Slides
Business Circular Charts PowerPoint Templates Process Gears Process PPT Slides-Highlight the key components of your entire manufacturing/ business process. Illustrate how each element flows seamlessly onto the next stage. Emphasise on any critical or key factors within them. Demonstrate how they all combine to form the final product.-Business Circular Charts PowerPoint Templates Process Gears Process PPT Slides-This template can be used for presentations relating to 3d, Business, Circle, Circular, Clockwork, Cogs, Cogwheel, Colorful, Colors, Community, Component, Concept, Cooperate, Cooperation, Cycle, Cyclical, Different, Diverse, Diversity, Gear, Geometric, Hi-Tech, Idea, Industrial, Industry, Machine, Machinery, Mechanical, Mechanics, Round, Process,Progress Our Business Circular Charts PowerPoint Templates Process Gears Process Ppt Slides will give a clarion call. People will fall over each other to come hear you.
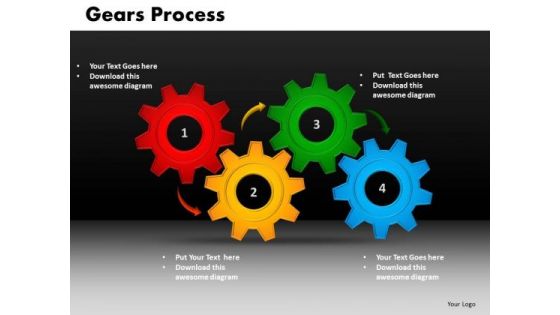
Business Circle Charts PowerPoint Templates Strategy Gears Process Ppt Slides
Business Circle Charts PowerPoint Templates Strategy Gears Process PPT Slides-Development Strategy should primarily be seen as a process.. Illustrate your ideas with this diagram and demonstrate how each factor is important to prove how they mesh to motivate the company team and provide the steam to activate the composite machine-Business Circle Charts PowerPoint Templates Strategy Gears Process PPT Slides-This template can be used for presentations relating to 3d, Business, Circle, Circular, Clockwork, Cogs, Cogwheel, Colorful, Colors, Community, Component, Concept, Cooperate, Cooperation, Cycle, Cyclical, Different, Diverse, Diversity, Gear, Geometric, Hi-Tech, Idea, Industrial, Industry, Machine, Machinery, Mechanical, Mechanics, Round, Process,Progress Our Business Circle Charts PowerPoint Templates Strategy Gears Process Ppt Slides have a glossy look. Your thoughts will also acquire a sheen.
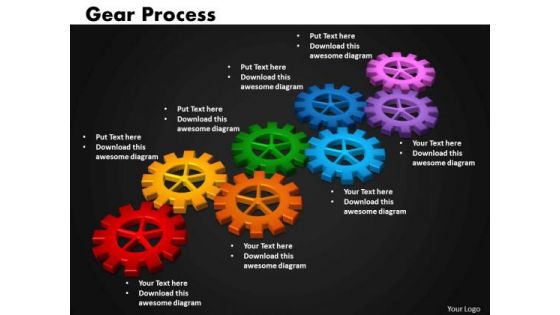
Business Circular Charts PowerPoint Templates Strategy Gears Process Ppt Slides
Business Circular Charts PowerPoint Templates Strategy Gears Process PPT Slides-Development Strategy should primarily be seen as a process.. Illustrate your ideas with this diagram and demonstrate how each factor is important to prove how they mesh to motivate the company team and provide the steam to activate the composite machi-Business Circular Charts PowerPoint Templates Strategy Gears Process PPT Slides-This template can be used for presentations relating to 3d, Business, Circle, Circular, Clockwork, Cogs, Cogwheel, Colorful, Colors, Community, Component, Concept, Cooperate, Cooperation, Cycle, Cyclical, Different, Diverse, Diversity, Gear, Geometric, Hi-Tech, Idea, Industrial, Industry, Machine, Machinery, Mechanical, Mechanics, Round, Process,Progress We guarantee a top notch presentationwith our Business Circular Charts PowerPoint Templates Strategy Gears Process Ppt Slides. You'll deliver your best presentation yet.
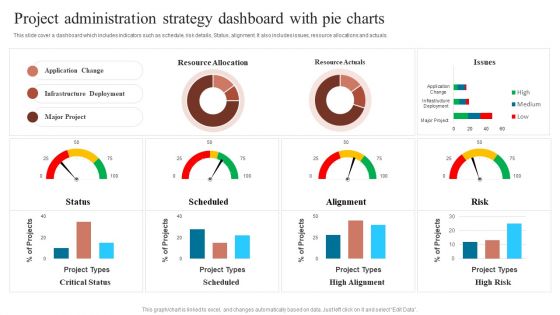
Project Administration Strategy Dashboard With Pie Charts Sample PDF
This slide cover a dashboard which includes indicators such as schedule, risk details, Status, alignment. It also includes issues, resource allocations and actuals. Pitch your topic with ease and precision using this Project Administration Strategy Dashboard With Pie Charts Sample PDF. This layout presents information on Communication Goal, Communication Tool, Increase Revenue. It is also available for immediate download and adjustment. So, changes can be made in the color, design, graphics or any other component to create a unique layout.
Maintenance Software Dashboard With Charts Ppt Icon Slide Download PDF
This slide shows the dashboard of maintenance software which covers tasks per subsystem, highest maintenance time, task count, mean time to repair per level with motherboard, camera, propeller assembly, ground controller, motor , etc. Pitch your topic with ease and precision using this Maintenance Software Dashboard With Charts Ppt Icon Slide Download PDF. This layout presents information on 10 Highest Mean, Time To Repair, 10 Highest Task, Task Per Subsystem, 10 Highest Maintenance. It is also available for immediate download and adjustment. So, changes can be made in the color, design, graphics or any other component to create a unique layout.
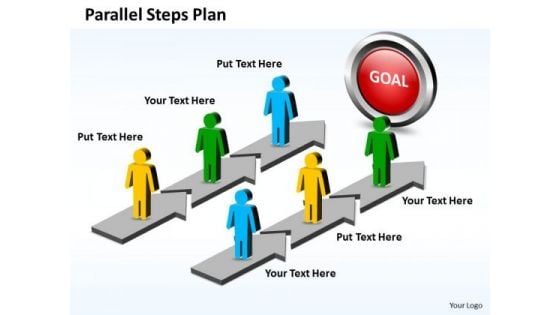
Business Charts PowerPoint Templates Parallel Steps Plan For Planning
Business Charts PowerPoint templates parallel steps plan for planning-This Business PowerPoint Diagram Shows the Parallel steps which individually consists of four stages to achieve the goal. Use this graphic design to represent a continuing sequence of stages, tasks, or events and emphasize the connection between all components.-Business Charts PowerPoint templates parallel steps plan for planning Have some fun with our Business Charts PowerPoint Templates Parallel Steps Plan For Planning. They make creating ideas enjoyable.
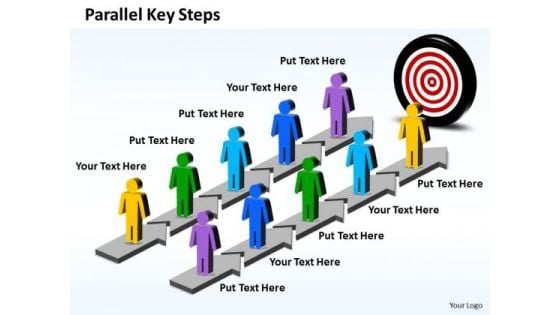
Business Charts PowerPoint Templates Parallel Key Steps Plan
Business Charts PowerPoint templates parallel key steps plan-This Business PowerPoint Diagram Shows the Parallel steps which consists of five stages to achieve the goal. Use this graphic design to represent a continuing sequence of stages, tasks, or events and emphasize the connection between all components.-Business Charts PowerPoint templates parallel key steps plan Get rid of banality with our Business Charts PowerPoint Templates Parallel Key Steps Plan. Take any boredom out of the equation.
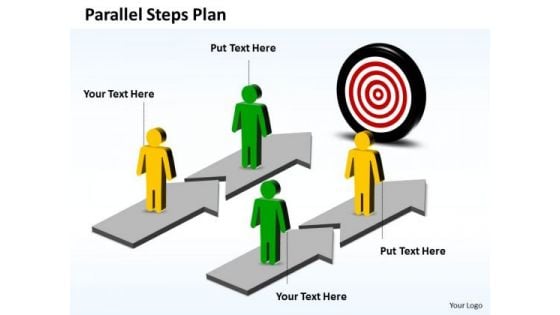
Business Charts PowerPoint Templates Parallel Steps Plan Towards Goal
Business Charts PowerPoint templates parallel steps plan towards goal-Use this Parallel Process with two steps in each process to represent a continuing sequence of stages, tasks, or events in a circular flow and emphasize the connection between all components. This Diagram will definitely make your Presentation more attractive and interesting.-Business Charts PowerPoint templates parallel steps plan towards goal Chop and change with our Business Charts PowerPoint Templates Parallel Steps Plan Towards Goal. Make alterations with alacrity.
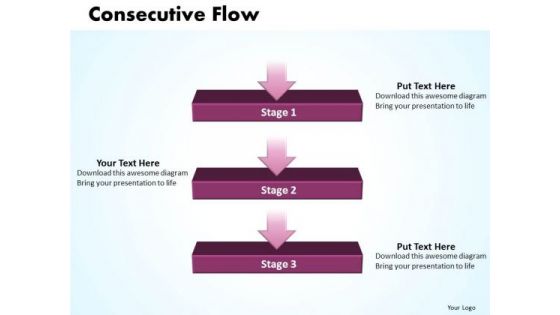
Ppt Linear Flow Process Charts 3 Stage PowerPoint Templates
PPT linear flow process charts 3 stage PowerPoint Templates-This PowerPoint diagram can be used in strategy, consulting and marketing presentations-PPT linear flow process charts 3 stage PowerPoint Templates-Advertise, Advertisement, Badge, Box, Business, Card, Collection, Column, Corporate, Costing, Counting, Design, Discount, Element, Featured, Finance, Grid, Hosting, Information, List, Message, Placard, Plan, Price, Pricing, Rectangle, Report, Round Our Ppt Linear Flow Process Charts 3 Stage PowerPoint Templates are designed to facilitate. They are conceived to make things easier for you.
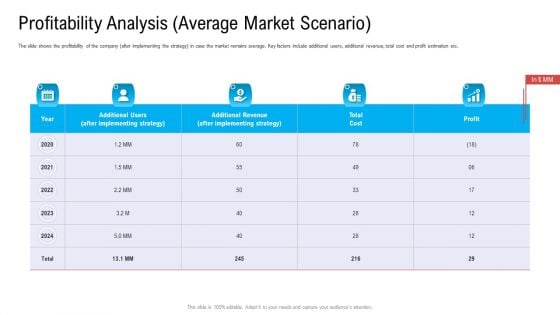
Profitability Analysis Average Market Scenario Ppt Diagram Graph Charts PDF
The slide shows the profitability of the company after implementing the strategy in case the market remains average. Key factors include additional users, additional revenue, total cost and profit estimation etc. Deliver an awe inspiring pitch with this creative profitability analysis average market scenario ppt diagram graph charts pdf bundle. Topics like implementing strategy, additional revenue, total cost, profit can be discussed with this completely editable template. It is available for immediate download depending on the needs and requirements of the user.
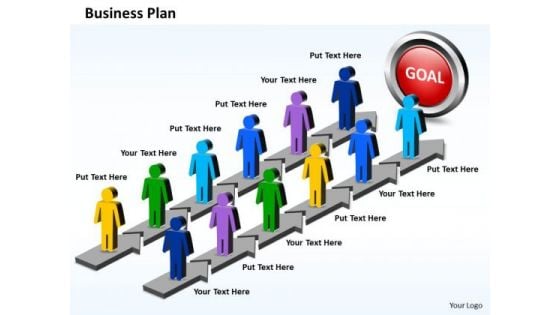
Business Charts PowerPoint Templates Parallel Steps Plan For Achieving Results
Business Charts PowerPoint templates parallel steps plan for achieving results-Use this Parallel Process with six steps in each process to represent a continuing sequence of stages, tasks, or events in a circular flow and emphasize the connection between all components. You can change color, size and orientation of any icon to your liking.-Business Charts PowerPoint templates parallel steps plan for achieving results Communicate goals with our Business Charts PowerPoint Templates Parallel Steps Plan For Achieving Results. Download without worries with our money back guaranteee.
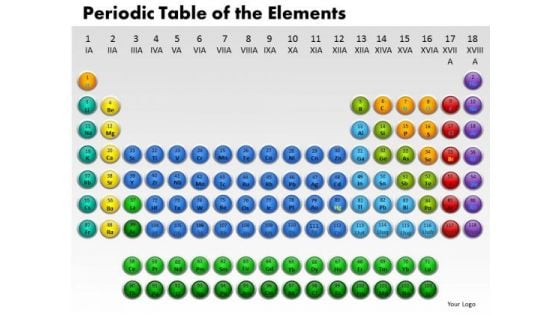
Business Circle Charts PowerPoint Templates Business Periodic Table Ppt Slides
Business Circle Charts PowerPoint Templates Business periodic table PPT Slides-Use this graphics to represent a continuing sequence of stages, tasks, or events in a circular flow and emphasize the connection between all components. -Business Circle Charts PowerPoint Templates Business periodic table PPT Slides-This template can be used for presentations relating to Actinoids, Atom, Atomic, Chemistry, Electrons, Element, Helium, Hydrogen, Lanthanoids, Liquid, Molecule, Noble, Periodic, Physics, Plutonium, Quantum, Radium, Science, Scientific, Solid, Symbol, Table Our Business Circle Charts PowerPoint Templates Business Periodic Table Ppt Slides are academically capable. They make learning a lot more fun.
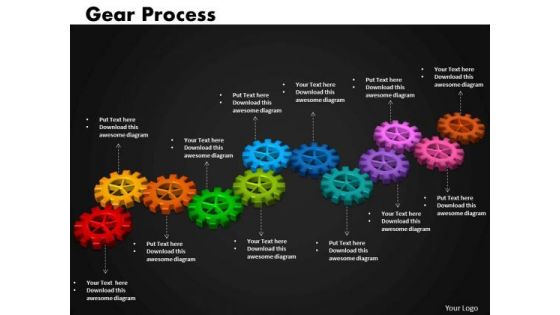
Business Cycle Charts PowerPoint Templates Success Gears Process Ppt Slides
Business Cycle Charts PowerPoint Templates Success Gears Process PPT Slides-Use this graphics for most important events during the event identification and analysis stage.-Business Cycle Charts PowerPoint Templates Success Gears Process PPT Slides-This template can be used for presentations relating to 3d, Business, Circle, Circular, Clockwork, Cogs, Cogwheel, Colorful, Colors, Community, Component, Concept, Cooperate, Cooperation, Cycle, Cyclical, Different, Diverse, Diversity, Gear, Geometric, Hi-Tech, Idea, Industrial, Industry, Machine, Machinery, Mechanical, Mechanics, Round, Process,Progress Attempt great targets with our Business Cycle Charts PowerPoint Templates Success Gears Process Ppt Slides. You will come out on top.
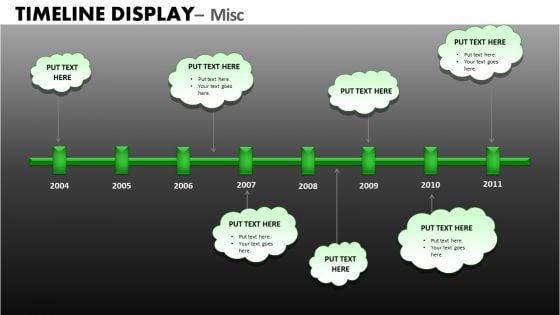
Download Editable Ppt Time Line Charts For PowerPoint Slide
Download_Editable_PPT_Time_Line_Charts_for_PowerPoint_Slide-These high quality powerpoint pre-designed slides and powerpoint templates have been carefully created by our professional team to help you impress your audience. All slides have been created and are 100% editable in powerpoint. Each and every property of any graphic - color, size, orientation, shading, outline etc. can be modified to help you build an effective powerpoint presentation. Any text can be entered at any point in the powerpoint template or slide. Simply DOWNLOAD, TYPE and PRESENT! These PowerPoint presentation slides can be used to represent themes relating to --account, arrow, arrows, away, box, business, chart, choice, choose, concept, concepts, consultation, corporate, design, diagram, direction, elements, flow, follow, follows, future, group, grow, increase, lines, many, month, move, past, period, phase, project, report, rise, row, step, success, text, time, timeline, today, up, way, ways, work, year-Download_Editable_PPT_Time_Line_Charts_for_PowerPoint_Slide Our Download Editable Ppt Time Line Charts For PowerPoint Slide provide an attractive backdrop. Your thoughts will be the main feature.
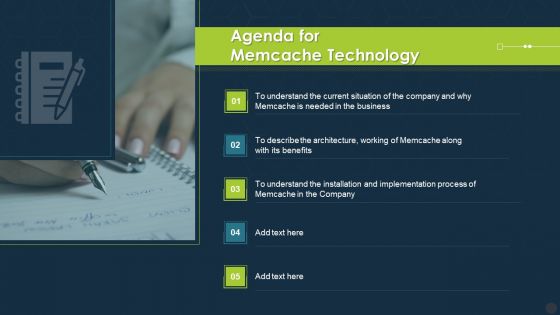
Agenda For Memcache Technology Ppt Diagram Graph Charts PDF
This is a agenda for memcache technology ppt diagram graph charts pdf template with various stages. Focus and dispense information on five stages using this creative set, that comes with editable features. It contains large content boxes to add your information on topics like benefits, implementation, business. You can also showcase facts, figures, and other relevant content using this PPT layout. Grab it now.
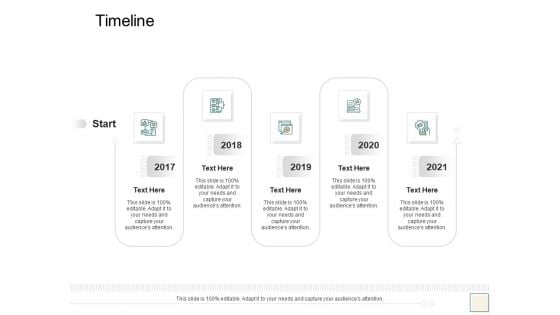
B2B Trade Management Timeline Ppt Diagram Graph Charts PDF
This is a b2b trade management timeline ppt diagram graph charts pdf template with various stages. Focus and dispense information on five stages using this creative set, that comes with editable features. It contains large content boxes to add your information on topics like timeline, 2017 to 2021. You can also showcase facts, figures, and other relevant content using this PPT layout. Grab it now.
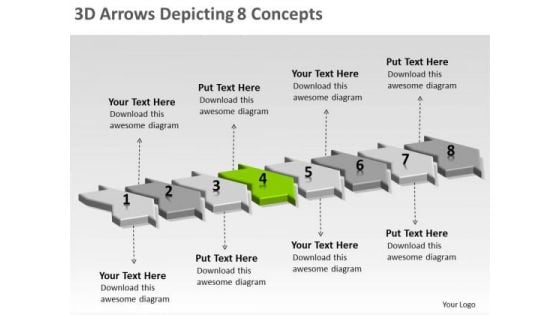
3d Arrows Depicting 8 Concepts Create Flow Charts PowerPoint Templates
We present our 3d arrows depicting 8 concepts create flow charts PowerPoint templates. Use our Marketing PowerPoint Templates because, Individual components well researched and understood in their place. Use our Business PowerPoint Templates because, are the triggers of our growth. Use our Shapes PowerPoint Templates because; educate your staff on the means to provide the required support for speedy recovery. Use our Process and Flows PowerPoint Templates because, Timelines Template:- Getting it done may not be enough. Use our Arrows PowerPoint Templates because, Brainstorming Light Bulbs: - The atmosphere in the workplace is electric. Use these PowerPoint slides for presentations relating to Arrows, business, career, cartoon, center, challenge, change, choice, concept, confusion, crossroads, decide, deciding, decision, directions, figure, idea, man, many, opportunity, paths, person, problem, question, risk, strategic, strategize, strategy, uncertain. The prominent colors used in the PowerPoint template are Green, Black, and Gray No matter how fastidious you like to be. Our 3d Arrows Depicting 8 Concepts Create Flow Charts PowerPoint Templates will satisfy your every condition.
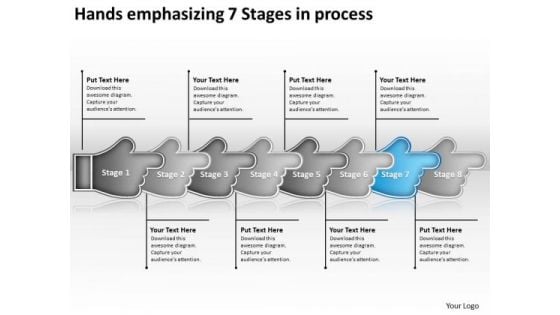
Hands Emphasizing 7 Stages Process Sample Flow Charts PowerPoint Templates
We present our hands emphasizing 7 stages process sample flow charts PowerPoint templates. Use our Advertising PowerPoint Templates because, creating a winner is your passion and dream. Use our Shapes PowerPoint Templates because, now fire the arrows to emblazon the desired path by which you will achieve anticipated results. Use our Business PowerPoint Templates because; Highlight the key components of your entire manufacturing/ business process. Use our Process and Flows PowerPoint Templates because, are the Tools of the Trade. Use our Signs PowerPoint Templates because, Start the gears of youthful minds and set them in motion. Use these PowerPoint slides for presentations relating to Alone, arranging, background, child, dirty, empty, family, handprint, hands, human, identity, illustration, isolated, messy, naked, objects, painting, palm, shape, simple, stage, stained, stamp, toe, togetherness. The prominent colors used in the PowerPoint template are Gray, White, and Blue Display your faith in your team with our Hands Emphasizing 7 Stages Process Sample Flow Charts PowerPoint Templates. Demonstrate your strong belief in them.
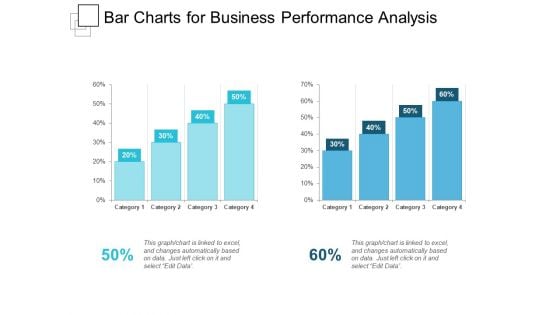
Bar Charts For Business Performance Analysis Ppt PowerPoint Presentation Show Slideshow
This is a bar charts for business performance analysis ppt powerpoint presentation show slideshow. This is a two stage process. The stages in this process are compare, comparison of two, competitive analysis.
Business Competitors Analysis Table Ppt Powerpoint Presentation Icon Brochure
This is a business competitors analysis table ppt powerpoint presentation icon brochure. This is a six stage process. The stages in this process are comparison chart, comparison table, comparison matrix.
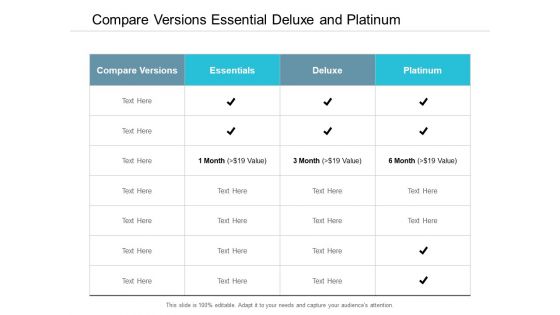
Compare Versions Essential Deluxe And Platinum Ppt Powerpoint Presentation File Graphics Download
This is a compare versions essential deluxe and platinum ppt powerpoint presentation file graphics download. This is a four stage process. The stages in this process are comparison chart, comparison table, comparison matrix.
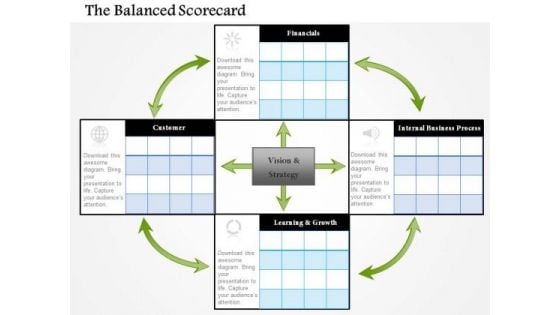
Business Framework The Balanced Scorecard PowerPoint Presentation
This business diagram displays framework for comparison chart. It contains matrix chart for comparison of four products. This diagram enables the users to create their own display of the required processes in an easy way.
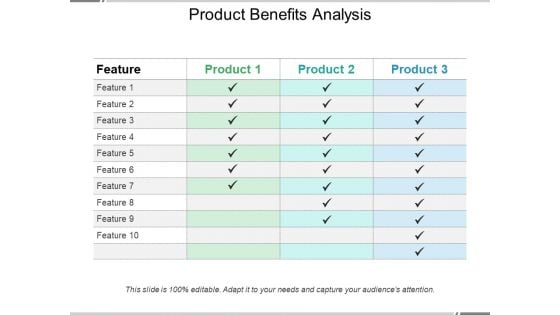
Product Benefits Analysis Ppt PowerPoint Presentation Summary Background
This is a product benefits analysis ppt powerpoint presentation summary background. This is a four stage process. The stages in this process are comparison chart, comparison table, comparison matrix.
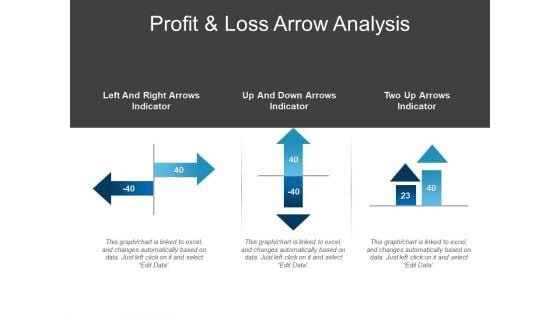
Profit And Loss Arrow Analysis Ppt PowerPoint Presentation Infographic Template Model
This is a profit and loss arrow analysis ppt powerpoint presentation infographic template model. This is a three stage process. The stages in this process are comparison chart, comparison table, comparison matrix.
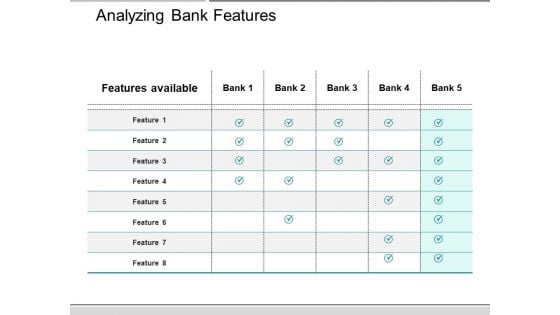
Analyzing Bank Features Ppt PowerPoint Presentation Professional Background
This is a analyzing bank features ppt powerpoint presentation professional background. This is a six stage process. The stages in this process are comparison chart, comparison table, comparison matrix.
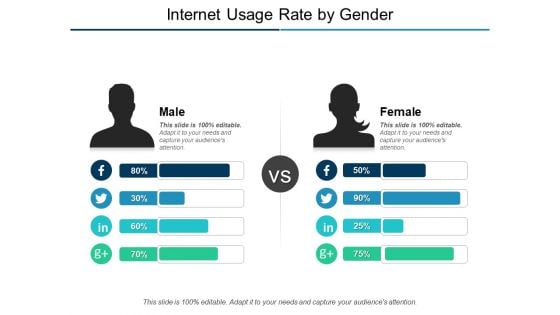
Internet Usage Rate By Gender Ppt PowerPoint Presentation Outline Diagrams
This is a internet usage rate by gender ppt powerpoint presentation outline diagrams. This is a two stage process. The stages in this process are comparison chart, comparison table, comparison matrix.
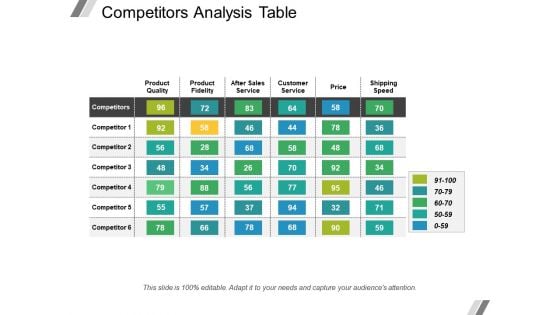
Competitors Analysis Table Ppt PowerPoint Presentation Layouts Example Introduction
This is a competitors analysis table ppt powerpoint presentation layouts example introduction. This is a seven stage process. The stages in this process are comparison chart, comparison table, comparison matrix.
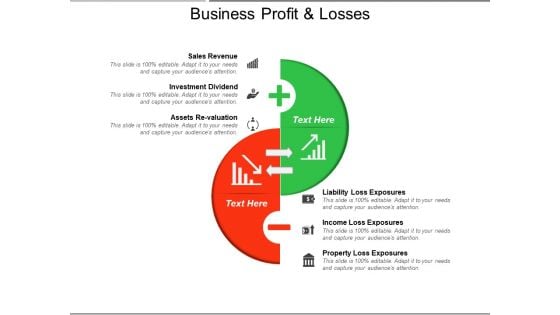
Business Profit And Losses Ppt PowerPoint Presentation Summary Outline
This is a business profit and losses ppt powerpoint presentation summary outline. This is a two stage process. The stages in this process are comparison chart, comparison table, comparison matrix.
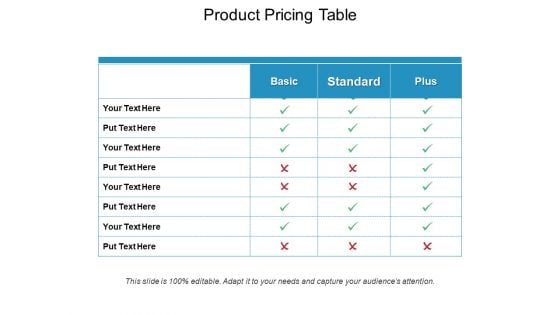
Product Pricing Table Ppt PowerPoint Presentation File Deck
This is a product pricing table ppt powerpoint presentation file deck. This is a four stage process. The stages in this process are comparison chart, comparison table, comparison matrix.
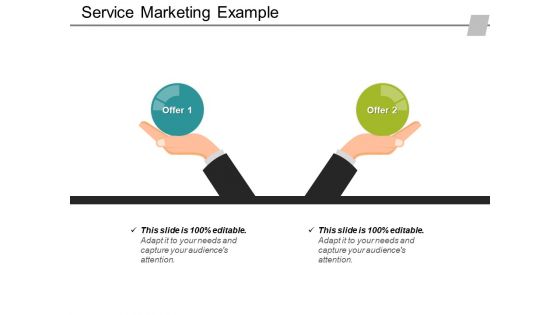
Service Marketing Example Ppt PowerPoint Presentation Styles Example File
This is a service marketing example ppt powerpoint presentation styles example file. This is a two stage process. The stages in this process are comparison chart, comparison table, comparison matrix.
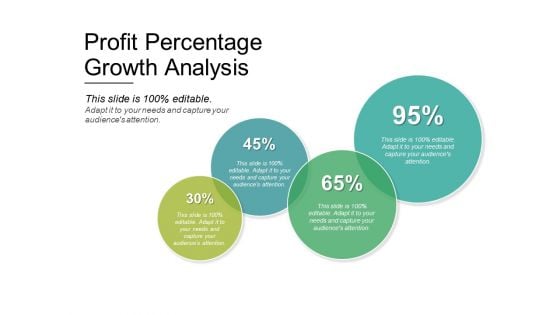
Profit Percentage Growth Analysis Ppt PowerPoint Presentation Layouts Graphics Tutorials
This is a profit percentage growth analysis ppt powerpoint presentation layouts graphics tutorials. This is a four stage process. The stages in this process are comparison chart, comparison table, comparison matrix.
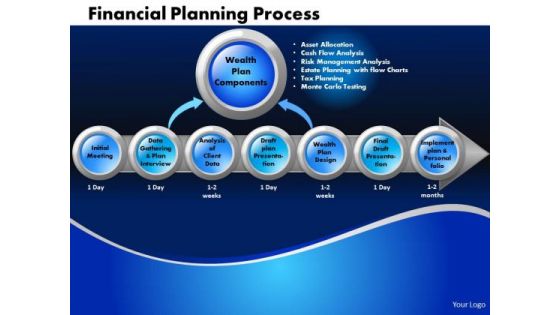
Business Circle Charts PowerPoint Templates Marketing Financial Planning Process Ppt Slides
Business Circle Charts PowerPoint Templates Marketing Financial Planning Process PPT Slides-This circle chart can be used in business, education and economic presentations to help the audience visualize the content better, or to find flaws in a financial planning process.-Business Circle Charts PowerPoint Templates Marketing Financial Planning Process PPT Slides-This template can be used for presentations relating to Abstract, Action, Business, Chart, Commerce, Competitor, Components, Concept, Conceptual, Design, Diagram, Executive, Financial, Goals, Guide, Guidelines, Hierarchy, Icon, Idea, Illustration, Manage, Management, Marketing, Mind, Mission, Model, Operations, Organization, Performance, Plan, Planning, Process Our Business Circle Charts PowerPoint Templates Marketing Financial Planning Process Ppt Slides team are good at their craft. They have chiselled out designer products.
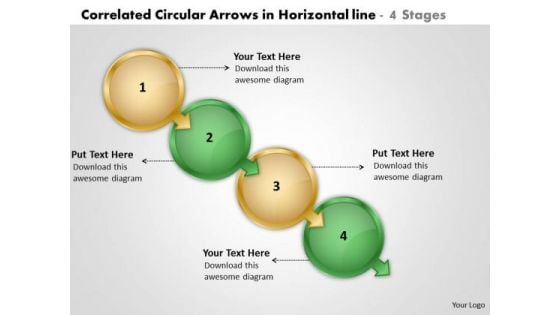
Correlated Circular Arrows In Horizontal Line 4 Stages Create Flow Charts PowerPoint Slides
We present our correlated circular arrows in horizontal line 4 stages create flow charts PowerPoint Slides.Use our Circle Charts PowerPoint Templates because,Motivating your team will cross all barriers. Use our Arrows PowerPoint Templates because,The foundation stones of many a life. Use our Leadership PowerPoint Templates because, You can Show them how to churn out fresh ideas. Use our Business PowerPoint Templates because, You have had your share of being a goldfish in a small bowl.You are ready to launch out and spread your wings Use our Process and Flows PowerPoint Templates because, It can illustrate your chain of ideas focusing on that aspect or resource in order to enhance the quality of your product.Use these PowerPoint slides for presentations relating to 3d, abstract, around, arrows, blue, border, business, center, circle, circular, concept, connections, copy, curve, cycle, directions, distribution, illustration, management, middle, objects, pieces, plan, pointing, process, recycle, rounded, shadows, space, system. The prominent colors used in the PowerPoint template are Yellow, Green, Black. People tell us our correlated circular arrows in horizontal line 4 stages create flow charts PowerPoint Slides will get their audience's attention. The feedback we get is that our circle PowerPoint templates and PPT Slides are Charming. People tell us our correlated circular arrows in horizontal line 4 stages create flow charts PowerPoint Slides are Graceful. Presenters tell us our circle PowerPoint templates and PPT Slides will make you look like a winner. The feedback we get is that our correlated circular arrows in horizontal line 4 stages create flow charts PowerPoint Slides are Romantic. Professionals tell us our around PowerPoint templates and PPT Slides are Adorable. Cure your organization's problems with our Correlated Circular Arrows In Horizontal Line 4 Stages Create Flow Charts PowerPoint Slides. You will come out on top.
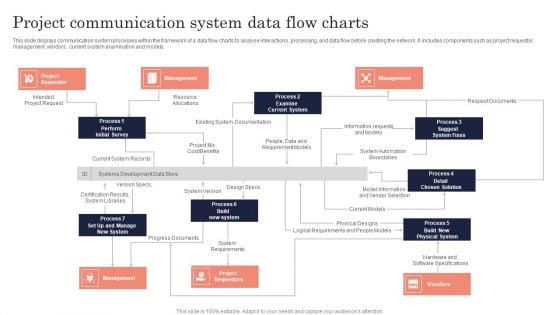
Project Communication System Data Flow Charts Ppt PowerPoint Presentation Gallery Background Images PDF
This slide displays communication system processes within the framework of a data flow charts to analyse interactions, processing, and data flow before creating the network. it includes components such as project requestor, management, vendors, current system examination and models. Presenting Project Communication System Data Flow Charts Ppt PowerPoint Presentation Gallery Background Images PDF to dispense important information. This template comprises six stages. It also presents valuable insights into the topics including Project Requestor, Management, Vendors. This is a completely customizable PowerPoint theme that can be put to use immediately. So, download it and address the topic impactfully.
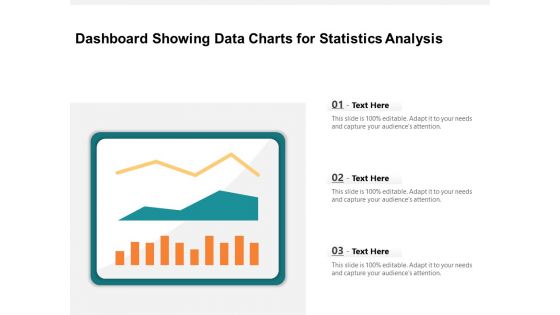
Dashboard Showing Data Charts For Statistics Analysis Ppt PowerPoint Presentation Infographic Template Grid PDF
Pitch your topic with ease and precision using this dashboard showing data charts for statistics analysis ppt powerpoint presentation infographic template grid pdf. This layout presents information on dashboard showing data charts for statistics analysis. It is also available for immediate download and adjustment. So, changes can be made in the color, design, graphics or any other component to create a unique layout.
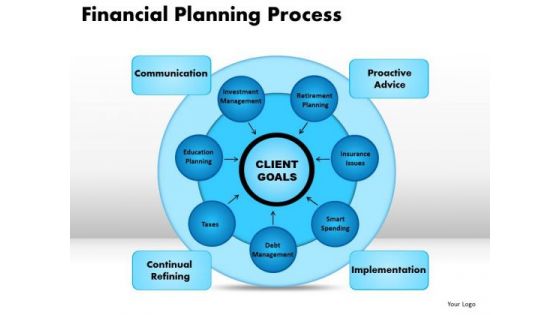
Business Circle Charts PowerPoint Templates Business Financial Planning Process Ppt Slides
Business Circle Charts PowerPoint Templates Business Financial Planning Process PPT Slides-This PowerPoint diagram shows transformations from one stage to others stage of Financial Planning Process-Business Circle Charts PowerPoint Templates Business Financial Planning Process PPT Slides-This template can be used for presentations relating to Abstract, Action, Business, Chart, Commerce, Competitor, Components, Concept, Conceptual, Design, Diagram, Executive, Financial, Goals, Guide, Guidelines, Hierarchy, Icon, Idea, Illustration, Manage, Management, Marketing, Mind, Mission, Model, Operations, Organization, Performance, Plan, Planning, Process Our Business Circle Charts PowerPoint Templates Business Financial Planning Process Ppt Slides team love fact finding missions. They enjoy bringing the truth to you.
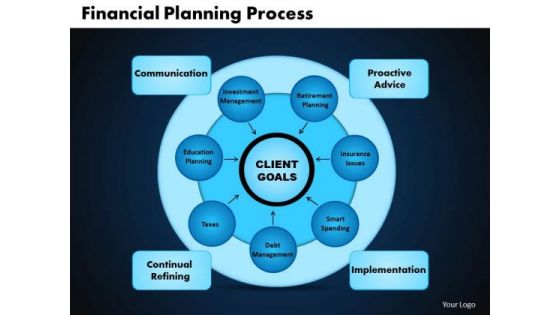
Business Circle Charts PowerPoint Templates Leadership Financial Planning Process Ppt Slides
Business Circle Charts PowerPoint Templates Leadership Financial Planning Process PPT Slides-This PowerPoint diagram shows transformations from one stage to others stage of Financial Planning Process-Business Circle Charts PowerPoint Templates Leadership Financial Planning Process PPT Slides-This template can be used for presentations relating to Abstract, Action, Business, Chart, Commerce, Competitor, Components, Concept, Conceptual, Design, Diagram, Executive, Financial, Goals, Guide, Guidelines, Hierarchy, Icon, Idea, Illustration, Manage, Management, Marketing, Mind, Mission, Model, Operations, Organization, Performance, Plan, Planning, Process The colour contrasts of our Business Circle Charts PowerPoint Templates Leadership Financial Planning Process Ppt Slides are aesthetically designed. They put the focus on key factors.
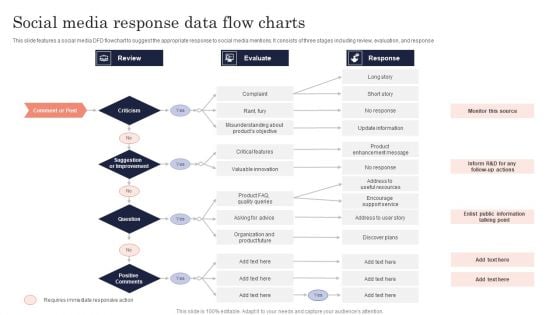
Social Media Response Data Flow Charts Ppt PowerPoint Presentation Gallery Background Designs PDF
This slide features a social media dfd flowchart to suggest the appropriate response to social media mentions. it consists of three stages including review, evaluation, and response. Persuade your audience using this Social Media Response Data Flow Charts Ppt PowerPoint Presentation Gallery Background Designs PDF. This PPT design covers three stages, thus making it a great tool to use. It also caters to a variety of topics including Review, Evaluate, Response, Comment Or Post. Download this PPT design now to present a convincing pitch that not only emphasizes the topic but also showcases your presentation skills.
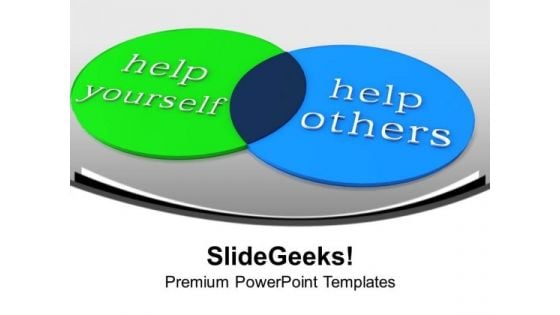
Venn Diagram Of Help Circle Charts PowerPoint Templates Ppt Backgrounds For Slides 1112
We present our Venn Diagram Of Help Circle Charts PowerPoint Templates PPT Backgrounds For Slides 1112.Download and present our Circle charts PowerPoint Templates because there are a bucketful of brilliant ideas swirling around within your group. Download our Venn diagrams PowerPoint Templates because you have an idea of which you are sure. Download our Business PowerPoint Templates because maximising sales of your product is the intended destination. Download and present our Education PowerPoint Templates because we all know Education is the foundation of growth in any endeavour. Use our Success PowerPoint Templates because iT outlines the entire thought process for the benefit of others. Tell it to the world with your characteristic aplomb.Use these PowerPoint slides for presentations relating to Venn diagram help others help yourself, circle charts, venn diagrams, business, education, success. The prominent colors used in the PowerPoint template are Green, Blue, Blue navy. People tell us our Venn Diagram Help Others Help Yourself Circle Charts PowerPoint Templates PPT Backgrounds For Slides 1112 are specially created by a professional team with vast experience. They diligently strive to come up with the right vehicle for your brilliant Ideas. Presenters tell us our charts PowerPoint templates and PPT Slides are Nostalgic. PowerPoint presentation experts tell us our Venn Diagram Help Others Help Yourself Circle Charts PowerPoint Templates PPT Backgrounds For Slides 1112 are Efficient. Customers tell us our charts PowerPoint templates and PPT Slides are Ritzy. Customers tell us our Venn Diagram Help Others Help Yourself Circle Charts PowerPoint Templates PPT Backgrounds For Slides 1112 are Awesome. Customers tell us our charts PowerPoint templates and PPT Slides are Stylish. Our Venn Diagram Of Help Circle Charts PowerPoint Templates Ppt Backgrounds For Slides 1112 are academically capable. They make learning a lot more fun.
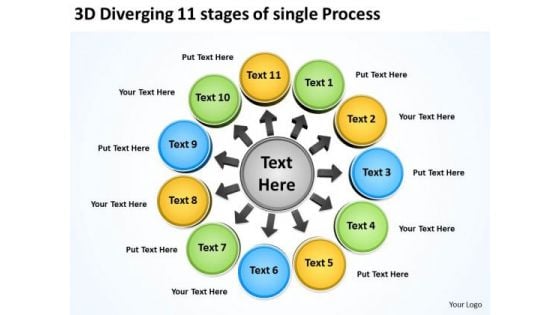
3d Diverging 11 Stages Of Single Process Ppt Charts And Diagrams PowerPoint Templates
We present our 3d diverging 11 stages of single process ppt Charts and Diagrams PowerPoint templates.Use our Circle Charts PowerPoint Templates because it is a step by step process with levels rising at every stage. Use our Arrows PowerPoint Templates because this PPt slide can educate your listeners on the relevance and importance of each one as per your plan and how they all contribute as you strive to hit the Bullseye. Download our Business PowerPoint Templates because The foundation of the structure of your business is resilient and dependable. Convey this confidence to your colleagues and assure them of a great and enduring future. Download our Shapes PowerPoint Templates because others naturally tend to follow in the path blazed by you. Present our Flow Charts PowerPoint Templates because our PowerPoint templates designed for your ideas to sell.Use these PowerPoint slides for presentations relating to advice, analysis, analyze, background, blank, business, center, central, chalk, component, concept, connection, core, counter, deploy, diagram, distribute, draw, education, element, exchange, flow, gather, industry, input, join, link, management, manager, output, people, person, plan, process, reaction, strategy, support, surround, teamwork. The prominent colors used in the PowerPoint template are Yellow, Green, Blue. Customers tell us our 3d diverging 11 stages of single process ppt Charts and Diagrams PowerPoint templates are Liberated. PowerPoint presentation experts tell us our analyze PowerPoint templates and PPT Slides are Ultra. People tell us our 3d diverging 11 stages of single process ppt Charts and Diagrams PowerPoint templates are topically designed to provide an attractive backdrop to any subject. People tell us our background PowerPoint templates and PPT Slides will help you be quick off the draw. Just enter your specific text and see your points hit home. Customers tell us our 3d diverging 11 stages of single process ppt Charts and Diagrams PowerPoint templates are Fashionable. People tell us our center PowerPoint templates and PPT Slides are Enchanting. Fall back on our 3d Diverging 11 Stages Of Single Process Ppt Charts And Diagrams PowerPoint Templates at anytime. They are always ready and able to answer your call.
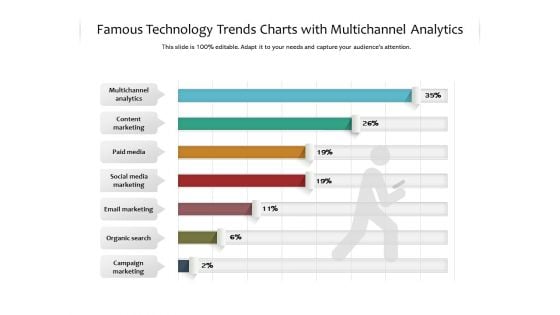
Famous Technology Trends Charts With Multichannel Analytics Ppt PowerPoint Presentation Ideas Graphics Tutorials PDF
Pitch your topic with ease and precision using this famous technology trends charts with multichannel analytics ppt powerpoint presentation ideas graphics tutorials pdf. This layout presents information on multichannel analytics, content marketing, paid media, social media marketing, email marketing . It is also available for immediate download and adjustment. So, changes can be made in the color, design, graphics or any other component to create a unique layout.

SEO Trend Charts With On Site Optimization Ppt PowerPoint Presentation Gallery Inspiration PDF
Pitch your topic with ease and precision using this seo trend charts with on site optimization ppt powerpoint presentation gallery inspiration pdf. This layout presents information on social media marketing, content creation, site optimization, local search optimization. It is also available for immediate download and adjustment. So, changes can be made in the color, design, graphics or any other component to create a unique layout.
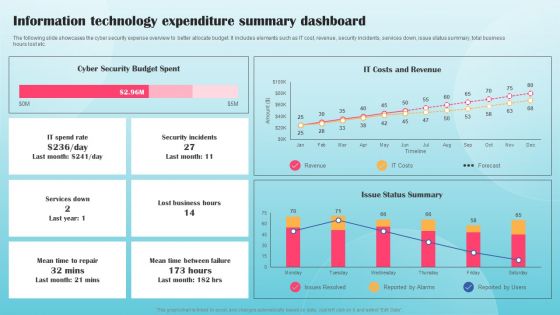
Information Technology Expenditure Summary Dashboard Ppt PowerPoint Presentation Diagram Graph Charts PDF
The following slide showcases the cyber security expense overview to better allocate budget. It includes elements such as IT cost, revenue, security incidents, services down, issue status summary, total business hours lost etc. This Information Technology Expenditure Summary Dashboard Ppt PowerPoint Presentation Diagram Graph Charts PDF from Slidegeeks makes it easy to present information on your topic with precision. It provides customization options, so you can make changes to the colors, design, graphics, or any other component to create a unique layout. It is also available for immediate download, so you can begin using it right away. Slidegeeks has done good research to ensure that you have everything you need to make your presentation stand out. Make a name out there for a brilliant performance.

Business Diagram Six Staged Pie Charts For Text Representation PowerPoint Slide
This slide displays graphic six staged pie charts. Download this diagram to present and compare business data. Use this diagram to display business process workflows in any presentation.
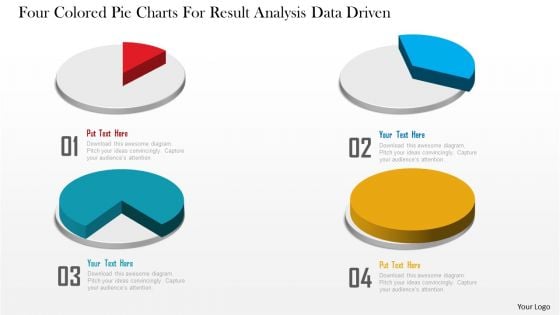
Business Diagram Four Colored Pie Charts For Result Analysis Data Driven PowerPoint Slide
This business diagram displays graphic of pie charts. This business slide is suitable to present and compare business data. Use this diagram to build professional presentations for your viewers.
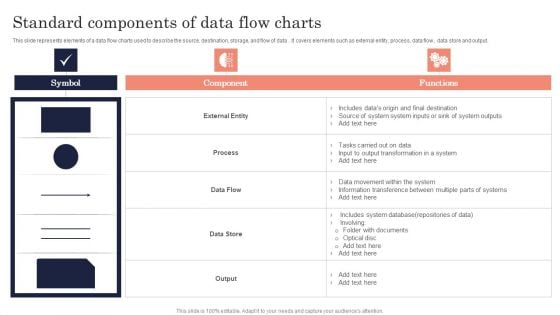
Standard Components Of Data Flow Charts Ppt PowerPoint Presentation File Pictures PDF
this slide represents elements of a data flow charts used to describe the source, destination, storage, and flow of data. it covers elements such as external entity, process, data flow, data store and output. Showcasing this set of slides titled Standard Components Of Data Flow Charts Ppt PowerPoint Presentation File Pictures PDF. The topics addressed in these templates are Symbol, Component, Functions. All the content presented in this PPT design is completely editable. Download it and make adjustments in color, background, font etc. as per your unique business setting.
Statistical Analysis Icon With Business Charts Ppt PowerPoint Presentation Gallery File Formats PDF
Pitch your topic with ease and precision using this statistical analysis icon with business charts ppt powerpoint presentation gallery file formats pdf. This layout presents information on statistical analysis icon with business charts. It is also available for immediate download and adjustment. So, changes can be made in the color, design, graphics or any other component to create a unique layout.
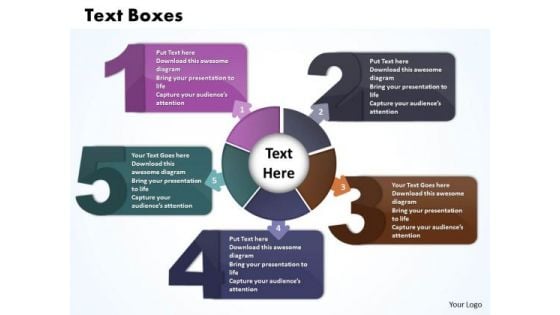
Business Charts PowerPoint Templates Five Text Boxes Connected With Circular Direction
Business Charts PowerPoint templates five text boxes connected with circular direction-Use this Circular Process with five text Boxes to represent a continuing sequence of stages, tasks, or events in a circular flow and emphasize the connection between all components. You can change color, size and orientation of any icon to your liking.-Business Charts PowerPoint templates five text boxes connected with circular direction Create an engaging ambience with our Business Charts PowerPoint Templates Five Text Boxes Connected With Circular Direction. Their content will appeal to all the brains.
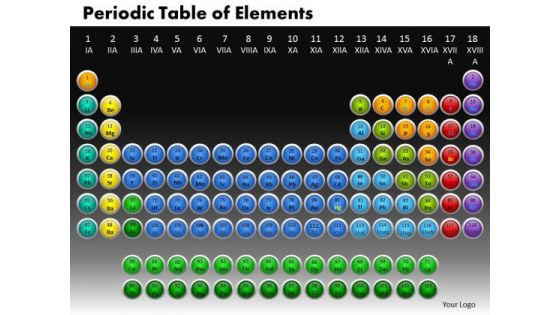
Business Circle Charts PowerPoint Templates Business Periodic Table Of Elements Ppt Slides
Business Circle Charts PowerPoint Templates Business periodic table of elements PPT Slides-Use this graphic to represent a continuing sequence of stages, tasks, or events in a circular flow and emphasize the connection between all components. -Business Circle Charts PowerPoint Templates Business periodic table of elements PPT Slides-This template can be used for presentations relating to Actinoids, Atom, Atomic, Chemistry, Electrons, Element, Helium, Hydrogen, Lanthanoids, Liquid, Molecule, Noble, Periodic, Physics, Plutonium, Quantum, Radium, Science, Scientific, Solid, Symbol, Table Our Business Circle Charts PowerPoint Templates Business Periodic Table Of Elements Ppt Slides are based on factual inputs. Your thoughts deserve the true picture.
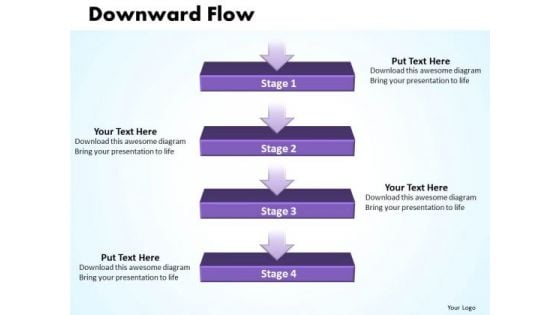
Ppt Linear Flow Process Charts 4 Power Point Stage PowerPoint Templates
PPT linear flow process charts 4 power point stage PowerPoint Templates-This Four State Diagram is a significant modeling technique for analyzing and constructing information processes.-PPT linear flow process charts 4 power point stage PowerPoint Templates-Advertise, Advertisement, Badge, Box, Business, Card, Collection, Column, Corporate, Costing, Counting, Design, Discount, Element, Featured, Finance, Grid, Hosting, Information, List, Message, Placard, Plan, Price, Pricing, Rectangle, Report, Round Our Ppt Linear Flow Process Charts 4 Power Point Stage PowerPoint Templates are faithful servants. They will put in all possible effort for you.
HR Services Icon With Analytics Technology And Charts Ppt PowerPoint Presentation Inspiration Format Ideas PDF
Pitch your topic with ease and precision using this hr services icon with analytics technology and charts ppt powerpoint presentation inspiration format ideas pdf. This layout presents information on hr services icon with analytics technology and charts. It is also available for immediate download and adjustment. So, changes can be made in the color, design, graphics or any other component to create a unique layout.
Pdca Slide For Best Charts For Technical Analysis Ppt PowerPoint Presentation Icon Backgrounds PDF
This is a pdca slide for best charts for technical analysis ppt powerpoint presentation icon backgrounds pdf template with various stages. Focus and dispense information on four stages using this creative set, that comes with editable features. It contains large content boxes to add your information on topics like pdca slide for best charts for technical analysis. You can also showcase facts, figures, and other relevant content using this PPT layout. Grab it now.
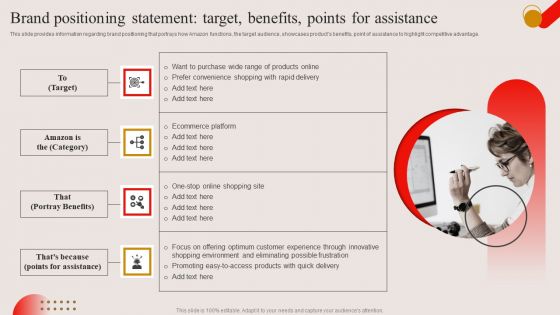
Brand Positioning Statement Target Benefits Points For Assistance Ppt PowerPoint Presentation Diagram Graph Charts PDF
This slide provides information regarding brand positioning that portrays how Amazon functions, the target audience, showcases products benefits, point of assistance to highlight competitive advantage. Get a simple yet stunning designed Brand Positioning Statement Target Benefits Points For Assistance Ppt PowerPoint Presentation Diagram Graph Charts PDF. It is the best one to establish the tone in your meetings. It is an excellent way to make your presentations highly effective. So, download this PPT today from Slidegeeks and see the positive impacts. Our easy to edit Brand Positioning Statement Target Benefits Points For Assistance Ppt PowerPoint Presentation Diagram Graph Charts PDF can be your go to option for all upcoming conferences and meetings. So, what are you waiting for Grab this template today.
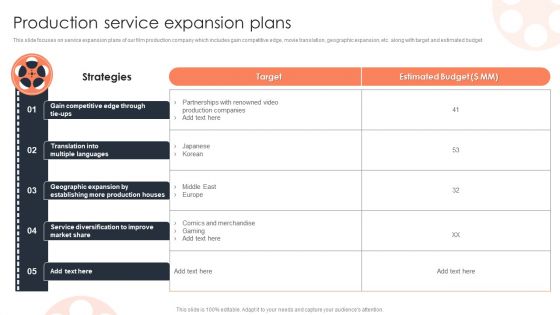
Production Service Expansion Plans Film Media Company Profile Ppt PowerPoint Presentation Diagram Graph Charts PDF
This slide focuses on service expansion plans of our film production company which includes gain competitive edge, movie translation, geographic expansion, etc. along with target and estimated budget.Deliver an awe inspiring pitch with this creative Production Service Expansion Plans Film Media Company Profile Ppt PowerPoint Presentation Diagram Graph Charts PDF bundle. Topics like Geographic Expansion, Establishing Production, Diversification Improve can be discussed with this completely editable template. It is available for immediate download depending on the needs and requirements of the user.


 Continue with Email

 Home
Home


