Comparison Chart
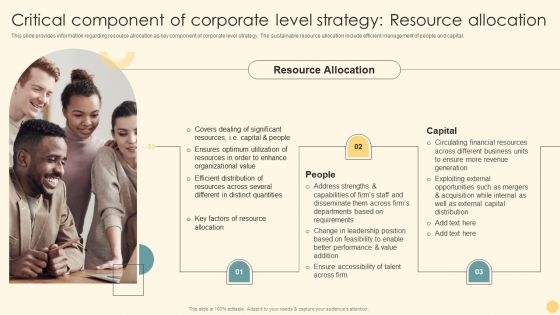
Critical Component Of Corporate Level Strategy Resource Allocation Ppt PowerPoint Presentation Diagram Graph Charts PDF
This slide provides information regarding resource allocation as key component of corporate level strategy. The sustainable resource allocation include efficient management of people and capital. From laying roadmaps to briefing everything in detail, our templates are perfect for you. You can set the stage with your presentation slides. All you have to do is download these easy to edit and customizable templates. Critical Component Of Corporate Level Strategy Resource Allocation Ppt PowerPoint Presentation Diagram Graph Charts PDF will help you deliver an outstanding performance that everyone would remember and praise you for. Do download this presentation today.
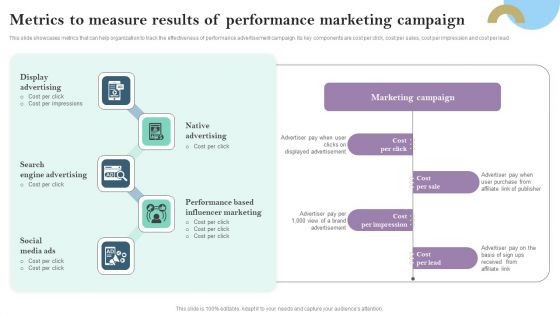
Metrics To Measure Results Of Performance Marketing Campaign Ppt PowerPoint Presentation Diagram Graph Charts PDF
This slide showcases metrics that can help organization to track the effectiveness of performance advertisement campaign. Its key components are cost per click, cost per sales, cost per impression and cost per lead Presenting this PowerPoint presentation, titled Metrics To Measure Results Of Performance Marketing Campaign Ppt PowerPoint Presentation Diagram Graph Charts PDF, with topics curated by our researchers after extensive research. This editable presentation is available for immediate download and provides attractive features when used. Download now and captivate your audience. Presenting this Metrics To Measure Results Of Performance Marketing Campaign Ppt PowerPoint Presentation Diagram Graph Charts PDF. Our researchers have carefully researched and created these slides with all aspects taken into consideration. This is a completely customizable Metrics To Measure Results Of Performance Marketing Campaign Ppt PowerPoint Presentation Diagram Graph Charts PDF that is available for immediate downloading. Download now and make an impact on your audience. Highlight the attractive features available with our PPTs.
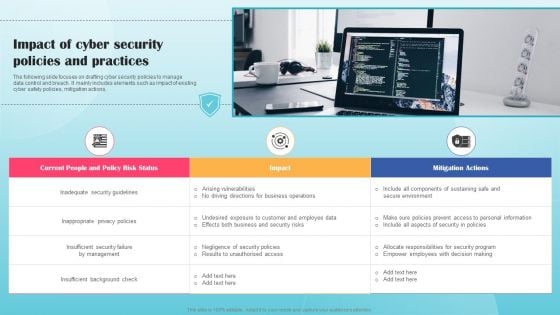
Impact Of Cyber Security Policies And Practices Ppt PowerPoint Presentation Diagram Graph Charts PDF
The following slide focuses on drafting cyber security policies to manage data control and breach. It mainly includes elements such as impact of existing cyber safety policies, mitigation actions, Presenting this PowerPoint presentation, titled Impact Of Cyber Security Policies And Practices Ppt PowerPoint Presentation Diagram Graph Charts PDF, with topics curated by our researchers after extensive research. This editable presentation is available for immediate download and provides attractive features when used. Download now and captivate your audience. Presenting this Impact Of Cyber Security Policies And Practices Ppt PowerPoint Presentation Diagram Graph Charts PDF. Our researchers have carefully researched and created these slides with all aspects taken into consideration. This is a completely customizable Impact Of Cyber Security Policies And Practices Ppt PowerPoint Presentation Diagram Graph Charts PDF that is available for immediate downloading. Download now and make an impact on your audience. Highlight the attractive features available with our PPTs.
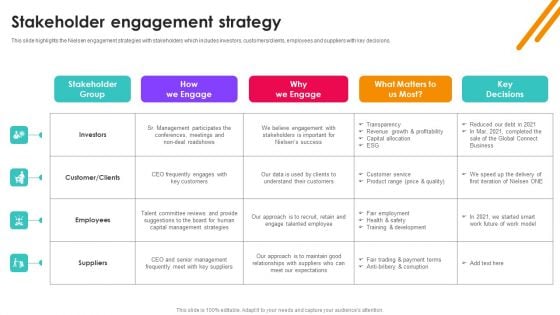
Nielsen Business Profile Stakeholder Engagement Strategy Ppt PowerPoint Presentation Diagram Graph Charts PDF
This slide highlights the Nielsen engagement strategies with stakeholders which includes investors, customers or clients, employees and suppliers with key decisions. The Nielsen Business Profile Stakeholder Engagement Strategy Ppt PowerPoint Presentation Diagram Graph Charts PDF is a compilation of the most recent design trends as a series of slides. It is suitable for any subject or industry presentation, containing attractive visuals and photo spots for businesses to clearly express their messages. This template contains a variety of slides for the user to input data, such as structures to contrast two elements, bullet points, and slides for written information. Slidegeeks is prepared to create an impression.
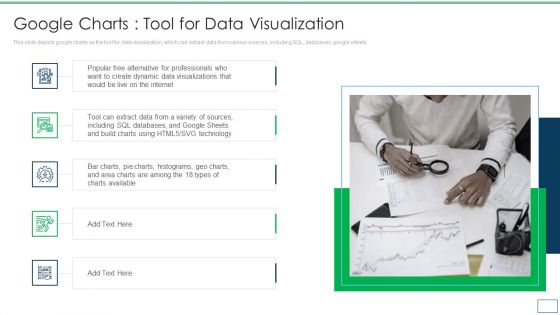
Departments Of Visualization Research Google Charts Tool For Data Visualization Themes PDF
This slide depicts google charts as the tool for data visualization, which can extract data from various sources, including SQL, databases, google sheets.This is a Departments Of Visualization Research Google Charts Tool For Data Visualization Themes PDF template with various stages. Focus and dispense information on five stages using this creative set, that comes with editable features. It contains large content boxes to add your information on topics like Popular Free Alternative, Create Dynamic Data, Including SQL Databases You can also showcase facts, figures, and other relevant content using this PPT layout. Grab it now.
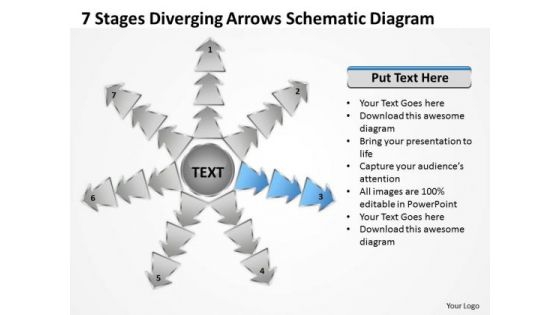
7 Stages Diverging Arrows Schematic Diagram Ppt Charts And Networks PowerPoint Slide
We present our 7 stages diverging arrows schematic diagram ppt Charts and Networks PowerPoint Slide.Use our Marketing PowerPoint Templates because you can Break it all down to Key Result Areas. Use our Shapes PowerPoint Templates because this diagram is designed to help your audience to develop their thoughts along the way. Use our Arrows PowerPoint Templates because this slide illuminates the spiritual brilliance of Jesus and showers the love for mankind he showed even while being crucified. Use our Business PowerPoint Templates because you can Lead your flock steadily to greater heights. Look around at the vast potential of achievement around you. Use our Process and Flows PowerPoint Templates because you can Highlight the key components of your entire manufacturing/ business process.Use these PowerPoint slides for presentations relating to Arrows, Business, Chart, Cyclic, Data, Diagram, Financial, Goal, Graph, Illustration, Info, Information, Marketing, Model, Option, Part, Pie, Presentation, Process, Result, Sphere, Statistics. The prominent colors used in the PowerPoint template are Blue, Gray, Black. The feedback we get is that our 7 stages diverging arrows schematic diagram ppt Charts and Networks PowerPoint Slide are Fashionable. People tell us our Data PowerPoint templates and PPT Slides are Perfect. Presenters tell us our 7 stages diverging arrows schematic diagram ppt Charts and Networks PowerPoint Slide will make the presenter successul in his career/life. Use our Goal PowerPoint templates and PPT Slides are Bold. Use our 7 stages diverging arrows schematic diagram ppt Charts and Networks PowerPoint Slide are Spiffy. Use our Financial PowerPoint templates and PPT Slides are Functional. Feather your nest with our 7 Stages Diverging Arrows Schematic Diagram Ppt Charts And Networks PowerPoint Slide. Your thoughts will evolve in a comfortable climate.
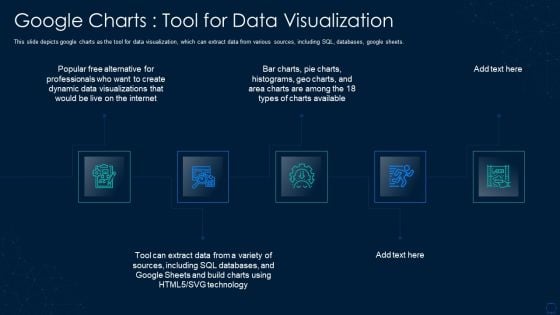
Graphical Representation Of Research IT Google Charts Tool For Data Visualization Introduction PDF
This slide depicts google charts as the tool for data visualization, which can extract data from various sources, including SQL, databases, google sheets. This is a graphical representation of research it google charts tool for data visualization introduction pdf template with various stages. Focus and dispense information on five stages using this creative set, that comes with editable features. It contains large content boxes to add your information on topics like dynamic, databases, sources, technology. You can also showcase facts, figures, and other relevant content using this PPT layout. Grab it now.
Social Media Influencer Marketing Strategy Creation Icon Ppt PowerPoint Presentation Diagram Graph Charts PDF
Pitch your topic with ease and precision using this Social Media Influencer Marketing Strategy Creation Icon Ppt PowerPoint Presentation Diagram Graph Charts PDF. This layout presents information on Social Media, Influencer Marketing, Strategy Creation Icon. It is also available for immediate download and adjustment. So, changes can be made in the color, design, graphics or any other component to create a unique layout.
E Learning Playbook Roadmap Ppt PowerPoint Presentation Diagram Graph Charts PDF
This is a E Learning Playbook Roadmap Ppt PowerPoint Presentation Diagram Graph Charts PDF template with various stages. Focus and dispense information on four stages using this creative set, that comes with editable features. It contains large content boxes to add your information on topics like Puzzle. You can also showcase facts, figures, and other relevant content using this PPT layout. Grab it now.

Two Doctors Conducting Healthcare Surgery In Hospital Ppt PowerPoint Presentation Diagram Graph Charts PDF
Pitch your topic with ease and precision using this Two Doctors Conducting Healthcare Surgery In Hospital Ppt PowerPoint Presentation Diagram Graph Charts PDF. This layout presents information on Two Doctors, Conducting Healthcare, Surgery In Hospital. It is also available for immediate download and adjustment. So, changes can be made in the color, design, graphics or any other component to create a unique layout.

White House Winter Image With Snow Ppt PowerPoint Presentation Diagram Graph Charts PDF
Pitch your topic with ease and precision using this white house winter image with snow ppt powerpoint presentation diagram graph charts pdf. This layout presents information on white house winter image with snow. It is also available for immediate download and adjustment. So, changes can be made in the color, design, graphics or any other component to create a unique layout.
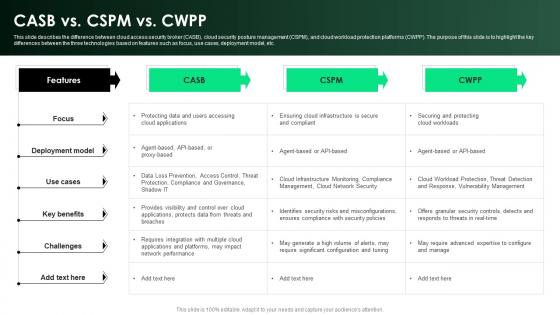
CASB 2 0 IT CASB Vs CSPM Vs CWPP Ppt Diagram Graph Charts
This slide describes the difference between cloud access security broker CASB , cloud security posture management CSPM , and cloud workload protection platforms CWPP . The purpose of this slide is to highlight the key differences between the three technologies based on features such as focus, use cases, deployment model, etc. Are you in need of a template that can accommodate all of your creative concepts This one is crafted professionally and can be altered to fit any style. Use it with Google Slides or PowerPoint. Include striking photographs, symbols, depictions, and other visuals. Fill, move around, or remove text boxes as desired. Test out color palettes and font mixtures. Edit and save your work, or work with colleagues. Download CASB 2 0 IT CASB Vs CSPM Vs CWPP Ppt Diagram Graph Charts and observe how to make your presentation outstanding. Give an impeccable presentation to your group and make your presentation unforgettable. This slide describes the difference between cloud access security broker CASB , cloud security posture management CSPM , and cloud workload protection platforms CWPP . The purpose of this slide is to highlight the key differences between the three technologies based on features such as focus, use cases, deployment model, etc.
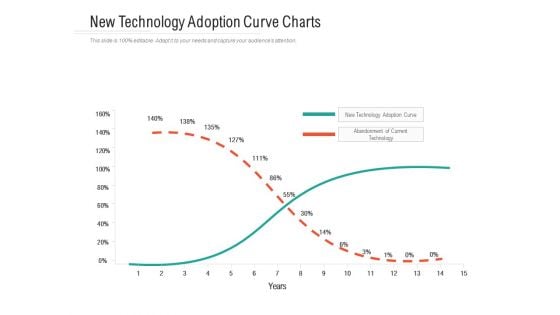
New Technology Adoption Curve Charts Ppt PowerPoint Presentation Inspiration Structure PDF
Pitch your topic with ease and precision using this new technology adoption curve charts ppt powerpoint presentation inspiration structure pdf. This layout presents information on new technology, adoption curve, abandonment of current technology. It is also available for immediate download and adjustment. So, changes can be made in the color, design, graphics or any other component to create a unique layout.
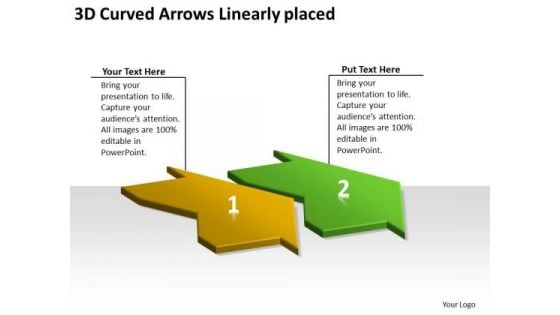
3d Curved Arrows Linearly Placed What Is Flow Charts PowerPoint Templates
We present our 3d curved arrows linearly placed what is flow charts PowerPoint templates.Use our Arrows PowerPoint Templates because, Profit is fairly earned in what you believe. Use our Shapes PowerPoint Templates because,There are a bunch of ideas brewing in your head which give you the heady taste of success. Use our Signs PowerPoint Templates because,With the help of our Slides you can Illustrate your plans on using the many social media modes available to inform soceity at large of the benefits of your product. Use our Business PowerPoint Templates because, You can Lead your flock steadily to greater heights. Look around at the vast potential of achievement around you Use our Process and Flows PowerPoint Templates because,Your listeners do not have to put on their thinking caps.Use these PowerPoint slides for presentations relating to arrow, automobile, city, curve, destination, direction, freeway, grunge, heading, highway, journey, land, landscape, line, linear, marks, motion, multiple, network, paint, path, perspective, pointing, road, sign, speed, street, strip, symbol, track, traffic, transport, transportation, travel, way. The prominent colors used in the PowerPoint template are Yellow, Green, White. People tell us our 3d curved arrows linearly placed what is flow charts PowerPoint templates are Gorgeous. The feedback we get is that our direction PowerPoint templates and PPT Slides are Great. People tell us our 3d curved arrows linearly placed what is flow charts PowerPoint templates are Radiant. Presenters tell us our freeway PowerPoint templates and PPT Slides are Pretty. The feedback we get is that our 3d curved arrows linearly placed what is flow charts PowerPoint templates will save the presenter time. Professionals tell us our city PowerPoint templates and PPT Slides are Great. Bounce your ideas off our 3d Curved Arrows Linearly Placed What Is Flow Charts PowerPoint Templates. They will echo your thoughts all the way.

Potential Segment Analysis For Amazon Customer Base Ppt PowerPoint Presentation Diagram Graph Charts PDF
This slide provides information regarding potential segments assessed across the customer base in terms of market size, recurring purchases, percent of online buyers, conversion rate, and purchasing power. Present like a pro with Potential Segment Analysis For Amazon Customer Base Ppt PowerPoint Presentation Diagram Graph Charts PDF Create beautiful presentations together with your team, using our easy to use presentation slides. Share your ideas in real time and make changes on the fly by downloading our templates. So whether you are in the office, on the go, or in a remote location, you can stay in sync with your team and present your ideas with confidence. With Slidegeeks presentation got a whole lot easier. Grab these presentations today.
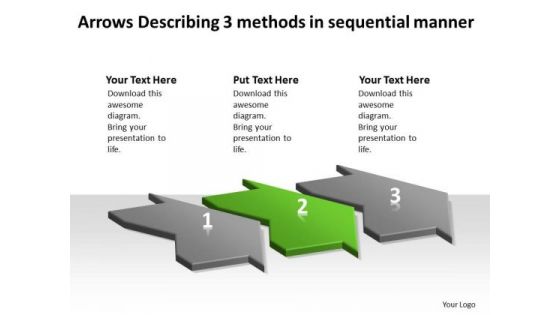
Arrows Describing 3 Methods Sequential Manner Flow Charts Vision PowerPoint Templates
We present our arrows describing 3 methods sequential manner flow charts vision PowerPoint templates.Present our Marketing PowerPoint Templates because they are Designed to attract the attention of your audience. Present our Business PowerPoint Templates because you have selected your team man for man. Download our Process and Flows PowerPoint Templates because you can Highlight the key components of your entire manufacturing/ business process. Use our Shapes PowerPoint Templates because clarity of thought has been the key to your growth. Download and present our Arrows PowerPoint Templates because you have an idea of which you are sure.Use these PowerPoint slides for presentations relating to 3d, Abstract, Around, Arrows, Blue, Border, Business, Center, Circle, Circular, Concept, Connections, Copy, Curve, Cycle, Directions, Distribution, Illustration, Management, Middle, Objects, Pieces, Plan, Pointing, Process, Recycle, Rounded, Shadows, Space, System. The prominent colors used in the PowerPoint template are Green, Gray, Black. People tell us our arrows describing 3 methods sequential manner flow charts vision PowerPoint templates are Wistful. PowerPoint presentation experts tell us our Center PowerPoint templates and PPT Slides are Beautiful. Presenters tell us our arrows describing 3 methods sequential manner flow charts vision PowerPoint templates are Vintage. The feedback we get is that our Arrows PowerPoint templates and PPT Slides are Ultra. You can be sure our arrows describing 3 methods sequential manner flow charts vision PowerPoint templates are One-of-a-kind. Professionals tell us our Circle PowerPoint templates and PPT Slides are Tasteful. Mix your wisdom with our designs with our Arrows Describing 3 Methods Sequential Manner Flow Charts Vision PowerPoint Templates. You will be at the top of your game.

Attached Puzzles In Horizontal Line 10 Stages Vision Flow Charts PowerPoint Slides
We present our attached puzzles in horizontal line 10 stages vision flow charts PowerPoint Slides.Use our Business PowerPoint Templates because, You have had a great year or so business wise. It is time to celebrate the efforts of your team Use our Puzzles or Jigsaws PowerPoint Templates because,They are the stepping stones of our journey till date. Use our Shapes PowerPoint Templates because, You can Transmit your passion via our creative templates. Use our Boxes PowerPoint Templates because,It shows to your group how they mesh together to drive the whole. Use our Success PowerPoint Templates because,You can Explore the various hues and layers existing in your in your plans and processes using this slide.Use these PowerPoint slides for presentations relating to answer, assemble, attached, bright, build, business, challenge, colour, concept, connect, connection, decisions, difficulty, game, group, holding, idea, isolated, jigsaw, join, making, metaphor, opposite, part, piece, playing, problem, puzzle, shape, solution, success, support, team, teamwork, together, two, unity. The prominent colors used in the PowerPoint template are Blue, Blue navy, White. People tell us our attached puzzles in horizontal line 10 stages vision flow charts PowerPoint Slides are Flirty. The feedback we get is that our concept PowerPoint templates and PPT Slides are Fun. People tell us our attached puzzles in horizontal line 10 stages vision flow charts PowerPoint Slides are Attractive. Presenters tell us our build PowerPoint templates and PPT Slides are Breathtaking. The feedback we get is that our attached puzzles in horizontal line 10 stages vision flow charts PowerPoint Slides are Quaint. Professionals tell us our challenge PowerPoint templates and PPT Slides will impress their bosses and teams. Your ideas will feature amongst the best. Ensure their ascendancy with our Attached Puzzles In Horizontal Line 10 Stages Vision Flow Charts PowerPoint Slides.
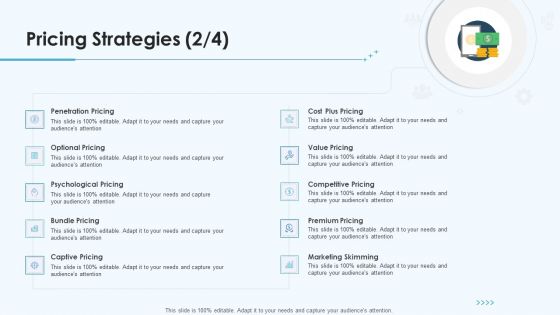
Product Pricing Strategies Pricing Strategies Skimming Ppt Diagram Graph Charts PDF
This is a product pricing strategies pricing strategies skimming ppt diagram graph charts pdf template with various stages. Focus and dispense information on ten stages using this creative set, that comes with editable features. It contains large content boxes to add your information on topics like psychological pricing, captive pricing, marketing skimming, premium pricing, value pricing. You can also showcase facts, figures, and other relevant content using this PPT layout. Grab it now.
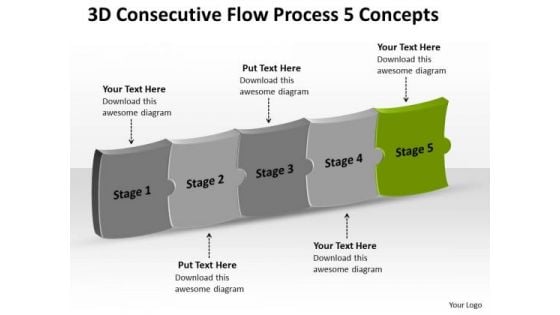
3d Consecutive Flow Process 5 Concepts What Is Charts PowerPoint Slides
We present our 3d consecutive flow process 5 concepts what is charts PowerPoint Slides. Use our Business PowerPoint Templates because, Marketing Strategy Business Template:- Maximizing sales of your product is the intended destination. Use our Leadership PowerPoint Templates because, Knowledge is power goes the popular saying. Use our Shapes PowerPoint Templates because, you have it all down to a nicety, slice by slice, layer by layer. Use our Metaphor PowerPoint Templates because, Gears interconnected: - The Gear Train is a basic element of living and daily business. Use our Process and Flows PowerPoint Templates because, But you have the ideas, you have got a brainwave. Use these PowerPoint slides for presentations relating to abstract, arrow, blank, business, chart, circular, circulation, concept, conceptual, consecutive, design, diagram, executive, flow, icon, idea, illustration, management, model, numbers, organization, procedure, process. The prominent colors used in the PowerPoint template are Green, Gray, and Black Our 3d Consecutive Flow Process 5 Concepts What Is Charts PowerPoint Slides are committed to benefit you. They ensure your thoughts get the credit.
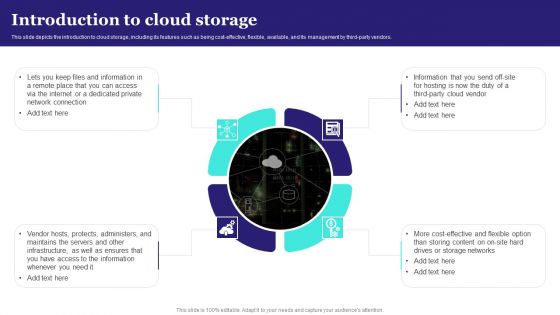
Introduction To Cloud Storage Ppt PowerPoint Presentation Diagram Graph Charts PDF
This slide depicts the introduction to cloud storage, including its features such as being cost-effective, flexible, available, and its management by third party vendors. This modern and well arranged Introduction To Cloud Storage Ppt PowerPoint Presentation Diagram Graph Charts PDF provides lots of creative possibilities. It is very simple to customize and edit with the Powerpoint Software. Just drag and drop your pictures into the shapes. All facets of this template can be edited with Powerpoint no extra software is necessary. Add your own material, put your images in the places assigned for them, adjust the colors, and then you can show your slides to the world, with an animated slide included.
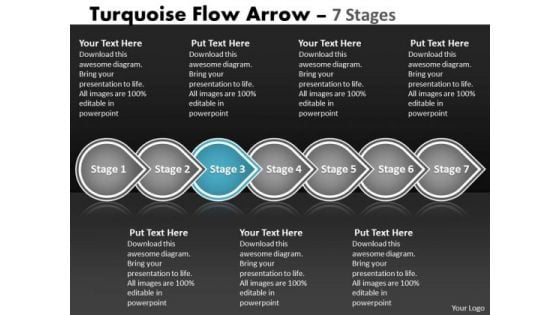
Ppt Theme Continual Seven Phase Diagram Linear Flow Method Charts 4 Design
We present our PPT Theme continual seven phase diagram linear Flow method charts 4 designs. Use our Advertising PowerPoint Templates because; emphasize the benefits of healthy food habits and lifestyles in respect of vital organs of the human anatomy. Use our Shapes PowerPoint Templates because, now fire the arrows to emblazon the desired path by which you will achieve anticipated results. Use our Signs PowerPoint Templates because, Build on your foundation or prepare for change ahead to enhance the future. Use our Marketing PowerPoint Templates because; Get your listeners to put on their thinking caps. Use our Business PowerPoint Templates because; Highlight these individual targets and the paths to their achievement. Use these PowerPoint slides for presentations relating to advertising, arrow, background, banner, bookmark, choice, concept, creative, design, direction, flow, label, layout, manual, marketing, modern, process, product, promotion, sequence, simple, special, step, symbol, tab, tag, turquoise, tutorial, two, vector, . The prominent colors used in the PowerPoint template are Blue, Gray, and White Aim for the skies with our Ppt Theme Continual Seven Phase Diagram Linear Flow Method Charts 4 Design. You will come out on top.
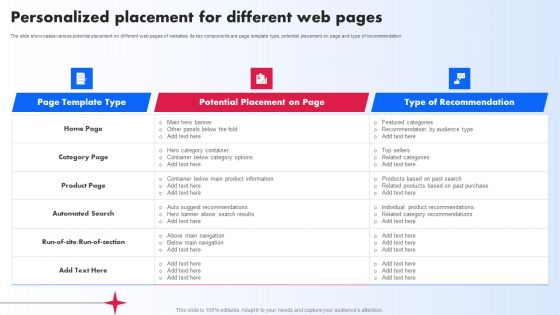
Personalized Placement For Different Web Pages Ppt PowerPoint Presentation Diagram Graph Charts PDF
The slide showcases various potential placement on different web pages of websites. Its key components are page template type, potential placement on page and type of recommendation. Do you know about Slidesgeeks Personalized Placement For Different Web Pages Ppt PowerPoint Presentation Diagram Graph Charts PDF. These are perfect for delivering any kind od presentation. Using it, create PowerPoint presentations that communicate your ideas and engage audiences. Save time and effort by using our pre designed presentation templates that are perfect for a wide range of topic. Our vast selection of designs covers a range of styles, from creative to business, and are all highly customizable and easy to edit. Download as a PowerPoint template or use them as Google Slides themes.
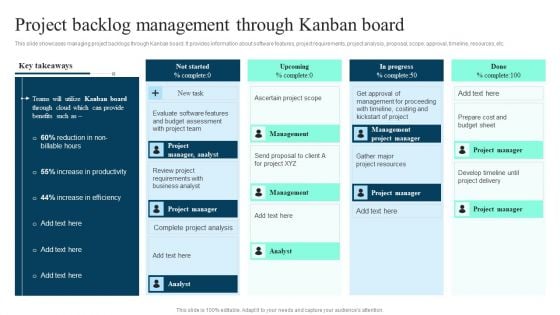
Project Backlog Management Through Kanban Board Ppt PowerPoint Presentation Diagram Graph Charts PDF
This slide showcases managing project backlogs through Kanban board. It provides information about software features, project requirements, project analysis, proposal, scope, approval, timeline, resources, etc. Slidegeeks is here to make your presentations a breeze with Project Backlog Management Through Kanban Board Ppt PowerPoint Presentation Diagram Graph Charts PDF With our easy to use and customizable templates, you can focus on delivering your ideas rather than worrying about formatting. With a variety of designs to choose from, you are sure to find one that suits your needs. And with animations and unique photos, illustrations, and fonts, you can make your presentation pop. So whether you are giving a sales pitch or presenting to the board, make sure to check out Slidegeeks first.
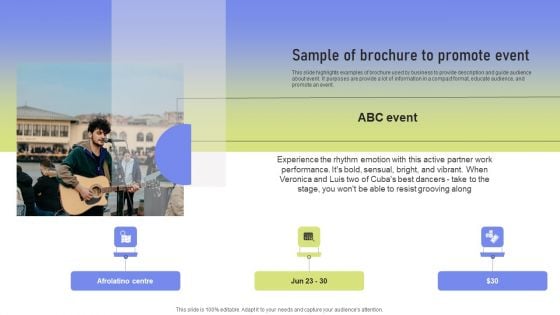
Sample Of Brochure To Promote Event Ppt PowerPoint Presentation Diagram Graph Charts PDF
This slide highlights examples of brochure used by business to provide description and guide audience about event. It purposes are provide a lot of information in a compact format, educate audience, and promote an event. This Sample Of Brochure To Promote Event Ppt PowerPoint Presentation Diagram Graph Charts PDF from Slidegeeks makes it easy to present information on your topic with precision. It provides customization options, so you can make changes to the colors, design, graphics, or any other component to create a unique layout. It is also available for immediate download, so you can begin using it right away. Slidegeeks has done good research to ensure that you have everything you need to make your presentation stand out. Make a name out there for a brilliant performance.
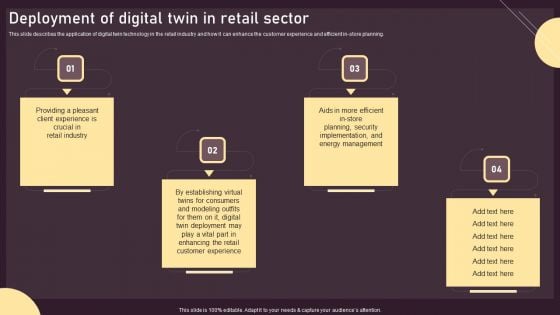
Deployment Of Digital Twin In Retail Sector Ppt PowerPoint Presentation Diagram Graph Charts PDF
This slide describes the application of digital twin technology in the retail industry and how it can enhance the customer experience and efficient in store planning. This Deployment Of Digital Twin In Retail Sector Ppt PowerPoint Presentation Diagram Graph Charts PDF from Slidegeeks makes it easy to present information on your topic with precision. It provides customization options, so you can make changes to the colors, design, graphics, or any other component to create a unique layout. It is also available for immediate download, so you can begin using it right away. Slidegeeks has done good research to ensure that you have everything you need to make your presentation stand out. Make a name out there for a brilliant performance.
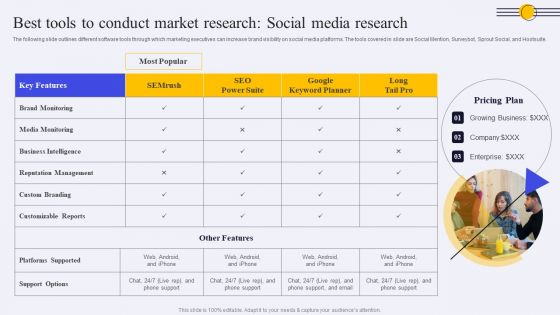
Best Tools To Conduct Market Research Social Media Research Ppt PowerPoint Presentation Diagram Graph Charts PDF
The following slide outlines different software tools through which marketing executives can increase brand visibility on social media platforms. The tools covered in slide are Social Mention, Surveybot, Sprout Social, and Hootsuite. This Best Tools To Conduct Market Research Social Media Research Ppt PowerPoint Presentation Diagram Graph Charts PDF from Slidegeeks makes it easy to present information on your topic with precision. It provides customization options, so you can make changes to the colors, design, graphics, or any other component to create a unique layout. It is also available for immediate download, so you can begin using it right away. Slidegeeks has done good research to ensure that you have everything you need to make your presentation stand out. Make a name out there for a brilliant performance.
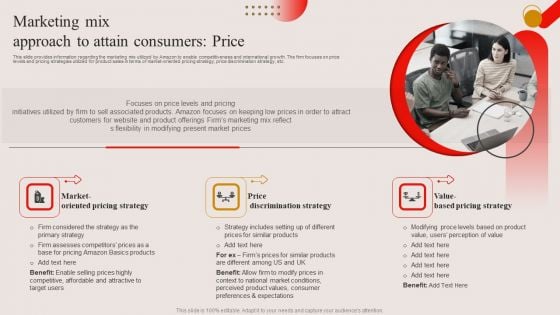
Marketing Mix Approach To Attain Consumers Price Ppt PowerPoint Presentation Diagram Graph Charts PDF
This slide provides information regarding the marketing mix utilized by Amazon to enable competitiveness and international growth. The firm focuses on price levels and pricing strategies utilized for product sales in terms of market-oriented pricing strategy, price discrimination strategy, etc. This Marketing Mix Approach To Attain Consumers Price Ppt PowerPoint Presentation Diagram Graph Charts PDF from Slidegeeks makes it easy to present information on your topic with precision. It provides customization options, so you can make changes to the colors, design, graphics, or any other component to create a unique layout. It is also available for immediate download, so you can begin using it right away. Slidegeeks has done good research to ensure that you have everything you need to make your presentation stand out. Make a name out there for a brilliant performance.
Bar Graph And Pie Charts For Business Reports Vector Icon Ppt PowerPoint Presentation Show Graphics Tutorials PDF
Pitch your topic with ease and precision using this bar graph and pie charts for business reports vector icon ppt powerpoint presentation show graphics tutorials pdf. This layout presents information on bar graph and pie charts for business reports vector icon. It is also available for immediate download and adjustment. So, changes can be made in the color, design, graphics or any other component to create a unique layout.
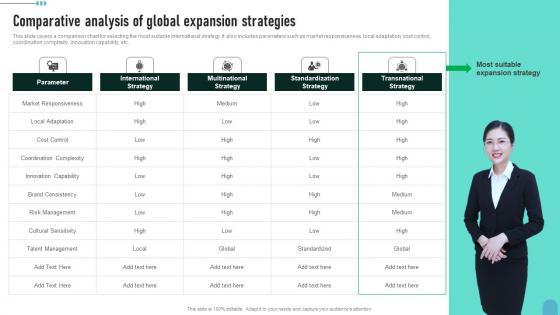
Comparative Analysis Of Global Expansion Enhancing Global Presence Professional Pdf
This slide covers a comparison chart for selecting the most suitable international strategy. It also includes parameters such as market responsiveness, local adaptation, cost control, coordination complexity, innovation capability, etc.Present like a pro with Comparative Analysis Of Global Expansion Enhancing Global Presence Professional Pdf Create beautiful presentations together with your team, using our easy-to-use presentation slides. Share your ideas in real-time and make changes on the fly by downloading our templates. So whether you are in the office, on the go, or in a remote location, you can stay in sync with your team and present your ideas with confidence. With Slidegeeks presentation got a whole lot easier. Grab these presentations today. This slide covers a comparison chart for selecting the most suitable international strategy. It also includes parameters such as market responsiveness, local adaptation, cost control, coordination complexity, innovation capability, etc.
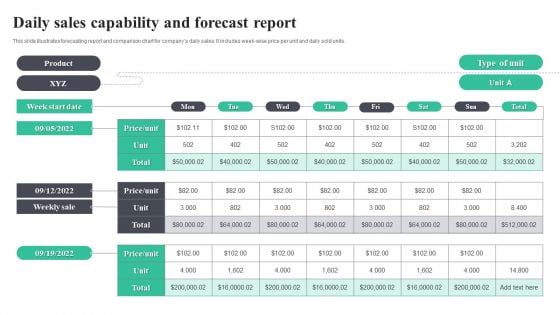
Daily Sales Capability And Forecast Report Introduction PDF
This slide illustrates forecasting report and comparison chart for companys daily sales. It includes week wise price per unit and daily sold units. Pitch your topic with ease and precision using this Daily Sales Capability And Forecast Report Introduction PDF. This layout presents information on Daily Sales Capability, Forecast Report. It is also available for immediate download and adjustment. So, changes can be made in the color, design, graphics or any other component to create a unique layout.
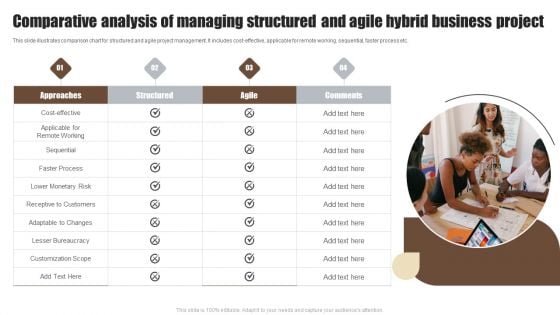
Comparative Analysis Of Managing Structured And Agile Hybrid Business Project Structure PDF
This slide illustrates comparison chart for structured and agile project management. It includes cost-effective, applicable for remote working, sequential, faster process etc. Presenting Comparative Analysis Of Managing Structured And Agile Hybrid Business Project Structure PDF to dispense important information. This template comprises one stages. It also presents valuable insights into the topics including Approaches, Structured, Comments. This is a completely customizable PowerPoint theme that can be put to use immediately. So, download it and address the topic impactfully.
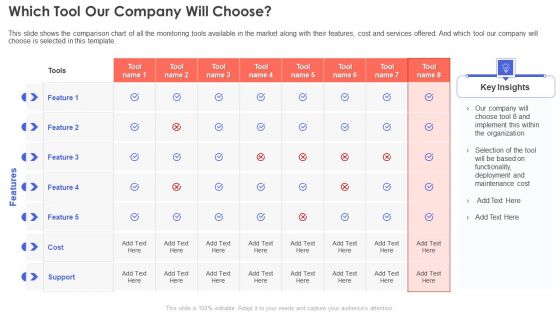
IT Infrastructure Management Which Tool Our Company Will Choose Formats PDF
This slide shows the comparison chart of all the monitoring tools available in the market along with their features, cost and services offered. And which tool our company will choose is selected in this template.Deliver an awe inspiring pitch with this creative IT Infrastructure Management Which Tool Our Company Will Choose Formats PDF bundle. Topics like Functionality, Maintenance Cost, Organization can be discussed with this completely editable template. It is available for immediate download depending on the needs and requirements of the user.
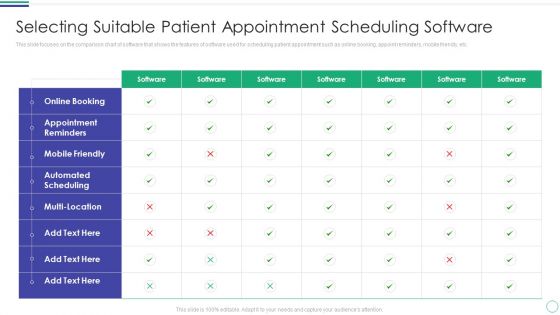
Selecting Suitable Patient Appointment Scheduling Software Introduction PDF
This slide focuses on the comparison chart of software that shows the features of software used for scheduling patient appointment such as online booking, appoint reminders, mobile friendly, etc.Deliver and pitch your topic in the best possible manner with this Selecting Suitable Patient Appointment Scheduling Software Introduction PDF Use them to share invaluable insights on Appointment Reminders, Automated Scheduling, Mobile Friendly and impress your audience. This template can be altered and modified as per your expectations. So, grab it now.
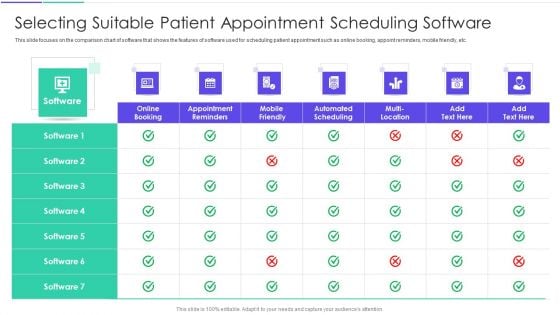
Medical Inventory Management System Selecting Suitable Patient Appointment Scheduling Software Brochure PDF
This slide focuses on the comparison chart of software that shows the features of software used for scheduling patient appointment such as online booking, appoint reminders, mobile friendly, etc.Deliver an awe inspiring pitch with this creative medical inventory management system selecting suitable patient appointment scheduling software brochure pdf bundle. Topics like selecting suitable patient appointment scheduling software can be discussed with this completely editable template. It is available for immediate download depending on the needs and requirements of the user.
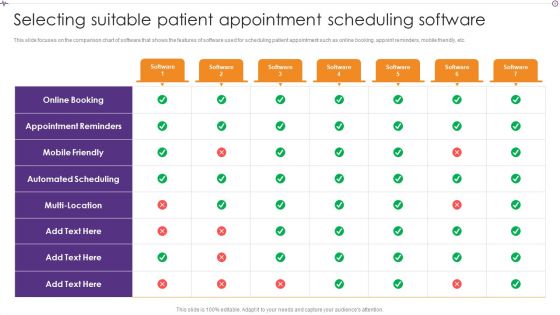
Advances In Healthcare Management System Selecting Suitable Patient Appointment Scheduling Software Portrait PDF
This slide focuses on the comparison chart of software that shows the features of software used for scheduling patient appointment such as online booking, appoint reminders, mobile friendly, etc. Deliver an awe inspiring pitch with this creative Advances In Healthcare Management System Selecting Suitable Patient Appointment Scheduling Software Portrait PDF bundle. Topics like Appointment Reminders, Automated Scheduling, Multi Location can be discussed with this completely editable template. It is available for immediate download depending on the needs and requirements of the user.
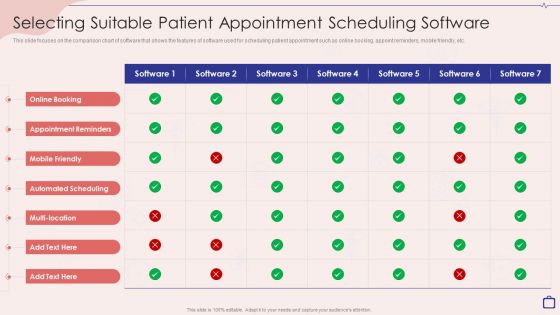
Implementing Integrated Software Selecting Suitable Patient Appointment Scheduling Software Formats PDF
This slide focuses on the comparison chart of software that shows the features of software used for scheduling patient appointment such as online booking, appoint reminders, mobile friendly, etc.Deliver and pitch your topic in the best possible manner with this Implementing Integrated Software Selecting Suitable Patient Appointment Scheduling Software Formats PDF. Use them to share invaluable insights on Appointment Reminders, Automated Scheduling, Online Booking and impress your audience. This template can be altered and modified as per your expectations. So, grab it now.
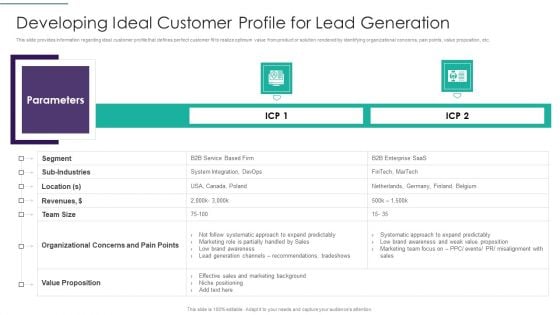
Sales Techniques Playbook Developing Ideal Customer Profile For Lead Generation Topics PDF
This slide provides information regarding ideal customer profile that defines perfect customer fit to realize optimum value from product or solution rendered by identifying organizational concerns, pain points, value proposition, etc. Deliver an awe inspiring pitch with this creative sales techniques playbook developing ideal customer profile for lead generation topics pdf bundle. Topics like different products price comparison chart can be discussed with this completely editable template. It is available for immediate download depending on the needs and requirements of the user.
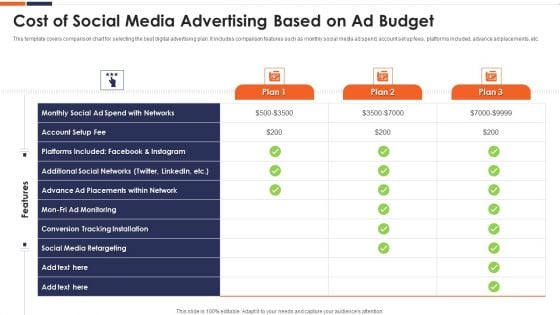
Cost Of Social Media Advertising Based On Ad Budget Ppt Show Topics PDF
This template covers comparison chart for selecting the best digital advertising plan. It includes comparison features such as monthly social media ad spend, account set up fees, platforms included, advance ad placements, etc. Showcasing this set of slides titled cost of social media advertising based on ad budget ppt show topics pdf. The topics addressed in these templates are account setup fee, mon fri ad monitoring, plan, social media retargeting. All the content presented in this PPT design is completely editable. Download it and make adjustments in color, background, font etc. as per your unique business setting.

Twitter Google Plus Facebook Social Media Powerpoint Slides
This professional slide contains graphics of Twitter, Google plus and Face book social media logos. You may use this chart for comparison of social media sites. Add this slide to your presentation and impress your superiors.
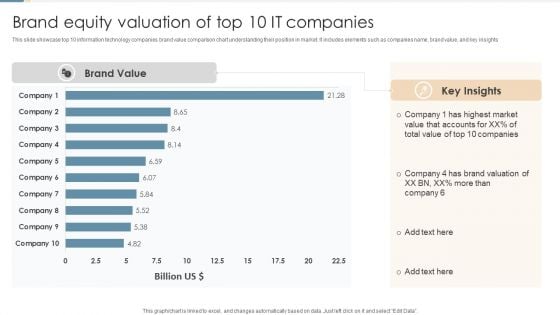
Brand Equity Valuation Of Top 10 IT Companies Ppt Portfolio Rules PDF
This slide showcase top 10 information technology companies brand value comparison chart understanding their position in market. It includes elements such as companies name, brand value, and key insights. Pitch your topic with ease and precision using this Brand Equity Valuation Of Top 10 IT Companies Ppt Portfolio Rules PDF. This layout presents information on Highest Market Value, Total Value, Brand Valuation. It is also available for immediate download and adjustment. So, changes can be made in the color, design, graphics or any other component to create a unique layout.
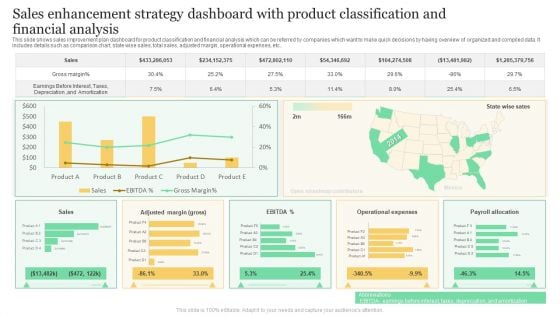
Sales Enhancement Strategy Dashboard With Product Classification And Financial Analysis Formats PDF
This slide shows sales improvement plan dashboard for product classification and financial analysis which can be referred by companies which want to make quick decisions by having overview of organized and compiled data. It includes details such as comparison chart, state wise sales, total sales, adjusted margin, operational expenses, etc. Showcasing this set of slides titled Sales Enhancement Strategy Dashboard With Product Classification And Financial Analysis Formats PDF. The topics addressed in these templates are Gross Margin, Sales, Operational Expenses. All the content presented in this PPT design is completely editable. Download it and make adjustments in color, background, font etc. as per your unique business setting.
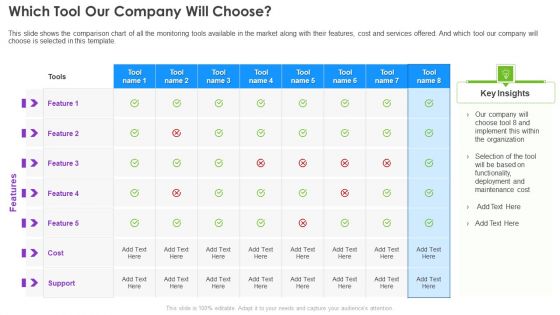
Infrastructure Supervision Which Tool Our Company Will Choose Download PDF
This slide shows the comparison chart of all the monitoring tools available in the market along with their features, cost and services offered. And which tool our company will choose is selected in this template. Deliver an awe inspiring pitch with this creative Infrastructure Supervision Which Tool Our Company Will Choose Download PDF bundle. Topics like Organization, Functionality, Deployment, Maintenance Cost can be discussed with this completely editable template. It is available for immediate download depending on the needs and requirements of the user.
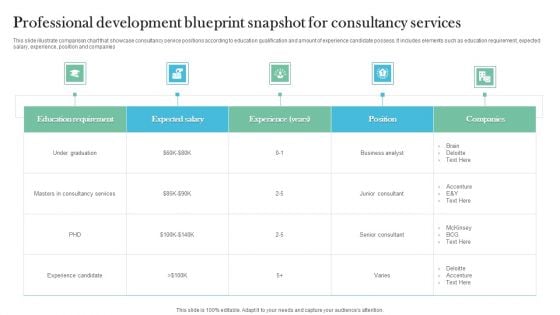
Professional Development Blueprint Snapshot For Consultancy Services Microsoft PDF
This slide illustrate comparison chart that showcase consultancy service positions according to education qualification and amount of experience candidate possess. It includes elements such as education requirement, expected salary, experience, position and companies. Pitch your topic with ease and precision using this Professional Development Blueprint Snapshot For Consultancy Services Microsoft PDF. This layout presents information on Consultancy Services, Education Requirement, Business Analyst. It is also available for immediate download and adjustment. So, changes can be made in the color, design, graphics or any other component to create a unique layout.
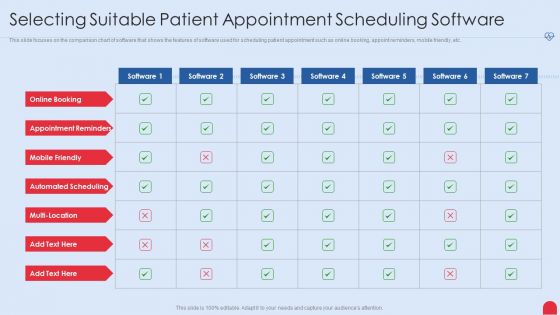
Enhancing Hospital Software System Selecting Suitable Patient Appointment Scheduling Software Inspiration PDF
This slide focuses on the comparison chart of software that shows the features of software used for scheduling patient appointment such as online booking, appoint reminders, mobile friendly, etc. Deliver and pitch your topic in the best possible manner with this enhancing hospital software system selecting suitable patient appointment scheduling software inspiration pdf. Use them to share invaluable insights on selecting suitable patient appointment scheduling software and impress your audience. This template can be altered and modified as per your expectations. So, grab it now.
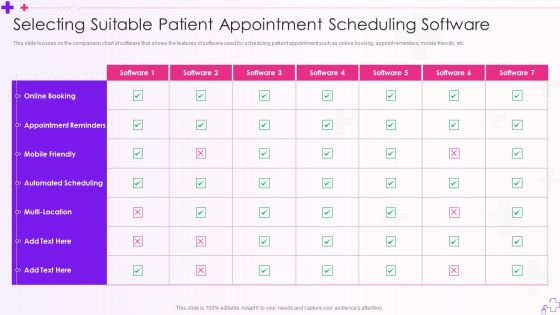
Integration Of Healthcare Center Administration System Selecting Suitable Patient Appointment Scheduling Software Rules PDF
This slide focuses on the comparison chart of software that shows the features of software used for scheduling patient appointment such as online booking, appoint reminders, mobile friendly, etc.Deliver and pitch your topic in the best possible manner with this Integration Of Healthcare Center Administration System Selecting Suitable Patient Appointment Scheduling Software Rules PDF Use them to share invaluable insights on Appointment Reminders, Automated Scheduling, Multi Location and impress your audience. This template can be altered and modified as per your expectations. So, grab it now.
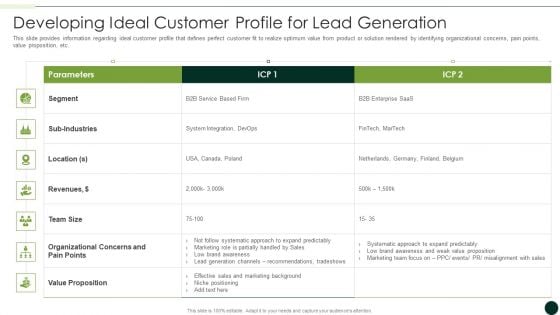
Salesman Principles Playbook Developing Ideal Customer Profile For Lead Generation Topics PDF
This slide provides information regarding ideal customer profile that defines perfect customer fit to realize optimum value from product or solution rendered by identifying organizational concerns, pain points, value proposition, etc. Deliver and pitch your topic in the best possible manner with this salesman principles playbook developing ideal customer profile for lead generation topics pdf Use them to share invaluable insights on different products price comparison chart and impress your audience. This template can be altered and modified as per your expectations. So, grab it now.
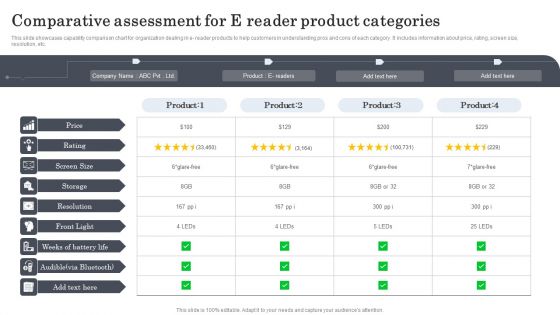
Comparative Assessment For E Reader Product Categories Information PDF
This slide showcases capability comparison chart for organization dealing in e- reader products to help customers in understanding pros and cons of each category. It includes information about price, rating, screen size, resolution, etc. Pitch your topic with ease and precision using this Comparative Assessment For E Reader Product Categories Information PDF. This layout presents information on Price, Rating, Screen Size, Storage, Resolution. It is also available for immediate download and adjustment. So, changes can be made in the color, design, graphics or any other component to create a unique layout.
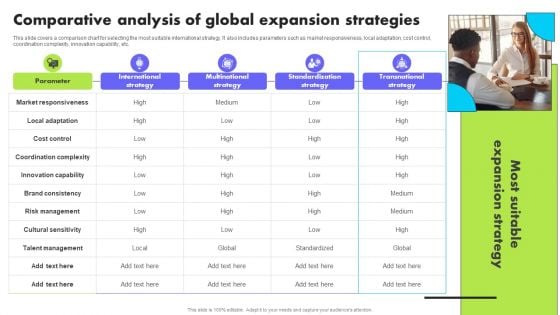
Planning Transnational Technique To Improve International Scope Comparative Analysis Global Expansion Strategies Mockup PDF
This slide covers a comparison chart for selecting the most suitable international strategy. It also includes parameters such as market responsiveness, local adaptation, cost control, coordination complexity, innovation capability, etc. Present like a pro with Planning Transnational Technique To Improve International Scope Comparative Analysis Global Expansion Strategies Mockup PDF Create beautiful presentations together with your team, using our easy to use presentation slides. Share your ideas in real time and make changes on the fly by downloading our templates. So whether you are in the office, on the go, or in a remote location, you can stay in sync with your team and present your ideas with confidence. With Slidegeeks presentation got a whole lot easier. Grab these presentations today.
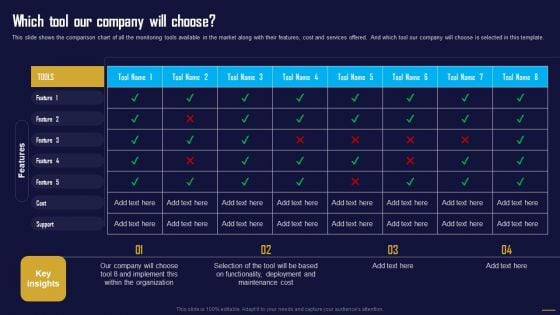
Which Tool Our Company Will Choose Information Tech System Maintenance Rules PDF
This slide shows the comparison chart of all the monitoring tools available in the market along with their features, cost and services offered. And which tool our company will choose is selected in this template.Here you can discover an assortment of the finest PowerPoint and Google Slides templates. With these templates, you can create presentations for a variety of purposes while simultaneously providing your audience with an eye-catching visual experience. Download Which Tool Our Company Will Choose Information Tech System Maintenance Rules PDF to deliver an impeccable presentation. These templates will make your job of preparing presentations much quicker, yet still, maintain a high level of quality. Slidegeeks has experienced researchers who prepare these templates and write high-quality content for you. Later on, you can personalize the content by editing the Which Tool Our Company Will Choose Information Tech System Maintenance Rules PDF.
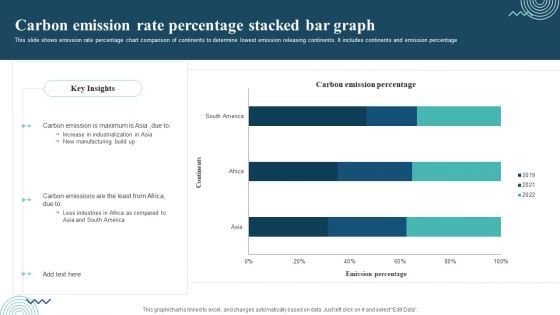
Carbon Emission Rate Percentage Stacked Bar Graph Rules PDF
This slide shows emission rate percentage chart comparison of continents to determine lowest emission releasing continents. It includes continents and emission percentage Showcasing this set of slides titled Carbon Emission Rate Percentage Stacked Bar Graph Rules PDF. The topics addressed in these templates are Carbon Emission, Increase In Industrialization, New Manufacturing. All the content presented in this PPT design is completely editable. Download it and make adjustments in color, background, font etc. as per your unique business setting.
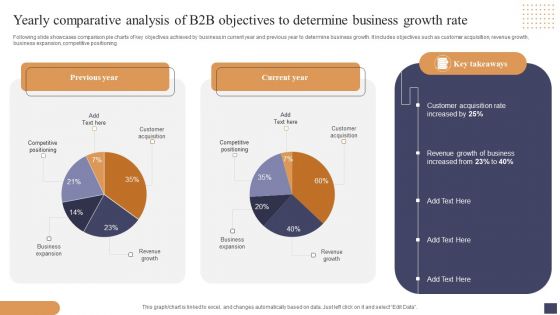
Yearly Comparative Analysis Of B2b Objectives To Determine Business Growth Rate Mockup PDF
Following slide showcases comparison pie charts of key objectives achieved by business in current year and previous year to determine business growth. It includes objectives such as customer acquisition, revenue growth, business expansion, competitive positioning. Showcasing this set of slides titled Yearly Comparative Analysis Of B2b Objectives To Determine Business Growth Rate Mockup PDF. The topics addressed in these templates are Customer Acquisition, Revenue Growth Business, Business Expansion. All the content presented in this PPT design is completely editable. Download it and make adjustments in color, background, font etc. as per your unique business setting.
Applied Ergonomics In Powerpoint And Google Slides Cpb
Introducing our well-designed Applied Ergonomics In Powerpoint And Google Slides Cpb. This PowerPoint design presents information on topics like Antihistamine Comparison Chart. As it is predesigned it helps boost your confidence level. It also makes you a better presenter because of its high-quality content and graphics. This PPT layout can be downloaded and used in different formats like PDF, PNG, and JPG. Not only this, it is available in both Standard Screen and Widescreen aspect ratios for your convenience. Therefore, click on the download button now to persuade and impress your audience. Our Applied Ergonomics In Powerpoint And Google Slides Cpb are topically designed to provide an attractive backdrop to any subject. Use them to look like a presentation pro.
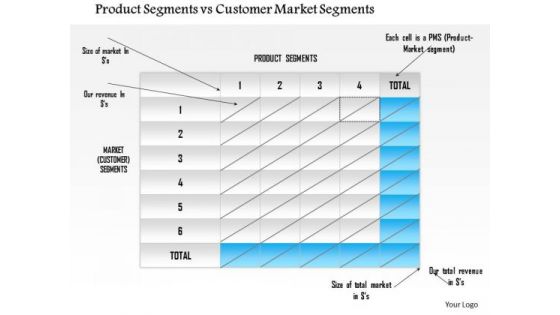
Business Framework Product Segments Vs Customer Market Segments PowerPoint Presentation
Blue and white cubes are used to design this chart for defining the concept of comparison. This PPT slide can be used to compare the product and customer market segments. Use this PPT slide for business and marketing presentations.
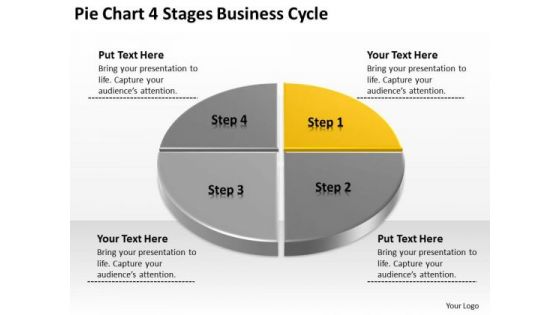
Hub And Spoke 10 Stages Cyclic Process Business Plan PowerPoint Templates
We present our hub and spoke 10 stages cyclic process business plan PowerPoint templates.Present our Circle Charts PowerPoint Templates because Our PowerPoint Templates and Slides will weave a web of your great ideas. They are gauranteed to attract even the most critical of your colleagues. Download and present our Process and Flows PowerPoint Templates because Our PowerPoint Templates and Slides help you meet the demand of the Market. Just browse and pick the slides that appeal to your intuitive senses. Download and present our Marketing PowerPoint Templates because Our PowerPoint Templates and Slides will let you Clearly mark the path for others to follow. Use our Business PowerPoint Templates because Our PowerPoint Templates and Slides are aesthetically designed to attract attention. We gaurantee that they will grab all the eyeballs you need. Download our Shapes PowerPoint Templates because Our PowerPoint Templates and Slides will embellish your thoughts. See them provide the desired motivation to your team.Use these PowerPoint slides for presentations relating to Hub, diagram, chart, abstract,model, business,round, website, cross,diagram, graph, line, cross, statistics, print, economy, state, business, concept, vector, circle, brochure, scheme, graphic, balance, calculation,development, four, illustration, economic, comparison, chart, catalog, round, backdrop, design, poster, situation, progress, background, image, financial. The prominent colors used in the PowerPoint template are Yellow, White, Gray. Be a proactive manager with our Hub And Spoke 10 Stages Cyclic Process Business Plan PowerPoint Templates. They will make you look good.
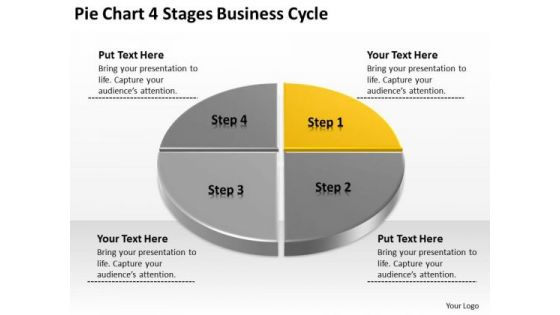
E Business PowerPoint Presentation Format Plan Templates
We present our e business powerpoint presentation format plan templates.Use our Process and Flows PowerPoint Templates because Our PowerPoint Templates and Slides offer you the widest possible range of options. Use our Marketing PowerPoint Templates because Our PowerPoint Templates and Slides will provide weight to your words. They will bring out the depth of your thought process. Download and present our Business PowerPoint Templates because Your success is our commitment. Our PowerPoint Templates and Slides will ensure you reach your goal. Present our Flow Charts PowerPoint Templates because Our PowerPoint Templates and Slides will provide you the cutting edge. Slice through the doubts in the minds of your listeners. Present our Shapes PowerPoint Templates because Our PowerPoint Templates and Slides offer you the widest possible range of options.Use these PowerPoint slides for presentations relating to Diagram, graph, line, cross, statistics, print, economy, state, business, concept, vector, circle, brochure, scheme, graphic, balance, calculation,development, four, illustration, flyer, economic, comparison, chart, catalog, round, backdrop, design, poster, situation, progress, background, image, financial. The prominent colors used in the PowerPoint template are Yellow, Black, Gray. Make your presentations helpful with our E Business PowerPoint Presentation Format Plan Templates. Dont waste time struggling with PowerPoint. Let us do it for you.
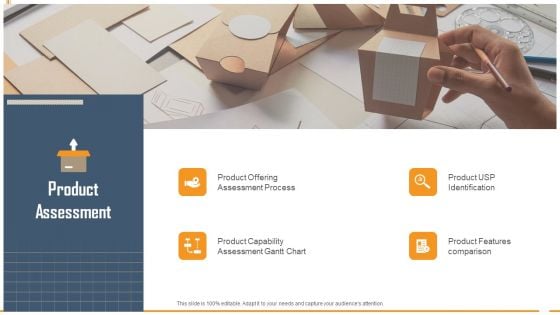
Building Innovation Capabilities And USP Detection Product Assessment Ppt Styles Background Image PDF
Deliver an awe-inspiring pitch with this creative building innovation capabilities and usp detection product assessment ppt styles background image pdf bundle. Topics like product offering assessment process, product capability assessment gantt chart, product usp identification, product features comparison can be discussed with this completely editable template. It is available for immediate download depending on the needs and requirements of the user.
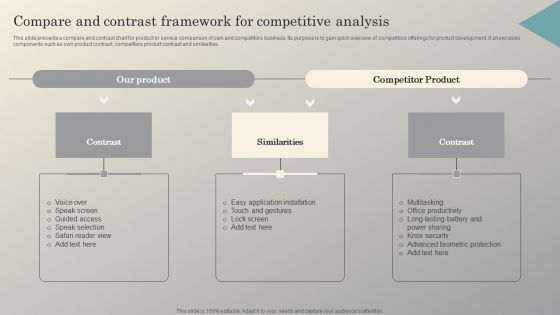
Steps To Conduct Competitor Analysis Compare And Contrast Framework For Competitive Sample PDF
This slide presents a compare and contrast chart for product or service comparison of own and competitors business. Its purpose is to gain quick overview of competitors offerings for product development. It showcases components such as own product contrast, competitors product contrast and similarities. The best PPT templates are a great way to save time, energy, and resources. Slidegeeks have 100 percent editable powerpoint slides making them incredibly versatile. With these quality presentation templates, you can create a captivating and memorable presentation by combining visually appealing slides and effectively communicating your message. Download Steps To Conduct Competitor Analysis Compare And Contrast Framework For Competitive Sample PDF from Slidegeeks and deliver a wonderful presentation.
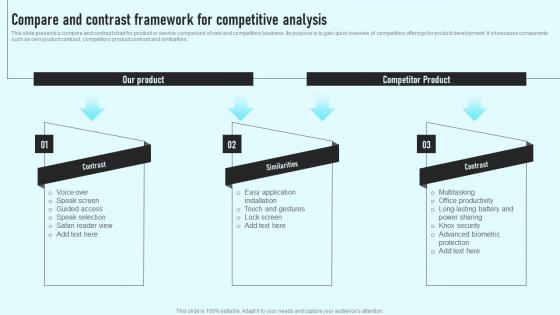
Compare And Contrast Framework For Competitive Analysis Comprehensive Guide Infographics Pdf
This slide presents a compare and contrast chart for product or service comparison of own and competitors business. Its purpose is to gain quick overview of competitors offerings for product development. It showcases components such as own product contrast, competitors product contrast and similarities. Slidegeeks is here to make your presentations a breeze with Compare And Contrast Framework For Competitive Analysis Comprehensive Guide Infographics Pdf With our easy-to-use and customizable templates, you can focus on delivering your ideas rather than worrying about formatting. With a variety of designs to choose from, you are sure to find one that suits your needs. And with animations and unique photos, illustrations, and fonts, you can make your presentation pop. So whether you are giving a sales pitch or presenting to the board, make sure to check out Slidegeeks first. This slide presents a compare and contrast chart for product or service comparison of own and competitors business. Its purpose is to gain quick overview of competitors offerings for product development. It showcases components such as own product contrast, competitors product contrast and similarities.
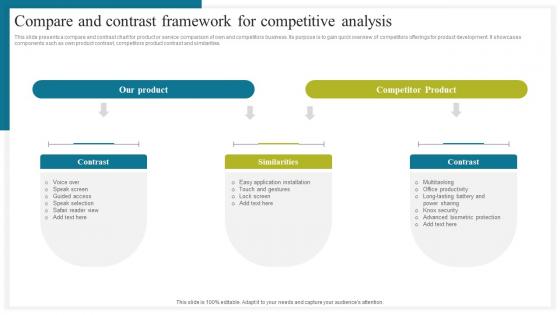
Compare And Contrast Framework How To Conduct Competitive Assessment Themes Pdf
This slide presents a compare and contrast chart for product or service comparison of own and competitors business. Its purpose is to gain quick overview of competitors offerings for product development. It showcases components such as own product contrast, competitors product contrast and similarities. Slidegeeks is here to make your presentations a breeze with Compare And Contrast Framework How To Conduct Competitive Assessment Themes Pdf With our easy to use and customizable templates, you can focus on delivering your ideas rather than worrying about formatting. With a variety of designs to choose from, you are sure to find one that suits your needs. And with animations and unique photos, illustrations, and fonts, you can make your presentation pop. So whether you are giving a sales pitch or presenting to the board, make sure to check out Slidegeeks first. This slide presents a compare and contrast chart for product or service comparison of own and competitors business. Its purpose is to gain quick overview of competitors offerings for product development. It showcases components such as own product contrast, competitors product contrast and similarities.
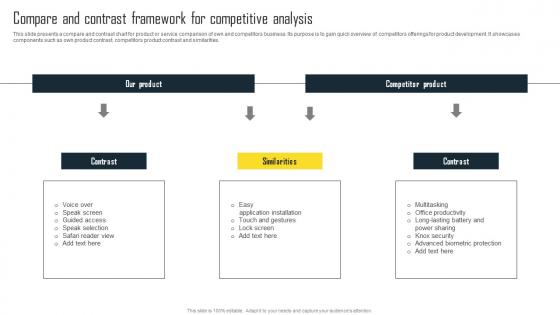
Compare And Contrast Framework For Competitive Efficient Plan For Conducting Competitor Structure Pdf
This slide presents a compare and contrast chart for product or service comparison of own and competitors business. Its purpose is to gain quick overview of competitors offerings for product development. It showcases components such as own product contrast, competitors product contrast and similarities. Present like a pro with Compare And Contrast Framework For Competitive Efficient Plan For Conducting Competitor Structure Pdf Create beautiful presentations together with your team, using our easy-to-use presentation slides. Share your ideas in real-time and make changes on the fly by downloading our templates. So whether you are in the office, on the go, or in a remote location, you can stay in sync with your team and present your ideas with confidence. With Slidegeeks presentation got a whole lot easier. Grab these presentations today. This slide presents a compare and contrast chart for product or service comparison of own and competitors business. Its purpose is to gain quick overview of competitors offerings for product development. It showcases components such as own product contrast, competitors product contrast and similarities.


 Continue with Email

 Home
Home


