Cost Chart

3d Regular Implementation 7 Steps Flow Chart Template PowerPoint Slides
We present our 3d regular implementation 7 steps flow chart template PowerPoint Slides. Use our Business PowerPoint Templates because, The lessons have been analyzed, studied and conclusions drawn. Use our Arrows PowerPoint Templates because, Our Template designs are State of the Art. Use our Shapes PowerPoint Templates because; Highlight the key components of your entire manufacturing/ business process. Use our Abstract PowerPoint Templates because, Demonstrate to your audience how the best and most refined ideas pass through. Use our Process and Flows PowerPoint Templates because, to go for Gold and not just silver. Use these PowerPoint slides for presentations relating to analysis, art, blank, blue, business, categories, chart, chief, circle, clip, clipart, corporate, design, diagram, directors, element, executive, financial, graph, icon, illustration, implementation, isolated, managers, media, network, relations, role, sales, segments, set. The prominent colors used in the PowerPoint template are Blue, Gray, and Black Introduce changes with our 3d Regular Implementation 7 Steps Flow Chart Template PowerPoint Slides. Download without worries with our money back guaranteee.
Pie Chart Business PowerPoint Themes And PowerPoint Slides 0511
Microsoft PowerPoint Slide and Theme with a pie chart with one segment being removed Our Pie Chart Business PowerPoint Themes And PowerPoint Slides 0511 save time creating a mind blowing presentation. With our money back guarantee you have nothing to lose.
Pie Chart Marketing Business PowerPoint Templates And PowerPoint Themes 0612
Pie Chart Marketing Business PowerPoint Templates And PowerPoint Themes Business PPT Templates-Pie graph marketing, business, finance, sales, success, marketing Succeed admirably with our Pie Chart Marketing Business PowerPoint Templates And PowerPoint Themes 0612. Download without worries with our money back guaranteee.
Usa Map Chart Americana PowerPoint Presentation Slides Cc
Microsoft PowerPoint Slides and Backgrounds with of a multicolored bar chart sitting on top of a transparent extruded map of the united states on a medium gray reflective surface Beat the budget with our Usa Map Chart Americana PowerPoint Presentation Slides Cc. Have enough to spare in the end.
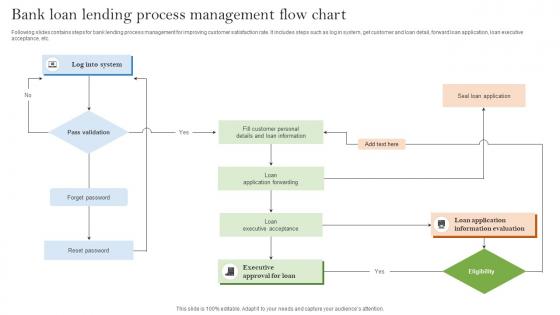
Bank Loan Lending Process Management Flow Chart Formats Pdf
Following slides contains steps for bank lending process management for improving customer satisfaction rate. It includes steps such as log in system, get customer and loan detail, forward loan application, loan executive acceptance, etc. Showcasing this set of slides titled Bank Loan Lending Process Management Flow Chart Formats Pdf. The topics addressed in these templates are Loan Application, Information Evaluation, Eligibility. All the content presented in this PPT design is completely editable. Download it and make adjustments in color, background, font etc. as per your unique business setting. Following slides contains steps for bank lending process management for improving customer satisfaction rate. It includes steps such as log in system, get customer and loan detail, forward loan application, loan executive acceptance, etc.
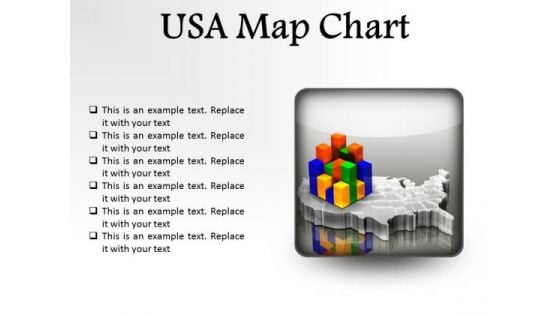
Usa Map Chart Americana PowerPoint Presentation Slides S
Microsoft PowerPoint Slides and Backgrounds with of a multicolored bar chart sitting on top of a transparent extruded map of the united states on a medium gray reflective surface Reposition yourself with our Usa Map Chart Americana PowerPoint Presentation Slides S. Download without worries with our money back guaranteee.

Profit After Tax Pat Growth Chart Powerpoint Slide Designs Download
This is a profit after tax pat growth chart powerpoint slide designs download. This is a five stage process. The stages in this process are growth, success, business, strategy, marketing.
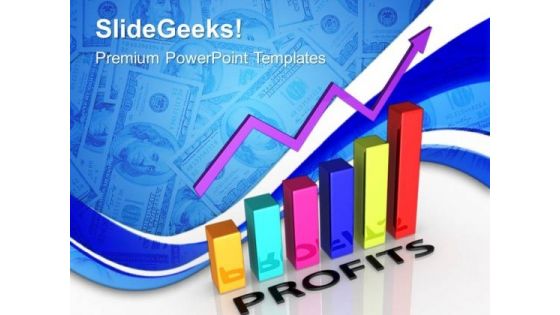
Profits Bar Chart Sales PowerPoint Templates And PowerPoint Themes 0612
Profits Bar Chart Sales PowerPoint Templates And PowerPoint Themes PPT Slides-Microsoft Powerpoint Templates and Background with graph with arrow Let our Profits Bar Chart Sales PowerPoint Templates And PowerPoint Themes 0612 do your errands. They will bring in the goodies for you.
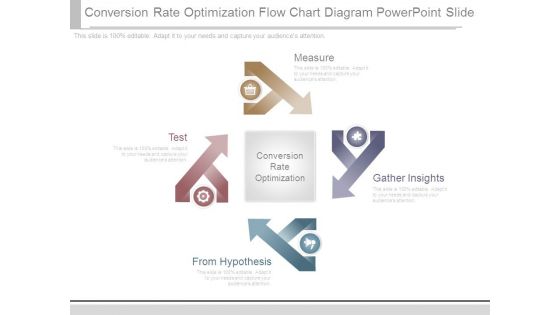
Conversion Rate Optimization Flow Chart Diagram Powerpoint Slide
This is a conversion rate optimization flow chart diagram powerpoint slide. This is a four stage process. The stages in this process are measure, gather insights, from hypothesis, test, conversion rate optimization.

Conversion Rate Optimization Flow Chart Sample Diagram Powerpoint Slides Images
This is a conversion rate optimization flow chart sample diagram powerpoint slides images. This is a five stage process. The stages in this process are gather insights, measure, unique, pitch, status, future.

Conversion Rate Optimization Flow Chart Sample Diagram Example Ppt
This is a conversion rate optimization flow chart sample diagram example ppt. This is a four stage process. The stages in this process are measure, gather insights, test, form hypothesis.
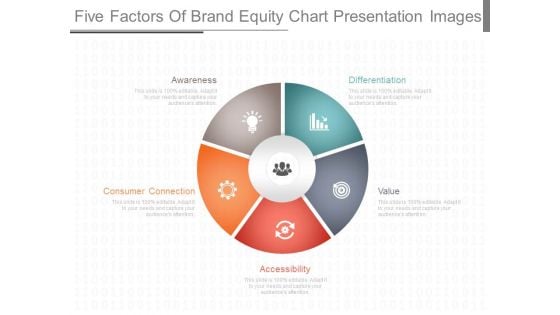
Five Factors Of Brand Equity Chart Presentation Images
This is a five factors of brand equity chart presentation images. This is a five stage process. The stages in this process are awareness, differentiation, consumer connection, accessibility, value. \n \n \n \n \n \n \n \n \n \n
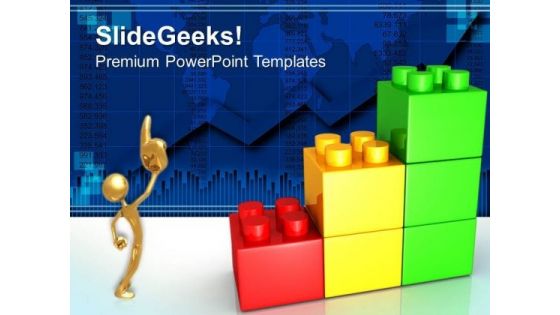
Lego Growth Chart Business PowerPoint Templates And PowerPoint Themes 0512
Lego Growth Chart Business PowerPoint Templates And PowerPoint Themes PPT designs-Microsoft Powerpoint Templates and Background with bar graph Give your audience a feast for their eyes. Our brightly colored Lego Growth Chart Business PowerPoint Templates And PowerPoint Themes 0512 will hold their fascnation.
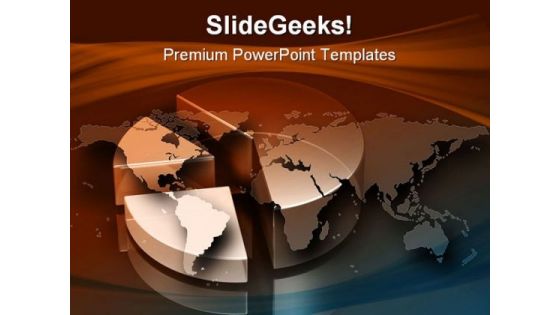
Pie Chart Business PowerPoint Themes And PowerPoint Slides 0711
Microsoft PowerPoint Theme and Slide with a flat map of the world over top of a transparent three-segment bar chart Be liberal with graphics in your presentations. Achieve that with our Pie Chart Business PowerPoint Themes And PowerPoint Slides 0711. Dont waste time struggling with PowerPoint. Let us do it for you.
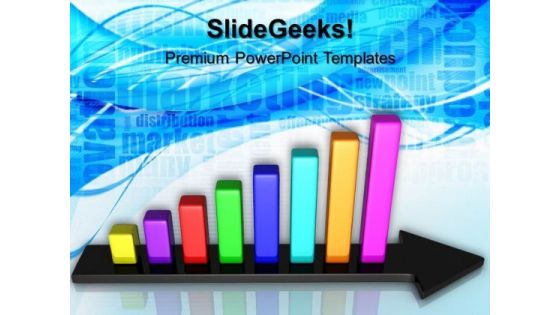
Bar Chart Growth Business PowerPoint Templates And PowerPoint Themes 0612
Bar Chart Growth Business PowerPoint Templates And PowerPoint Themes PPT Slides-Microsoft Powerpoint Templates and Background with business success with arrow Enumerate the facts on our Bar Chart Growth Business PowerPoint Templates And PowerPoint Themes 0612. Establish the correct chain of events.
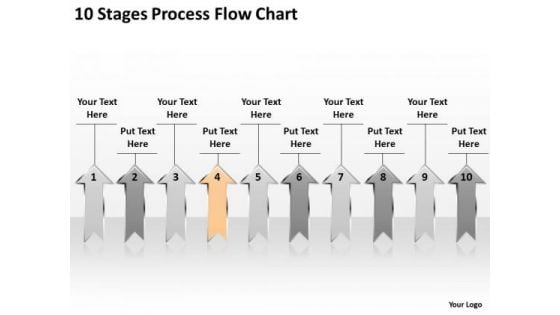
Explain Parallel Processing 10 Stages Flow Chart PowerPoint Templates
We present our explain parallel processing 10 stages flow chart PowerPoint templates.Download and present our Business PowerPoint Templates because Our PowerPoint Templates and Slides will let Your superior ideas hit the target always and everytime. Download and present our Arrows PowerPoint Templates because Our PowerPoint Templates and Slides will steer your racing mind. Hit the right buttons and spur on your audience. Present our Shapes PowerPoint Templates because You can Stir your ideas in the cauldron of our PowerPoint Templates and Slides. Cast a magic spell on your audience. Use our Success PowerPoint Templates because Our PowerPoint Templates and Slides are focused like a searchlight beam. They highlight your ideas for your target audience. Download and present our Signs PowerPoint Templates because You will get more than you ever bargained for. Use these PowerPoint slides for presentations relating to 3d, achievement, aim, arrows, business, career, chart, competition,development, direction, education, financial, forecast, forward, glossy, graph,group, growth, higher, icon, increase, investment, leader, leadership, moving,onwards, outlook, path, plan, prediction, price, profit, progress, property, race,sales, series, success, target, team, teamwork, turn, up, upwards, vector, win,winner. The prominent colors used in the PowerPoint template are Tan, Gray, White. We assure you our explain parallel processing 10 stages flow chart PowerPoint templates are designed by professionals PowerPoint presentation experts tell us our arrows PowerPoint templates and PPT Slides will save the presenter time. The feedback we get is that our explain parallel processing 10 stages flow chart PowerPoint templates look good visually. We assure you our chart PowerPoint templates and PPT Slides have awesome images to get your point across. PowerPoint presentation experts tell us our explain parallel processing 10 stages flow chart PowerPoint templates will make you look like a winner. We assure you our arrows PowerPoint templates and PPT Slides are specially created by a professional team with vast experience. They diligently strive to come up with the right vehicle for your brilliant Ideas. Factor it all in with our Explain Parallel Processing 10 Stages Flow Chart PowerPoint Templates. They account for every element.
Pie Chart Business PowerPoint Templates And PowerPoint Backgrounds 0711
Microsoft PowerPoint Template and Background with a flat map of the world over top of a transparent three-segment bar chart Inform your audience with our Pie Chart Business PowerPoint Templates And PowerPoint Backgrounds 0711. Make sure your presentation gets the attention it deserves.
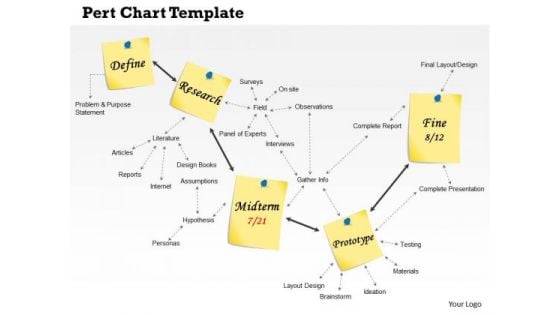
Business Framework Pert Chart Template Diagram PowerPoint Presentation
This business framework image slide displays Pert chart template. Use this image slide to depict PERT chart which is a project management tool used to schedule, organize, and coordinate tasks within a project. This image slide will enhance the quality of your presentations.
Global Pie Chart Business PowerPoint Themes And PowerPoint Slides 0611
Microsoft PowerPoint Theme and Slide with a flat map of the world protruding from a colorful three-segment pie chart Create a conducive climate for your thoughts. Our Global Pie Chart Business PowerPoint Themes And PowerPoint Slides 0611 give them exclusive attention.
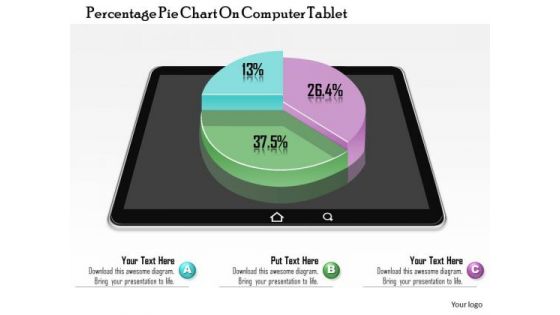
Business Diagram Percentage Pie Chart On Computer Tablet Presentation Template
This image slide displays business consulting diagram of percentage pie chart on computer tablet. This image has been made with 3d colorful graphic of pie chart on black tablet. Use this PowerPoint template, in your presentations to express various views like growth, achievements, success in business. This image slide will make your presentations outshine.

Consulting Diagram Process Chart 12 Stages Strategy Diagram
Get The Doers Into Action. Activate Them With Our Consulting Diagram Process Chart 12 Stages Strategy Diagram Powerpoint Templates. Put Your Money On Our Consulting Diagram Process Chart 12 Stages Strategy Diagram Powerpoint Templates. Your Ideas Will Rake In The Dollars.
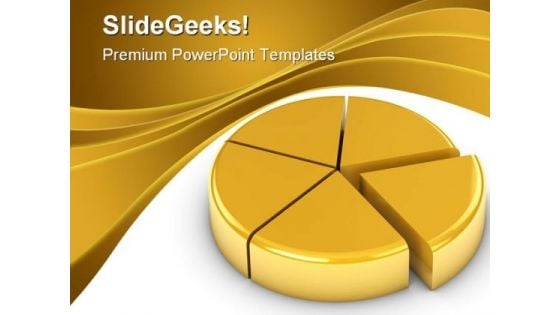
Golden Pie Chart Business PowerPoint Backgrounds And Templates 1210
Microsoft PowerPoint Template and Background with Golden pie chart on a white background. Part of a series Dont miss a trick. Be in charge with our Golden Pie Chart Business PowerPoint Backgrounds And Templates 1210. You will be at the top of your game.
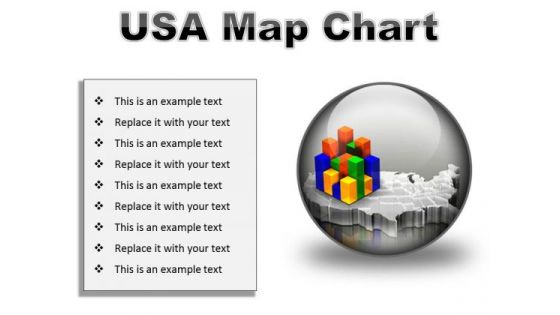
Usa Map Chart Americana PowerPoint Presentation Slides C
Microsoft PowerPoint Slides and Backgrounds with of a multicolored bar chart sitting on top of a transparent extruded map of the united states on a medium gray reflective surface Say farewell to uncertainties with our Usa Map Chart Americana PowerPoint Presentation Slides C. They help ensure desired results.
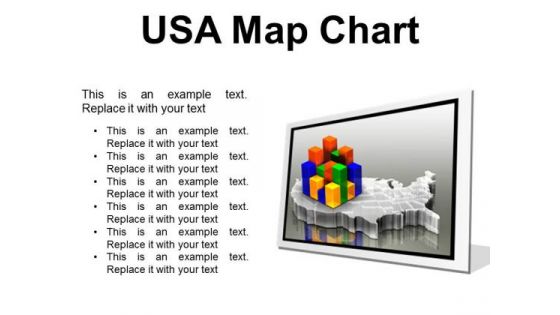
Usa Map Chart Americana PowerPoint Presentation Slides F
Microsoft PowerPoint Slides and Backgrounds with of a multicolored bar chart sitting on top of a transparent extruded map of the united states on a medium gray reflective surface Our Usa Map Chart Americana PowerPoint Presentation Slides F provide an attractive backdrop. Your thoughts will be the main feature.
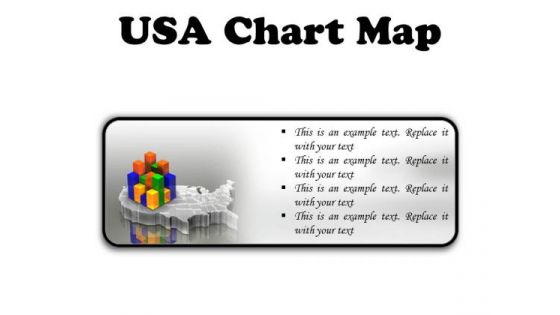
Usa Map Chart Americana PowerPoint Presentation Slides R
Microsoft PowerPoint Slides and Backgrounds with of a multicolored bar chart sitting on top of a transparent extruded map of the united states on a medium gray reflective surface Correct the errant with our Usa Map Chart Americana PowerPoint Presentation Slides R. They will willingly accept your advice.
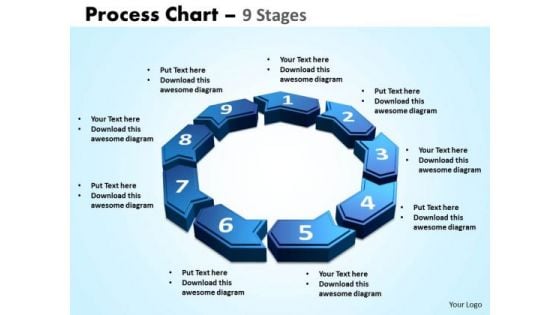
Business Framework Model Process Chart 9 Stages Business Diagram
Get The Doers Into Action. Activate Them With Our Business Framework Model Process Chart 9 Stages Business Diagram Powerpoint Templates. Put Your Money On Our Business Framework Model Process Chart 9 Stages Business Diagram Powerpoint Templates. Your Ideas Will Rake In The Dollars.
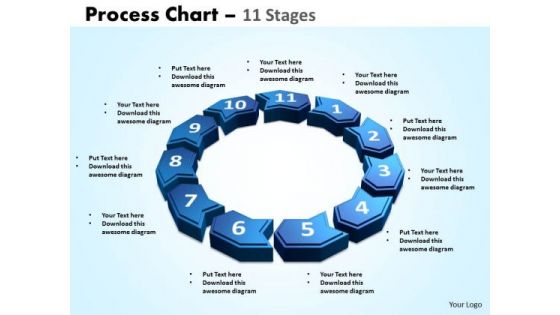
Strategic Management Process Chart 11 Stages Consulting Diagram
Get The Doers Into Action. Activate Them With Our Strategic Management Process Chart 11 Stages Consulting Diagram Powerpoint Templates. Put Your Money On Our Strategic Management Process Chart 11 Stages Consulting Diagram Powerpoint Templates. Your Ideas Will Rake In The Dollars.
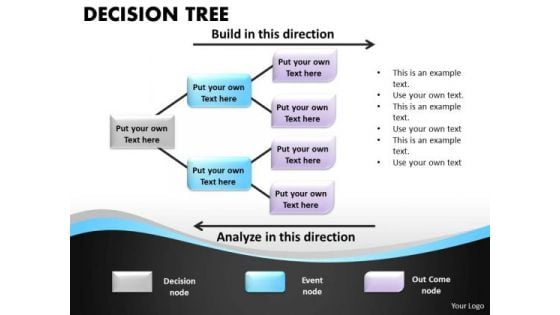
Business Cycle Diagram Decision Tree Process Chart Strategic Management
Get The Doers Into Action. Activate Them With Our Business Cycle Diagram Decision Tree Process Chart Strategic Management Powerpoint Templates. Put Your Money On Our Business Cycle Diagram Decision Tree Process Chart Strategic Management Powerpoint Templates. Your Ideas Will Rake In The Dollars.
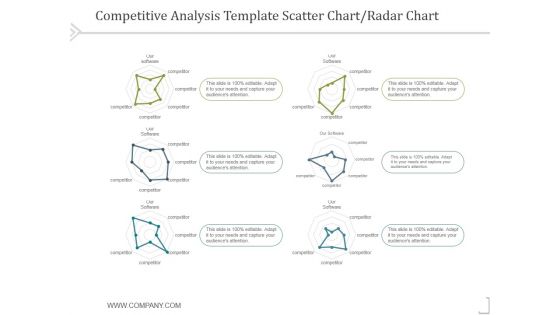
Competitive Analysis Scatter Chart Template 1 Ppt PowerPoint Presentation Themes
This is a competitive analysis scatter chart template 1 ppt powerpoint presentation themes. This is a six stage process. The stages in this process are business, strategy, marketing, success, analysis.
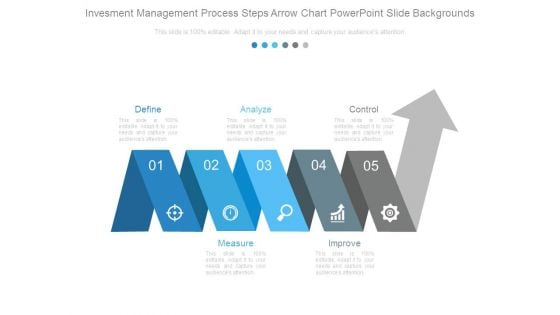
Investment Management Process Steps Arrow Chart Powerpoint Slide Backgrounds
This is a investment management process steps arrow chart powerpoint slide backgrounds. This is a five stage process. The stages in this process are define, analyze, control, measure, improve.
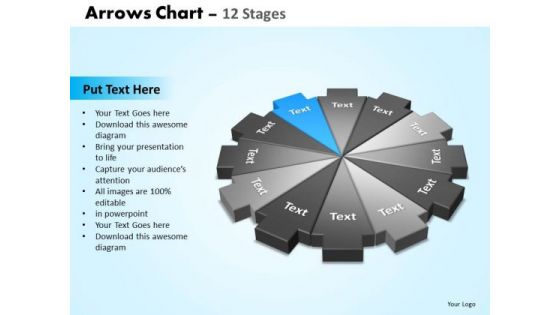
PowerPoint Design Slides Success Arrows Chart Ppt Slide
PowerPoint Design Slides Success Arrows Chart PPT Slide--These amazing PowerPoint pre-designed slides and PowerPoint templates have been carefully created by our team of experts to help you impress your audience. Our stunning collection of Powerpoint slides are 100% editable and can easily fit in any PowerPoint presentations. By using these animations and graphics in PowerPoint and you can easily make professional presentations. Any text can be entered at any point in the PowerPoint template or slide. Just DOWNLOAD our awesome PowerPoint templates and you are ready to go. Have an exhilirating event with our PowerPoint Design Slides Success Arrows Chart Ppt Slide. Feel a surge of excitement in you.
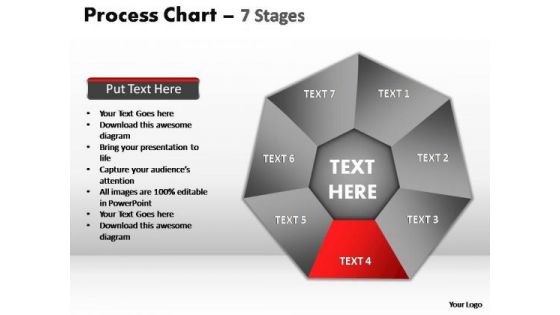
PowerPoint Slide Designs Teamwork Process Chart Ppt Backgrounds
PowerPoint Slide Designs Teamwork process chart PPT Backgrounds-These Fabulous PowerPoint slides and PowerPoint templates have been delicately designed by our professional team to leave long-lasting impressions on your audiences Perfect your presentations with our PowerPoint Slide Designs Teamwork Process Chart Ppt Backgrounds. Download without worries with our money back guaranteee.
Bar Chart Icon For Financial Ratios Comparison Elements PDF
Presenting bar chart icon for financial ratios comparison elements pdf to dispense important information. This template comprises four stages. It also presents valuable insights into the topics including bar chart icon for financial ratios comparison. This is a completely customizable PowerPoint theme that can be put to use immediately. So, download it and address the topic impactfully.
Chart Comparison Icon For Financial Ratios Template PDF
Persuade your audience using this chart comparison icon for financial ratios template pdf. This PPT design covers three stages, thus making it a great tool to use. It also caters to a variety of topics including chart comparison icon for financial ratios. Download this PPT design now to present a convincing pitch that not only emphasizes the topic but also showcases your presentation skills.
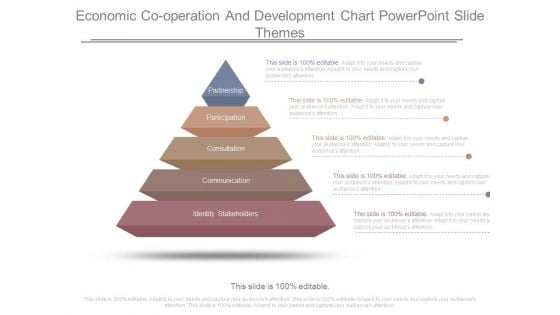
Economic Cooperation And Development Chart Powerpoint Slide Themes
This is a economic cooperation and development chart powerpoint slide themes. This is a five stage process. The stages in this process are partnership, participation, consultation, communication, identify, stakeholders.
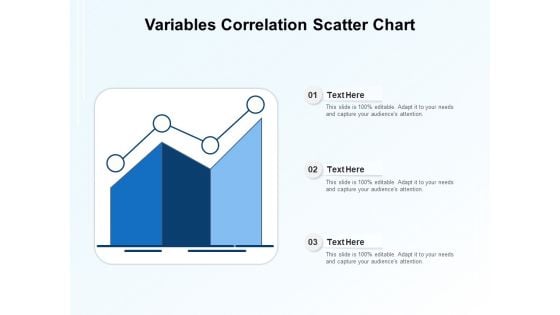
Variables Correlation Scatter Chart Ppt PowerPoint Presentation Model Smartart PDF
Presenting variables correlation scatter chart ppt powerpoint presentation model smartart pdf to dispense important information. This template comprises three stages. It also presents valuable insights into the topics including variables correlation scatter chart. This is a completely customizable PowerPoint theme that can be put to use immediately. So, download it and address the topic impactfully.
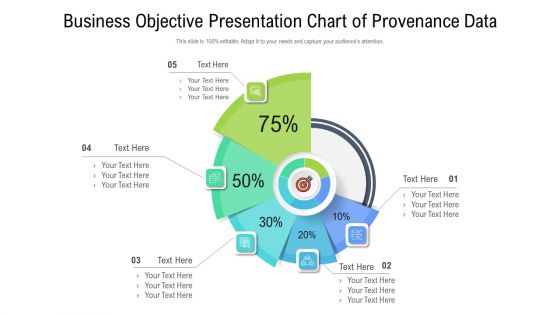
Business Objective Presentation Chart Of Provenance Data Download PDF
Presenting business objective presentation chart of provenance data download pdf to dispense important information. This template comprises five stages. It also presents valuable insights into the topics including business objective presentation chart of provenance data. This is a completely customizable PowerPoint theme that can be put to use immediately. So, download it and address the topic impactfully.

Statistical Data Analysis Chart Of Collected Data Formats PDF
Presenting statistical data analysis chart of collected data formats pdf to dispense important information. This template comprises four stages. It also presents valuable insights into the topics including statistical data analysis chart of collected data. This is a completely customizable PowerPoint theme that can be put to use immediately. So, download it and address the topic impactfully.
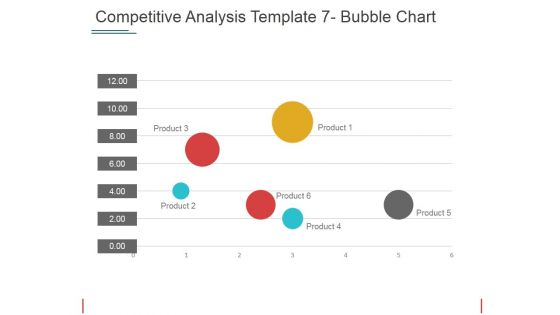
Competitive Analysis Bubble Chart Ppt PowerPoint Presentation Pictures Mockup
This is a competitive analysis bubble chart ppt powerpoint presentation pictures mockup. This is a six stage process. The stages in this process are product, table, business, marketing, management.
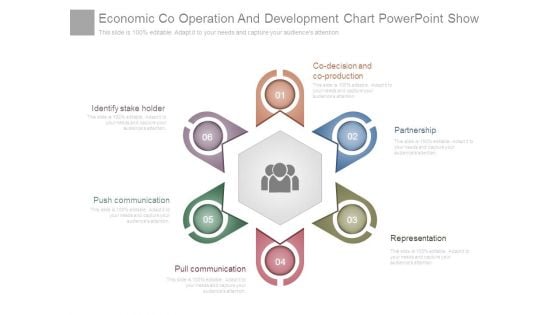
Economic Co Operation And Development Chart Powerpoint Show
This is a economic co operation and development chart powerpoint show. This is a six stage process. The stages in this process are co decision and co production, partnership, representation, pull communication, push communication, identify stake holder.
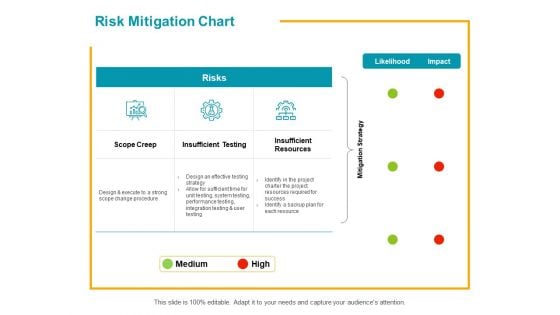
Risk Mitigation Chart Ppt PowerPoint Presentation Background Designs
Presenting this set of slides with name risk mitigation chart ppt powerpoint presentation background designs. The topics discussed in these slides are risk mitigation chart, insufficient, resources, success, performance. This is a completely editable PowerPoint presentation and is available for immediate download. Download now and impress your audience.
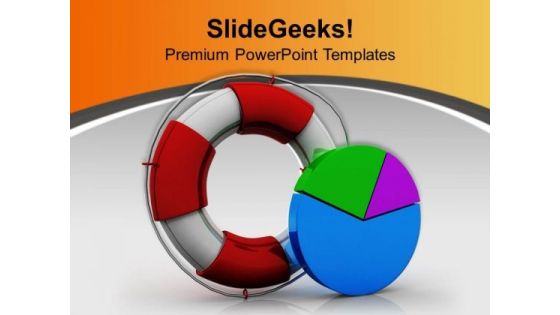
Rescue Pie Chart Business PowerPoint Templates And PowerPoint Themes 1112
Rescue Pie Chart Business PowerPoint Templates And PowerPoint Themes 1112-This Awesome PowerPoint template contains a diagram of lifesaver and pie chart. This image depicts the concept of statistics. Adjust the above image in your PPT presentations to visually support your content in your Business and Marketing PPT slideshows. Present your views using our innovative slides and be assured of leaving a lasting impression.-Rescue Pie Chart Business PowerPoint Templates And PowerPoint Themes 1112-This PowerPoint template can be used for presentations relating to-Lifesaver and Pie Chart, Symbol, Finance, Marketing, Business, Metaphor Get success delivered on a platter with our Rescue Pie Chart Business PowerPoint Templates And PowerPoint Themes 1112. Dont pass up this opportunity to shine.
Money Chart Ppt Icon For Ppt Templates And Slides Cc
Microsoft PowerPoint Template and Background with financial diagram consisting of golden Restore faith with our Money Chart Ppt Icon For Ppt Templates And Slides Cc. Download without worries with our money back guaranteee.
Money Chart Ppt Icon For Ppt Templates And Slides F
Microsoft PowerPoint Template and Background with financial diagram consisting of golden Forge ahead with our Money Chart Ppt Icon For Ppt Templates And Slides F. Download without worries with our money back guaranteee.
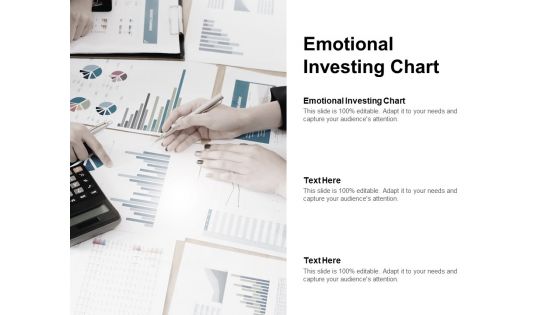
Emotional Investing Chart Ppt PowerPoint Presentation Portfolio Model Cpb Pdf
Presenting this set of slides with name emotional investing chart ppt powerpoint presentation portfolio model cpb pdf. This is an editable Powerpoint one stages graphic that deals with topics like emotional investing chart to help convey your message better graphically. This product is a premium product available for immediate download and is 100 percent editable in Powerpoint. Download this now and use it in your presentations to impress your audience.
Financial Chart For Investment Portfolio Management Vector Icon Rules PDF
Persuade your audience using this financial chart for investment portfolio management vector icon rules pdf. This PPT design covers three stages, thus making it a great tool to use. It also caters to a variety of topics including financial chart for investment portfolio management vector icon. Download this PPT design now to present a convincing pitch that not only emphasizes the topic but also showcases your presentation skills.
Money Chart Ppt Icon For Ppt Templates And Slides C
Microsoft PowerPoint Template and Background with financial diagram consisting of golden Our Money Chart Ppt Icon For Ppt Templates And Slides C make a delicious offering. The audience will be drooling for more.
Money Chart Ppt Icon For Ppt Templates And Slides R
Microsoft PowerPoint Template and Background with financial diagram consisting of golden Gain approval with our Money Chart Ppt Icon For Ppt Templates And Slides R. Just download, type and present.
Money Chart Ppt Icon For Ppt Templates And Slides S
Microsoft PowerPoint Template and Background with financial diagram consisting of golden Make sensational presentations with our Money Chart Ppt Icon For Ppt Templates And Slides S. You'll always stay ahead of the game.
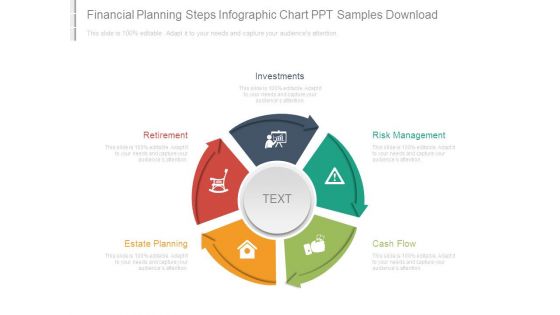
Financial Planning Steps Infographic Chart Ppt Samples Download
This is a financial planning steps infographic chart ppt samples download. This is a five stage process. The stages in this process are investments, retirement, estate planning, risk management, cash flow.
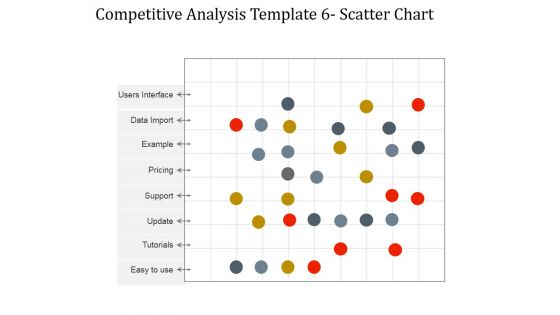
Competitive Analysis Scatter Chart Ppt PowerPoint Presentation Background Designs
This is a competitive analysis scatter chart ppt powerpoint presentation background designs. This is a three stage process. The stages in this process are competitive analysis, business, management, marketing, strategy.
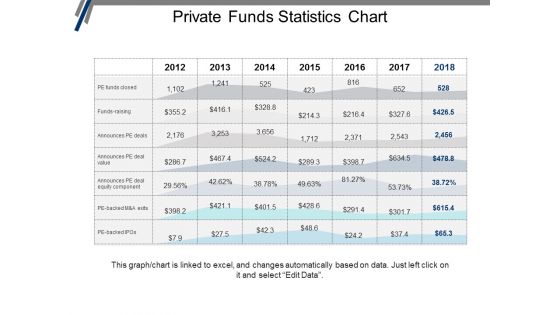
Private Funds Statistics Chart Ppt PowerPoint Presentation Portfolio Graphics Design
This is a private funds statistics chart ppt powerpoint presentation portfolio graphics design. This is a seven stage process. The stages in this process are investment, funding, private equity, venture capital.
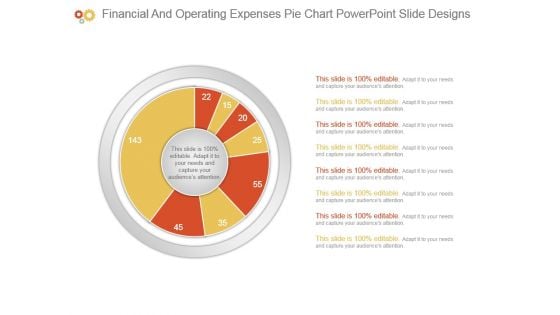
Financial And Operating Expenses Pie Chart Powerpoint Slide Designs
This is a financial and operating expenses pie chart powerpoint slide designs. This is a eight stage process. The stages in this process are business, diagram, marketing, management, presentation.
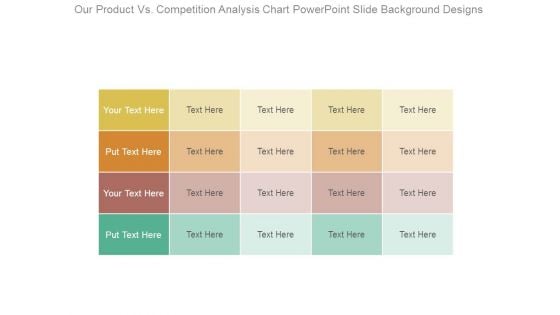
Our Product Vs Competition Analysis Chart Powerpoint Slide Background Designs
This is a our product vs competition analysis chart powerpoint slide background designs. This is a four stage process. The stages in this process are business, marketing, success, strategy, compare.
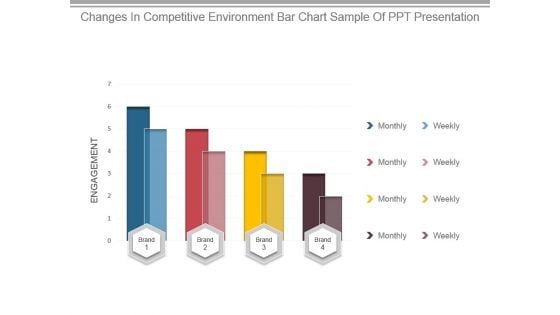
Changes In Competitive Environment Bar Chart Sample Of Ppt Presentation
This is a changes in competitive environment bar chart sample of ppt presentation. This is a four stage process. The stages in this process are engagement, brand, monthly, weekly.
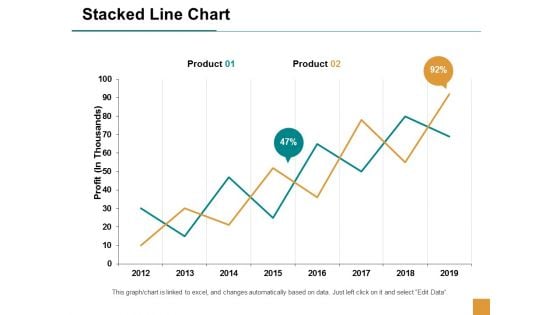
Stacked Line Chart Finance Ppt Powerpoint Presentation Outline Themes
This is a stacked line chart finance ppt powerpoint presentation outline themes. This is a two stage process. The stages in this process are finance, marketing, management, investment, analysis.
Clustered Bar Chart Finance Ppt PowerPoint Presentation Icon Tips
This is a clustered bar chart finance ppt powerpoint presentation icon tips. This is a two stage process. The stages in this process are analysis, finance, marketing, management, investment.
Clustered Bar Chart Finance Ppt Powerpoint Presentation Icon Graphics Template
This is a clustered bar chart finance ppt powerpoint presentation icon graphics template. This is a four stage process. The stages in this process are finance, marketing, management, investment, analysis.
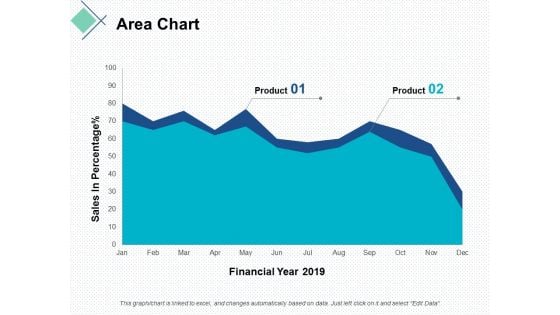
area chart finance ppt powerpoint presentation portfolio graphics download
This is a area chart finance ppt powerpoint presentation portfolio graphics download. This is a two stage process. The stages in this process are finance, marketing, management, investment, analysis.
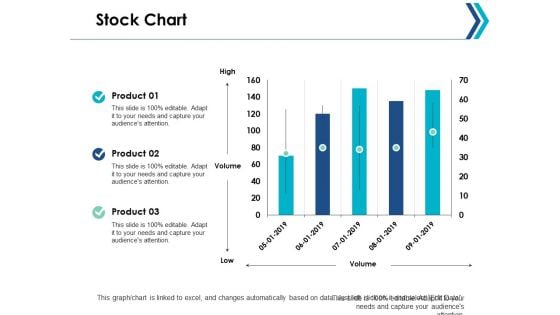
Stock Chart Finance Analysis Ppt Powerpoint Presentation Ideas Portrait
This is a stock chart finance analysis ppt powerpoint presentation ideas portrait. This is a three stage process. The stages in this process are finance, marketing, management, investment, strategy.


 Continue with Email

 Home
Home


