Cost Chart
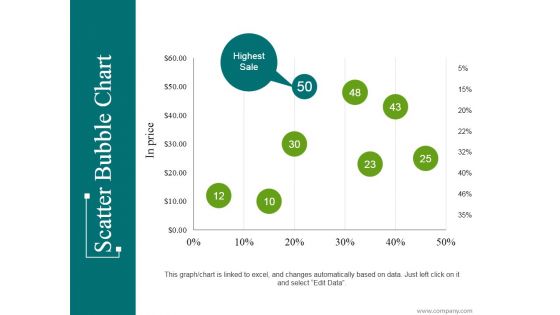
Scatter Bubble Chart Ppt PowerPoint Presentation Infographic Template Introduction
This is a scatter bubble chart ppt powerpoint presentation infographic template introduction. This is a eight stage process. The stages in this process are highest sale, business, marketing, percentage, finance.
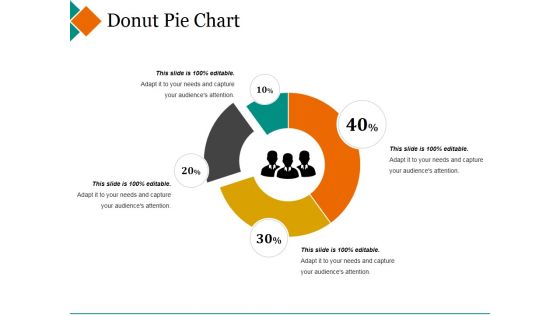
Donut Pie Chart Ppt PowerPoint Presentation Pictures Design Inspiration
This is a donut pie chart ppt powerpoint presentation pictures design inspiration. This is a four stage process. The stages in this process are maximum, donut, minimum, percentage, finance.
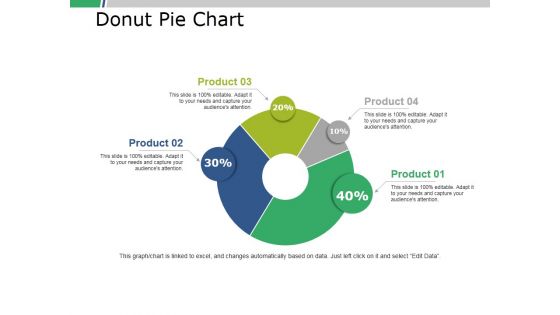
Donut Pie Chart Ppt PowerPoint Presentation Portfolio Slide Download
This is a donut pie chart ppt powerpoint presentation portfolio slide download. This is a four stage process. The stages in this process are business, marketing, finance, percent, donut.
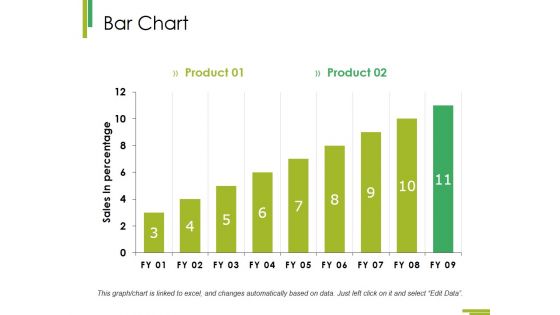
Bar Chart Ppt PowerPoint Presentation Infographic Template Master Slide
This is a bar chart ppt powerpoint presentation infographic template master slide. This is a two stage process. The stages in this process are growth, finance, business, analysis, marketing.
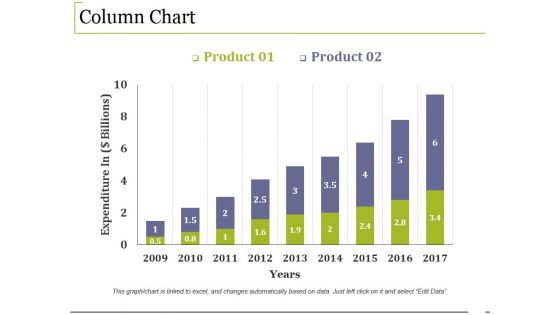
Column Chart Ppt PowerPoint Presentation Infographic Template Example File
This is a column chart ppt powerpoint presentation infographic template example file. This is a two stage process. The stages in this process are growth, finance, business, marketing, analysis.
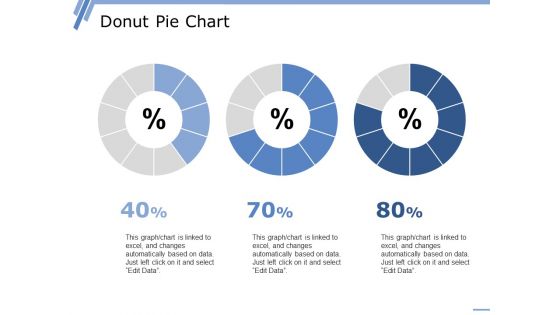
Donut Pie Chart Ppt PowerPoint Presentation Professional Graphic Images
This is a donut pie chart ppt powerpoint presentation professional graphic images. This is a three stage process. The stages in this process are percentage, finance, donut, business, marketing.
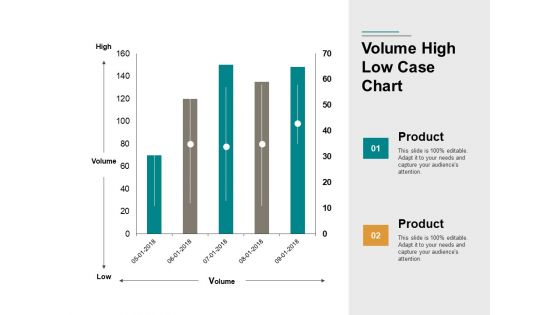
Volume High Low Case Chart Ppt PowerPoint Presentation Portfolio Images
This is a volume high low case chart ppt powerpoint presentation portfolio images. This is a two stage process. The stages in this process are finance, business, marketing, management.
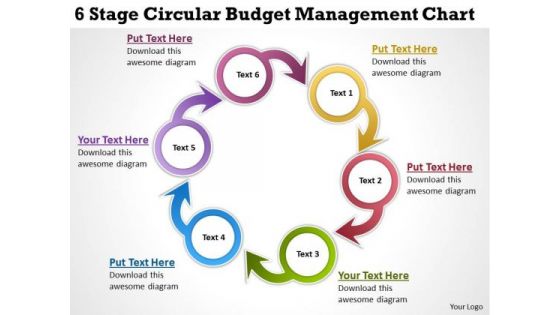
Business Diagram Templates 6 Stage Circular Budget Management Chart PowerPoint
We present our business diagram templates 6 stage circular budget management chart PowerPoint.Use our Circle Charts PowerPoint Templates because Our PowerPoint Templates and Slides will Activate the energies of your audience. Get their creative juices flowing with your words. Download and present our Business PowerPoint Templates because Our PowerPoint Templates and Slides will Activate the energies of your audience. Get their creative juices flowing with your words. Present our Shapes PowerPoint Templates because you should Whip up a frenzy with our PowerPoint Templates and Slides. They will fuel the excitement of your team. Use our Process and Flows PowerPoint Templates because You are an avid believer in ethical practices. Highlight the benefits that accrue with our PowerPoint Templates and Slides. Use our Arrows PowerPoint Templates because Our PowerPoint Templates and Slides will definately Enhance the stature of your presentation. Adorn the beauty of your thoughts with their colourful backgrounds.Use these PowerPoint slides for presentations relating to Arrow, Blue, Business, Chart, Circle, Complex, Concept, Data, Diagram, Financial, Graph, Graphic, Green, Icon, Illustration, Isolated, Model, Pink, Process, Purple, Red, Round, Set, Shape, Vector, Wheel, White, Yellow. The prominent colors used in the PowerPoint template are Yellow, Red, Blue. Engage our Business Diagram Templates 6 Stage Circular Budget Management Chart PowerPoint and experience the difference. Get accustomed to consistent brilliance.
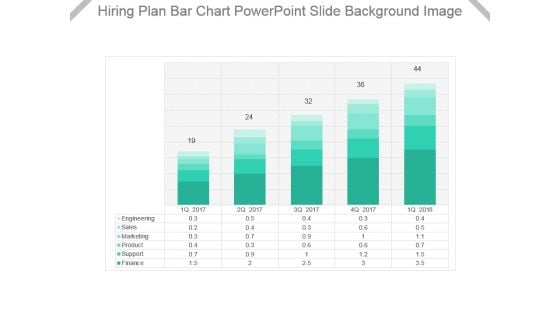
Hiring Plan Bar Chart Powerpoint Slide Background Image
This is a hiring plan bar chart powerpoint slide background image. This is a five stage process. The stages in this process are engineering, sales, marketing, product, support, finance.
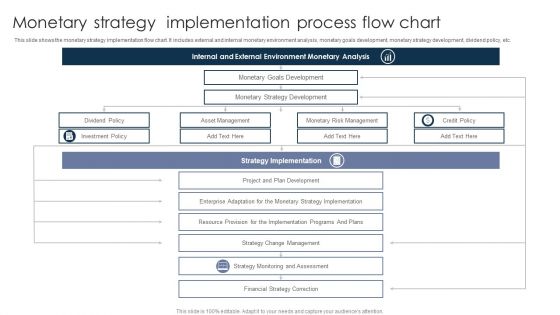
Monetary Strategy Implementation Process Flow Chart Brochure PDF
This slide shows the monetary strategy implementation flow chart. It includes external and internal monetary environment analysis, monetary goals development, monetary strategy development, dividend policy, etc. Pitch your topic with ease and precision using this Monetary Strategy Implementation Process Flow Chart Brochure PDF. This layout presents information on Dividend Policy, Investment Policy, Asset Management. It is also available for immediate download and adjustment. So, changes can be made in the color, design, graphics or any other component to create a unique layout.
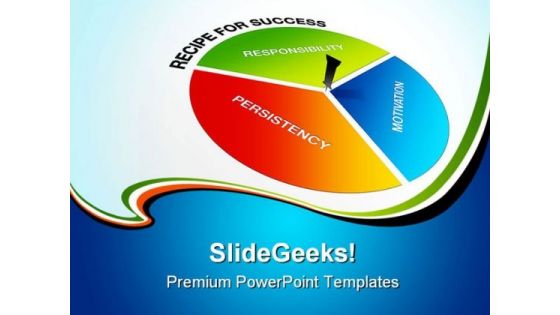
Chart For Success Business PowerPoint Templates And PowerPoint Backgrounds 0411
Microsoft PowerPoint Template and Background with perspective graphic of a pie with words recipe for succes Fly in the face of conservative approaches. Our Chart For Success Business PowerPoint Templates And PowerPoint Backgrounds 0411 encourage bold actions.

Bar Chart Business PowerPoint Templates And PowerPoint Backgrounds 0411
Microsoft PowerPoint Template and Background with arrow pointing up in bar chat If you have doubts about the effort required? Be assured our Bar Chart Business PowerPoint Templates And PowerPoint Backgrounds 0411 will make it fairly easy.

Chart Business PowerPoint Templates And PowerPoint Backgrounds 0511
Microsoft PowerPoint Template and Background with orange bar on screen business conceptual illustration Enhance your charisma with our Chart Business PowerPoint Templates And PowerPoint Backgrounds 0511. Allow your aura to flow around.

Growth Chart Success Business PowerPoint Templates And PowerPoint Backgrounds 0611
Microsoft PowerPoint Template and Background with financial growth red arrow rising Calculate your growing success with our Growth Chart Success Business PowerPoint Templates And PowerPoint Backgrounds 0611. You will come out on top.
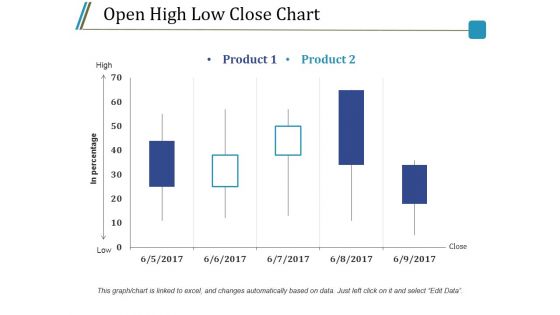
Open High Low Close Chart Ppt PowerPoint Presentation Styles Model
This is a open high low close chart ppt powerpoint presentation styles model. This is a five stage process. The stages in this process are product, high, low, in percentage, close.
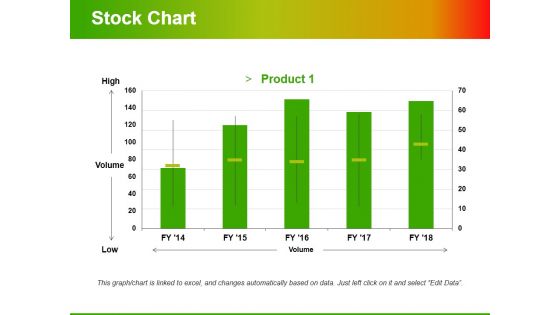
Stock Chart Template 2 Ppt PowerPoint Presentation Infographic Template Styles
This is a stock chart template 2 ppt powerpoint presentation infographic template styles. This is a one stage process. The stages in this process are high, volume, low, product, volume.
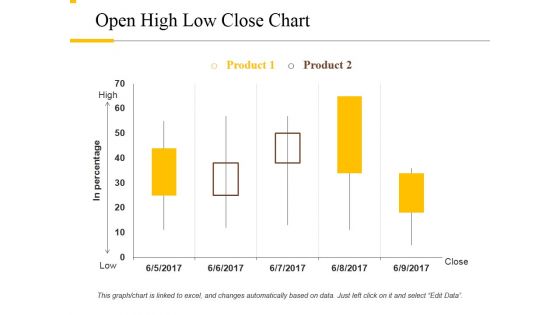
Open High Low Close Chart Ppt PowerPoint Presentation Outline Rules
This is a open high low close chart ppt powerpoint presentation outline rules. This is a two stage process. The stages in this process are product, high, low, close, in percentage.
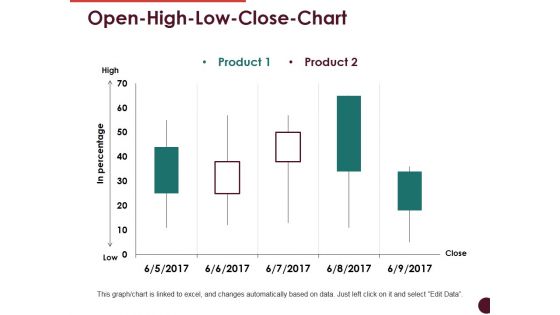
Open High Low Close Chart Ppt PowerPoint Presentation Professional Visuals
This is a open high low close chart ppt powerpoint presentation professional visuals. This is a two stage process. The stages in this process are high, low, in percentage, product, close.
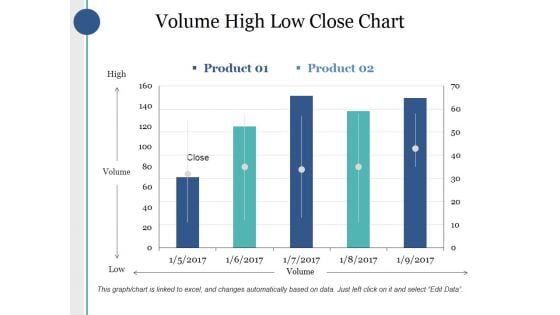
Volume High Low Close Chart Ppt PowerPoint Presentation Infographics Good
This is a volume high low close chart ppt powerpoint presentation infographics good. This is a two stage process. The stages in this process are high, volume, low, product, close.
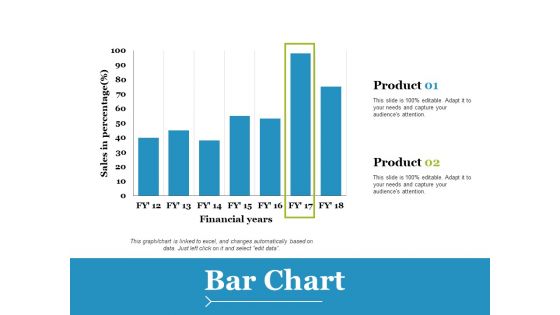
Bar Chart Ppt PowerPoint Presentation Slides Example File
This is a bar chart ppt powerpoint presentation slides example file. This is a two stage process. The stages in this process are product, financial years, sales in percentage.
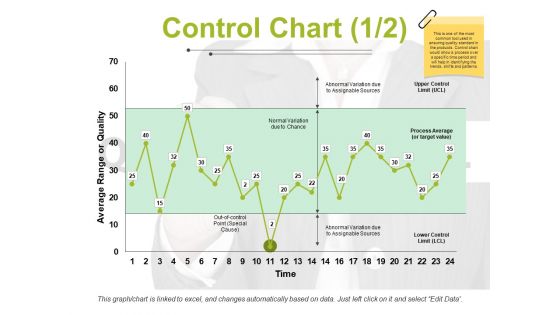
Control Chart Template 1 Ppt PowerPoint Presentation Ideas Images
This is a control chart template 1 ppt powerpoint presentation ideas images. This is a two stage process. The stages in this process are average range or quality, upper control limit, lower control limit, time, process average.
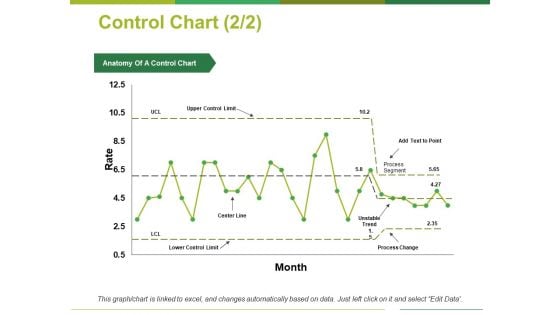
Control Chart Template 2 Ppt PowerPoint Presentation Portfolio Summary
This is a control chart template 2 ppt powerpoint presentation portfolio summary. This is a one stage process. The stages in this process are upper control limit, process segment, process change, unstable trend, lower control limit.
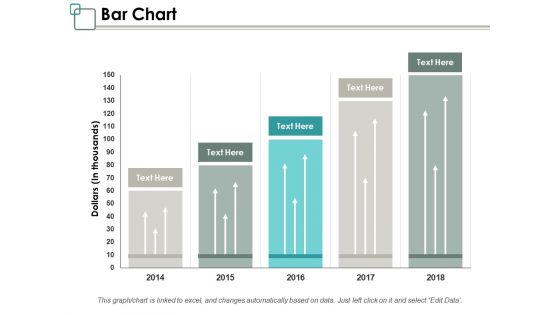
Bar Chart Ppt PowerPoint Presentation Infographic Template Graphics Design
This is a bar chart ppt powerpoint presentation infographic template graphics design. This is a five stage process. The stages in this process are management, marketing, business, percentage, product.

Insurance Claim Approval Flow Chart Ppt Powerpoint Presentation Styles Gallery
This is a insurance claim approval flow chart ppt powerpoint presentation styles gallery. This is a four stage process. The stages in this process are insurance claim process, insurance claim steps, insurance claim procedure.
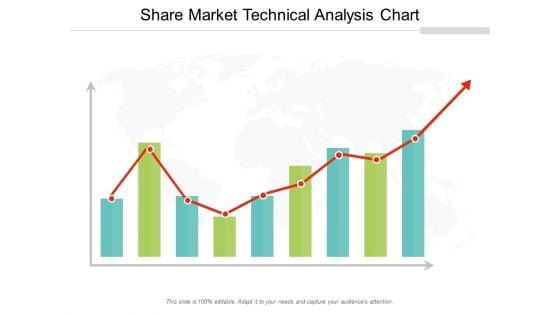
Share Market Technical Analysis Chart Ppt Powerpoint Presentation Professional Rules
This is a share market technical analysis chart ppt powerpoint presentation professional rules. This is a three stage process. The stages in this process are stock market, financial market, bull market.
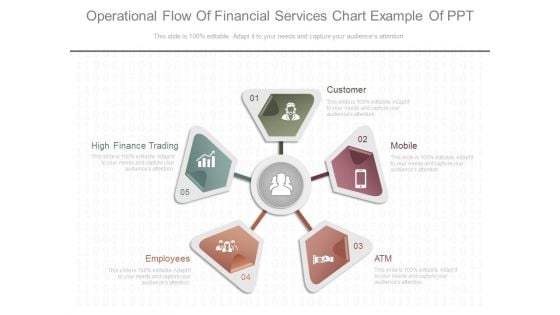
Operational Flow Of Financial Services Chart Example Of Ppt
This is a operational flow of financial services chart example of ppt. This is a five stage process. The stages in this process are customer, mobile, atm, employees, high finance trading.
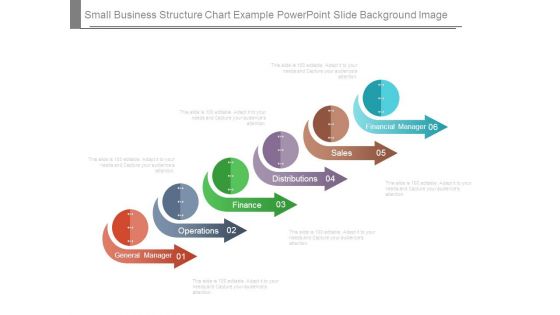
Small Business Structure Chart Example Powerpoint Slide Background Image
This is a small business structure chart example powerpoint slide background image. This is a six stage process. The stages in this process are financial manager, sales, distributions, finance, operations, general manager.
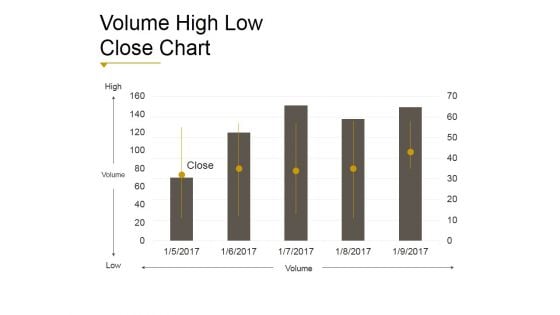
Volume High Low Close Chart Ppt PowerPoint Presentation Shapes
This is a volume high low close chart ppt powerpoint presentation shapes. This is a five stage process. The stages in this process are business, strategy, analysis, marketing, finance, growth.
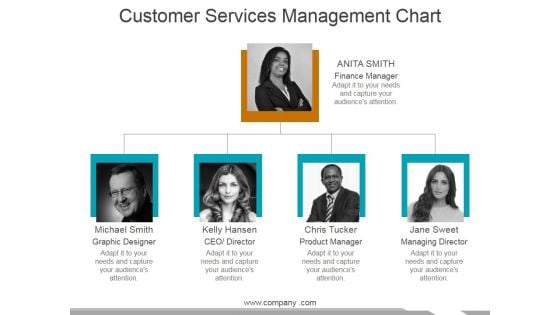
Customer Services Management Chart Ppt PowerPoint Presentation Show Slides
This is a customer services management chart ppt powerpoint presentation show slides. This is a two stage process. The stages in this process are finance manager, graphic designer, ceo director, product manager.
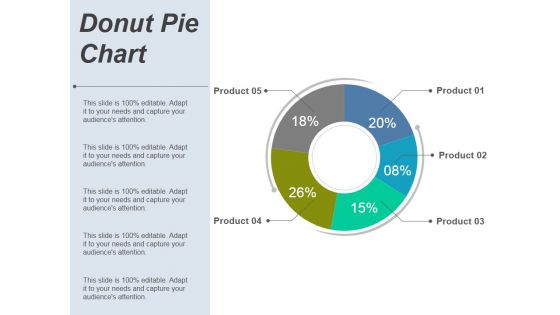
Donut Pie Chart Ppt PowerPoint Presentation Infographic Template Layout Ideas
This is a donut pie chart ppt powerpoint presentation infographic template layout ideas. This is a five stage process. The stages in this process are product, business, finance, marketing.
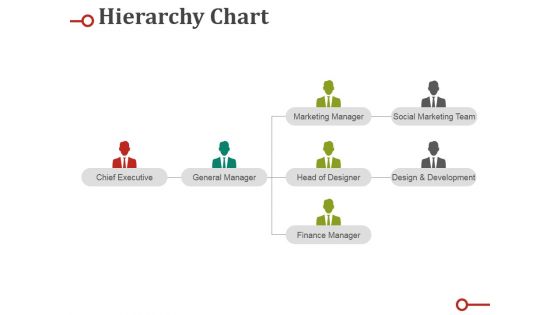
Hierarchy Chart Ppt PowerPoint Presentation Infographic Template Designs Download
This is a hierarchy chart ppt powerpoint presentation infographic template designs download. This is a four stage process. The stages in this process are chief executive, general manager, marketing manager, head of designer, finance manager.
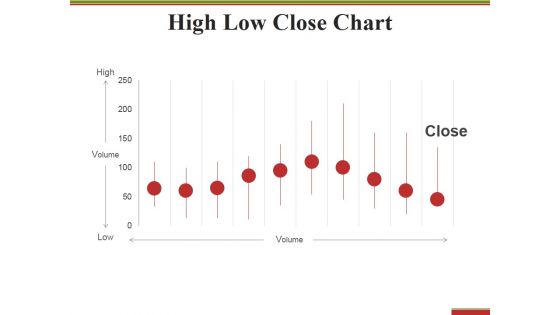
High Low Close Chart Ppt PowerPoint Presentation Styles Display
This is a high low close chart ppt powerpoint presentation styles display. This is a ten stage process. The stages in this process are high, volume, low, close, finance.
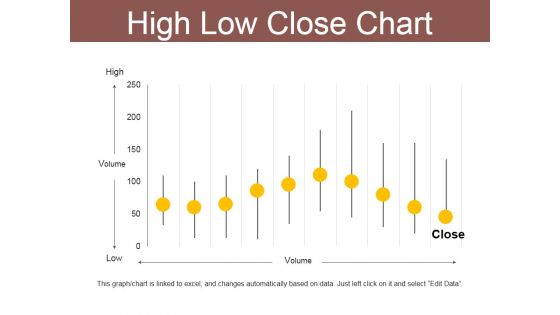
High Low Close Chart Ppt PowerPoint Presentation Show Ideas
This is a high low close chart ppt powerpoint presentation show ideas. This is a ten stage process. The stages in this process are high, volume, low, close, finance.
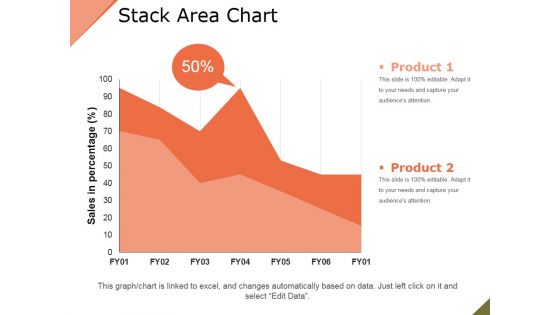
Stack Area Chart Ppt PowerPoint Presentation Example File
This is a stack area chart ppt powerpoint presentation example file. This is a two stage process. The stages in this process are product, sales in percentage, percentage, finance.
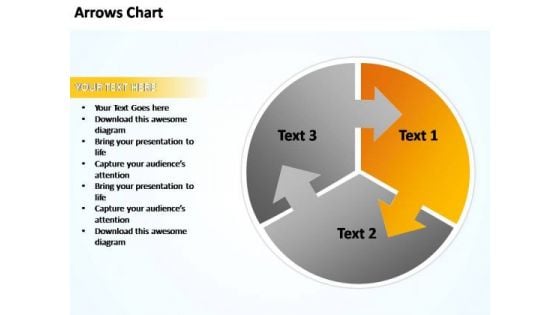
PowerPoint Templates Business Circular Plan With Arrows Chart Ppt Theme
PowerPoint Templates Business Circular Plan With Arrows Chart PPT Theme-Explore the various directions and layers existing in your in your plans and processes. Unravel the desired and essential elements of your overall strategy. Explain the relevance of the different layers and stages and directions in getting down to your core competence, ability and desired result. Cheer to success with our PowerPoint Templates Business Circular Plan With Arrows Chart Ppt Theme. You will come out on top.
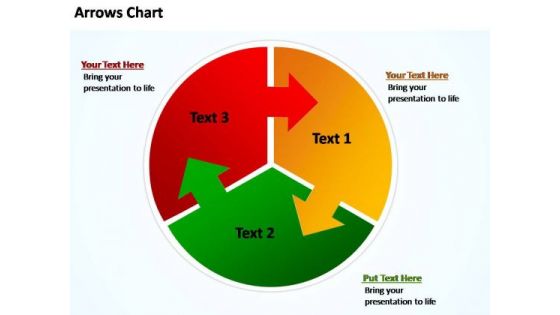
PowerPoint Templates Business Circular Plan With Arrows Chart Ppt Themes
PowerPoint Templates Business Circular Plan With Arrows Chart PPT Themes-Explore the various directions and layers existing in your in your plans and processes. Unravel the desired and essential elements of your overall strategy. Explain the relevance of the different layers and stages and directions in getting down to your core competence, ability and desired result. Our PowerPoint Templates Business Circular Plan With Arrows Chart Ppt Themes are colorful compositions. Their array of colors will catch the eye.
Project Charter Linear Chart With Icons Powerpoint Slide Background
This is a project charter linear chart with icons powerpoint slide background. This is a five stage process. The stages in this process are resources team roles, project milestone, project scope, problem statement goal statement, business case.
Project Management Gantt Chart Ppt PowerPoint Presentation Icon Example
This is a project management gantt chart ppt powerpoint presentation icon example. This is a ten stage process. The stages in this process are lists, table, data, management, marketing.
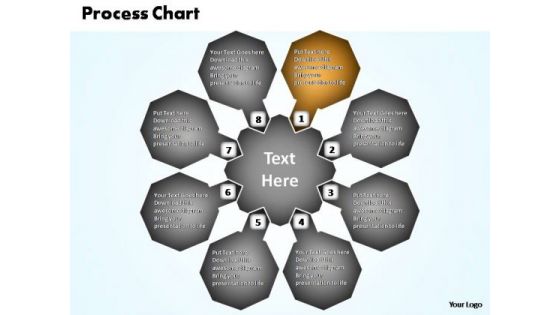
PowerPoint Theme Graphic Business Process Chart Ppt Backgrounds
This easy to use diagrams can be used for information flow, business process automation, business process re-engineering. Take it up as an escapade. Our PowerPoint Theme Graphic Business Process Chart Ppt Backgrounds will give you belief.
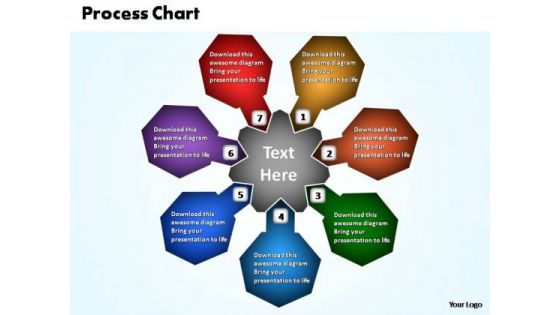
PowerPoint Theme Growth Business Process Chart Ppt Design
This easy to use diagrams can be used for information flow, business process automation, business process re-engineering. Resolve the feud with our PowerPoint Theme Growth Business Process Chart Ppt Design. Take all different approaches into consideration.
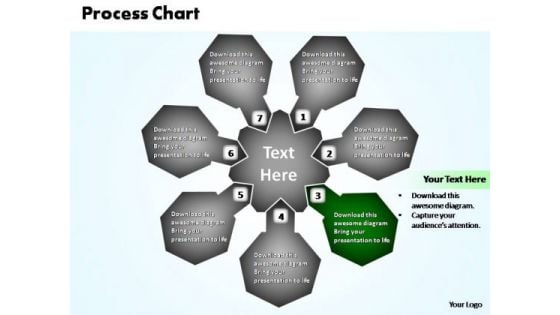
PowerPoint Theme Growth Business Process Chart Ppt Process
This easy to use diagrams can be used for information flow, business process automation, business process re-engineering. Fade in our PowerPoint Theme Growth Business Process Chart Ppt Process with your thoughts. Your ideas will sound even better.
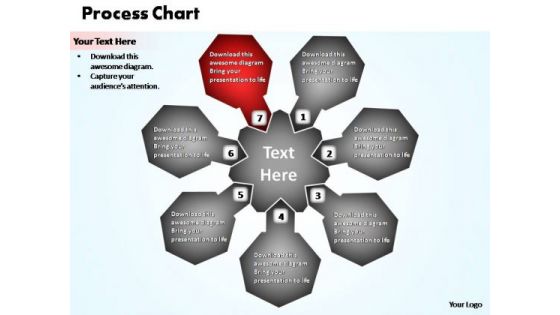
PowerPoint Theme Sales Business Process Chart Ppt Process
This easy to use diagrams can be used for information flow, business process automation, business process re-engineering. Burst through the ceiling with our PowerPoint Theme Sales Business Process Chart Ppt Process. Rise strongly above created barriers.
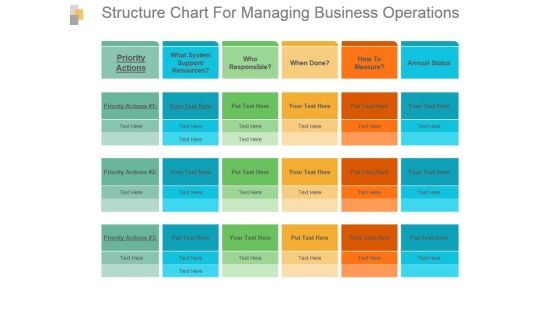
Structure Chart For Managing Business Operations Ppt Slide
This is a structure chart for managing business operations ppt slide. This is a six stage process. The stages in this process are priority actions, what system support resources, who responsible, when done, how to measure, annual status.
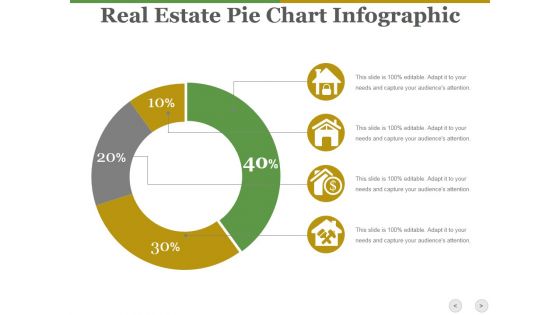
Real Estate Pie Chart Infographic Ppt PowerPoint Presentation Show Diagrams
This is a real estate pie chart infographic ppt powerpoint presentation show diagrams. This is a four stage process. The stages in this process are business, icons, marketing, strategy, process.
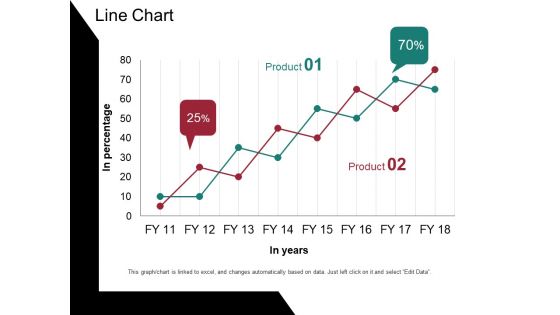
Line Chart Ppt PowerPoint Presentation Portfolio Design Templates
This is a line chart ppt powerpoint presentation portfolio design templates. This is a two stage process. The stages in this process are in percentage, in years, percentage, business, graph.
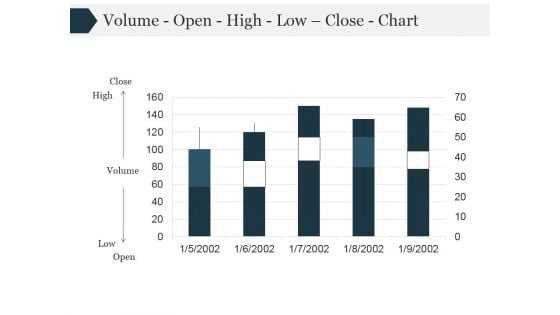
Volume Open High Low Close Chart Ppt PowerPoint Presentation Themes
This is a volume open high low close chart ppt powerpoint presentation themes. This is a five stage process. The stages in this process are high, volume, close, low.
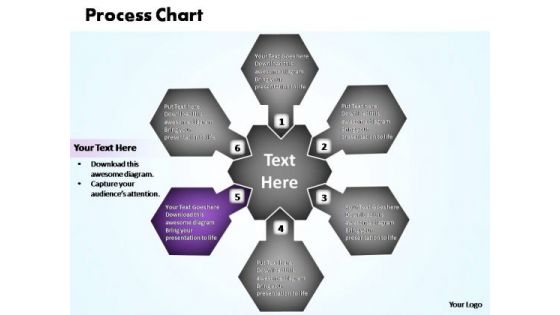
PowerPoint Slide Diagram Business Process Chart Ppt Process
This easy to use diagrams can be used for information flow, business process automation, business process re-engineering. Feather your nest with our PowerPoint Slide Diagram Business Process Chart Ppt Process. Your thoughts will evolve in a comfortable climate.
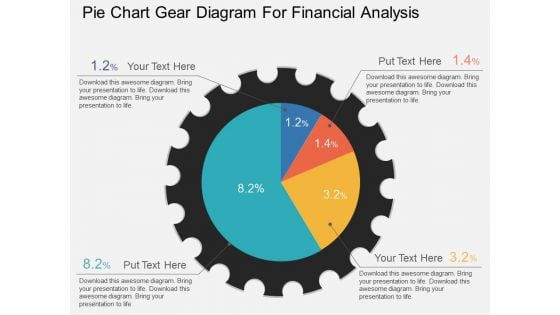
Pie Chart Gear Diagram For Financial Analysis Powerpoint Template
This PowerPoint template has been designed with graphic of pie chart gear diagram. This PPT slide can be used to display financial analysis. Download this PPT diagram slide to make your presentations more effective.
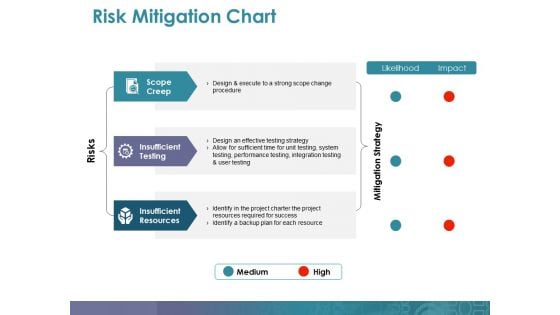
Risk Mitigation Chart Ppt PowerPoint Presentation Professional Guidelines
This is a risk mitigation chart ppt powerpoint presentation professional guidelines. This is a three stage process. The stages in this process are scope creep, insufficient testing, insufficient resources, mitigation strategy, risks.
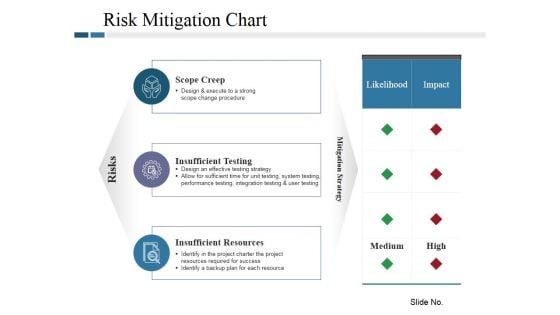
Risk Mitigation Chart Ppt PowerPoint Presentation Model Tips
This is a risk mitigation chart ppt powerpoint presentation model tips. This is a three stage process. The stages in this process are scope creep, insufficient testing, insufficient resources, risks, likelihood.
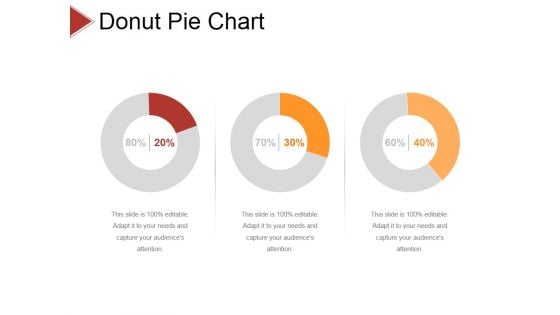
Donut Pie Chart Ppt PowerPoint Presentation Infographic Template Diagrams
This is a donut pie chart ppt powerpoint presentation infographic template diagrams. This is a three stage process. The stages in this process are business, strategy, analysis, pretention, comparison.
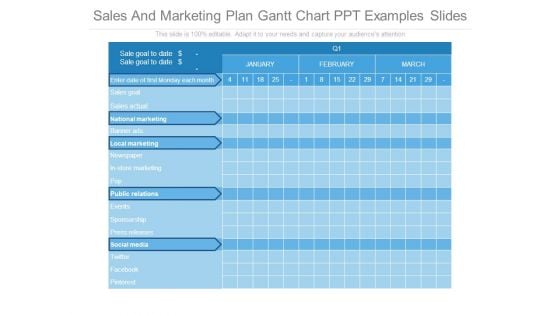
Sales And Marketing Plan Gantt Chart Ppt Examples Slides
This is a sales and marketing plan gantt chart ppt examples slides. This is a three stage process. The stages in this process are sales goal, sales actual, banner ads, newspaper, in store marketing.
Pie Chart With Seven Business Icons Powerpoint Templates
Our compelling template consists with a design of pie chart with seven business icons. This slide has been professionally designed to exhibit financial ratio analysis. This template offers an excellent background to build impressive presentation.
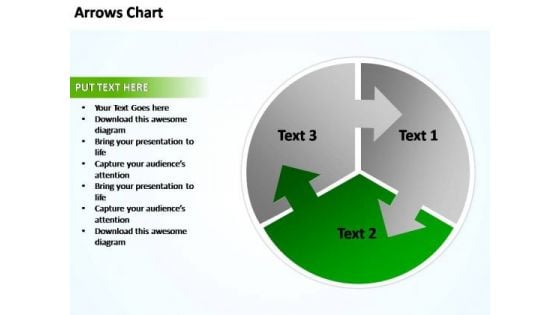
PowerPoint Templates Business Circular Plan With Arrows Chart Ppt Designs
PowerPoint Templates Business Circular Plan With Arrows Chart PPT Designs-Explore the various directions and layers existing in your in your plans and processes. Unravel the desired and essential elements of your overall strategy. Explain the relevance of the different layers and stages and directions in getting down to your core competence, ability and desired result. Exert influence with our PowerPoint Templates Business Circular Plan With Arrows Chart Ppt Designs. Get opinions going for you.
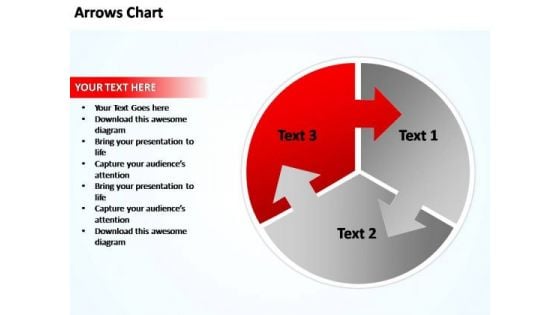
PowerPoint Templates Business Circular Plan With Arrows Chart Ppt Slides
PowerPoint Templates Business Circular Plan With Arrows Chart PPT Slides-Explore the various directions and layers existing in your in your plans and processes. Unravel the desired and essential elements of your overall strategy. Explain the relevance of the different layers and stages and directions in getting down to your core competence, ability and desired result. Compose your song with our PowerPoint Templates Business Circular Plan With Arrows Chart Ppt Slides. You will come out on top.
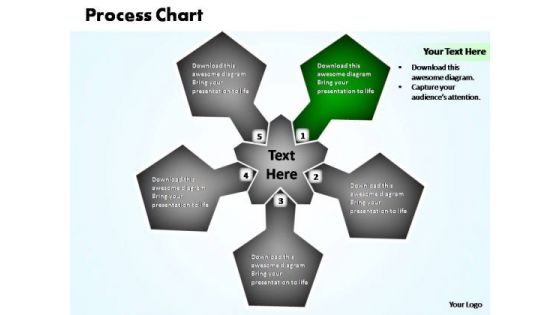
PowerPoint Templates Graphic Business Process Chart Ppt Slides
This easy to use diagrams can be used for information flow, business process automation, business process re-engineering. Audit your thoughts with our PowerPoint Templates Graphic Business Process Chart Ppt Slides. They will authenticate their excellence.
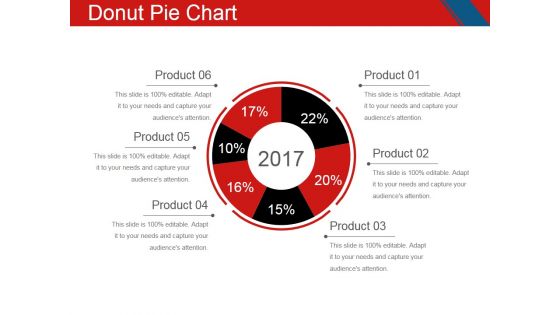
Donut Pie Chart Ppt PowerPoint Presentation Infographic Template Sample
This is a donut pie chart ppt powerpoint presentation infographic template sample. This is a six stage process. The stages in this process are business, pie, process, planning, strategy.
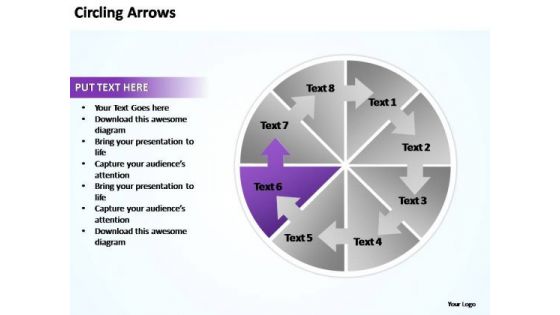
PowerPoint Templates Circling Arrows Flow Chart Ppt Design Slides
PowerPoint Templates Circling Arrows Flow Chart PPT Design Slides-Explore the various directions and layers existing in your in your plans and processes. Unravel the desired and essential elements of your overall strategy. Explain the relevance of the different layers and stages and directions in getting down to your core competence, ability and desired result. Our PowerPoint Templates Circling Arrows Flow Chart Ppt Design Slides give expression to your drive. They emit the essence of your determination.
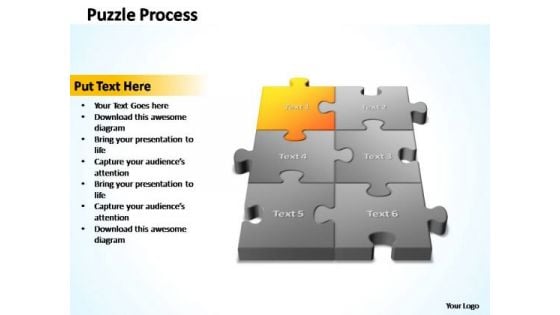
PowerPoint Template Chart 3d Puzzle Process Ppt Slides
This compelling graphics can be used showing relations and interfaces among various marketing activities. Bridge gaps with our PowerPoint Template Chart 3d Puzzle Process Ppt Slides. Just download, type and present.
Business Strategy Innovation 3d Presentations Of Bar Chart Character Modeling
Your Thoughts Will Be The Main Course. Provide The Dressing With Our business strategy innovation 3d presentations of bar chart character modeling Powerpoint Templates. Dress Up Your Views With Our Marketing Powerpoint Templates. Deliver Your Ideas With Aplomb.


 Continue with Email

 Home
Home


