Cost Chart
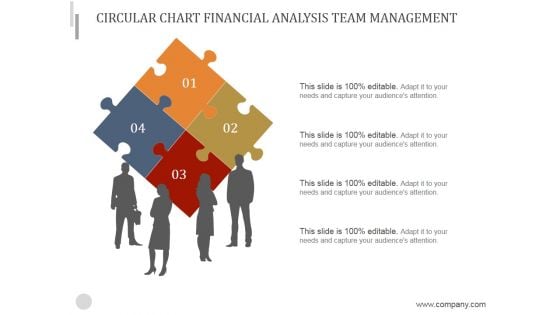
Circular Chart Financial Analysis Team Management Ppt PowerPoint Presentation Guide
This is a circular chart financial analysis team management ppt powerpoint presentation guide. This is a four stage process. The stages in this process are puzzle, teamwork, business, marketing, analysis.
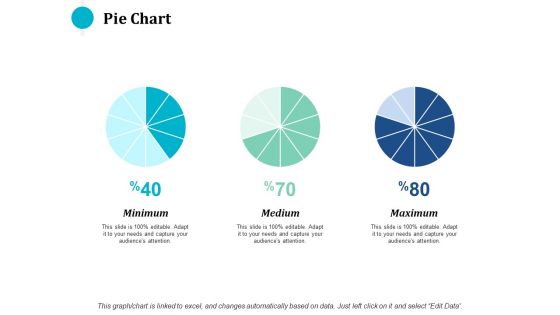
Pie Chart Finance Ppt PowerPoint Presentation Styles Graphics Template
This is a pie chart finance ppt powerpoint presentation styles graphics template. This is a three stage process. The stages in this process are financial, minimum, medium, maximum, marketing.
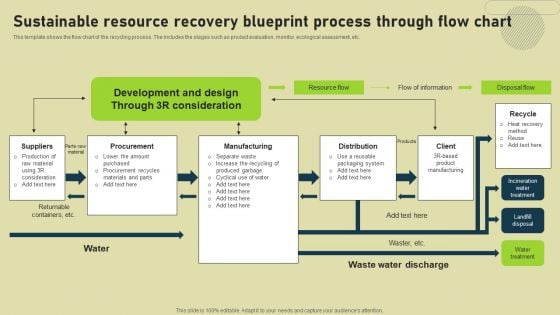
Sustainable Resource Recovery Blueprint Process Through Flow Chart Inspiration PDF
This template shows the flow chart of the recycling process. The includes the stages such as product evaluation, monitor, ecological assessment, etc. Pitch your topic with ease and precision using this Sustainable Resource Recovery Blueprint Process Through Flow Chart Inspiration PDF. This layout presents information on Procurement, Manufacturing, Suppliers. It is also available for immediate download and adjustment. So, changes can be made in the color, design, graphics or any other component to create a unique layout.
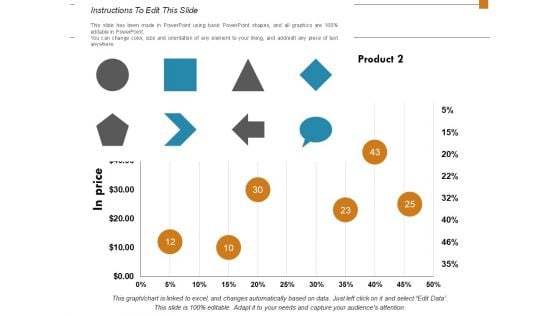
Scatter Bubble Chart Finance Ppt Powerpoint Presentation Layouts Summary
This is a scatter bubble chart finance ppt powerpoint presentation layouts summary. This is a two stage process. The stages in this process are financial, minimum, maximum, marketing, strategy.
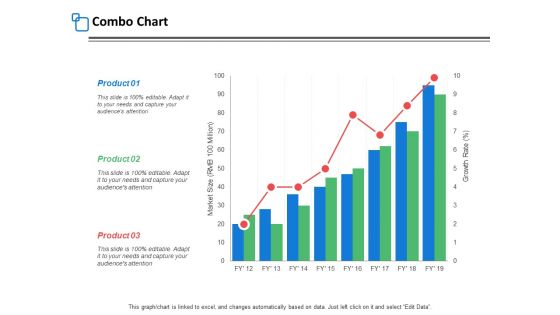
Combo Chart Finance Ppt PowerPoint Presentation Styles Background Image
This is a combo chart finance ppt powerpoint presentation styles background image. The topics discussed in this diagram are marketing, business, management, planning, strategy This is a completely editable PowerPoint presentation, and is available for immediate download
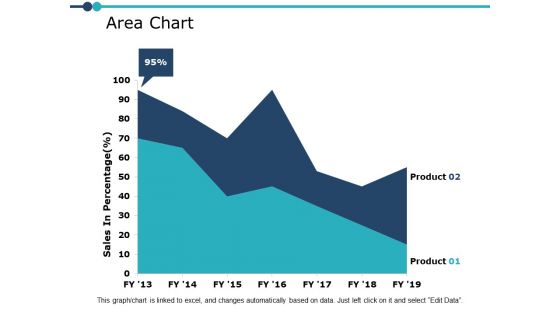
Area Chart Finance Ppt PowerPoint Presentation File Slide
This is a area chart finance ppt powerpoint presentation file slide. The topics discussed in this diagram are marketing, business, management, planning, strategy This is a completely editable PowerPoint presentation, and is available for immediate download.
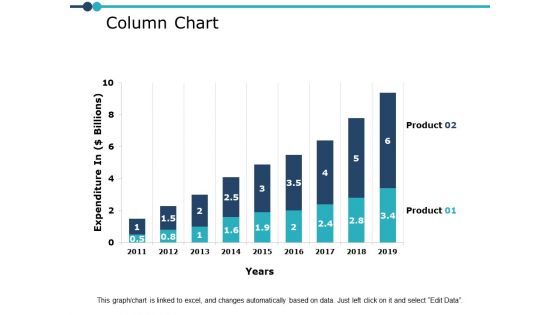
Column Chart Finance Ppt PowerPoint Presentation Show Background
This is a column chart finance ppt powerpoint presentation show background. The topics discussed in this diagram are marketing, business, management, planning, strategy This is a completely editable PowerPoint presentation, and is available for immediate download.
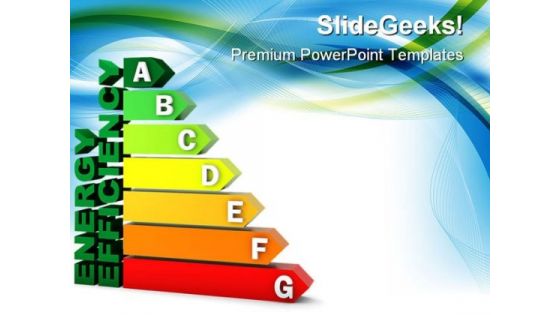
Energy Efficiency Chart Geographical PowerPoint Templates And PowerPoint Backgrounds 0311
Microsoft PowerPoint Template and Background with energy efficiency rating certification system Change is a constant in corporate life. Detect the correct co-efficient with our Energy Efficiency Chart Geographical PowerPoint Templates And PowerPoint Backgrounds 0311.

Project Management Gantt Chart Finance Ppt PowerPoint Presentation Pictures Vector
This is a project management gantt chart finance ppt powerpoint presentation pictures vector. This is a four stage process. The stages in this process are compare, marketing, business, management, planning.
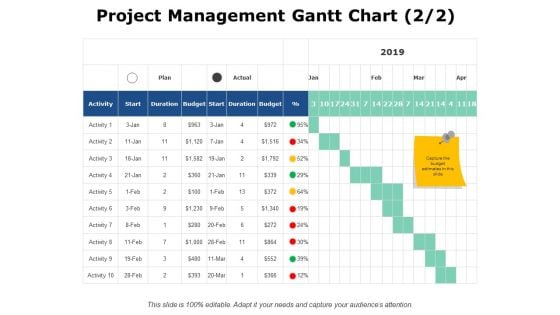
Project Management Gantt Chart Finance Ppt PowerPoint Presentation Infographics Files
This is a project management gantt chart finance ppt powerpoint presentation infographics files. This is a six stage process. The stages in this process are business, planning, strategy, marketing, management.
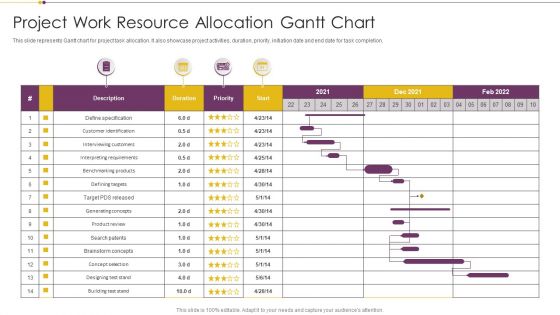
Project Work Resource Allocation Gantt Chart Elements PDF
This slide represents Gantt chart for project task allocation. It also showcase project activities, duration, priority, initiation date and end date for task completion. Showcasing this set of slides titled Project Work Resource Allocation Gantt Chart Elements PDF. The topics addressed in these templates are Interpreting Requirements, Benchmarking Products, Customer Identification. All the content presented in this PPT design is completely editable. Download it and make adjustments in color, background, font etc. as per your unique business setting.
Combo Chart Marketing Analysis Ppt Powerpoint Presentation Pictures Icons
This is a combo chart marketing analysis ppt powerpoint presentation pictures icons. This is a three stage process. The stages in this process are finance, marketing, management, investment, analysis.
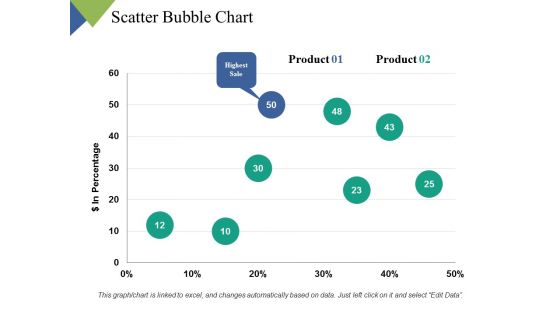
Scatter Bubble Chart Ppt PowerPoint Presentation Inspiration Graphics Tutorials
This is a scatter bubble chart ppt powerpoint presentation inspiration graphics tutorials. This is a two stage process. The stages in this process are finance, marketing, management, investment, analysis.
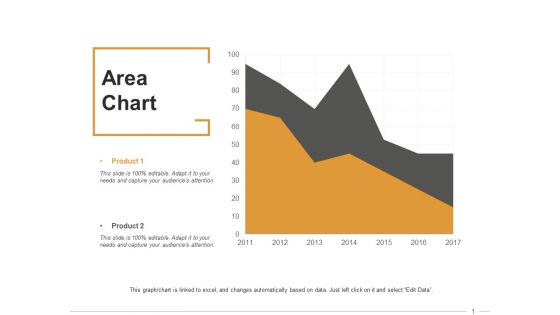
Area Chart Ppt PowerPoint Presentation Infographic Template Clipart Images
This is a area chart ppt powerpoint presentation infographic template clipart images. This is a two stage process. The stages in this process are finance, marketing, management, investment, analysis.
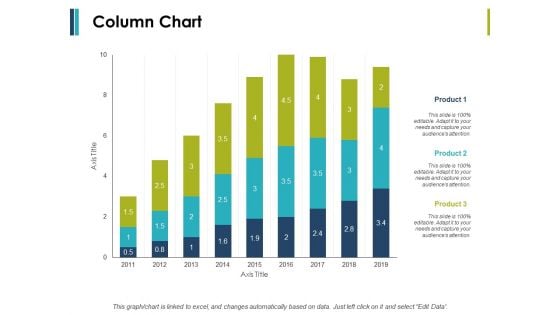
Column Chart And Graph Ppt PowerPoint Presentation File Introduction
This is a column chart and graph ppt powerpoint presentation file introduction. This is a three stage process. The stages in this process are finance, marketing, management, investment, analysis.
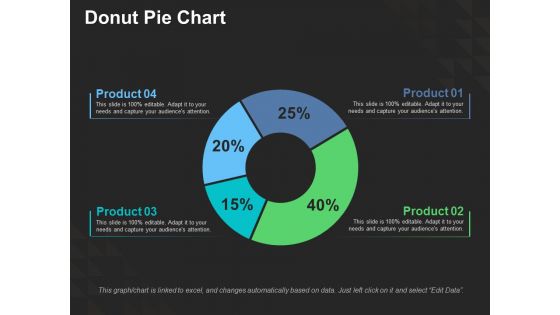
Donut Pie Chart Ppt PowerPoint Presentation Ideas Design Templates
This is a donut pie chart ppt powerpoint presentation ideas design templates. This is a four stage process. The stages in this process are analysis finance, investment, business, planning, marketing.
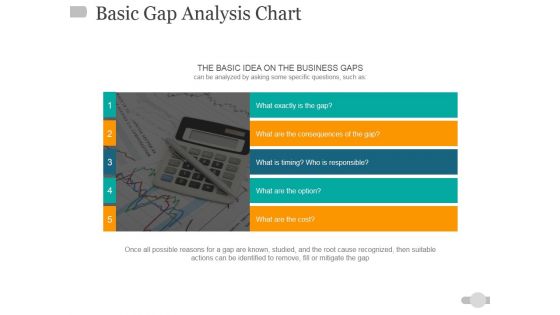
Basic Gap Analysis Chart Ppt PowerPoint Presentation Pictures Design Ideas
This is a basic gap analysis chart ppt powerpoint presentation pictures design ideas. This is a five stage process. The stages in this process are business, finance, marketing, analysis, investment.
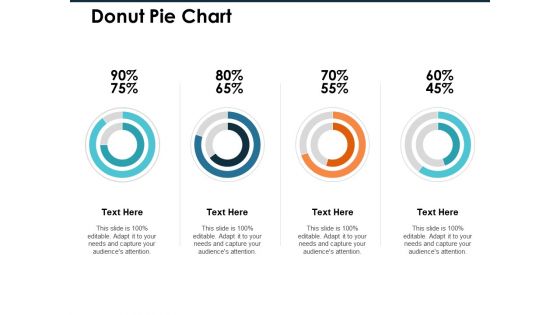
Donut Pie Chart Ppt PowerPoint Presentation Infographic Template Professional
This is a donut pie chart ppt powerpoint presentation infographic template professional. This is a four stage process. The stages in this process are finance, marketing, management, investment, analysis.
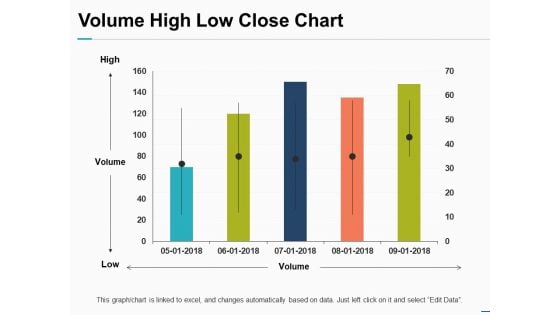
Volume High Low Close Chart Ppt PowerPoint Presentation Pictures Objects
This is a volume high low close chart ppt powerpoint presentation pictures objects. This is a one stage process. The stages in this process are finance, marketing, management, investment, analysis.
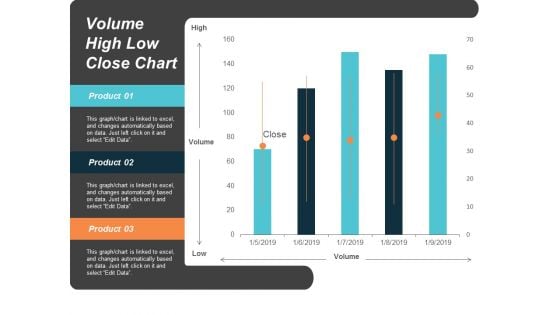
Volume High Low Close Chart Ppt Powerpoint Presentation Slides Images
This is a volume high low close chart ppt powerpoint presentation slides images. This is a five stage process. The stages in this process are finance, marketing, management, investment, analysis.
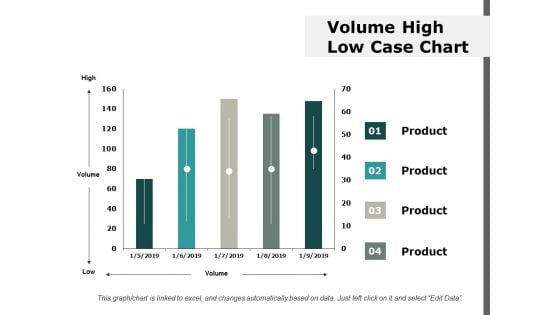
Volume High Low Case Chart Ppt Powerpoint Presentation Ideas Information
This is a volume high low case chart ppt powerpoint presentation ideas information. This is a four stage process. The stages in this process are finance, marketing, management, investment, analysis.
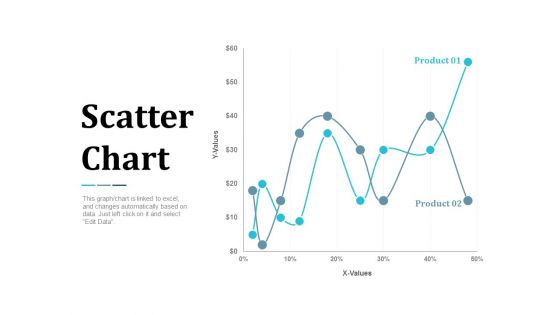
Scatter Chart Analysis Marketing Ppt Powerpoint Presentation Summary Infographic Template
This is a scatter chart analysis marketing ppt powerpoint presentation summary infographic template. This is a two stage process. The stages in this process are finance, marketing, management, investment, analysis.
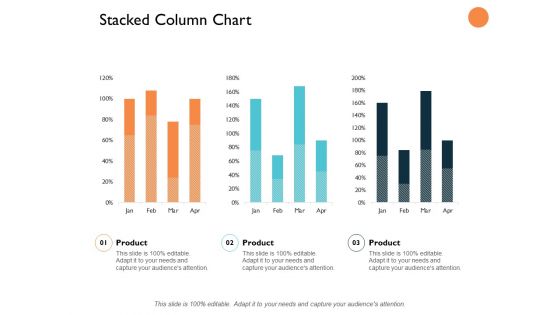
Stacked Column Chart Analysis Ppt PowerPoint Presentation Slides Graphics Design
This is a stacked column chart analysis ppt powerpoint presentation slides graphics design. This is a three stage process. The stages in this process are finance, marketing, management, investment, analysis.
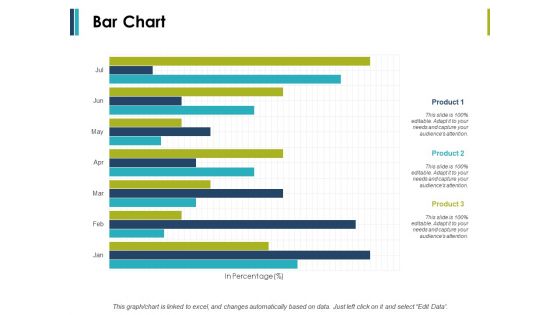
Bar Chart Business Management Ppt PowerPoint Presentation Ideas Example Introduction
This is a bar chart business management ppt powerpoint presentation ideas example introduction. This is a three stage process. The stages in this process are finance, marketing, management, investment, analysis.
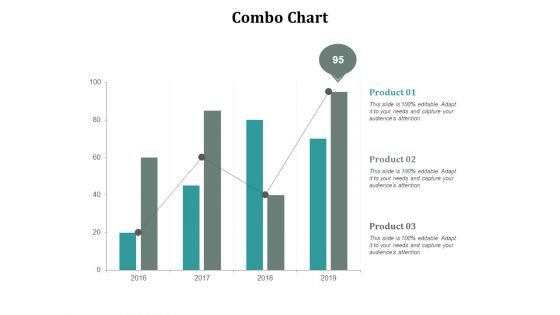
Combo Chart Marketing Ppt Powerpoint Presentation Ideas Format Ideas Cpb
This is a combo chart marketing ppt powerpoint presentation ideas format ideas cpb. This is a three stage process. The stages in this process are finance, marketing, management, investment, analysis.

Hierarchy Chart Sample Templates Ppt PowerPoint Presentation Background Designs
This is a hierarchy chart sample templates ppt powerpoint presentation background designs. This is a two stage process. The stages in this process are business, marketing, management, communication, planning.
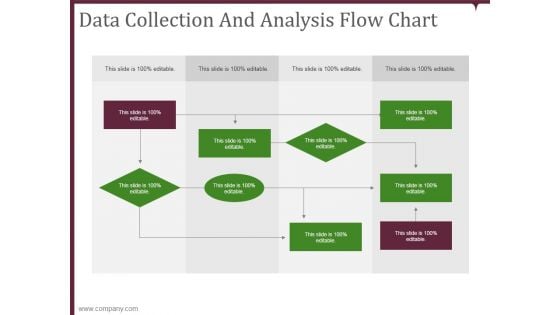
data collection and analysis flow chart ppt powerpoint presentation microsoft
This is a data collection and analysis flow chart ppt powerpoint presentation microsoft. This is a nine stage process. The stages in this process are business, planning, marketing, strategy, management.
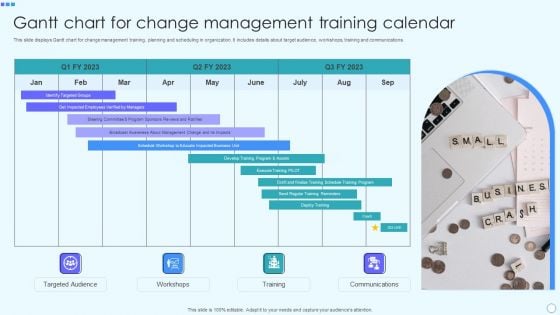
Gantt Chart For Change Management Training Calendar Diagrams PDF
This slide displays Gantt chart for change management training, planning and scheduling in organization. It includes details about target audience, workshops, training and communications. Presenting Gantt Chart For Change Management Training Calendar Diagrams PDF to dispense important information. This template comprises one stages. It also presents valuable insights into the topics including Targeted Audience, Workshops, Training, Communications. This is a completely customizable PowerPoint theme that can be put to use immediately. So, download it and address the topic impactfully.
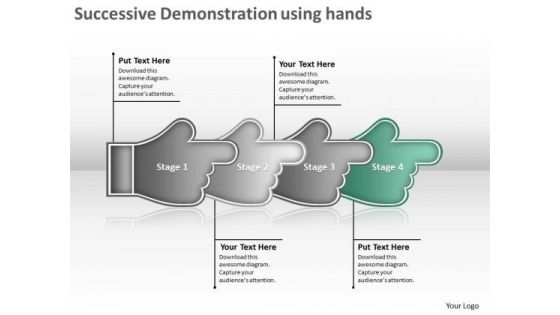
Successive Demonstration Using Hands Flow Chart Creator PowerPoint Templates
We present our successive demonstration using hands flow chart creator PowerPoint templates. Use our Symbol PowerPoint Templates because, are the tools that helped most of us evolve. Use our Business PowerPoint Templates because, Marketing Strategy Business Template:- Maximizing sales of your product is the intended destination. Use our Metaphor PowerPoint Templates because, Profit fairly earned is what you believe in. Use our Abstract PowerPoint Templates because, Forward thinking is the way to go. Use our Process and Flows PowerPoint Templates because, Original thinking is the need of the hour. Use these PowerPoint slides for presentations relating to Description using hands steps, Business, Collection, Connection, Cursor, Decoration, Design, Dimensional, Direction, Element, Icon, Illustration, Information, Modern, Motion, Paper, Perspective, Plastic, Pointer, Pointing, Process, Recycle, Recycling, Reflective, Set, Shape, Shiny, Sign, Symbol, Technology. The prominent colors used in the PowerPoint template are Green, Gray, and Black Drive your organization with our Successive Demonstration Using Hands Flow Chart Creator PowerPoint Templates. Download without worries with our money back guaranteee.
Pie Chart Icon For Yearly Earning Breakup Portrait PDF
Persuade your audience using this Pie Chart Icon For Yearly Earning Breakup Portrait PDF. This PPT design covers Three stages, thus making it a great tool to use. It also caters to a variety of topics including Pie Chart Icon, Yearly Earning Breakup. Download this PPT design now to present a convincing pitch that not only emphasizes the topic but also showcases your presentation skills.
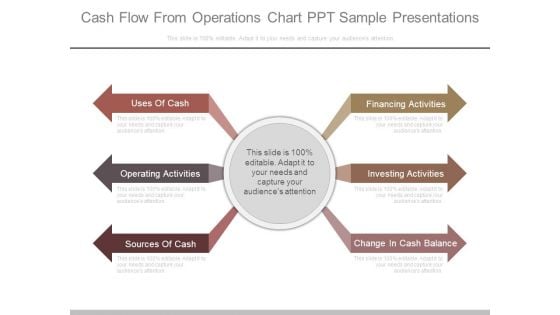
Cash Flow From Operations Chart Ppt Sample Presentations
This is a cash flow from operations chart ppt sample presentations. This is a six stage process. The stages in this process are uses of cash, operating activities, sources of cash, financing activities, investing activities, change in cash balance.

Donut Pie Chart Graph Ppt PowerPoint Presentation File Styles
This is a donut pie chart graph ppt powerpoint presentation file styles. This is a three stage process. The stages in this process are finance, marketing, management, investment, analysis.
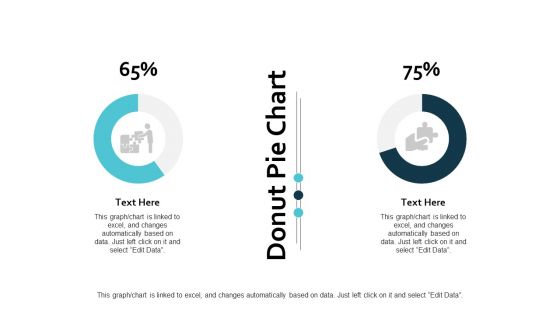
Donut Pie Chart Graph Ppt PowerPoint Presentation Ideas Guidelines
This is a donut pie chart graph ppt powerpoint presentation ideas guidelines. This is a three stage process. The stages in this process are finance, marketing, management, investment, analysis.
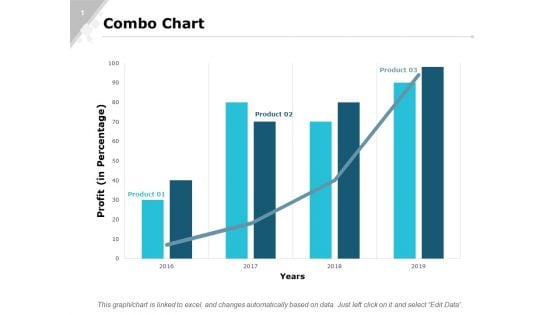
Combo Chart Graph Ppt PowerPoint Presentation Gallery Designs Download
This is a combo chart graph ppt powerpoint presentation gallery designs download. This is a three stage process. The stages in this process are finance, marketing, analysis, investment, million.
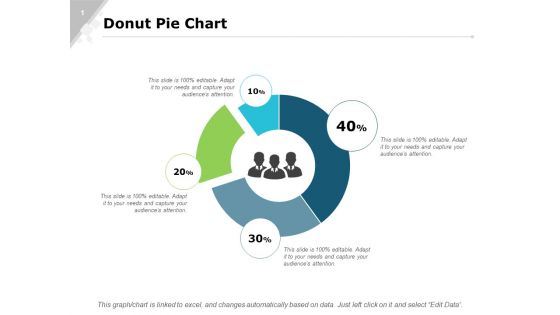
Donut Pie Chart Bar Ppt PowerPoint Presentation Infographics Slide Portrait
This is a donut pie chart bar ppt powerpoint presentation infographics slide portrait. This is a four stage process. The stages in this process are finance, marketing, analysis, investment, million.
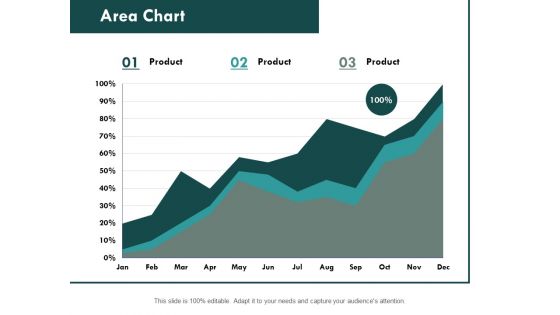
Area Chart Graph Ppt PowerPoint Presentation Professional Format Ideas
This is a column chart graph ppt powerpoint presentation slides file formats. This is a stage three process. The stages in this process are finance, marketing, analysis, investment, million.
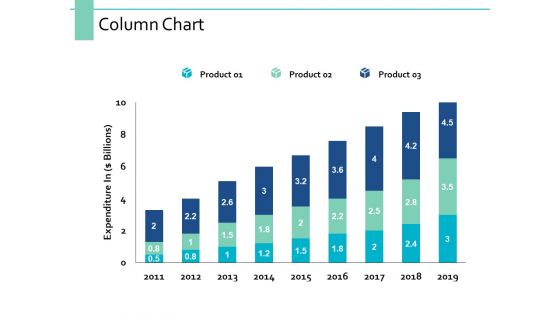
Column Chart Marketing Management Ppt PowerPoint Presentation Professional Images
This is a column chart marketing management ppt powerpoint presentation professional images. This is a three stage process. The stages in this process are finance, marketing, management, investment, analysis.
Mutual Fund Operation Flow Chart Diagram Ppt Icon
This is a mutual fund operation flow chart diagram ppt icon. This is a four stage process. The stages in this process are return, securities, investors, fund, mutual fund operation.
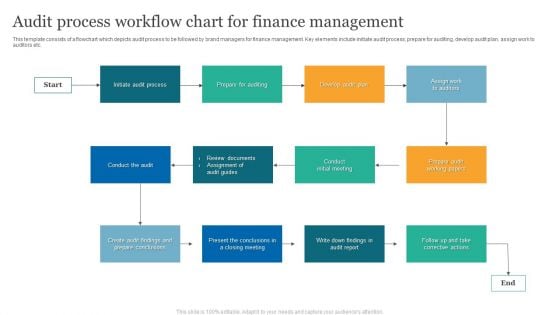
Audit Process Workflow Chart For Finance Management Summary PDF
This template consists of a flowchart which depicts audit process to be followed by brand managers for finance management. Key elements include initiate audit process, prepare for auditing, develop audit plan, assign work to auditors etc.
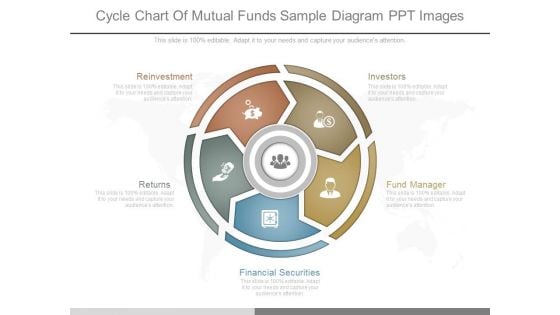
Cycle Chart Of Mutual Funds Sample Diagram Ppt Images
This is a cycle chart of mutual funds sample diagram ppt images. This is a five stage process. The stages in this process are reinvestment, returns, investors, fund manager, financial securities.
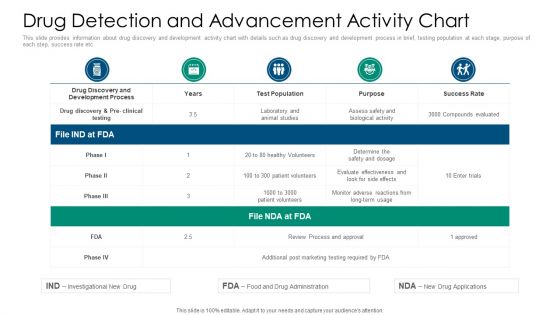
Drug Detection And Advancement Activity Chart Brochure PDF
This slide provides information about drug discovery and development activity chart with details such as drug discovery and development process in brief, testing population at each stage, purpose of each step, success rate etc. Deliver an awe inspiring pitch with this creative drug detection and advancement activity chart brochure pdf bundle. Topics like process, development, success rate, patient volunteers can be discussed with this completely editable template. It is available for immediate download depending on the needs and requirements of the user.
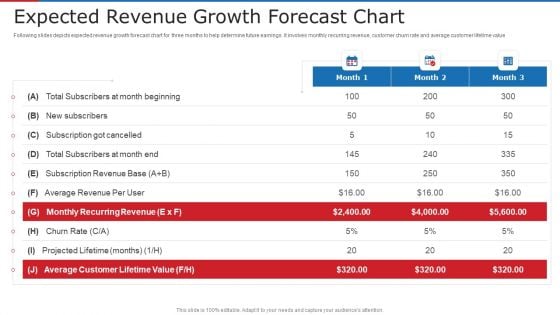
Expected Revenue Growth Forecast Chart Ppt Professional Graphics Tutorials PDF
Following slides depicts expected revenue growth forecast chart for three months to help determine future earnings. It involves monthly recurring revenue, customer churn rate and average customer lifetime value Deliver an awe inspiring pitch with this creative expected revenue growth forecast chart ppt professional graphics tutorials pdf bundle. Topics like average, revenue, rate can be discussed with this completely editable template. It is available for immediate download depending on the needs and requirements of the user.
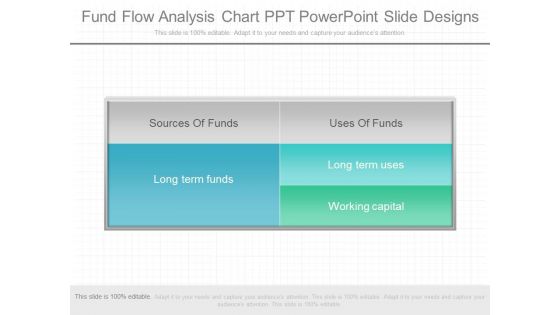
Fund Flow Analysis Chart Ppt Powerpoint Slide Designs
This is a fund flow analysis chart ppt powerpoint slide designs. This is a five stage process. The stages in this process are sources of funds, long term funds, uses of funds, long term uses, working capital.
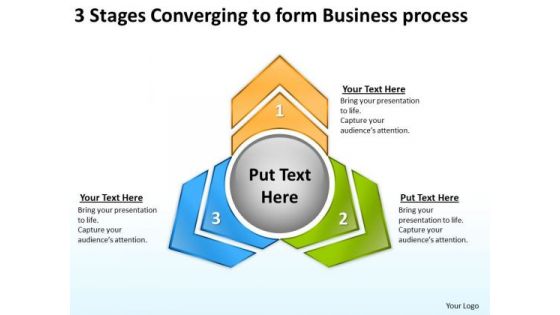
Business PowerPoint Templates Download Process Arrows Chart Software
We present our business powerpoint templates download process Arrows Chart Software.Present our Arrows PowerPoint Templates because you are buzzing with ideas. Use our Marketing PowerPoint Templates because you have analysed the illness and know the need. Download and present our Shapes PowerPoint Templates because you have the product you are very confident of and are very sure it will prove immensely popular with clients all over your target areas. Use our Success PowerPoint Templates because your quest has taken you well onto the path of success. Present our Competition PowerPoint Templates because you should Emphasise the process of your business or corporate growth.Use these PowerPoint slides for presentations relating to 3d, 4, aim, aimed, aiming, arrow, background, bullseye, business, climax, compete, competition, competitors, concept, conceptual, converge, converging, different, direction, eye, forces, four, game, goal, icon, illustration, marketing, opponents, point, reach, succeed, success, symbol, target, team, teamwork, tie, win, winner. The prominent colors used in the PowerPoint template are Blue, Yellow, Green. Customers tell us our business powerpoint templates download process Arrows Chart Software are Fun. PowerPoint presentation experts tell us our business PowerPoint templates and PPT Slides are Tasteful. People tell us our business powerpoint templates download process Arrows Chart Software are Precious. People tell us our background PowerPoint templates and PPT Slides help you meet deadlines which are an element of today's workplace. Just browse and pick the slides that appeal to your intuitive senses. Customers tell us our business powerpoint templates download process Arrows Chart Software are Bright. People tell us our background PowerPoint templates and PPT Slides are Appealing. Feel the ' chi ' with our Business PowerPoint Templates Download Process Arrows Chart Software. Your inner energies will be on the rise.
Financial Arrows Chart Business PowerPoint Backgrounds And Templates 1210
Microsoft PowerPoint Template and Background with fine image 3d of financial business graph Decrease wastage with our Financial Arrows Chart Business PowerPoint Backgrounds And Templates 1210. Download without worries with our money back guaranteee.
Blue Arrow Chart Symbol PowerPoint Themes And PowerPoint Slides 0511
Microsoft PowerPoint Slide and Theme with blue up arrows Mentor teams with our Blue Arrow Chart Symbol PowerPoint Themes And PowerPoint Slides 0511. Download without worries with our money back guaranteee.
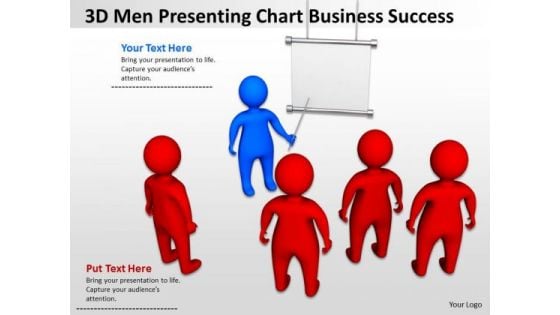
Business Organizational Chart Examples 3d Men Pressenting Success PowerPoint Slides
We present our business organizational chart examples 3d men pressenting success PowerPoint Slides.Present our Communication PowerPoint Templates because Our PowerPoint Templates and Slides ensures Effective communication. They help you put across your views with precision and clarity. Download and present our Business PowerPoint Templates because Our PowerPoint Templates and Slides will let your ideas bloom. Create a bed of roses for your audience. Use our Shapes PowerPoint Templates because Our PowerPoint Templates and Slides will Embellish your thoughts. They will help you illustrate the brilliance of your ideas. Download and present our People PowerPoint Templates because It can Bubble and burst with your ideas. Present our Leadership PowerPoint Templates because Our PowerPoint Templates and Slides will effectively help you save your valuable time. They are readymade to fit into any presentation structure. Use these PowerPoint slides for presentations relating to 3d, Background, Blank, Board, Business, Character, Chart, Communication, Computer, Concept, Consultant, Cooperation, Cute, Dialogue, Discussion, Easel, Empty, Expert, Expertise, Figure, Flipchart, Graphic, Group, Guy, Human, Icon, Idea, Illustration, Leader, Leadership, Manager, Meeting, Men, People, Person, Plan, Pointing, Present, Presentation, Puppet, Speaker, Speech, Teamwork, Whiteboard. The prominent colors used in the PowerPoint template are Red, White, Blue. Presenters tell us our business organizational chart examples 3d men pressenting success PowerPoint Slides are visually appealing. PowerPoint presentation experts tell us our Chart PowerPoint templates and PPT Slides are designed by professionals Professionals tell us our business organizational chart examples 3d men pressenting success PowerPoint Slides will make you look like a winner. People tell us our Chart PowerPoint templates and PPT Slides are designed by a team of presentation professionals. The feedback we get is that our business organizational chart examples 3d men pressenting success PowerPoint Slides are designed by professionals Customers tell us our Chart PowerPoint templates and PPT Slides will get their audience's attention. Correct wrongs with our Business Organizational Chart Examples 3d Men Pressenting Success PowerPoint Slides. Download without worries with our money back guaranteee.
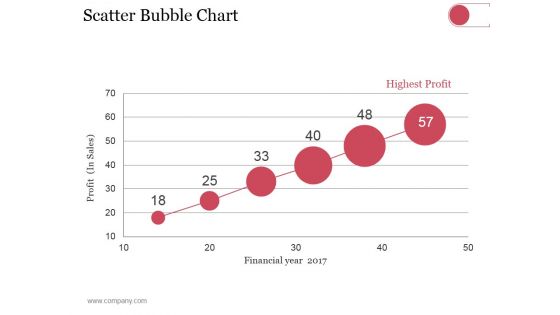
Scatter Bubble Chart Ppt PowerPoint Presentation Summary Pictures
This is a scatter bubble chart ppt powerpoint presentation summary pictures. This is a six stage process. The stages in this process are highest profit, financial year, profit in sales.
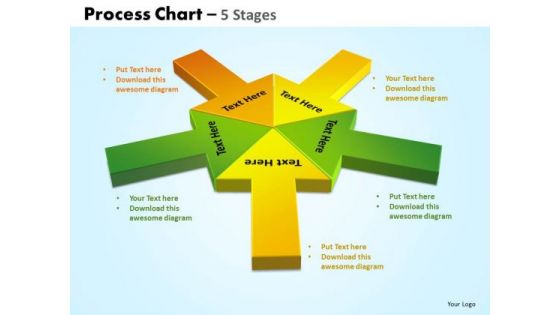
PowerPoint Design Slides Diagram Process Chart Ppt Template
PowerPoint Design Slides Diagram Process Chart PPT Template-The Circle of Life - a concept emmbedded in our minds and hence easy to comprehend. Life and Business is made up of processes comprising stages that flow from one to another. An excellent graphic to attract the attention of and understanding by your audience to improve earnings.-These amazing PowerPoint pre-designed slides and PowerPoint templates have been carefully created by our team of experts to help you impress your audience. Our stunning collection of Powerpoint slides are 100% editable and can easily fit in any PowerPoint presentations. By using these animations and graphics in PowerPoint and you can easily make professional presentations. Any text can be entered at any point in the PowerPoint template or slide. Just DOWNLOAD our awesome PowerPoint templates and you are ready to go. Devise plans with our PowerPoint Design Slides Diagram Process Chart Ppt Template. Download without worries with our money back guaranteee.

Business Chart Success PowerPoint Templates And PowerPoint Backgrounds 0211
Microsoft PowerPoint Template and Background with growing gold graph with a red arrow pointing upward Advise teams with our Business Chart Success PowerPoint Templates And PowerPoint Backgrounds 0211. Download without worries with our money back guaranteee.
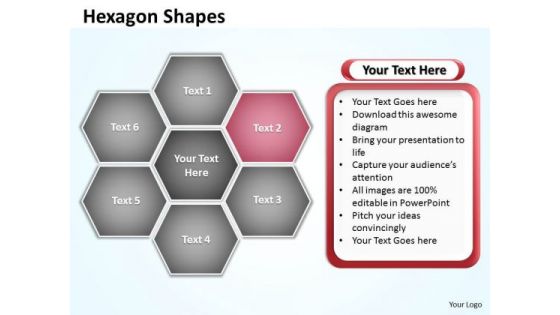
Ppt Hexagon Angles Shaped Chart Editable PowerPoint Templates 2007
PPT hexagon angles shaped chart editable powerpoint templates 2007-Use this Hexagon diagram to explain complex and difficult business strategic planning & staff development. This is an amazing tool to ensure that strategic planning sessions contribute to teambuilding, and are interesting too.-PPT hexagon angles shaped chart editable powerpoint templates 2007-Abstract, Background, Design, Digital, Elements, Graphic, Grey, Hexagon, Illustration, Light, Modern, Perspective, Triangles, Shapes, Shiny, Style, Technology, Template, Vector, Vertical, Virtual, Wallpaper, Web Our Ppt Hexagon Angles Shaped Chart Editable PowerPoint Templates 2007 impress people. With our money back guarantee you have nothing to lose.
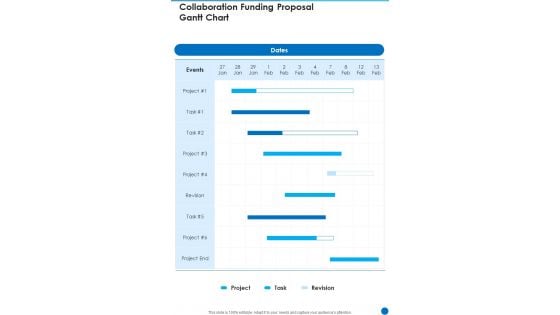
Collaboration Funding Proposal Gantt Chart One Pager Sample Example Document
Presenting you an exemplary Collaboration Funding Proposal Gantt Chart One Pager Sample Example Document. Our one-pager comprises all the must-have essentials of an inclusive document. You can edit it with ease, as its layout is completely editable. With such freedom, you can tweak its design and other elements to your requirements. Download this Collaboration Funding Proposal Gantt Chart One Pager Sample Example Document brilliant piece now.
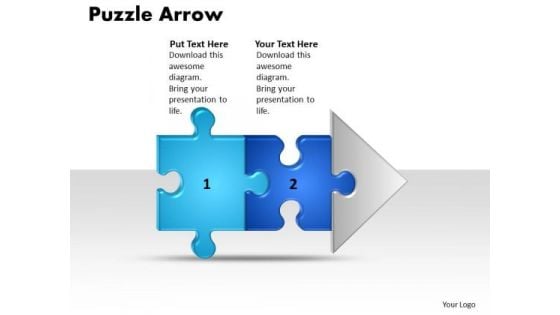
Ppt Linear Work Flow Chart PowerPoint 2 Stages Style1 Templates
PPT linear work flow chart powerpoint 2 stages style1 Templates-This PowerPoint puzzle diagram template is used to show interrelated ideas or concepts. This diagram is useful in just about any type of presentation-PPT linear work flow chart powerpoint 2 stages style1 Templates-Amusement, Arrow, Board, Cardboard, Children, Deficient, Direction, Diversion, Entertainment, Game, Illustration, Image, Jigsaw, Logo, Lots, Many, Paper, Perspective, Pieces, Play, Puzzle, Vector Design goals with our Ppt Linear Work Flow Chart PowerPoint 2 Stages Style1 Templates. Download without worries with our money back guaranteee.
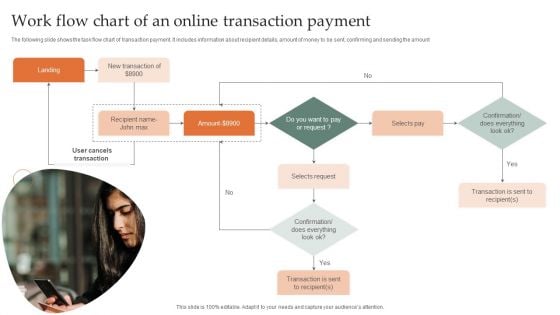
Work Flow Chart Of An Online Transaction Payment Inspiration PDF
The following slide shows the task flow chart of transaction payment. It includes information about recipient details, amount of money to be sent, confirming and sending the amount. Presenting Work Flow Chart Of An Online Transaction Payment Inspiration PDF to dispense important information. This template comprises one stages. It also presents valuable insights into the topics including Work Flow Chart, Online Transaction Payment. This is a completely customizable PowerPoint theme that can be put to use immediately. So, download it and address the topic impactfully.
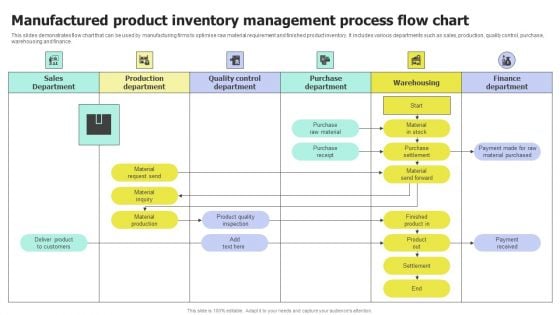
Manufactured Product Inventory Management Process Flow Chart Microsoft PDF
This slide demonstrates flow chart that can be used by manufacturing firms to optimise raw material requirement and finished product inventory. It includes various departments such as sales, production, quality control, purchase, warehousing and finance. Pitch your topic with ease and precision using this Manufactured Product Inventory Management Process Flow Chart Microsoft PDF. This layout presents information on Manufactured Product, Inventory Management, Process Flow Chart. It is also available for immediate download and adjustment. So, changes can be made in the color, design, graphics or any other component to create a unique layout.
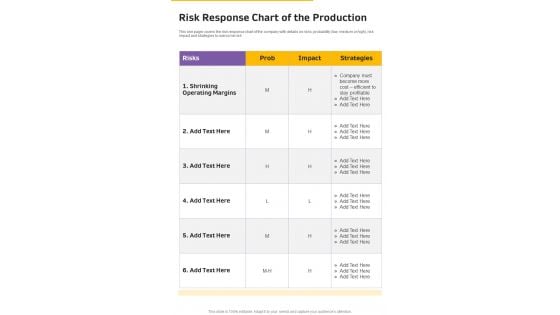
Risk Response Chart Of The Production One Pager Documents
This one pager covers the risk response chart of the company with details on risks, probability low, medium or high, risk impact and strategies to overcome risk. Presenting you a fantastic Risk Response Chart Of The Production One Pager Documents. This piece is crafted on hours of research and professional design efforts to ensure you have the best resource. It is completely editable and its design allow you to rehash its elements to suit your needs. Get this Risk Response Chart Of The Production One Pager Documents A4 One-pager now.

Risk Response Chart Of The Enterprise One Pager Documents
This one pager covers the risk response chart of the company with details on risks, probability low, medium or high, risk impact and strategies to overcome risk. Presenting you a fantastic Risk Response Chart Of The Enterprise One Pager Documents. This piece is crafted on hours of research and professional design efforts to ensure you have the best resource. It is completely editable and its design allow you to rehash its elements to suit your needs. Get this Risk Response Chart Of The Enterprise One Pager Documents A4 One-pager now.
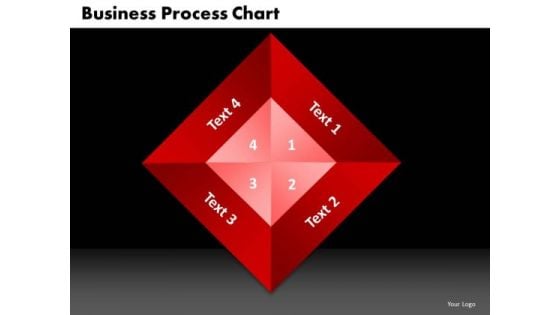
PowerPoint Template Business Process Chart Editable Ppt Design Slides
PowerPoint Template Business Process Chart Editable PPT Design Slides-The Circle of Life - a concept emmbedded in our minds and hence easy to comprehend. Life and Business is made up of processes comprising stages that flow from one to another. An excellent graphic to attract the attention of and understanding by your audience to improve earnings-PowerPoint Template Business Process Chart Editable PPT Design Slides-This ppt can be used for presentations relating to-Arrow, Bond, Business, Button, Buying, Career, Change, Chart, Children, Circle, College, Death, Diagram, Education, Financial, Future, Graphic, House, Illustration, Investing, Investment, Marriage, Menu, Personal, Plan, Process Entertain your audience with our PowerPoint Template Business Process Chart Editable Ppt Design Slides. You will come out on top.
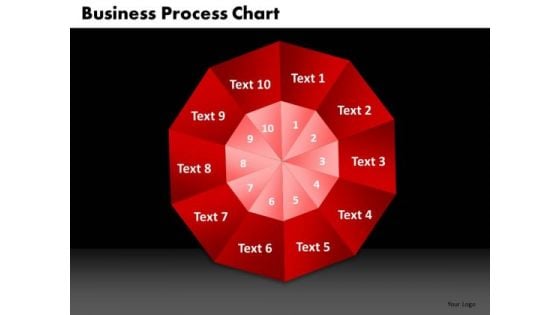
PowerPoint Templates Process Chart Business Ppt Design Slides
PowerPoint Templates Process Chart Business PPT Design Slides-The Circle of Life - a concept emmbedded in our minds and hence easy to comprehend. Life and Business is made up of processes comprising stages that flow from one to another. An excellent graphic to attract the attention of and understanding by your audience to improve earnings-PowerPoint Templates Process Chart Business PPT Design Slides-This ppt can be used for presentations relating to-Arrow, Bond, Business, Button, Buying, Career, Change, Chart, Children, Circle, College, Death, Diagram, Education, Financial, Future, Graphic, House, Illustration, Investing, Investment, Marriage, Menu, Personal, Plan, Process Do not let oppurtunity go abegging. Seize the moment with our PowerPoint Templates Process Chart Business Ppt Design Slides.
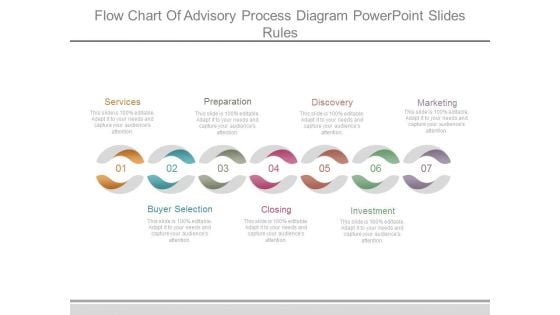
Flow Chart Of Advisory Process Diagram Powerpoint Slides Rules
This is a flow chart of advisory process diagram powerpoint slides rules. This is a seven stage process. The stages in this process are services, buyer selection, preparation, closing, discovery, investment, marketing.


 Continue with Email

 Home
Home


