Dashboard Icon
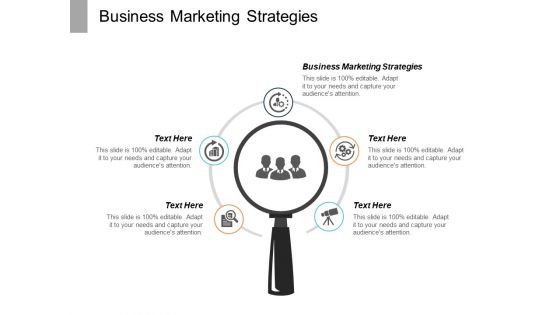
Business Business Marketing Strategies Ppt PowerPoint Presentation Diagram Images Cpb
This is a business business marketing strategies ppt powerpoint presentation diagram images cpb. This is a five stage process. The stages in this process are business business marketing strategies.
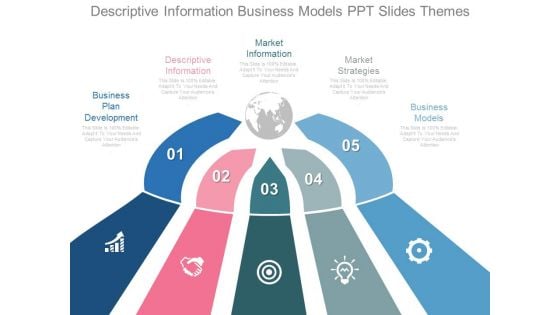
Descriptive Information Business Models Ppt Slides Themes
This is a descriptive information business models ppt slides themes. This is a five stage process. The stages in this process are globe, marketing, geographical.
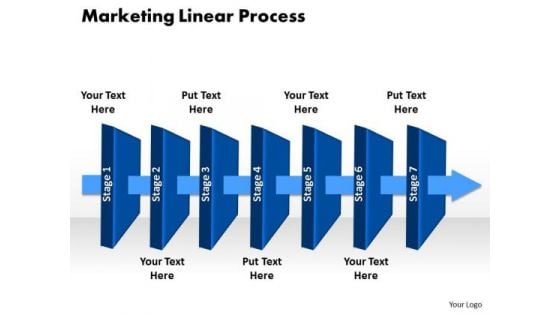
Ppt 7 Power Point Stage Social Backgrounds Linear Process PowerPoint Templates
PPT 7 power point stage social backgrounds linear process PowerPoint Templates-Create visually stimulating Microsoft office PPT Presentations with our above Diagram. It shows seven different layers placed in horizontal manner. It shows the successive concepts used in a procedure. This diagram will fit for Business Presentations. An excellent graphic to attract the attention of your audience to improve earnings.-PPT 7 power point stage social backgrounds linear process PowerPoint Templates-achievement, adding, analyzing, arrow, art, background, blank, business, chart, colorful, cycle, data, design, diagram, element, flow, graph, graphic, gray, icon, linear, magenta, management, market, numbers, orange, percent, process, project, round, stock, success, up, value We take your presentations seriously. See the difference with our Ppt 7 Power Point Stage Social Backgrounds Linear Process PowerPoint Templates. Make sure your presentation gets the attention it deserves.
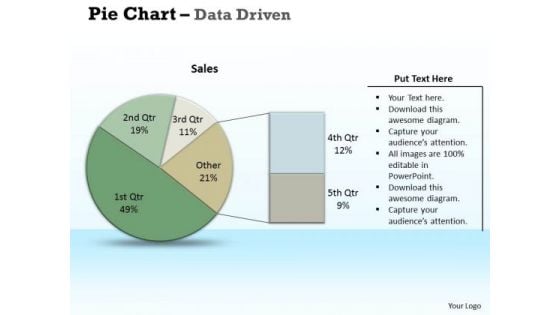
Examples Of Data Analysis Market Driven Pie Chart Research PowerPoint Slides Templates
Chalk It Up With Our examples of data analysis market driven pie chart research powerpoint slides Templates . Add To The Credits Of Your Ideas.
Business Framework Key Performance Indicators Customer Service PowerPoint Presentation
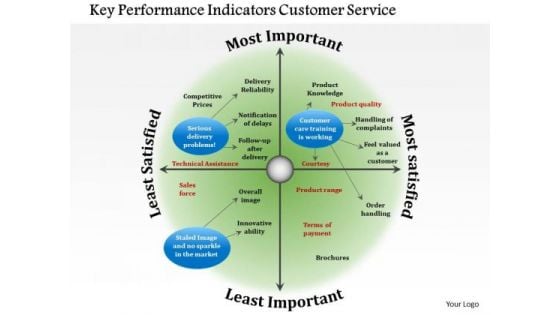
Our above diagram provides framework of key performance indicators for customer service. It contains circular diagram in four segments depicting concepts of delivery problems, customer care training. Download this diagram to make professional presentations on customer service.
Consistent Imitation Of Marketing Process Using 6 Stages System Flow Chart PowerPoint Slides
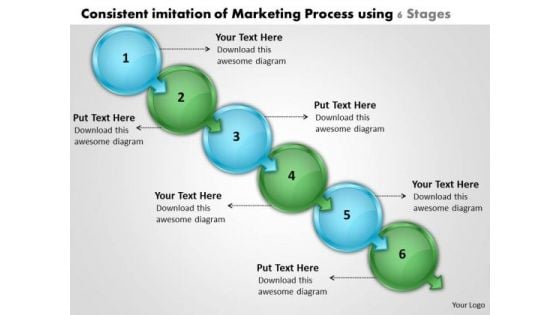
We present our consistent imitation of marketing process using 6 stages system flow chart PowerPoint Slides.Use our Arrows PowerPoint Templates because,This is a wonderful graphics to see the smiles of happiness spread as your audience realizes the value of your words. Use our Spheres PowerPoint Templates because, It helps to churn the mixture to the right degree and pound home your views and expectations in a spectacularly grand and virtuoso fluid performance. Use our Marketing PowerPoint Templates because,You can Raise your Company stocks at the Opening Bell. Use our Business PowerPoint Templates because,This template helps to pierce through the doubts of your audience. Use our Abstract PowerPoint Templates because,Like your thoughts arrows are inherently precise and true.Use these PowerPoint slides for presentations relating to Arrow, Art, Assess, Blue, Business, Chart, Chevron, Clip, Clipart, Colorful, Compliance, Corporate, Design, Development, Diagram, Flow, Glossy, Graphic, Hierarchy, Icon, Illustration, Implement, Infographic, Levels, Marketing, Modern, Plan, Process, Shape, Shiny, Square, Stages, Vector. The prominent colors used in the PowerPoint template are Blue, Green, Blue light Conserve your energy with our Consistent Imitation Of Marketing Process Using 6 Stages System Flow Chart PowerPoint Slides. Download without worries with our money back guaranteee.
Brand Management Strategy To Increase Awareness Types Of Leadership Brands And Their Message Rules PDF
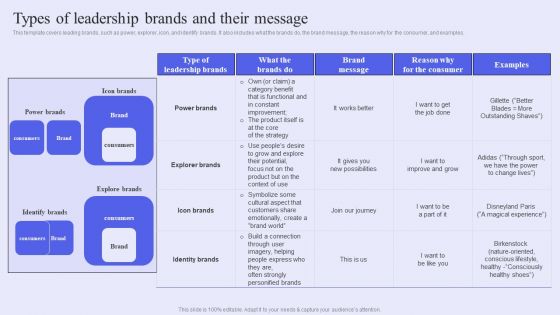
This template covers leading brands, such as power, explorer, icon, and identify brands. It also includes what the brands do, the brand message, the reason why for the consumer, and examples. This Brand Management Strategy To Increase Awareness Types Of Leadership Brands And Their Message Rules PDF from Slidegeeks makes it easy to present information on your topic with precision. It provides customization options, so you can make changes to the colors, design, graphics, or any other component to create a unique layout. It is also available for immediate download, so you can begin using it right away. Slidegeeks has done good research to ensure that you have everything you need to make your presentation stand out. Make a name out there for a brilliant performance.

Global Social Media Advertising Industry Report Pdf Word Document
This Global Social Media Advertising Industry Report Pdf Word Document is designed to help you retain your audiences attention. This content-ready PowerPoint Template enables you to take your audience on a journey and share information in a way that is easier to recall. It helps you highlight the crucial parts of your work so that the audience does not get saddled with information download. This sixty slide PPT Deck comes prepared with the graphs and charts you could need to showcase your information through visuals. You only need to enter your own data in them. Download this editable PowerPoint Theme and walk into that meeting with confidence. Our Global Social Media Advertising Industry Report Pdf Word Document are topically designed to provide an attractive backdrop to any subject. Use them to look like a presentation pro.

7 Processess As Stack Of Layers Business Plans Examples PowerPoint Templates
We present our 7 processess as stack of layers business plans examples PowerPoint templates.Download our Communication PowerPoint Templates because Your audience will believe you are the cats whiskers. Present our Success PowerPoint Templates because Your success is our commitment. Our PowerPoint Templates and Slides will ensure you reach your goal. Download our Layers PowerPoint Templates because Our PowerPoint Templates and Slides has conjured up a web of all you need with the help of our great team. Use them to string together your glistening ideas. Use our Business PowerPoint Templates because Our PowerPoint Templates and Slides are conceived by a dedicated team. Use them and give form to your wondrous ideas. Use our Shapes PowerPoint Templates because They will Put the wind in your sails. Skim smoothly over the choppy waters of the market.Use these PowerPoint slides for presentations relating to Layered, Layer, 3d, Cone, Object, Item, Segment, White, Business, Concept, Hierarchy, Success, Presentation, Bright, Symbol, Diagram, Cooperation, Data, Bond, Level, Top, Shape, Abstract, Graph, Arrangement, Support, Illustration, Icon, Stage, Chart, System, Strategy, Complex, Contact, Design, Cylinder, Color, Growth, Blue, Pyramid, Empty, Company, Global, Progress, Background, Construction, Structure, Rank, Performance, Communication. The prominent colors used in the PowerPoint template are Blue, Gray, Black. With our 7 Processess As Stack Of Layers Business Plans Examples PowerPoint Templates the goal is never far away. Your thoughts will always dribble through.
Data Evaluation Sample With Conjoint Marketing Intelligence Guide Data Gathering Sample Pdf
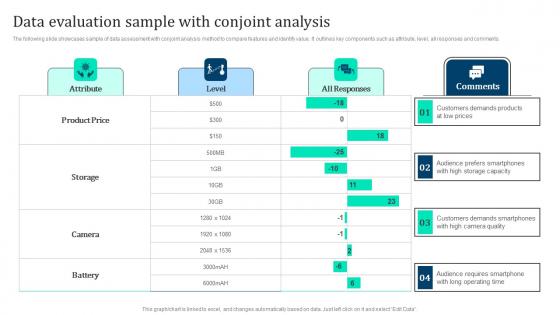
The following slide showcases sample of data assessment with conjoint analysis method to compare features and identify value. It outlines key components such as attribute, level, all responses and comments. Slidegeeks is here to make your presentations a breeze with Data Evaluation Sample With Conjoint Marketing Intelligence Guide Data Gathering Sample Pdf With our easy to use and customizable templates, you can focus on delivering your ideas rather than worrying about formatting. With a variety of designs to choose from, you are sure to find one that suits your needs. And with animations and unique photos, illustrations, and fonts, you can make your presentation pop. So whether you are giving a sales pitch or presenting to the board, make sure to check out Slidegeeks first The following slide showcases sample of data assessment with conjoint analysis method to compare features and identify value. It outlines key components such as attribute, level, all responses and comments.
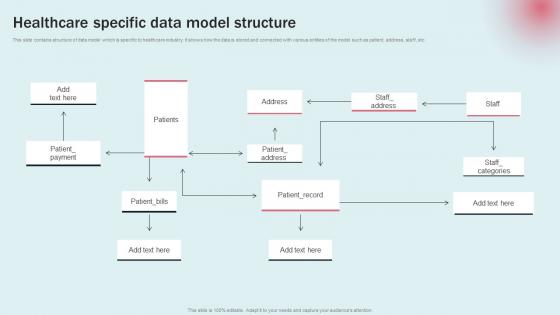
Healthcare Specific Data Model Structure Data Modeling Approaches Modern Analytics Ideas Pdf
This slide contains structure of data model which is specific to healthcare industry. It shows how the data is stored and connected with various entities of the model such as patient, address, staff, etc. If you are looking for a format to display your unique thoughts, then the professionally designed Healthcare Specific Data Model Structure Data Modeling Approaches Modern Analytics Ideas Pdf is the one for you. You can use it as a Google Slides template or a PowerPoint template. Incorporate impressive visuals, symbols, images, and other charts. Modify or reorganize the text boxes as you desire. Experiment with shade schemes and font pairings. Alter, share or cooperate with other people on your work. Download Healthcare Specific Data Model Structure Data Modeling Approaches Modern Analytics Ideas Pdf and find out how to give a successful presentation. Present a perfect display to your team and make your presentation unforgettable. This slide contains structure of data model which is specific to healthcare industry. It shows how the data is stored and connected with various entities of the model such as patient, address, staff, etc.
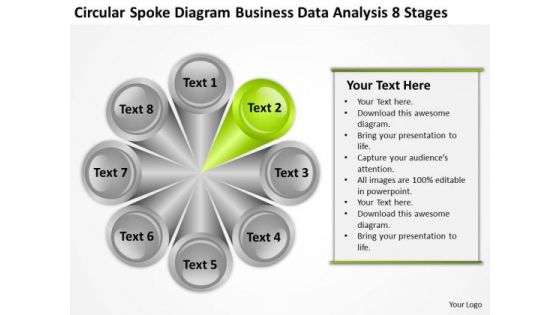
Business Data Analysis 8 Stages Ppt Plan Example PowerPoint Templates
We present our business data analysis 8 stages ppt plan example PowerPoint templates.Download and present our Process and Flows PowerPoint Templates because Our PowerPoint Templates and Slides will bullet point your ideas. See them fall into place one by one. Download our Circle Charts PowerPoint Templates because These PowerPoint Templates and Slides will give the updraft to your ideas. See them soar to great heights with ease. Present our Shapes PowerPoint Templates because Our PowerPoint Templates and Slides help you meet the demand of the Market. Just browse and pick the slides that appeal to your intuitive senses. Download our Flow Charts PowerPoint Templates because Our PowerPoint Templates and Slides are created by a hardworking bunch of busybees. Always flitting around with solutions gauranteed to please. Use our Business PowerPoint Templates because Our PowerPoint Templates and Slides will bullet point your ideas. See them fall into place one by one.Use these PowerPoint slides for presentations relating to Abstract, business, catalog, chart, circle, colors, cross, demonstration, description, design, diagram, futuristic, glossy, goals,illustration, information, interface, internet, isolated, level, list, marketing, model, multiple, navigation, network, pattern, presentation, registry, report, space, sphere, statement, statistics, steps, structure, wheel. The prominent colors used in the PowerPoint template are Gray, Green, White. Our Business Data Analysis 8 Stages Ppt Plan Example PowerPoint Templates offer easy availability and access. You will find them always around.
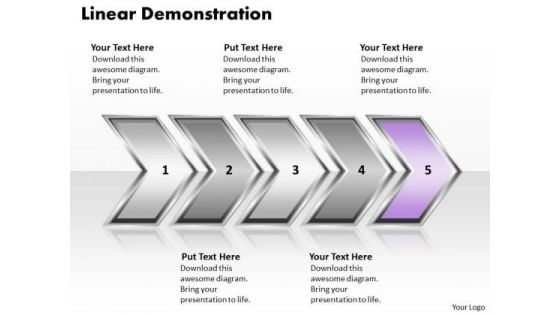
Ppt Linear Demonstration Of Process Using PowerPoint Graphics Arrows Templates
PPT linear demonstration of process using powerpoint graphics arrows Templates-This Diagram makes information accessible throughout the organization with a collective, visible view of critical data from different perspectives and providing the tools to upcoming business scenarios and plan for change. This image has been professionally designed to emphasize the concept of sequential process using curved arrows. It represents the Fifth arrow using purple color.-PPT linear demonstration of process using powerpoint graphics arrows Templates-Aim, Arrow, Arrowheads, Badge, Border, Click, Connection, Curve, Design, Direction, Download, Element, Fuchsia, Icon, Illustration, Indicator, Internet, Magenta, Mark, Object, Orientation, Pointer, Shadow, Shape, Sign Court the audience with our Ppt Linear Demonstration Of Process Using PowerPoint Graphics Arrows Templates. They will certainly be bowled over by you.
Ppt Linear Way To Represent 2 Practice The PowerPoint Macro Steps Templates
PPT linear way to represent 2 practice the powerpoint macro steps Templates-This Diagram makes information accessible throughout the organization with a collective, visible view of critical data from different perspectives and providing the tools to upcoming business scenarios and plan for change. This image has been professionally designed to emphasize the concept of sequential process using vertical arrows.-PPT linear way to represent 2 practice the powerpoint macro steps Templates-Aim, Arrow, Arrowheads, Badge, Border, Click, Connection, Curve, Design, Direction, Download, Element, Fuchsia, Icon, Illustration, Indicator, Internet, Magenta, Mark, Object, Orientation, Pointer, Shadow, Shape, Sign Our Ppt Linear Way To Represent 2 Practice The PowerPoint Macro Steps Templates are exceptionally customer-centric. They put clients before everything else.
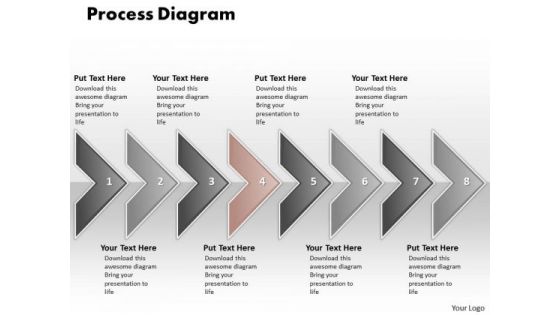
Ppt Eight Phase Diagram Social Media PowerPoint Presentation Process Templates
PPT eight phase diagram social media powerpoint presentation process Templates-This Diagram is used to illustrate how information will move between interrelated systems in the accomplishment of a given function, task or process. The visual description of this information flow with each given level showing how data is fed into a given process step and subsequently passed along at the completion of that step.-PPT eight phase diagram social media powerpoint presentation process Templates-Aim, Arrow, Badge, Border, Color, Connection, Curve, Design, Direction, Download, Icon, Illustration, Indicator, Internet, Label, Link, Magenta, Mark, Next, Object, Orientation, Paper, Peeling, Pointer, Rounded, Set, Shadow, Shape, Sign Help them fathom the depths of your mind. Give them a dive with our Ppt Eight Phase Diagram Social Media PowerPoint Presentation Process Templates.
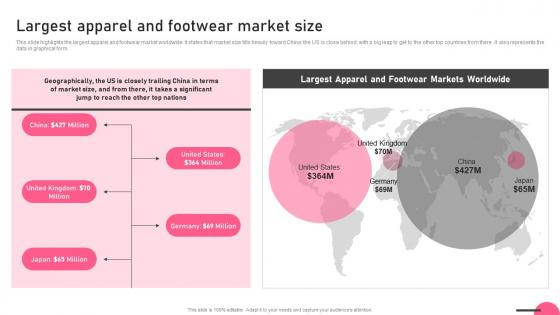
Largest Apparel And Footwear Market Size Boutique Business Themes Pdf
This slide highlights the largest apparel and footwear market worldwide. It states that market size tilts heavily toward China, the US is close behind, with a big leap to get to the other top countries from there. It also represents the data in graphical form. Are you searching for a Largest Apparel And Footwear Market Size Boutique Business Themes Pdf that is uncluttered, straightforward, and original Its easy to edit, and you can change the colors to suit your personal or business branding. For a presentation that expresses how much effort you have put in, this template is ideal With all of its features, including tables, diagrams, statistics, and lists, its perfect for a business plan presentation. Make your ideas more appealing with these professional slides. Download Largest Apparel And Footwear Market Size Boutique Business Themes Pdf from Slidegeeks today. This slide highlights the largest apparel and footwear market worldwide. It states that market size tilts heavily toward China, the US is close behind, with a big leap to get to the other top countries from there. It also represents the data in graphical form.
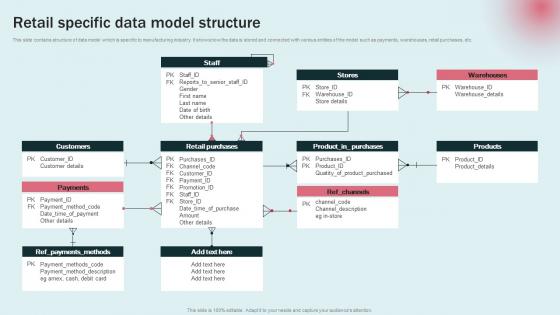
Retail Specific Data Model Structure Data Modeling Approaches For Modern Analytics Rules Pdf
This slide contains structure of data model which is specific to manufacturing industry. It shows how the data is stored and connected with various entities of the model such as payments, warehouses, retail purchases, etc. Are you searching for a Retail Specific Data Model Structure Data Modeling Approaches For Modern Analytics Rules Pdf that is uncluttered, straightforward, and original Its easy to edit, and you can change the colors to suit your personal or business branding. For a presentation that expresses how much effort you have put in, this template is ideal With all of its features, including tables, diagrams, statistics, and lists, its perfect for a business plan presentation. Make your ideas more appealing with these professional slides. Download Retail Specific Data Model Structure Data Modeling Approaches For Modern Analytics Rules Pdf from Slidegeeks today. This slide contains structure of data model which is specific to manufacturing industry. It shows how the data is stored and connected with various entities of the model such as payments, warehouses, retail purchases, etc.
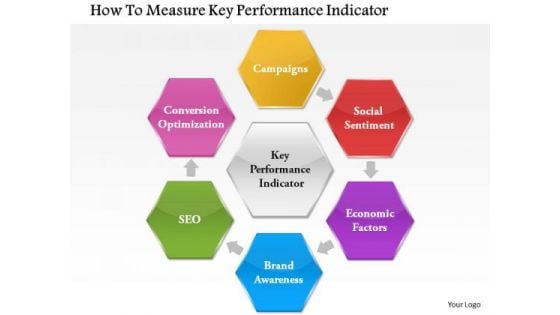
Business Framework How To Measure Key Performance Indicator PowerPoint Presentation
This Power Point diagram slide has been crafted with graphic of flower petal diagram. This PPT slide contains the concept of measuring the key performance and indicate it. Use this PPT slide for your management related presentation.
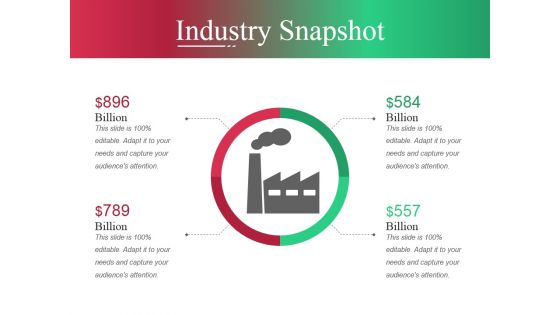
Industry Snapshot Template Ppt PowerPoint Presentation Slides Shapes
This is a industry snapshot template ppt powerpoint presentation slides shapes. This is a two stage process. The stages in this process are revenue, profit, annual growth, wages, annual growth, business.
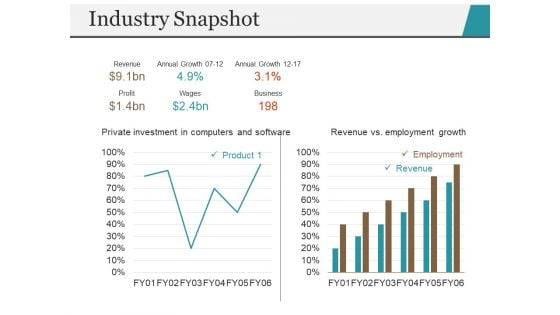
Industry Snapshot Template 1 Ppt PowerPoint Presentation Professional Design Inspiration
This is a industry snapshot template 1 ppt powerpoint presentation professional design inspiration. This is a two stage process. The stages in this process are revenue vs employment growth, employment, revenue, business, annual growth.
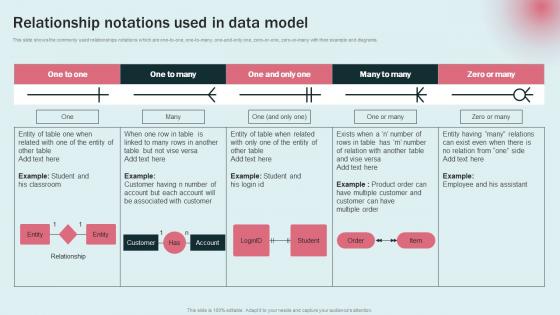
Relationship Notations Used Data Modeling Approaches For Modern Analytics Pictures Pdf
This slide shows the commonly used relationships notations which are one to one, one to many, one and only one, zero or one, zero or many with their example and diagrams. The Relationship Notations Used Data Modeling Approaches For Modern Analytics Pictures Pdf is a compilation of the most recent design trends as a series of slides. It is suitable for any subject or industry presentation, containing attractive visuals and photo spots for businesses to clearly express their messages. This template contains a variety of slides for the user to input data, such as structures to contrast two elements, bullet points, and slides for written information. Slidegeeks is prepared to create an impression. This slide shows the commonly used relationships notations which are one to one, one to many, one and only one, zero or one, zero or many with their example and diagrams.

Ppt Four Segments Around Globe PowerPoint Presentation Circle Blue Templates
PPT four segments around globe powerpoint presentation circle blue Templates-This PowerPoint Diagram can be used to represent worldwide business issues such as financial data, stock market Exchange, increase in sales, corporate presentations and more. It illustrates the blue component of this worldwide PowerPoint Diagram.-Can be used for presentations on abstract, achievement, aim, arrow, background, business, chart, communication, company, competition, concept, design, development, diagram, direction, finance, financial, forecast, forward, goal, graph, graphic, growth, icon, illustration, increase, investment, leader, leadership, marketing, motion, moving, path, price, process, profit, progress, progress bar, shape, sign, success, symbol, target, team, teamwork, turquoise blue, up, upward-PPT four segments around globe powerpoint presentation circle blue Templates Add to your armoury with our Ppt Four Segments Around Globe PowerPoint Presentation Circle Blue Templates. Take up the contest with your thoughts.
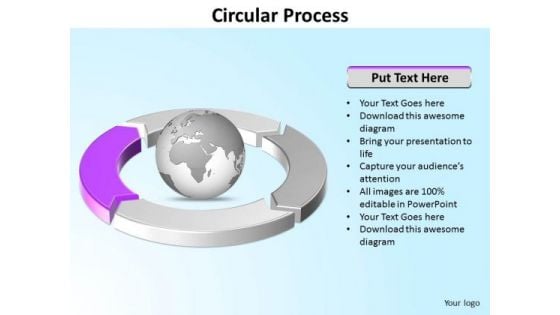
Ppt Four Segments Around Microsoft PowerPoint Backgrounds Circle Purple Templates
PPT four segments around microsoft powerpoint backgrounds circle purple Templates-This PowerPoint Diagram can be used to represent worldwide business issues such as financial data, stock market Exchange, increase in sales, corporate presentations and more. It illustrates the purple component. This Diagram will fit for Business Presentations.-Can be used for presentations on abstract, achievement, aim, arrow, background, business, chart, communication, company, competition, concept, design, development, diagram, direction, finance, financial, forecast, forward, goal, graph, graphic, growth, icon, illustration, increase, investment, leader, leadership, marketing, motion, moving, path, price, process, profit, progress, progress bar, shape, sign, success, symbol, target, team, teamwork, turquoise blue, up, upward-PPT four segments around microsoft powerpoint backgrounds circle purple Templates Handle a delicate situation with our Ppt Four Segments Around Microsoft PowerPoint Backgrounds Circle Purple Templates. Just download, type and present.
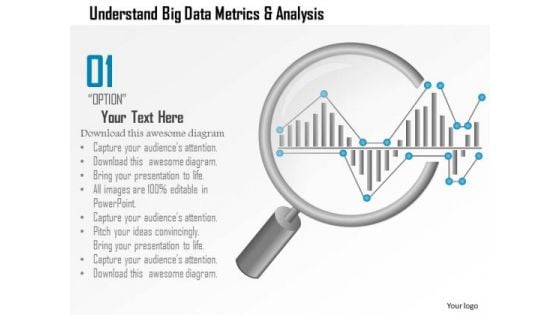
Business Diagram Understand Big Data Metrics And Analysis Showing By Magnifying Glass Ppt Slide
This PPT slide has been designed with big data metrics and magnifying glass. This diagram helps to portray concept of data analysis and data search. Download this diagram to make professional presentations.
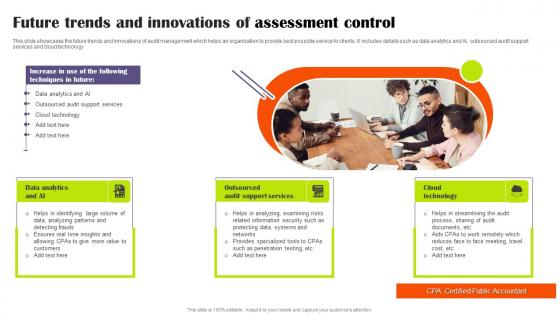
Future Trends And Innovations Of Assessment Control Themes Pdf
This slide showcases the future trends and innovations of audit management which helps an organization to provide best possible service to clients. It includes details such as data analytics and AI, outsourced audit support services and cloud technology Pitch your topic with ease and precision using this Future Trends And Innovations Of Assessment Control Themes Pdf This layout presents information on Data Analytics, Outsourced Audit, Support Services It is also available for immediate download and adjustment. So, changes can be made in the color, design, graphics or any other component to create a unique layout. This slide showcases the future trends and innovations of audit management which helps an organization to provide best possible service to clients. It includes details such as data analytics and AI, outsourced audit support services and cloud technology
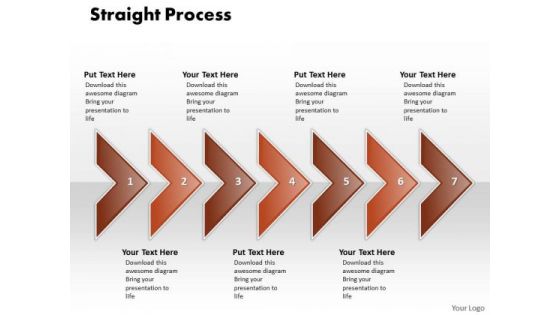
Ppt Correlated Shapes Arrows PowerPoint Straight Line 7 Phase Diagram Templates
PPT correlated shapes arrows powerpoint straight line 7 phase diagram Templates-This Diagram is used to illustrate how information will move between interrelated systems in the accomplishment of a given function, task or process. The visual description of this information flow with each given level showing how data is fed into a given process step and subsequently passed along at the completion of that step.-PPT correlated shapes arrows powerpoint straight line 7 phase diagram Templates-Aim, Arrow, Badge, Border, Color, Connection, Curve, Design, Direction, Download, Icon, Illustration, Indicator, Internet, Label, Link, Magenta, Mark, Next, Object, Orientation, Paper, Peeling, Pointer, Rounded, Set, Shadow, Shape, Sign Give your audience a feast for their eyes. Our brightly colored Ppt Correlated Shapes Arrows PowerPoint Straight Line 7 Phase Diagram Templates will hold their fascnation.
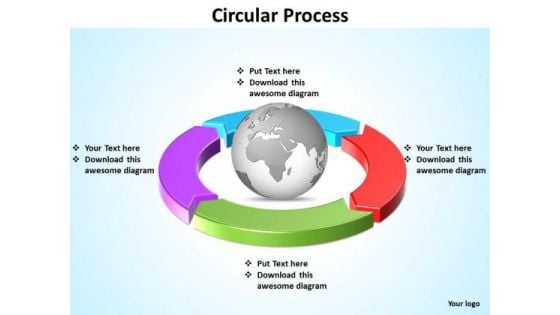
Ppt Four Segments Around Globe In Circle PowerPoint Presentation Templates
PPT four segments around globe in circle powerpoint presentation Templates-Use this graphical approach to represent global business issues such as financial data, stock market Exchange, increase in sales, corporate presentations and more. It Signifies common, comprehensive, extensive, global, international, multinational, omnipresent, planetary, ubiquitous, universal etc.-Can be used for presentations on abstract, achievement, aim, arrow, background, business, chart, communication, company, competition, concept, design, development, diagram, direction, finance, financial, forecast, forward, goal, graph, graphic, growth, icon, illustration, increase, investment, leader, leadership, marketing, motion, moving, path, price, process, profit, progress, progress bar, shape, sign, success, symbol, target, team, teamwork, turquoise blue, up, upward-PPT four segments around globe in circle powerpoint presentation Templates Evoke compassion with our Ppt Four Segments Around Globe In Circle PowerPoint Presentation Templates. They will want to believe in Father Christmas.
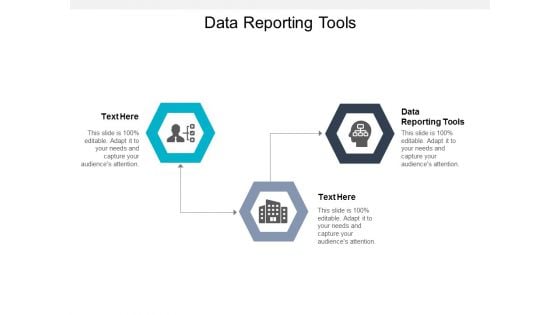
Data Reporting Tools Ppt PowerPoint Presentation Styles Diagrams Cpb
Presenting this set of slides with name data reporting tools ppt powerpoint presentation styles diagrams cpb. This is an editable Powerpoint three stages graphic that deals with topics like data reporting tools to help convey your message better graphically. This product is a premium product available for immediate download and is 100 percent editable in Powerpoint. Download this now and use it in your presentations to impress your audience.
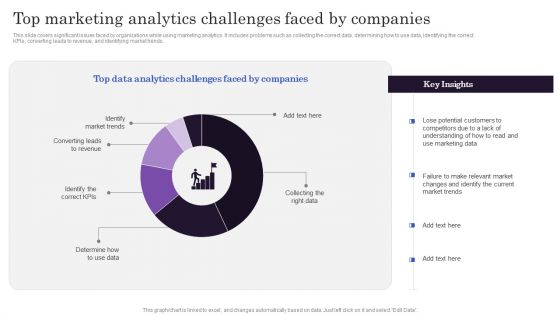
Marketers Guide To Data Analysis Optimization Top Marketing Analytics Challenges Faced By Companies Formats PDF
This slide covers significant issues faced by organizations while using marketing analytics. It includes problems such as collecting the correct data, determining how to use data, identifying the correct KPIs, converting leads to revenue, and identifying market trends. Boost your pitch with our creative Marketers Guide To Data Analysis Optimization Top Marketing Analytics Challenges Faced By Companies Formats PDF. Deliver an awe-inspiring pitch that will mesmerize everyone. Using these presentation templates you will surely catch everyones attention. You can browse the ppts collection on our website. We have researchers who are experts at creating the right content for the templates. So you do not have to invest time in any additional work. Just grab the template now and use them.
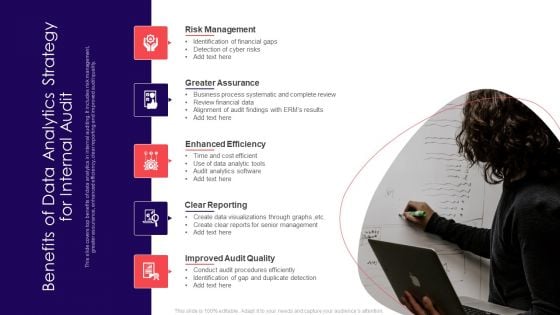
Benefits Of Data Analytics Strategy For Internal Audit Introduction PDF
This slide covers top benefits of data analytics in internal auditing. It includes risk management, greater assurance, enhanced efficiency, clear reporting and improved audit quality. Presenting Benefits Of Data Analytics Strategy For Internal Audit Introduction PDF to dispense important information. This template comprises five stages. It also presents valuable insights into the topics including Enhanced Efficiency, Risk Management, Greater Assurance. This is a completely customizable PowerPoint theme that can be put to use immediately. So, download it and address the topic impactfully.
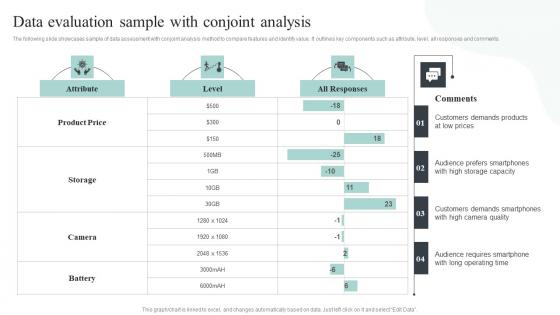
Competitive Intelligence Guide To Determine Market Data Evaluation Sample With Conjoint Information Pdf
The following slide showcases sample of data assessment with conjoint analysis method to compare features and identify value. It outlines key components such as attribute, level, all responses and comments. From laying roadmaps to briefing everything in detail, our templates are perfect for you. You can set the stage with your presentation slides. All you have to do is download these easy-to-edit and customizable templates. Competitive Intelligence Guide To Determine Market Data Evaluation Sample With Conjoint Information Pdf will help you deliver an outstanding performance that everyone would remember and praise you for. Do download this presentation today. The following slide showcases sample of data assessment with conjoint analysis method to compare features and identify value. It outlines key components such as attribute, level, all responses and comments.
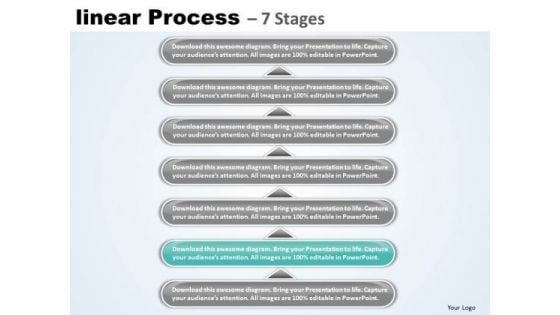
Usa Ppt Linear Process 7 Phase Diagram Project Management PowerPoint 3 Graphic
USA PPT linear process 7 phase diagram project management powerpoint 3 Graphic-This slide is an excellent backdrop for you to enlighten your audience on the process you have gone through and the vision you have for the future. Narrow them down and prove their viability to help your organization -USA PPT linear process 7 phase diagram project management powerpoint 3 Graphic-Abstract, Achievement, Adding, Analyzing, Arrow, Art, Background, Blank, Blue, Business, Chart, Color, Colorful, Cycle, Data, Design, Diagram, Element, Flow, Graph, Graphic, Gray, Green, Icon, Linear, Management, Market, Numbers, Percent, Process, Project, Round, Stock, Success Hop over obstacles with our Usa Ppt Linear Process 7 Phase Diagram Project Management PowerPoint 3 Graphic. Make sure your presentation gets the attention it deserves.
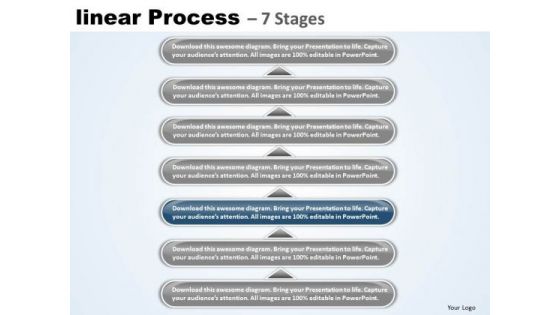
Usa Ppt Linear Process 7 Phase Diagram Project Management PowerPoint 4 Graphic
USA PPT linear process 7 phase diagram project management powerpoint 4 Graphic-Outline the path you have in mind in order to boost sales and stay ahead of the competition enhancing your corporate reputation as you go along the road to success. Now use this slide to transmit this clarity of purpose onto the eager minds of your team.-USA PPT linear process 7 phase diagram project management powerpoint 4 Graphic-Abstract, Achievement, Adding, Analyzing, Arrow, Art, Background, Blank, Blue, Business, Chart, Color, Colorful, Cycle, Data, Design, Diagram, Element, Flow, Graph, Graphic, Gray, Green, Icon, Linear, Management, Market, Numbers, Percent, Process, Project, Round, Stock, Success Making plans with our Usa Ppt Linear Process 7 Phase Diagram Project Management PowerPoint 4 Graphic entails success. They ensure automatic returns.
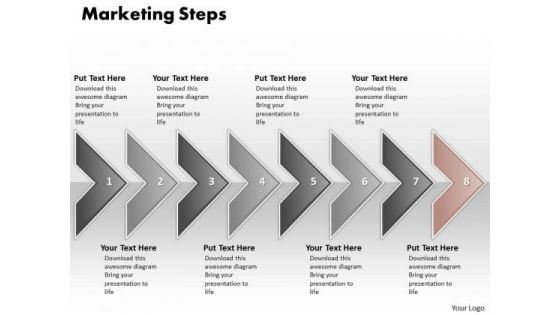
Ppt PowerPoint Slide Numbers Of Marketing Process Using 8 State Diagram Templates
PPT powerpoint slide numbers of marketing process using 8 state diagram Templates-Our compelling template consists of a design of arrow in straight line. This Diagram is used to illustrate how information will move between interrelated systems in the accomplishment of a given function, task or process. The visual description of this information flow with each given level showing how data is fed into a given process step and subsequently passed along at the completion of that step.-PPT powerpoint slide numbers of marketing process using 8 state diagram Templates-Aim, Arrow, Badge, Border, Color, Connection, Curve, Design, Direction, Download, Icon, Illustration, Indicator, Internet, Label, Link, Magenta, Mark, Next, Object, Orientation, Paper, Peeling, Pointer, Rounded, Set, Shadow, Shape, Sign Put in our Ppt PowerPoint Slide Numbers Of Marketing Process Using 8 State Diagram Templates as the catalyst. Churn out new equations with your ideas.
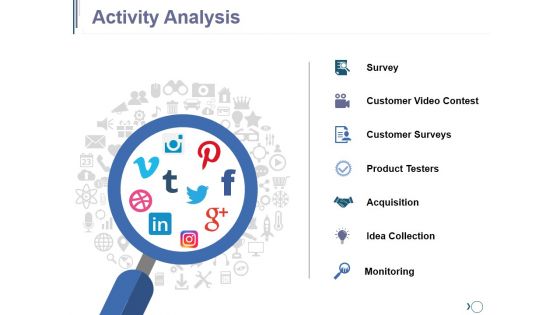
Activity Analysis Ppt PowerPoint Presentation Diagram Images
This is a activity analysis ppt powerpoint presentation diagram images. This is a one stage process. The stages in this process are survey, customer video contest, customer surveys, product testers, acquisition, idea collection.
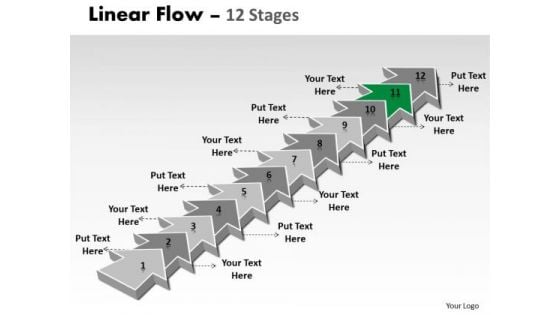
Ppt Theme 12 Stages Linear Arrows To Create Business Representation Video Plan Design
We present our PPT Theme 12 stages linear arrows to create business representation video plan design. Use our Arrows PowerPoint Templates because; Use our template to illustrate what you say. Use our Symbol PowerPoint Templates because, you have made significant headway in this field. Use our Business PowerPoint Templates because; explain your strategy to co-ordinate activities of these separate groups. Use our Process and Flows PowerPoint Templates because, they help to lay the base of your trend of thought. Use our Marketing PowerPoint Templates because; illustrate your thoughts and experiences to your staff. Use these PowerPoint slides for presentations relating to Arrow, Background, Business, Chart, Diagram, Financial, Graphic, Gray, Icon, Illustration, Management, Perspective, Planning, Process, Stages, Steps, Text. The prominent colors used in the PowerPoint template are Green, Gray, and Black Our Ppt Theme 12 Stages Linear Arrows To Create Business Representation Video Plan Design have the endurance to keep up the fight. Come out on top at the end of the day.
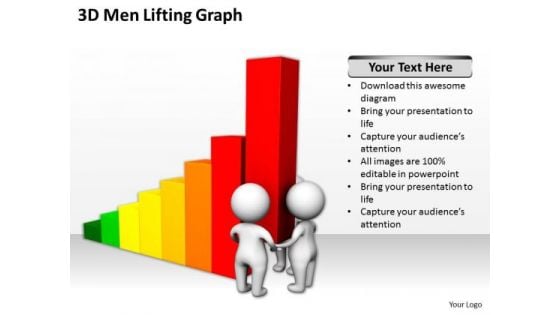
Successful Business Men 3d Lifting Graph PowerPoint Slides
We present our successful business men 3d lifting graph PowerPoint Slides.Download our Business PowerPoint Templates because Our PowerPoint Templates and Slides are aesthetically designed to attract attention. We gaurantee that they will grab all the eyeballs you need. Download and present our People PowerPoint Templates because Our PowerPoint Templates and Slides are created by a hardworking bunch of busybees. Always flitting around with solutions gauranteed to please. Present our Finance PowerPoint Templates because It is Aesthetically crafted by artistic young minds. Our PowerPoint Templates and Slides are designed to display your dexterity. Download our Success PowerPoint Templates because You can Connect the dots. Fan expectations as the whole picture emerges. Download and present our Marketing PowerPoint Templates because You are well armed with penetrative ideas. Our PowerPoint Templates and Slides will provide the gunpowder you need.Use these PowerPoint slides for presentations relating to 3d, abstract, accounting, achievement, advantage, bar, bar graph, bar-chart, bar-graph, business, cartoon, chart, company, concept, corporate, financial, graph, growth, help, icon, idiom, lifting, lifting the bar, market, meeting, men, metaphor, partnership, people, performance, presentation, progress, report, strength, team, teamwork. The prominent colors used in the PowerPoint template are Red, Yellow, Green. Position yourself with our Successful Business Men 3d Lifting Graph PowerPoint Slides. Download without worries with our money back guaranteee.
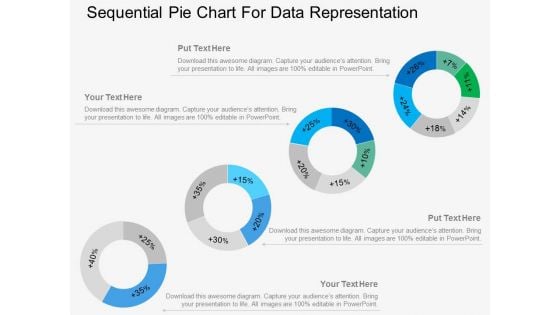
Four Sequential Pie Charts For Data Representation Powerpoint Template
Our above PowerPoint template displays infographic diagram of sequential pie chart. This diagram slide may be used for data representation in visual manner. Above slide provide ideal backdrop to make business presentations.
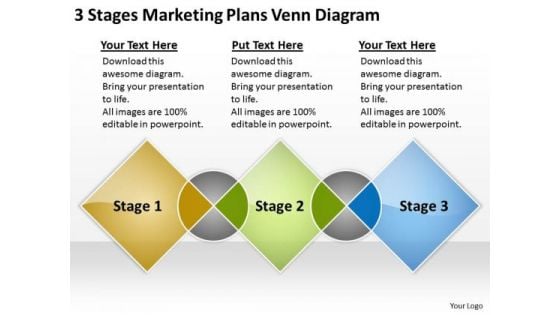
3 Stages Marketing Plans Venn Diagram Ppt Business Template PowerPoint Slides
We present our 3 stages marketing plans venn diagram ppt business template PowerPoint Slides.Present our Process and Flows PowerPoint Templates because You can Channelise the thoughts of your team with our PowerPoint Templates and Slides. Urge them to focus on the goals you have set. Download our Success PowerPoint Templates because Our PowerPoint Templates and Slides are created with admirable insight. Use them and give your group a sense of your logical mind. Present our Business PowerPoint Templates because You can Connect the dots. Fan expectations as the whole picture emerges. Present our Shapes PowerPoint Templates because Our PowerPoint Templates and Slides will embellish your thoughts. See them provide the desired motivation to your team. Download and present our Spheres PowerPoint Templates because Our PowerPoint Templates and Slides will embellish your thoughts. See them provide the desired motivation to your team.Use these PowerPoint slides for presentations relating to Vector, sign, icon, market, isolated, green, white, corporate, business, concept, success, symbol, diagram, graphic, finance, data, element, drawing, report, shape, abstract, illustration, strategy, money, design, growth, colorful, progress, part, information, background, investment, financial, communication . The prominent colors used in the PowerPoint template are Yellow, Green, Blue. With our 3 Stages Marketing Plans Venn Diagram Ppt Business Template PowerPoint Slides you will never be fearful. Accept any challenge that may crop up.
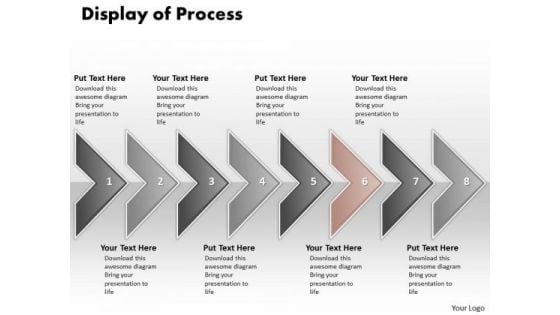
Ppt Display Of Marketing Process Using 8 Power Point Stage PowerPoint Templates
PPT display of marketing process using 8 power point stage PowerPoint Templates-This Diagram is used to illustrate how information will move between interrelated systems in the accomplishment of a given function, task or process. The visual description of this information flow with each given level showing how data is fed into a given process step and subsequently passed along at the completion of that step.-PPT display of marketing process using 8 power point stage PowerPoint Templates-Aim, Arrow, Badge, Border, Color, Connection, Curve, Design, Direction, Download, Icon, Illustration, Indicator, Internet, Label, Link, Magenta, Mark, Next, Object, Orientation, Paper, Peeling, Pointer, Rounded, Set, Shadow, Shape, Sign Solve problems with our Ppt Display Of Marketing Process Using 8 Power Point Stage PowerPoint Templates. Download without worries with our money back guaranteee.
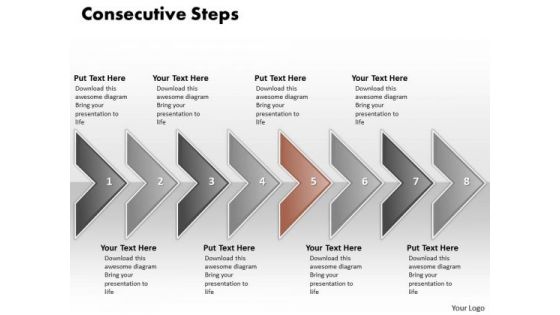
Ppt Eight Consecutive Practice The PowerPoint Macro Steps Of Marketing Process Templates
PPT eight consecutive practice the powerpoint macro steps of marketing process Templates-This Diagram is used to illustrate how information will move between interrelated systems in the accomplishment of a given function, task or process. The visual description of this information flow with each given level showing how data is fed into a given process step and subsequently passed along at the completion of that step.-PPT eight consecutive practice the powerpoint macro steps of marketing process Templates-Aim, Arrow, Badge, Border, Color, Connection, Curve, Design, Direction, Download, Icon, Illustration, Indicator, Internet, Label, Link, Magenta, Mark, Next, Object, Orientation, Paper, Peeling, Pointer, Rounded, Set, Shadow, Shape, Sign Let our Ppt Eight Consecutive Practice The PowerPoint Macro Steps Of Marketing Process Templates escort your thoughts. They will take them safely to their destination.
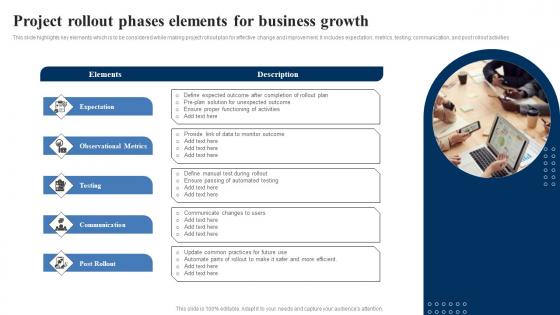
Project Rollout Phases Elements For Business Growth Introduction Pdf
This slide highlights key elements which is to be considered while making project rollout plan for effective change and improvement. It includes expectation, metrics, testing, communication, and post rollout activities Showcasing this set of slides titled Project Rollout Phases Elements For Business Growth Introduction Pdf The topics addressed in these templates are Define Manual, Communicate Changes, Observational Metrics All the content presented in this PPT design is completely editable. Download it and make adjustments in color, background, font etc. as per your unique business setting. This slide highlights key elements which is to be considered while making project rollout plan for effective change and improvement. It includes expectation, metrics, testing, communication, and post rollout activities.
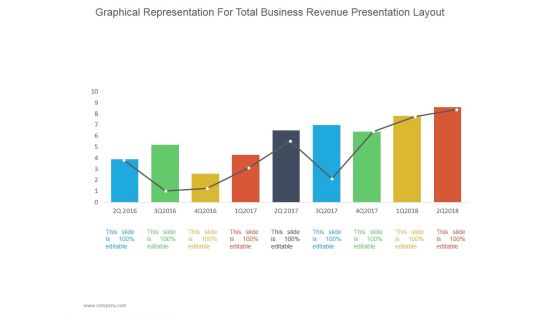
Graphical Representation For Total Business Revenue Ppt PowerPoint Presentation Diagrams
This is a graphical representation for total business revenue ppt powerpoint presentation diagrams. This is a nine stage process. The stages in this process are business, strategy, line chart, bar graph, marketing, management.
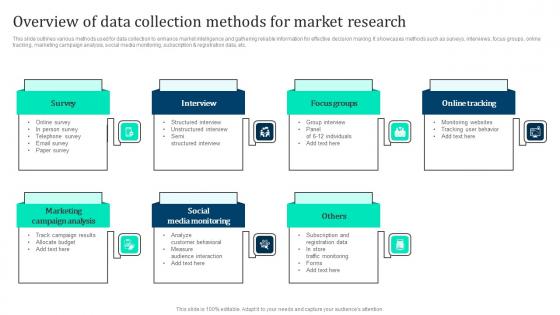
Overview Of Data Collection Methods Marketing Intelligence Guide Data Gathering Diagrams Pdf
This slide outlines various methods used for data collection to enhance market intelligence and gathering reliable information for effective decision making. It showcases methods such as surveys, interviews, focus groups, online tracking, marketing campaign analysis, social media monitoring, subscription and registration data, etc. Take your projects to the next level with our ultimate collection of Overview Of Data Collection Methods Marketing Intelligence Guide Data Gathering Diagrams Pdf. Slidegeeks has designed a range of layouts that are perfect for representing task or activity duration, keeping track of all your deadlines at a glance. Tailor these designs to your exact needs and give them a truly corporate look with your own brand colors they will make your projects stand out from the rest This slide outlines various methods used for data collection to enhance market intelligence and gathering reliable information for effective decision making. It showcases methods such as surveys, interviews, focus groups, online tracking, marketing campaign analysis, social media monitoring, subscription and registration data, etc.
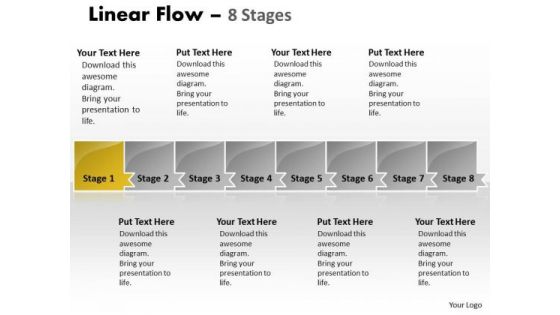
Editable PowerPoint Template Parellel Representation Of 8 Issues Graphic
We present our editable PowerPoint template parellel representation of 8 issues Graphic.Use our Arrows PowerPoint Templates because, they help to lay the base of your trend of thought. Use our Symbol PowerPoint Templates because, Our Template designs are State of the Art. Use our Business PowerPoint Templates because, Business 3D Circular Puzzle: - Your business and plans for its growth consist of processes that are highly co-related. Use our Process and flows PowerPoint Templates because, Now you have to coordinate and motivate your team. Use our Marketing PowerPoint Templates because, However it requires care and diligence to function well. Use these PowerPoint slides for presentations relating to Arrow, background, business, chart, diagram, financial, flow, graphic, gray, icon, management, orange, perspective, process, reflection, spheres, shapes, symbol, and marketing. The prominent colors used in the PowerPoint template are Yellow, Gray, and White Apply your brains in the correct direction. Our Editable PowerPoint Template Parellel Representation Of 8 Issues Graphic will align them accurately.
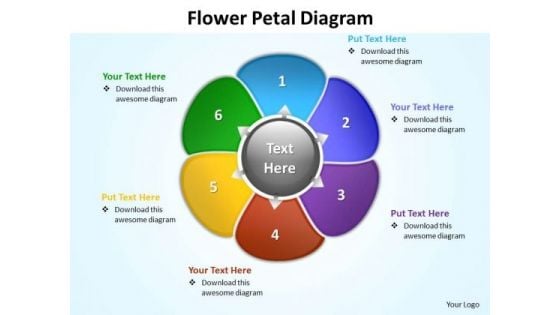
Ppt Flower Petal Diagram Presentation PowerPoint Tips Editable Templates
PPT flower petal diagram presentation powerpoint tips editable Templates-Use this Flower Based PowerPoint Diagram to make your Presentation Beautiful to watch for Audiences. It shows six Petals describing six different topics included in one mechanism. It signifies move, movement, moving, network, networking, people, progress, render, society, blossom, bud, cluster, efflorescence etc.-PPT flower petal diagram presentation powerpoint tips editable Templates-Abstract, Arrow, Background, Blank, Blue, Business, Button, Chart, Circle, Concept, Cycle, Diagram, Direction, Element, Flower, Graph, Graphic, Green, Guide, Icon, Illustration, Isolated, Leader, Management, Marketing, Model, Organization, Presentation, Process, Red, Report, Representation, Step, Template, Text, Tool, Vector, White Arouse the excitement with our Ppt Flower Petal Diagram Presentation PowerPoint Tips Editable Templates. Stir up the audience with your views.
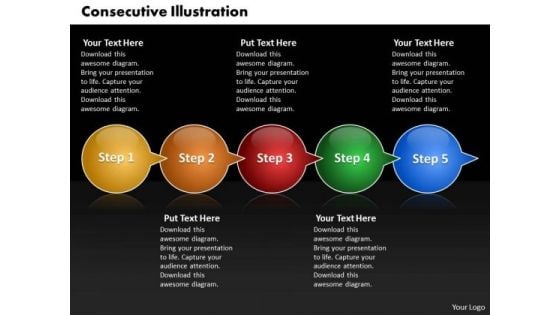
Ppt Consecutive Example Of 5 PowerPoint Slide Numbers Through Arrows Templates
PPT consecutive example of 5 powerpoint slide numbers through arrows Templates-The above template displays a diagram of circles connected with arrows. This is a graphic organizer for recording related ideas about a concept. It can be used to emphasize direction of movement and interconnections of stages in a flow. Deliver amazing presentations to mesmerize your audience.-PPT consecutive example of 5 powerpoint slide numbers through arrows Templates-3d, Abstract, Arrow, Circle, Circular, Click, Computer, Data, Direction, Graphic, Icon, Illustration, Insignia, Intention, Internet, Isolated, Label, Mail, Mascot, Media, Menu, Motion, Page, Pushing, Search, Shiny, Sign, Simple, Symbol Nest comfortably in success with our Ppt Consecutive Example Of 5 PowerPoint Slide Numbers Through Arrows Templates. You will be at the top of your game.
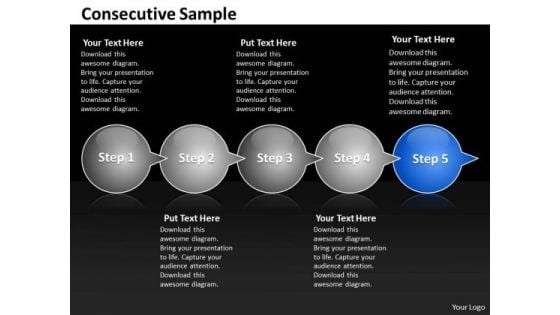
Ppt Consecutive Sample Of 5 Steps Through Curved Arrows PowerPoint 2010 Templates
PPT consecutive sample of 5 steps through curved arrows powerpoint 2010 Templates-The above template displays a diagram of circles connected with arrows. This is a graphic organizer for recording related ideas about a concept. It can be used to emphasize direction of movement and interconnections of stages in a flow. Deliver amazing presentations to mesmerize your audience.-PPT consecutive sample of 5 steps through curved arrows powerpoint 2010 Templates-3d, Abstract, Arrow, Circle, Circular, Click, Computer, Data, Direction, Graphic, Icon, Illustration, Insignia, Intention, Internet, Isolated, Label, Mail, Mascot, Media, Menu, Motion, Page, Pushing, Search, Shiny, Sign, Simple, Symbol Optimize your business cyclewith our Ppt Consecutive Sample Of 5 Steps Through Curved Arrows PowerPoint 2010 Templates. You'll deliver your best presentation yet.
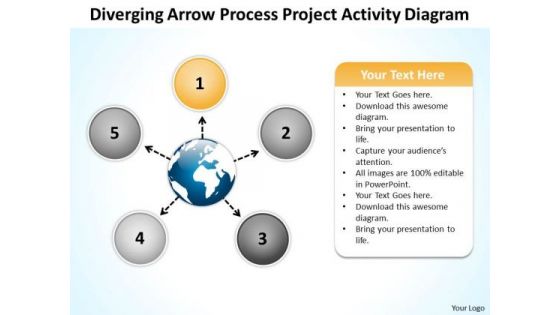
Diverging Arrow Process Project Activity Diagram Ppt Radial Chart PowerPoint Slide
We present our diverging arrow process project activity diagram ppt Radial Chart PowerPoint Slide.Download our Globe PowerPoint Templates because sprout your thoughts into the minds of your colleagues. Present our Circle Charts PowerPoint Templates because your brain is always churning out ideas like cogs in a wheel. Use our Ring Charts PowerPoint Templates because it can bring your ideas to the fore so that all around can know. Dissect each idea to the core and select the best. Download and present our Business PowerPoint Templates because this template can project the path to sucess that you have charted. Use our Marketing PowerPoint Templates because networking is an imperative in todays world. You need to access the views of others. Similarly you need to give access to them of your abilities.Use these PowerPoint slides for presentations relating to Arrow, art, caricature, chart, childish,circular, creative, design, diagram,doodle, draw, flow, graffiti, graphic,grunge, hand, handwritten, icon,illustration, image, isolated, object, pie, pieces, process, raster,report, retro, rough, scribble, segmented, simple, sketch, sketchy, slices,statistic, styling, succeed, success,symbol. The prominent colors used in the PowerPoint template are Gray, Black, White. Professionals tell us our diverging arrow process project activity diagram ppt Radial Chart PowerPoint Slide are Wistful. People tell us our caricature PowerPoint templates and PPT Slides are Wistful. The feedback we get is that our diverging arrow process project activity diagram ppt Radial Chart PowerPoint Slide are Swanky. Presenters tell us our circular PowerPoint templates and PPT Slides will make the presenter look like a pro even if they are not computer savvy. You can be sure our diverging arrow process project activity diagram ppt Radial Chart PowerPoint Slide are Multicolored. PowerPoint presentation experts tell us our circular PowerPoint templates and PPT Slides will help you be quick off the draw. Just enter your specific text and see your points hit home. Bond with the boys with our Diverging Arrow Process Project Activity Diagram Ppt Radial Chart PowerPoint Slide. They enhance espirit-de-corps.
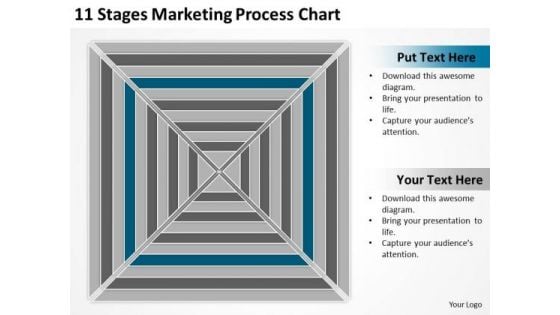
11 Stages Marketing Process Chart Ppt Business Plan Ideas PowerPoint Templates
We present our 11 stages marketing process chart ppt business plan ideas PowerPoint templates.Use our Process and Flows PowerPoint Templates because Our PowerPoint Templates and Slides will steer your racing mind. Hit the right buttons and spur on your audience. Download our Flow Charts PowerPoint Templates because Our PowerPoint Templates and Slides are effectively colour coded to prioritise your plans They automatically highlight the sequence of events you desire. Present our Shapes PowerPoint Templates because Our PowerPoint Templates and Slides will provide you the cutting edge. Slice through the doubts in the minds of your listeners. Use our Business PowerPoint Templates because Our PowerPoint Templates and Slides has conjured up a web of all you need with the help of our great team. Use them to string together your glistening ideas. Use our Marketing PowerPoint Templates because Our PowerPoint Templates and Slides offer you the needful to organise your thoughts. Use them to list out your views in a logical sequence.Use these PowerPoint slides for presentations relating to Chart, flow, process, workflow, review, square, corporation, corporate, business, plan, hierarchy, glossy, compliance, diagram, graphic, marketing, development, graph, modern, illustration, icon, assess, clipart, stages, executive, design, clip, set, organization, infographic,levels, organize, art, implement, work, eleven. The prominent colors used in the PowerPoint template are Gray, Blue, White. Motivate your team to excellent performances. Nurture their abilities through our 11 Stages Marketing Process Chart Ppt Business Plan Ideas PowerPoint Templates.
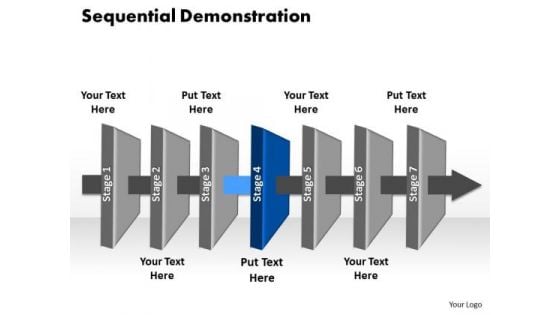
Ppt Layer 4 Manufacturing Linear Communication Process PowerPoint Presentation Templates
PPT layer 4 manufacturing linear communication process PowerPoint presentation Templates-This PowerPoint Diagram shows you the 3d Sequential Demonstration to explain Internet Marketing. It consists of Seven Layers explaining fourth here. Use this diagram as a method of graphically representing the flow of data as an information processing system.-PPT layer 4 manufacturing linear communication process PowerPoint presentation Templates-abstract, achievement, adding, analyzing, arrow, art, background, blank, blue, business, chart, color, colorful, cycle, data, design, diagram, element, flow, graph, graphic, gray, green, icon, linear, management, market, numbers, percent, process, project, round, stock, success, up, value You've found a valuable resource with our Ppt Layer 4 Manufacturing Linear Communication Process PowerPoint Presentation Templates. You'll always stay ahead of the game.
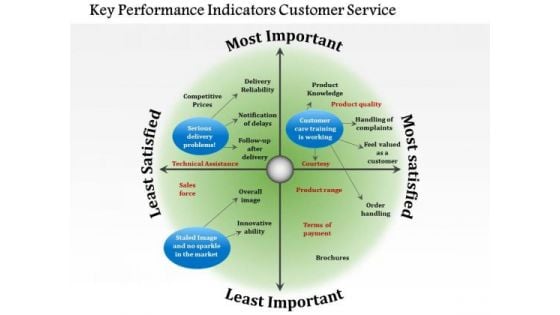
Business Diagram Key Performance Indicators Customer Service PowerPoint Ppt Presentation
Our above diagram provides framework of key performance indicators for customer service. It contains circular diagram in four segments depicting concepts of delivery problems, customer care training. Download this diagram to make professional presentations on customer service.
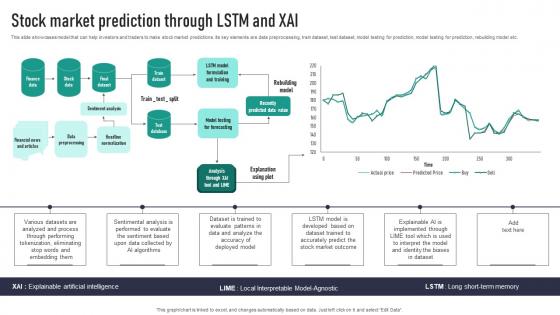
Stock Market Prediction Through LSTM And XAI Themes Pdf
This slide showcases model that can help investors and traders to make stock market predictions. Its key elements are data preprocessing, train dataset, test dataset, model testing for prediction, model testing for prediction, rebuilding model etc. Want to ace your presentation in front of a live audience Our Stock Market Prediction Through LSTM And XAI Themes Pdf can help you do that by engaging all the users towards you. Slidegeeks experts have put their efforts and expertise into creating these impeccable powerpoint presentations so that you can communicate your ideas clearly. Moreover, all the templates are customizable, and easy-to-edit and downloadable. Use these for both personal and commercial use. This slide showcases model that can help investors and traders to make stock market predictions. Its key elements are data preprocessing, train dataset, test dataset, model testing for prediction, model testing for prediction, rebuilding model etc.
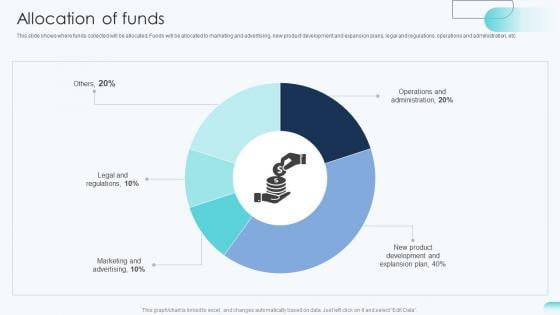
Allocation Of Funds Big Data Analytics Investor Funding Elevator Pitch Deck
This slide shows where funds collected will be allocated. Funds will be allocated to marketing and advertising, new product development and expansion plans, legal and regulations, operations and administration, etc. Find a pre-designed and impeccable Allocation Of Funds Big Data Analytics Investor Funding Elevator Pitch Deck. The templates can ace your presentation without additional effort. You can download these easy-to-edit presentation templates to make your presentation stand out from others. So, what are you waiting for Download the template from Slidegeeks today and give a unique touch to your presentation. This slide shows where funds collected will be allocated. Funds will be allocated to marketing and advertising, new product development and expansion plans, legal and regulations, operations and administration, etc.
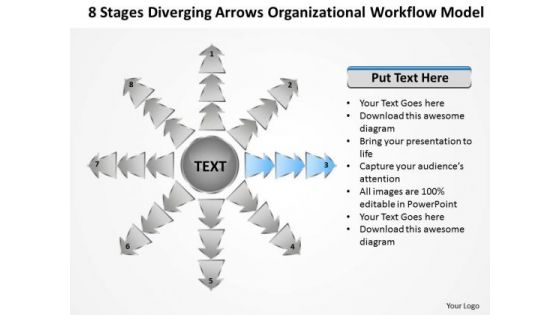
Diverging Arrows Organizational Workflow Model Cycle Process Diagram PowerPoint Slide
We present our diverging arrows organizational workflow model Cycle Process Diagram PowerPoint Slide.Download our Process and Flows PowerPoint Templates because you have the entire picture in mind. Download and present our Arrows PowerPoint Templates because this is the unerring accuracy in reaching the target. the effortless ability to launch into flight. Download and present our Flow Charts PowerPoint Templates because this diagram helps to reaffirm to your team your faith in maintaining the highest ethical standards. Download our Marketing PowerPoint Templates because networking is an imperative in todays world. You need to access the views of others. Similarly you need to give access to them of your abilities. Download our Business PowerPoint Templates because your product has established a foothold in the market. Customers are happy with the value it brings to their lives.Use these PowerPoint slides for presentations relating to Arrow, art, artistic,background, caricature, chart, childish,circular, creative, design, diagram,doodle, draw, flow, graffiti, graphic,grunge, hand, handwritten, icon,illustration, image, isolated, object, pie, pieces, process, raster,report, retro, rough, scribble, segmented, simple, sketch, sketchy, slices,statistic, styling, succeed, success,symbol. The prominent colors used in the PowerPoint template are Yellow, Black, Gray. Professionals tell us our diverging arrows organizational workflow model Cycle Process Diagram PowerPoint Slide are Fun. People tell us our circular PowerPoint templates and PPT Slides are Efficacious. The feedback we get is that our diverging arrows organizational workflow model Cycle Process Diagram PowerPoint Slide will get their audience's attention. Presenters tell us our background PowerPoint templates and PPT Slides are Luxuriant. You can be sure our diverging arrows organizational workflow model Cycle Process Diagram PowerPoint Slide are Breathtaking. PowerPoint presentation experts tell us our circular PowerPoint templates and PPT Slides are Charming. Add brilliance with our Diverging Arrows Organizational Workflow Model Cycle Process Diagram PowerPoint Slide. You will come out on top.
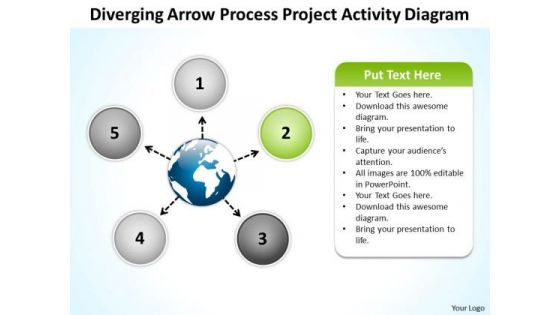
Diverging Arrow Process Project Activity Diagram Circle Radial Chart PowerPoint Slides
We present our diverging arrow process project activity diagram circle Radial Chart PowerPoint Slides.Download and present our Globe PowerPoint Templates because you can Flutter your wings and enchant the world. Impress them with the innate attractiveness of your thoughts and words. Use our Process and Flows PowerPoint Templates because your listeners do not have to put on their thinking caps. Present our Circle Charts PowerPoint Templates because they are Designed to attract the attention of your audience. Present our Ring Charts PowerPoint Templates because it is all there in bits and pieces. Download our Marketing PowerPoint Templates because The marketplace is the merger of your dreams and your ability. Use these PowerPoint slides for presentations relating to Arrow, art, chart, childish,circular, creative, design, diagram,doodle, draw, flow, graffiti, graphic,grunge, hand, handwritten, icon,illustration, image, isolated, object, pie, pieces, process, raster,report, retro, rough, scribble, segmented, simple, sketch, sketchy, slices,statistic, styling, succeed, success,symbol. The prominent colors used in the PowerPoint template are Yellow, Black, Blue. Professionals tell us our diverging arrow process project activity diagram circle Radial Chart PowerPoint Slides effectively help you save your valuable time. People tell us our chart PowerPoint templates and PPT Slides are Upbeat. The feedback we get is that our diverging arrow process project activity diagram circle Radial Chart PowerPoint Slides are Spiffy. Presenters tell us our design PowerPoint templates and PPT Slides are Appealing. You can be sure our diverging arrow process project activity diagram circle Radial Chart PowerPoint Slides are Adorable. PowerPoint presentation experts tell us our creative PowerPoint templates and PPT Slides are Dazzling. Your audience will fawn on you. Our Diverging Arrow Process Project Activity Diagram Circle Radial Chart PowerPoint Slides will certainly capture their fancy.
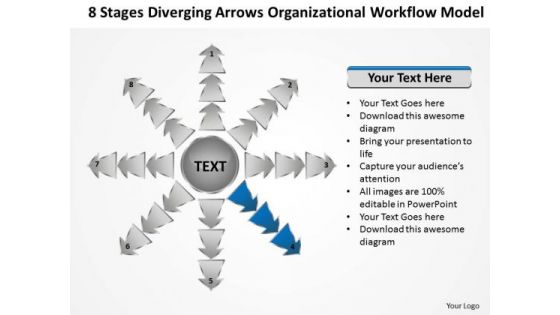
Diverging Arrows Organizational Workflow Model Circular Spoke Diagram PowerPoint Slides
We present our diverging arrows organizational workflow model Circular Spoke Diagram PowerPoint Slides.Use our Process and Flows PowerPoint Templates because you have a clear vision of the cake you want. Use our Arrows PowerPoint Templates because you can Unravel the desired and essential elements of your overall strategy. Download and present our Flow Charts PowerPoint Templates because this is An innovative slide design depicting driving home the relevance of a steady rhythm. Download and present our Marketing PowerPoint Templates because profit is fairly earned in what you believe. Use our Business PowerPoint Templates because you too have got the framework of your companys growth in place.Use these PowerPoint slides for presentations relating to Arrow, art, artistic,background, caricature, chart, childish,circular, creative, design, diagram,doodle, draw, flow, graffiti, graphic,grunge, hand, handwritten, icon,illustration, image, isolated, object, pie, pieces, process, raster,report, retro, rough, scribble, segmented, simple, sketch, sketchy, slices,statistic, styling, succeed, success,symbol. The prominent colors used in the PowerPoint template are Blue, Gray, White. Professionals tell us our diverging arrows organizational workflow model Circular Spoke Diagram PowerPoint Slides are Energetic. People tell us our childish PowerPoint templates and PPT Slides are Elegant. The feedback we get is that our diverging arrows organizational workflow model Circular Spoke Diagram PowerPoint Slides are Fashionable. Presenters tell us our caricature PowerPoint templates and PPT Slides are Great. You can be sure our diverging arrows organizational workflow model Circular Spoke Diagram PowerPoint Slides are readymade to fit into any presentation structure. PowerPoint presentation experts tell us our childish PowerPoint templates and PPT Slides are the best it can get when it comes to presenting. Take your game to the highest level with our Diverging Arrows Organizational Workflow Model Circular Spoke Diagram PowerPoint Slides. Dont waste time struggling with PowerPoint. Let us do it for you.
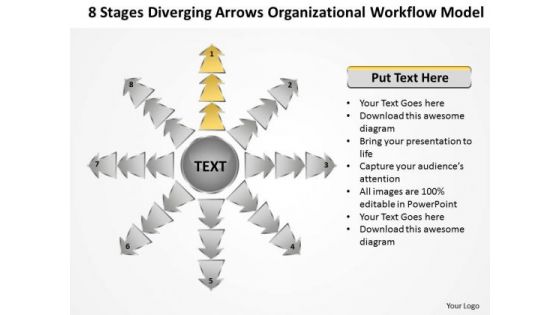
Diverging Arrows Organizational Workflow Model Cycle Process Diagram PowerPoint Slides
We present our diverging arrows organizational workflow model Cycle Process Diagram PowerPoint Slides.Use our Process and Flows PowerPoint Templates because you have it all down to a nicety, slice by slice, layer by layer. Use our Arrows PowerPoint Templates because this is a good example of the strength of teamwork. Download our Flow Charts PowerPoint Templates because this is a wonderful graphics to see the smiles of happiness spread as your audience realizes the value of your words. Present our Marketing PowerPoint Templates because The marketplace is the merger of your dreams and your ability. Download our Business PowerPoint Templates because you are sure you have the right people for your plans.Use these PowerPoint slides for presentations relating to Circular, creative, design, diagram,doodle, draw, flow, graffiti, graphic,grunge, hand, handwritten, icon,illustration, image, isolated, object, pie, pieces, process, raster,report, retro, rough, scribble, segmented, simple, sketch, sketchy, slices,statistic, styling, succeed, success,symbol. The prominent colors used in the PowerPoint template are Gray, Black, White. Professionals tell us our diverging arrows organizational workflow model Cycle Process Diagram PowerPoint Slides will save the presenter time. People tell us our graphic PowerPoint templates and PPT Slides are Tasteful. The feedback we get is that our diverging arrows organizational workflow model Cycle Process Diagram PowerPoint Slides effectively help you save your valuable time. Presenters tell us our doodle PowerPoint templates and PPT Slides are Luxurious. You can be sure our diverging arrows organizational workflow model Cycle Process Diagram PowerPoint Slides are Striking. PowerPoint presentation experts tell us our diagram PowerPoint templates and PPT Slides are One-of-a-kind. Decorate your thoughts with our Diverging Arrows Organizational Workflow Model Cycle Process Diagram PowerPoint Slides. Take full advantage of their colourful appearance.

5 Steps Procedure Magnifying Glass Ppt PowerPoint Presentation Diagrams
This is a 5 steps procedure magnifying glass ppt powerpoint presentation diagrams. This is a five stage process. The stages in this process are technology, business, marketing, communication, success.
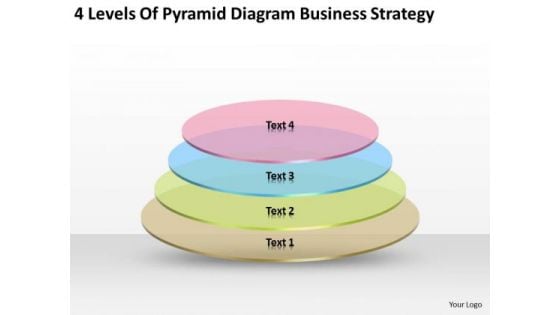
Diagram Business Strategy Formulation Ppt Example Of Small Plan PowerPoint Templates
We present our diagram business strategy formulation ppt example of small plan PowerPoint templates.Download our Circle Charts PowerPoint Templates because You aspire to touch the sky with glory. Let our PowerPoint Templates and Slides provide the fuel for your ascent. Use our Business PowerPoint Templates because Our PowerPoint Templates and Slides offer you the needful to organise your thoughts. Use them to list out your views in a logical sequence. Download and present our Process and Flows PowerPoint Templates because Your success is our commitment. Our PowerPoint Templates and Slides will ensure you reach your goal. Use our Marketing PowerPoint Templates because our PowerPoint Templates and Slides will give your ideas the shape. Download and present our Shapes PowerPoint Templates because you can Add colour to your speech with our PowerPoint Templates and Slides. Your presentation will leave your audience speechless.Use these PowerPoint slides for presentations relating to Abstract, bar, blue, bright, business, button, chart, circle, color, construction, diagram, element, green, group, growth, icon, illustration, layer, layered, level, multicolor, object, performance, progress, rating, reflection, round, set, shape, sign, statistic, symbol, template, website, yellow. The prominent colors used in the PowerPoint template are Pink, Blue, Yellow. Our Diagram Business Strategy Formulation Ppt Example Of Small Plan PowerPoint Templates deliver a blast for a buck. Just a bang is not good enough.

 Home
Home