Dashboard Icon
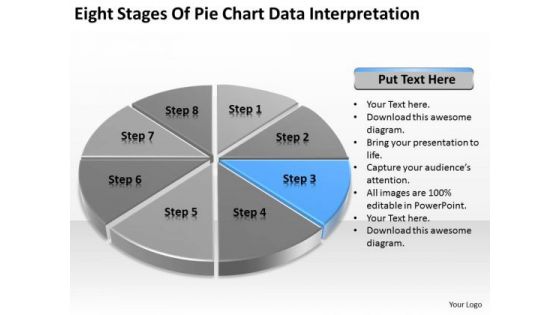
Eight Stages Of Pie Chart Data Interpretation Business Plan PowerPoint Slides
We present our eight stages of pie chart data interpretation business plan PowerPoint Slides.Use our Competition PowerPoint Templates because Our PowerPoint Templates and Slides will let you Clearly mark the path for others to follow. Download and present our Marketing PowerPoint Templates because Our PowerPoint Templates and Slides will weave a web of your great ideas. They are gauranteed to attract even the most critical of your colleagues. Present our Arrows PowerPoint Templates because Our PowerPoint Templates and Slides will let you Hit the target. Go the full distance with ease and elan. Use our Circle Charts PowerPoint Templates because You have gained great respect for your brilliant ideas. Use our PowerPoint Templates and Slides to strengthen and enhance your reputation. Download our Business PowerPoint Templates because You are an avid believer in ethical practices. Highlight the benefits that accrue with our PowerPoint Templates and Slides.Use these PowerPoint slides for presentations relating to chart, graph, pie, 3d, diagram, graphic, icon, control, business, data, profit, market, sales, display, corporate, concept, render, success, presentation, finance, report, marketing, accounting, management, piece, strategy, money, growth, company, competition, progress, account, sheet, part, information, investment, improvement, banking, index, financial, reflect, results, performance, exchange. The prominent colors used in the PowerPoint template are Blue, Black, Gray. Great presentations happen with our Eight Stages Of Pie Chart Data Interpretation Business Plan PowerPoint Slides. Try us out and see what a difference our templates make.
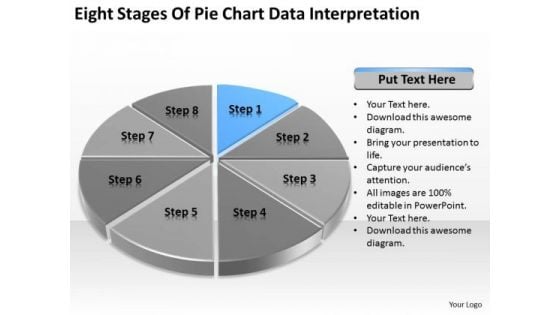
Eight Stages Of Pie Chart Data Interpretation Business Plan PowerPoint Templates
We present our eight stages of pie chart data interpretation business plan PowerPoint templates.Download and present our Competition PowerPoint Templates because Our PowerPoint Templates and Slides will embellish your thoughts. See them provide the desired motivation to your team. Download and present our Marketing PowerPoint Templates because You should Press the right buttons with our PowerPoint Templates and Slides. They will take your ideas down the perfect channel. Download our Arrows PowerPoint Templates because Your ideas provide food for thought. Our PowerPoint Templates and Slides will help you create a dish to tickle the most discerning palate. Use our Circle Charts PowerPoint Templates because You can Raise a toast with our PowerPoint Templates and Slides. Spread good cheer amongst your audience. Download and present our Business PowerPoint Templates because Our PowerPoint Templates and Slides will let your ideas bloom. Create a bed of roses for your audience.Use these PowerPoint slides for presentations relating to chart, graph, pie, 3d, diagram, graphic, icon, control, business, data, profit, market, sales, display, corporate, concept, render, success, presentation, finance, report, marketing, accounting, management, piece, strategy, money, growth, company, competition, progress, account, sheet, part, information, investment, improvement, banking, index, financial, reflect, results, performance, exchange. The prominent colors used in the PowerPoint template are Blue, Black, Gray. Our Eight Stages Of Pie Chart Data Interpretation Business Plan PowerPoint Templates capture the attention of your audience. With our money back guarantee you have nothing to lose.
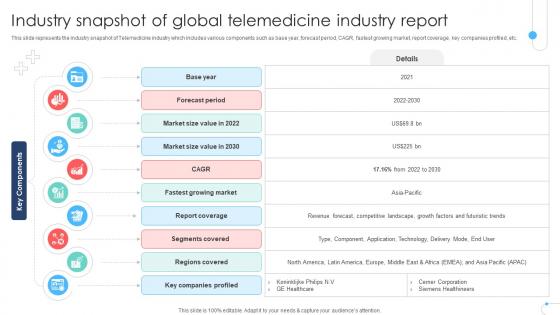
Industry Snapshot Of Global Telemedicine Industry Report Remote Healthcare Services IR SS V
This slide represents the industry snapshot of Telemedicine industry which includes various components such as base year, forecast period, CAGR, fastest growing market, report coverage, key companies profiled, etc. If you are looking for a format to display your unique thoughts, then the professionally designed Industry Snapshot Of Global Telemedicine Industry Report Remote Healthcare Services IR SS V is the one for you. You can use it as a Google Slides template or a PowerPoint template. Incorporate impressive visuals, symbols, images, and other charts. Modify or reorganize the text boxes as you desire. Experiment with shade schemes and font pairings. Alter, share or cooperate with other people on your work. Download Industry Snapshot Of Global Telemedicine Industry Report Remote Healthcare Services IR SS V and find out how to give a successful presentation. Present a perfect display to your team and make your presentation unforgettable. This slide represents the industry snapshot of Telemedicine industry which includes various components such as base year, forecast period, CAGR, fastest growing market, report coverage, key companies profiled, etc.
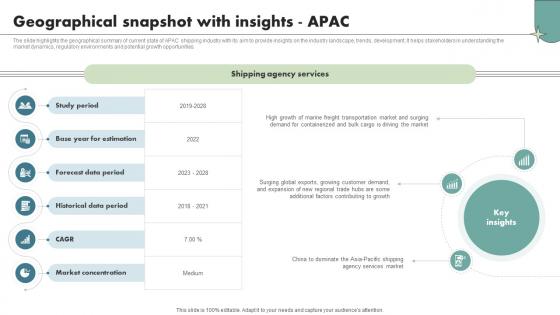
Geographical Snapshot With Insights Apac Maritime Shipping Industry IR SS V
The slide highlights the geographical summary of current state of APAC shipping industry with its aim to provide insights on the industry landscape, trends, development. It helps stakeholders in understanding the market dynamics, regulatory environments and potential growth opportunities. Whether you have daily or monthly meetings, a brilliant presentation is necessary. Geographical Snapshot With Insights Apac Maritime Shipping Industry IR SS V can be your best option for delivering a presentation. Represent everything in detail using Geographical Snapshot With Insights Apac Maritime Shipping Industry IR SS V and make yourself stand out in meetings. The template is versatile and follows a structure that will cater to your requirements. All the templates prepared by Slidegeeks are easy to download and edit. Our research experts have taken care of the corporate themes as well. So, give it a try and see the results. The slide highlights the geographical summary of current state of APAC shipping industry with its aim to provide insights on the industry landscape, trends, development. It helps stakeholders in understanding the market dynamics, regulatory environments and potential growth opportunities.
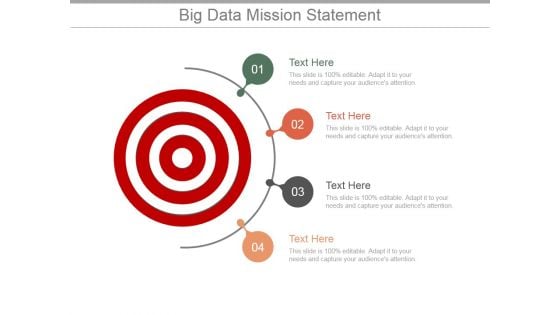
Big Data Mission Statement Ppt PowerPoint Presentation Layouts
This is a big data mission statement ppt powerpoint presentation layouts. This is a four stage process. The stages in this process are business, icons, marketing, process, management, statement.
Personal Data Visualization On Computer Screen Ppt PowerPoint Presentation Show Layout Ideas
Presenting this set of slides with name personal data visualization on computer screen ppt powerpoint presentation show layout ideas. This is a one stage process. The stages in this process are data visualization icon, research analysis, business focus. This is a completely editable PowerPoint presentation and is available for immediate download. Download now and impress your audience.

Big Data Future Scope Ribbon Ppt PowerPoint Presentation Designs Download
This is a big data future scope ribbon ppt powerpoint presentation designs download. This is a four stage process. The stages in this process are icons, business, marketing, management, presentation.
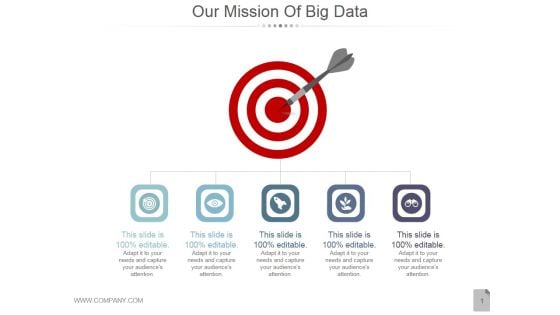
Our Mission Of Big Data Ppt PowerPoint Presentation Visuals
This is a our mission of big data ppt powerpoint presentation visuals. This is a five stage process. The stages in this process are targets, business, marketing, success, icons.
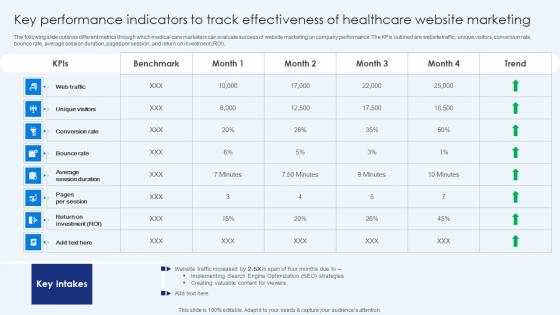
Key Performance Indicators To Track Effectiveness Healthcare Promotion Portrait Pdf
The following slide outlines different metrics through which medical care marketers can evaluate success of website marketing on company performance. The KPIs outlined are website traffic, unique visitors, conversion rate, bounce rate, average session duration, pages per session, and return on investment ROI. Are you searching for a Key Performance Indicators To Track Effectiveness Healthcare Promotion Portrait Pdf that is uncluttered, straightforward, and original Its easy to edit, and you can change the colors to suit your personal or business branding. For a presentation that expresses how much effort you have put in, this template is ideal With all of its features, including tables, diagrams, statistics, and lists, its perfect for a business plan presentation. Make your ideas more appealing with these professional slides. Download Key Performance Indicators To Track Effectiveness Healthcare Promotion Portrait Pdffrom Slidegeeks today. The following slide outlines different metrics through which medical care marketers can evaluate success of website marketing on company performance. The KPIs outlined are website traffic, unique visitors, conversion rate, bounce rate, average session duration, pages per session, and return on investment ROI.
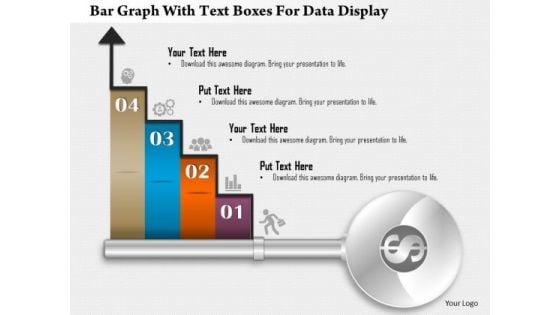
Business Diagram Bar Graph With Text Boxes For Data Display Presentation Template
Our above business diagram displays bar graph. It contains four steps on bar graph with icons. Use this diagram to display four stages of business growth. Download this Power Point slide to build quality presentation for your viewers.
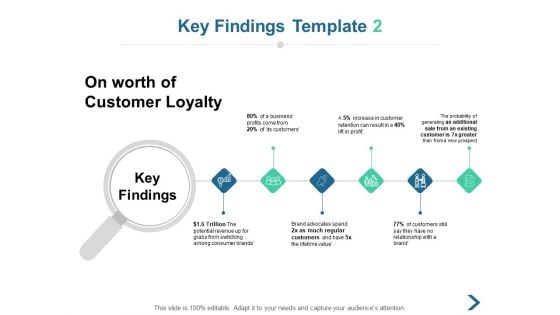
Key Findings Customer Loyalty Ppt PowerPoint Presentation Styles Slide Portrait
Presenting this set of slides with name key findings customer loyalty ppt powerpoint presentation styles slide portrait. This is a six stage process. The stages in this process are business, icons, planning, strategy, marketing. This is a completely editable PowerPoint presentation and is available for immediate download. Download now and impress your audience.

Global Data Security Industry Report Overview Of Cybersecurity Market Landscape IR SS V
The slide highlights a comprehensive overview of the cyber security industry. The purpose of the slide is to provide insights to stakeholders enabling them to make strategic decisions. The slide covers market sizing, and statistics related to cybersecurity spending, cybercrimes, and venture funding. This modern and well-arranged Global Data Security Industry Report Overview Of Cybersecurity Market Landscape IR SS V provides lots of creative possibilities. It is very simple to customize and edit with the Powerpoint Software. Just drag and drop your pictures into the shapes. All facets of this template can be edited with Powerpoint, no extra software is necessary. Add your own material, put your images in the places assigned for them, adjust the colors, and then you can show your slides to the world, with an animated slide included. The slide highlights a comprehensive overview of the cyber security industry. The purpose of the slide is to provide insights to stakeholders enabling them to make strategic decisions. The slide covers market sizing, and statistics related to cybersecurity spending, cybercrimes, and venture funding.
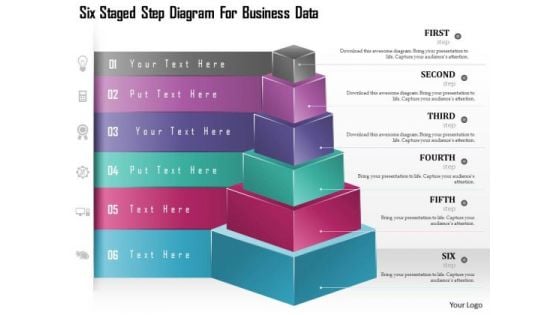
Business Diagram Six Staged Step Diagram For Business Data Presentation Template
Download this diagram to display business development strategies, business plans, decisions, and stages. This Business diagram contains graphics of six steps cubes with icons. Present your views using this innovative slide and be assured of leaving a lasting impression.
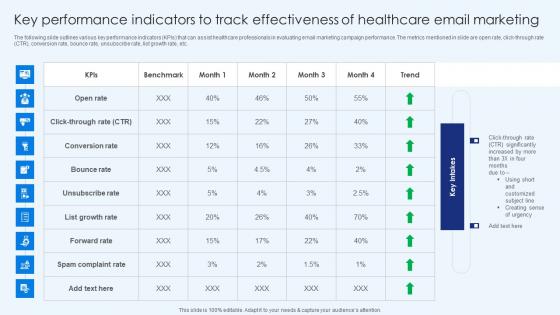
Key Performance Indicators To Track Effectiveness Of Healthcare Promotion Download Pdf
The following slide outlines various key performance indicators KPIs that can assist healthcare professionals in evaluating email marketing campaign performance. The metrics mentioned in slide are open rate, click-through rate CTR, conversion rate, bounce rate, unsubscribe rate, list growth rate, etc. Retrieve professionally designed Key Performance Indicators To Track Effectiveness Of Healthcare Promotion Download Pdf to effectively convey your message and captivate your listeners. Save time by selecting pre-made slideshows that are appropriate for various topics, from business to educational purposes. These themes come in many different styles, from creative to corporate, and all of them are easily adjustable and can be edited quickly. Access them as PowerPoint templates or as Google Slides themes. You do not have to go on a hunt for the perfect presentation because Slidegeeks got you covered from everywhere. The following slide outlines various key performance indicators KPIs that can assist healthcare professionals in evaluating email marketing campaign performance. The metrics mentioned in slide are open rate, click-through rate CTR, conversion rate, bounce rate, unsubscribe rate, list growth rate, etc.
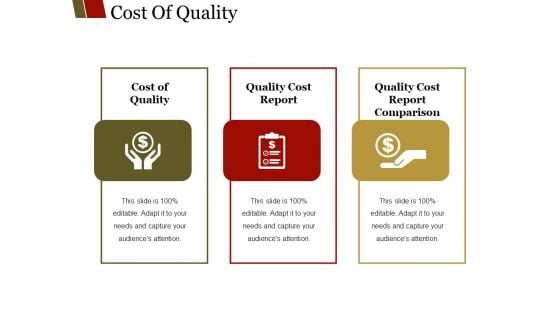
Cost Of Quality Template 1 Ppt PowerPoint Presentation Slides Background Images
This is a cost of quality template 1 ppt powerpoint presentation slides background images. This is a three stage process. The stages in this process are cost of quality, quality cost report, quality cost report comparison, business, icons.
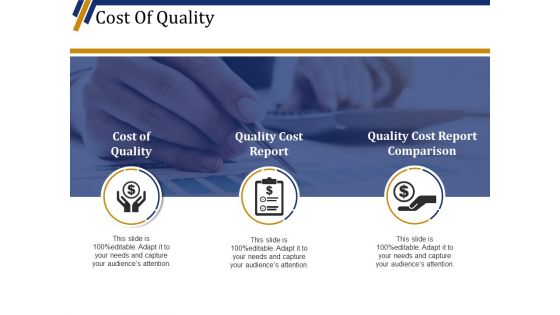
Cost Of Quality Template 1 Ppt PowerPoint Presentation Professional Show
This is a cost of quality template 1 ppt powerpoint presentation professional show. This is a three stage process. The stages in this process are cost of quality, quality cost report, quality cost report comparison, icons, business.
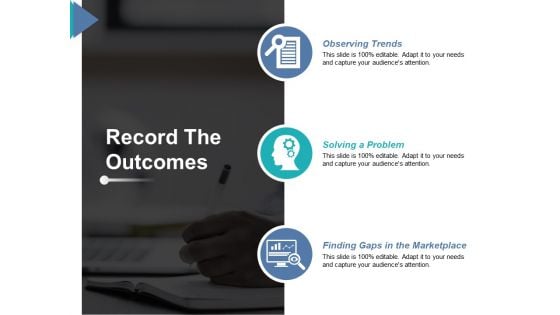
Record The Outcomes Personal Enterprise Plan Ppt PowerPoint Presentation Inspiration Format Ideas
This is a record the outcomes personal enterprise plan ppt powerpoint presentation inspiration format ideas. This is a three stage process. The stages in this process are icon, business, observing trends, solving a problem, finding gaps in the marketplace.
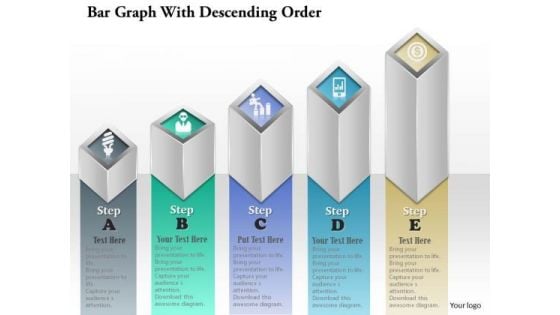
Business Diagram Bar Graph With Ascending Order Presentation Template
Our above diagram displays bar graph in ascending order. It contains bar graph with business icons. Use this amazing diagram for business communication or to present business reports. Download this diagram as a tool for business presentations.
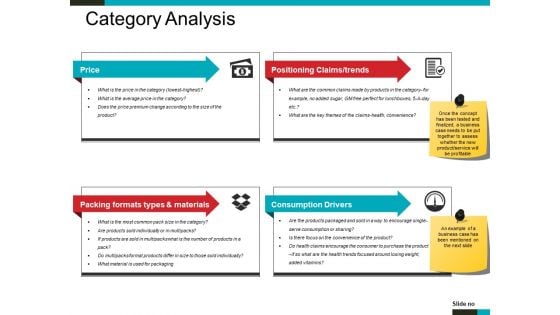
Category Analysis Ppt PowerPoint Presentation Show Aids
This is a category analysis ppt powerpoint presentation show aids. This is a four stage process. The stages in this process are price, icons, packing formats types and materials, positioning claims trends, consumption drivers.
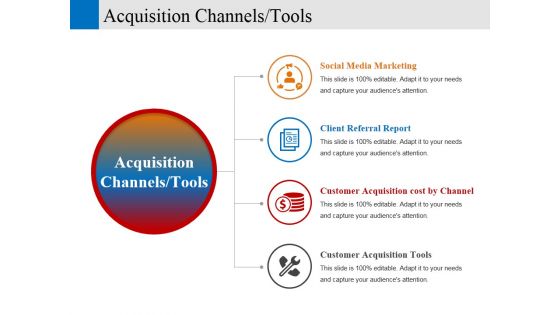
acquisition channels tools ppt powerpoint presentation portfolio diagrams
This is a acquisition channels tools ppt powerpoint presentation portfolio diagrams. This is a four stage process. The stages in this process are social media marketing, client referral report, customer acquisition cost by channel, customer acquisition tools, business, icons.
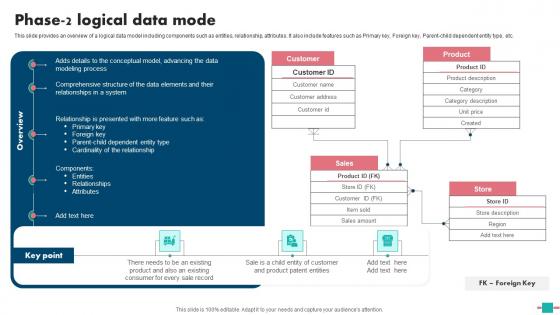
Database Modeling Phase 2 Logical Data Mode Themes Pdf
This slide provides an overview of a logical data model including components such as entities, relationship, attributes. It also include features such as Primary key, Foreign key, Parent child dependent entity type, etc. Crafting an eye catching presentation has never been more straightforward. Let your presentation shine with this tasteful yet straightforward Database Modeling Phase 2 Logical Data Mode Themes Pdf template. It offers a minimalistic and classy look that is great for making a statement. The colors have been employed intelligently to add a bit of playfulness while still remaining professional. Construct the ideal Database Modeling Phase 2 Logical Data Mode Themes Pdf that effortlessly grabs the attention of your audience Begin now and be certain to wow your customers This slide provides an overview of a logical data model including components such as entities, relationship, attributes. It also include features such as Primary key, Foreign key, Parent child dependent entity type, etc.
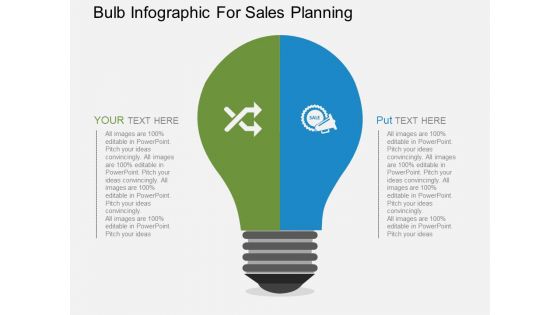
Bulb Infographic For Sales Planning Powerpoint Templates
This PowerPoint slide contains graphics of bulb diagram with icons. It helps to exhibit concepts of sales planning. Use this diagram to impart more clarity to data and to create more sound impact on viewers.
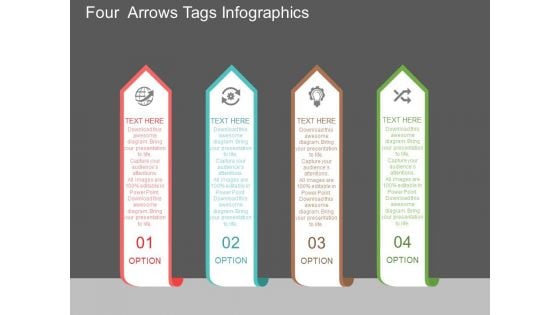
Four Arrows Tags Infographics Powerpoint Template
The above PowerPoint slide displays four arrows design with icons. This PowerPoint diagram helps to summarize complex business data. Adjust the above diagram in your business presentations to visually support your content.
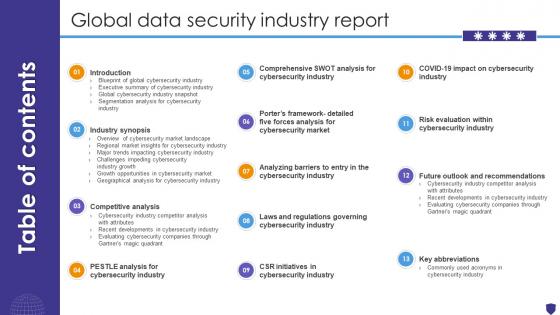
Table Of Contents For Global Data Security Industry Report IR SS V
Retrieve professionally designed Table Of Contents For Global Data Security Industry Report IR SS V to effectively convey your message and captivate your listeners. Save time by selecting pre-made slideshows that are appropriate for various topics, from business to educational purposes. These themes come in many different styles, from creative to corporate, and all of them are easily adjustable and can be edited quickly. Access them as PowerPoint templates or as Google Slides themes. You do not have to go on a hunt for the perfect presentation because Slidegeeks got you covered from everywhere. Our Table Of Contents For Global Data Security Industry Report IR SS V are topically designed to provide an attractive backdrop to any subject. Use them to look like a presentation pro.
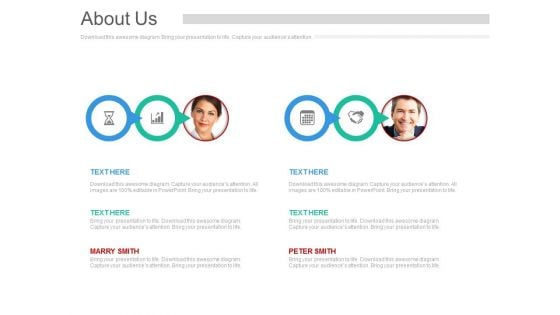
Business Team About Us Page Powerpoint Slides
This PowerPoint template has been designed with team pictures and business icons. This diagram is excellent visual tools to present teams strategic planning. Download this PPT slide to explain complex data immediately and clearly.
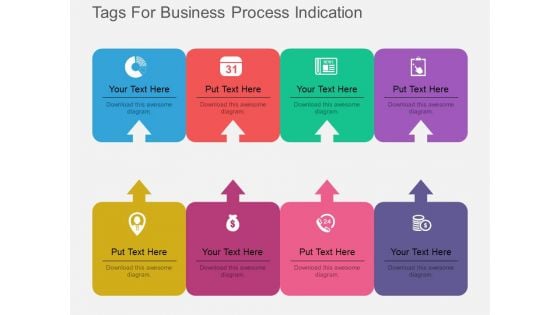
Eight Tags For Business Process Indication Powerpoint Template
Our above PPT slide contains graphics of eight text tags with icons. This PowerPoint template may be used to display business process steps. Use this diagram to impart more clarity to data and to create more sound impact on viewers.
Five Banners For Nature And Finance Process Flow Powerpoint Template
This PowerPoint template has been designed with five banners nature, finance icons. This diagram is excellent visual tools for business presentations. Download this PPT slide to explain complex data immediately and clearly.
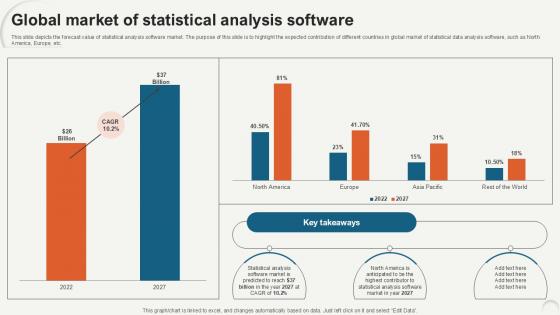
Global Market Of Statistical Data Analytics For Informed Decision Ppt PowerPoint
This slide depicts the forecast value of statistical analysis software market. The purpose of this slide is to highlight the expected contribution of different countries in global market of statistical data analysis software, such as North America, Europe, etc. Are you in need of a template that can accommodate all of your creative concepts This one is crafted professionally and can be altered to fit any style. Use it with Google Slides or PowerPoint. Include striking photographs, symbols, depictions, and other visuals. Fill, move around, or remove text boxes as desired. Test out color palettes and font mixtures. Edit and save your work, or work with colleagues. Download Global Market Of Statistical Data Analytics For Informed Decision Ppt PowerPoint and observe how to make your presentation outstanding. Give an impeccable presentation to your group and make your presentation unforgettable. This slide depicts the forecast value of statistical analysis software market. The purpose of this slide is to highlight the expected contribution of different countries in global market of statistical data analysis software, such as North America, Europe, etc.
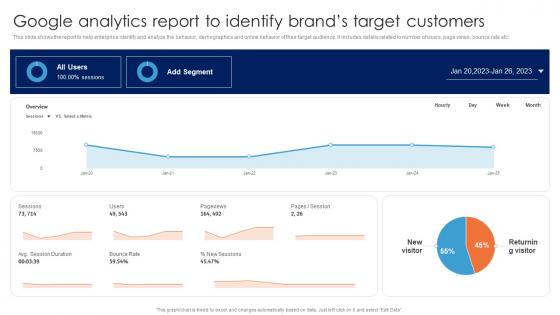
Google Analytics Report To Identify Brands Guide For Data Driven Advertising Infographics Pdf
This slide shows the report to help enterprise identify and analyze the behavior, demographics and online behavior of their target audience. It includes details related to number of users, page views, bounce rate etc.Slidegeeks is one of the best resources for PowerPoint templates. You can download easily and regulate Google Analytics Report To Identify Brands Guide For Data Driven Advertising Infographics Pdf for your personal presentations from our wonderful collection. A few clicks is all it takes to discover and get the most relevant and appropriate templates. Use our Templates to add a unique zing and appeal to your presentation and meetings. All the slides are easy to edit and you can use them even for advertisement purposes. This slide shows the report to help enterprise identify and analyze the behavior, demographics and online behavior of their target audience. It includes details related to number of users, page views, bounce rate etc.
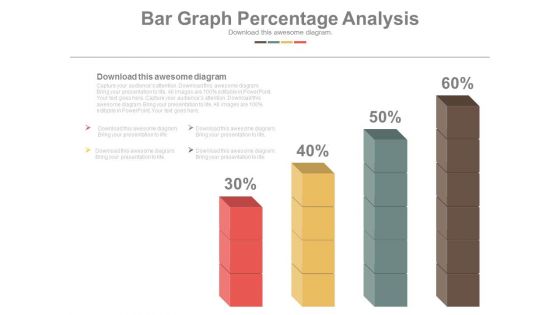
Bar Graph Displaying Profit Growth Powerpoint Slides
This PowerPoint template has been designed with six point?s bar graph with icons. This PPT slide can be used to prepare presentations for marketing reports and also for financial data analysis. You can download finance PowerPoint template to prepare awesome presentations.
7 Stages Analysis And Implementation Process Business Plan Template PowerPoint Slides
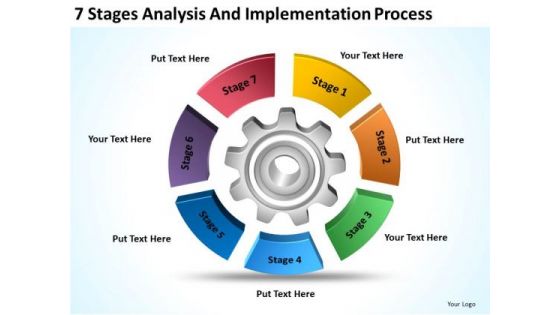
We present our 7 stages analysis and implementation process business plan template PowerPoint Slides.Download our Gear Wheels PowerPoint Templates because Watching this your Audience will Grab their eyeballs, they wont even blink. Download our Circle Charts PowerPoint Templates because They will Put the wind in your sails. Skim smoothly over the choppy waters of the market. Use our Business PowerPoint Templates because Our PowerPoint Templates and Slides will help you be quick off the draw. Just enter your specific text and see your points hit home. Download and present our Process and Flows PowerPoint Templates because You can Inspire your team with our PowerPoint Templates and Slides. Let the force of your ideas flow into their minds. Download our Shapes PowerPoint Templates because Your ideas provide food for thought. Our PowerPoint Templates and Slides will help you create a dish to tickle the most discerning palate.Use these PowerPoint slides for presentations relating to Chart, gear, pie, icon, profit, business, vector, wheel, isolated, white, concept, success, presentation, symbol, diagram, graphic, finance, data, calculate, cog, report, marketing, shape, management, piece, progress, part, investment,statistic, financial, editable, portion, performance. The prominent colors used in the PowerPoint template are Orange, Yellow, Green. Our 7 Stages Analysis And Implementation Process Business Plan Template PowerPoint Slides have a high degree of quality. Every element gets close attention.
Potential Use Cases Of Incorporating Data Analytics And Reporting Tool Strategies For Success In Digital
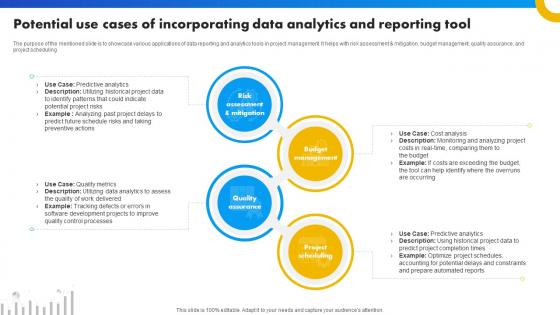
The purpose of the mentioned slide is to showcase various applications of data reporting and analytics tools in project management. It helps with risk assessment and mitigation, budget management, quality assurance, and project scheduling. Are you searching for a Potential Use Cases Of Incorporating Data Analytics And Reporting Tool Strategies For Success In Digital that is uncluttered, straightforward, and original Its easy to edit, and you can change the colors to suit your personal or business branding. For a presentation that expresses how much effort you have put in, this template is ideal With all of its features, including tables, diagrams, statistics, and lists, its perfect for a business plan presentation. Make your ideas more appealing with these professional slides. Download Potential Use Cases Of Incorporating Data Analytics And Reporting Tool Strategies For Success In Digital from Slidegeeks today. The purpose of the mentioned slide is to showcase various applications of data reporting and analytics tools in project management. It helps with risk assessment and mitigation, budget management, quality assurance, and project scheduling.
Templates Statistical Pie Diagram 6 Stages Ppt Steps To Making Business Plan PowerPoint Slides
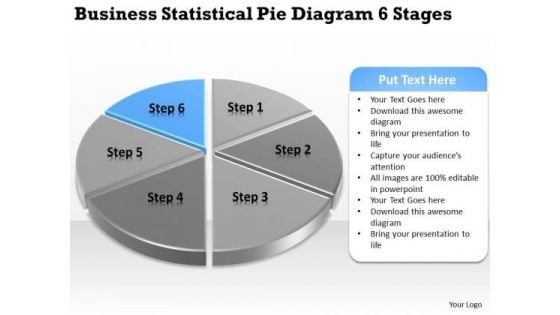
We present our templates statistical pie diagram 6 stages ppt steps to making business plan PowerPoint Slides.Download and present our Circle Charts PowerPoint Templates because They will Put the wind in your sails. Skim smoothly over the choppy waters of the market. Present our Marketing PowerPoint Templates because You should Ascend the ladder of success with ease. Our PowerPoint Templates and Slides will provide strong and sturdy steps. Download our Business PowerPoint Templates because It will Raise the bar of your Thoughts. They are programmed to take you to the next level. Download and present our Flow Charts PowerPoint Templates because It can be used to Set your controls for the heart of the sun. Our PowerPoint Templates and Slides will be the propellant to get you there. Present our Process and Flows PowerPoint Templates because you can Set pulses racing with our PowerPoint Templates and Slides. They will raise the expectations of your team.Use these PowerPoint slides for presentations relating to Chart, pie, diagram, slice, icon, market, statistics, sales, economy, green, achievement, corporate,business, sign, render, success, presentation, symbol,circle, graphic, finance,marketing, shape, graph, illustration, piece, division, money, growth, company, progress, profit, information, part, investment, improvement, financial . The prominent colors used in the PowerPoint template are Blue, Gray, Black. Put your thoughts on the anvil. Fashion them with our Templates Statistical Pie Diagram 6 Stages Ppt Steps To Making Business Plan PowerPoint Slides.
Templates Statistical Pie Diagram 6 Stages Show Me Business Plan PowerPoint
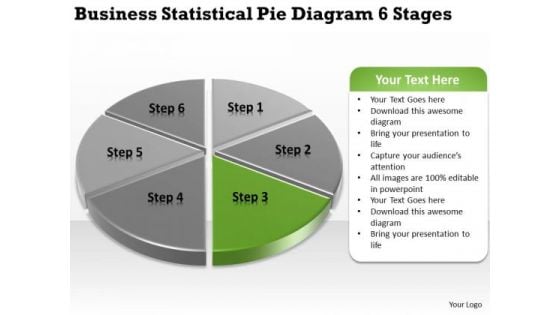
We present our templates statistical pie diagram 6 stages show me business plan PowerPoint.Use our Circle Charts PowerPoint Templates because You can Bask in the warmth of our PowerPoint Templates and Slides. Enjoy the heartfelt glowing response of your listeners. Download our Marketing PowerPoint Templates because Our PowerPoint Templates and Slides will Activate the energies of your audience. Get their creative juices flowing with your words. Download our Business PowerPoint Templates because Our PowerPoint Templates and Slides ensures Effective communication. They help you put across your views with precision and clarity. Use our Flow Charts PowerPoint Templates because Our PowerPoint Templates and Slides are truly out of this world. Even the MIB duo has been keeping tabs on our team. Use our Process and Flows PowerPoint Templates because It can be used to Set your controls for the heart of the sun. Our PowerPoint Templates and Slides will be the propellant to get you there.Use these PowerPoint slides for presentations relating to Chart, pie, diagram, slice, icon, market, statistics, sales, economy, green, achievement, corporate,business, sign, render, success, presentation, symbol,circle, graphic, finance,marketing, shape, graph, illustration, piece, division, money, growth, company, progress, profit, information, part, investment, improvement, financial . The prominent colors used in the PowerPoint template are Green, Gray, Black. Maintain growth with our Templates Statistical Pie Diagram 6 Stages Show Me Business Plan PowerPoint. Download without worries with our money back guaranteee.
5 Concentric Shapes Statistical Researches Ppt How Business Plan PowerPoint Slides
We present our 5 concentric shapes statistical researches ppt how business plan PowerPoint Slides.Download our Business PowerPoint Templates because Our PowerPoint Templates and Slides are specially created by a professional team with vast experience. They diligently strive to come up with the right vehicle for your brilliant Ideas. Present our Marketing PowerPoint Templates because You have the co-ordinates for your destination of success. Let our PowerPoint Templates and Slides map out your journey. Present our Process and Flows PowerPoint Templates because Our PowerPoint Templates and Slides will let you Hit the right notes. Watch your audience start singing to your tune. Present our Shapes PowerPoint Templates because Our PowerPoint Templates and Slides are like the strings of a tennis racquet. Well strung to help you serve aces. Download and present our Flow Charts PowerPoint Templates because Our PowerPoint Templates and Slides will let you Clearly mark the path for others to follow.Use these PowerPoint slides for presentations relating to Star, icon, blue, website, isolated, business, concept, vector, sign, render, glossy, internet, shadow, value, element, security, equipment, cute, illustration, sale, web, real, info, information, conceptual, environment, button. The prominent colors used in the PowerPoint template are Blue, Blue light, Blue navy. Be a self-starter with our 5 Concentric Shapes Statistical Researches Ppt How Business Plan PowerPoint Slides. They will make you look good.
PowerPoint Arrow Shapes Comparison Process Ppt Templates Backgrounds For Slides
3d, accounting, arrow, art, bar, blue, business, calculation, chart, collection, company, design elements, diagram, directive, expense, finance, firm, forecast, future, gain, graph, grow, growth, icon, illustration, income, line, market, measure, objects, office, profit, progress, rate, set, statistic, stock, success, two, up, vector, yellow Get on the list of audience favourites. Experience adulation with our PowerPoint Arrow Shapes Comparison Process Ppt Templates Backgrounds For Slides.
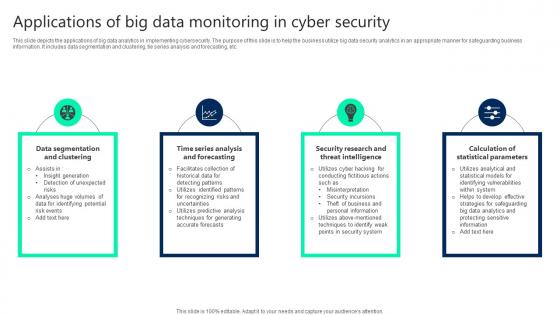
Applications Of Big Data Monitoring In Cyber Security Themes pdf
This slide depicts the applications of big data analytics in implementing cybersecurity. The purpose of this slide is to help the business utilize big data security analytics in an appropriate manner for safeguarding business information. It includes data segmentation and clustering, tie series analysis and forecasting, etc. Pitch your topic with ease and precision using this Applications Of Big Data Monitoring In Cyber Security Themes pdf. This layout presents information on Data Segmentation, Security Research, Threat Intelligence. It is also available for immediate download and adjustment. So, changes can be made in the color, design, graphics or any other component to create a unique layout. This slide depicts the applications of big data analytics in implementing cybersecurity. The purpose of this slide is to help the business utilize big data security analytics in an appropriate manner for safeguarding business information. It includes data segmentation and clustering, tie series analysis and forecasting, etc.
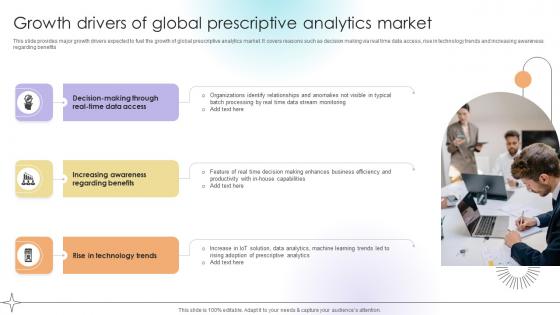
Growth Drivers Of Global Prescriptive Analytics Market Data Analytics SS V
This slide provides major growth drivers expected to fuel the growth of global prescriptive analytics market. It covers reasons such as decision making via real time data access, rise in technology trends and increasing awareness regarding benefits.Do you know about Slidesgeeks Growth Drivers Of Global Prescriptive Analytics Market Data Analytics SS V These are perfect for delivering any kind od presentation. Using it, create PowerPoint presentations that communicate your ideas and engage audiences. Save time and effort by using our pre-designed presentation templates that are perfect for a wide range of topic. Our vast selection of designs covers a range of styles, from creative to business, and are all highly customizable and easy to edit. Download as a PowerPoint template or use them as Google Slides themes. This slide provides major growth drivers expected to fuel the growth of global prescriptive analytics market. It covers reasons such as decision making via real time data access, rise in technology trends and increasing awareness regarding benefits.
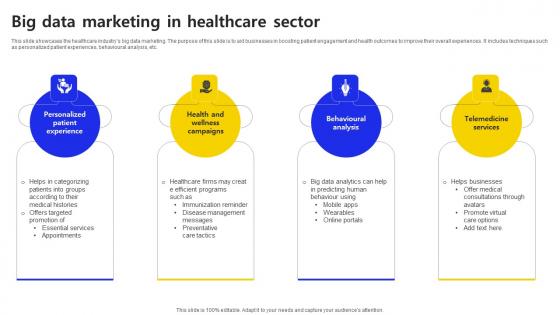
Big Data Marketing In Healthcare Sector Ppt Outline Themes PDF
This slide showcases the healthcare industrys big data marketing. The purpose of this slide is to aid businesses in boosting patient engagement and health outcomes to improve their overall experiences. It includes techniques such as personalized patient experiences, behavioural analysis, etc. Pitch your topic with ease and precision using this Big Data Marketing In Healthcare Sector Ppt Outline Themes PDF. This layout presents information on Techniques, Personalized Patient Experiences, Behavioural Analysis. It is also available for immediate download and adjustment. So, changes can be made in the color, design, graphics or any other component to create a unique layout. This slide showcases the healthcare industrys big data marketing. The purpose of this slide is to aid businesses in boosting patient engagement and health outcomes to improve their overall experiences. It includes techniques such as personalized patient experiences, behavioural analysis, etc.
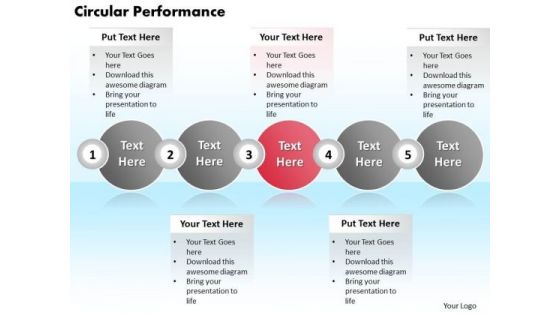
Ppt Circular Performance Of 5 Steps Involved Procedure PowerPoint Templates
PPT circular performance of 5 steps involved procedure PowerPoint Templates-Create visually stimulating Microsoft office PPT Presentations with our above Diagram. This image has been professionally designed to emphasize the concept of interrelated issues, Approaches or Methods. This Business Diagram can be used in Marketing, Banking, and Management etc. -PPT circular performance of 5 steps involved procedure PowerPoint Templates-Abstract, Art, Artistic, Backdrop, Background, Bend, Black, Business, Circle, Copy-Space, Create, Design, Dot, Dotted, Draw, Element, Flower, Gradient, Grid, Icon, Illustration, Leaf, Leaves, Logo, Mold, Motif, Nature, Pattern, Petal, Radiate, Retro, Round Bet a quid on our Ppt Circular Performance Of 5 Steps Involved Procedure PowerPoint Templates. You will end up a 49er.
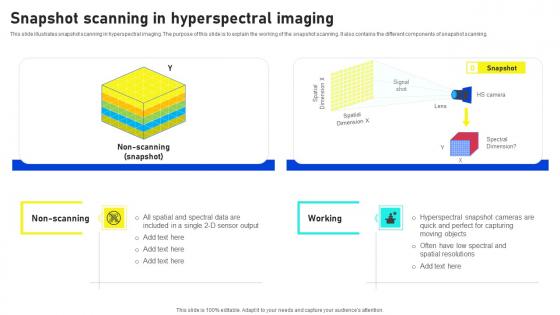
Snapshot Scanning In Hyperspectral Imaging Hyperspectral Imaging Sensors And Systems Mockup Pdf
This slide illustrates snapshot scanning in hyperspectral imaging. The purpose of this slide is to explain the working of the snapshot scanning. It also contains the different components of snapshot scanning. Retrieve professionally designed Snapshot Scanning In Hyperspectral Imaging Hyperspectral Imaging Sensors And Systems Mockup Pdf to effectively convey your message and captivate your listeners. Save time by selecting pre made slideshows that are appropriate for various topics, from business to educational purposes. These themes come in many different styles, from creative to corporate, and all of them are easily adjustable and can be edited quickly. Access them as PowerPoint templates or as Google Slides themes. You do not have to go on a hunt for the perfect presentation because Slidegeeks got you covered from everywhere. This slide illustrates snapshot scanning in hyperspectral imaging. The purpose of this slide is to explain the working of the snapshot scanning. It also contains the different components of snapshot scanning.
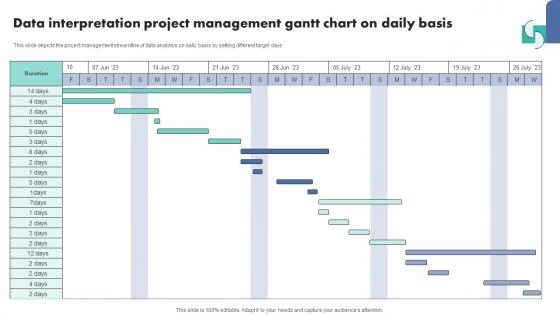
Data Interpretation Project Management Gantt Chart On Daily Basis Template Pdf
Showcasing this set of slides titled Data Interpretation Project Management Gantt Chart On Daily Basis Template Pdf The topics addressed in these templates are Data Interpretation Icon, Measure Business Growth All the content presented in this PPT design is completely editable. Download it and make adjustments in color, background, font etc. as per your unique business setting. Our Data Interpretation Project Management Gantt Chart On Daily Basis Template Pdf are topically designed to provide an attractive backdrop to any subject. Use them to look like a presentation pro.

Employee Competency Assessment Table Ppt PowerPoint Presentation Ideas Graphics Download
Presenting this set of slides with name employee competency assessment table ppt powerpoint presentation ideas graphics download. The topics discussed in these slides are capabilities, data analysis, data visualization, table, icons. This is a completely editable PowerPoint presentation and is available for immediate download. Download now and impress your audience.

Woman Analyzing Market Report Ppt PowerPoint Presentation Complete Deck
Presenting this set of slides with name woman analyzing market report ppt powerpoint presentation complete deck. The topics discussed in these slides are employee icon, employee working laptop, financial reports, analyzing, market report. This is a completely editable PowerPoint presentation and is available for immediate download. Download now and impress your audience.
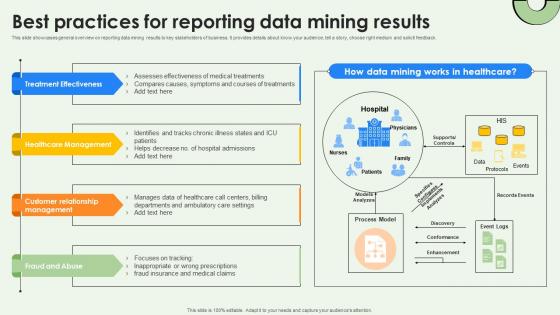
Data Warehousing And Best Practices For Reporting Data Mining Results AI SS V
This slide showcases general overview on reporting data mining results to key stakeholders of business. It provides details about know your audience, tell a story, choose right medium and solicit feedback. Are you searching for a Data Warehousing And Best Practices For Reporting Data Mining Results AI SS V that is uncluttered, straightforward, and original Its easy to edit, and you can change the colors to suit your personal or business branding. For a presentation that expresses how much effort you have put in, this template is ideal With all of its features, including tables, diagrams, statistics, and lists, its perfect for a business plan presentation. Make your ideas more appealing with these professional slides. Download Data Warehousing And Best Practices For Reporting Data Mining Results AI SS V from Slidegeeks today. This slide showcases general overview on reporting data mining results to key stakeholders of business. It provides details about know your audience, tell a story, choose right medium and solicit feedback.

Executive Powerpoint Ppt Template Bundles
This Executive Powerpoint Ppt Template Bundles is designed to help you retain your audiences attention. This content-ready PowerPoint Template enables you to take your audience on a journey and share information in a way that is easier to recall. It helps you highlight the crucial parts of your work so that the audience does not get saddled with information download. This twenty-slide PPT Deck comes prepared with the graphs and charts you could need to showcase your information through visuals. You only need to enter your own data in them. Download this editable PowerPoint Theme and walk into that meeting with confidence. The Executive template bundle is a comprehensive collection of dynamic,easy-to-use slides designed to elevate your presentations. It includes slides for the company executive search process,job description,hiring plan,training process and strategies,etc. Perfect for HR leaders,recruiters,and corporate trainers for outlining recruitment strategies,presenting training roadmaps,or analyzing company performance with the help of dashboards. With easy-to-edit features,this bundle allows you to tailor content to your specific needs,ensuring professional and effective communication every time.
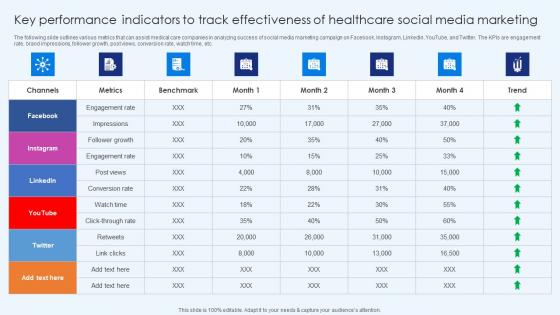
Key Performance Indicators To Tracks Effectiveness Healthcare Promotion Diagrams Pdf
The following slide outlines various metrics that can assist medical care companies in analyzing success of social media marketing campaign on Facebook, Instagram, LinkedIn, YouTube, and Twitter. The KPIs are engagement rate, brand impressions, follower growth, post views, conversion rate, watch time, etc. Slidegeeks has constructed Key Performance Indicators To Tracks Effectiveness Healthcare Promotion Diagrams Pdf after conducting extensive research and examination. These presentation templates are constantly being generated and modified based on user preferences and critiques from editors. Here, you will find the most attractive templates for a range of purposes while taking into account ratings and remarks from users regarding the content. This is an excellent jumping-off point to explore our content and will give new users an insight into our top-notch PowerPoint Templates. The following slide outlines various metrics that can assist medical care companies in analyzing success of social media marketing campaign on Facebook, Instagram, LinkedIn, YouTube, and Twitter. The KPIs are engagement rate, brand impressions, follower growth, post views, conversion rate, watch time, etc.
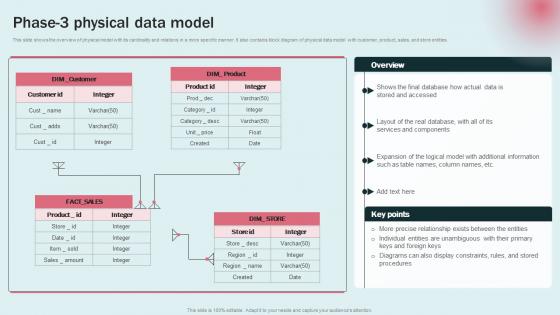
Phase 3 Physical Data Model Data Modeling Approaches For Modern Analytics Pictures Pdf
This slide shows the overview of physical model with its cardinality and relations in a more specific manner. It also contains block diagram of physical data model with customer, product, sales, and store entities. qExplore a selection of the finest Phase 3 Physical Data Model Data Modeling Approaches For Modern Analytics Pictures Pdf here. With a plethora of professionally designed and pre made slide templates, you can quickly and easily find the right one for your upcoming presentation. You can use our Phase 3 Physical Data Model Data Modeling Approaches For Modern Analytics Pictures Pdf to effectively convey your message to a wider audience. Slidegeeks has done a lot of research before preparing these presentation templates. The content can be personalized and the slides are highly editable. Grab templates today from Slidegeeks. This slide shows the overview of physical model with its cardinality and relations in a more specific manner. It also contains block diagram of physical data model with customer, product, sales, and store entities.
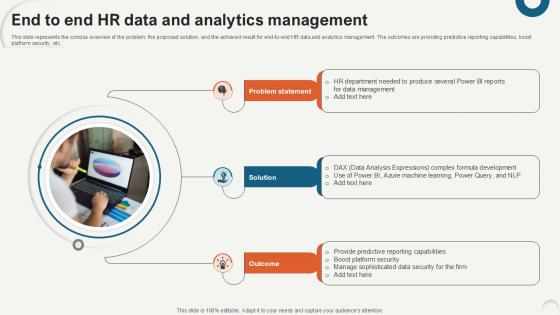
End To End HR Data And Analytics Data Analytics For Informed Decision Ppt Sample
This slide represents the concise overview of the problem, the proposed solution, and the achieved result for end-to-end HR data and analytics management. The outcomes are providing predictive reporting capabilities, boost platform security, etc. If you are looking for a format to display your unique thoughts, then the professionally designed End To End HR Data And Analytics Data Analytics For Informed Decision Ppt Sample is the one for you. You can use it as a Google Slides template or a PowerPoint template. Incorporate impressive visuals, symbols, images, and other charts. Modify or reorganize the text boxes as you desire. Experiment with shade schemes and font pairings. Alter, share or cooperate with other people on your work. Download End To End HR Data And Analytics Data Analytics For Informed Decision Ppt Sample and find out how to give a successful presentation. Present a perfect display to your team and make your presentation unforgettable. This slide represents the concise overview of the problem, the proposed solution, and the achieved result for end-to-end HR data and analytics management. The outcomes are providing predictive reporting capabilities, boost platform security, etc.

Segmentation Of Global Prescriptive Analytics Market Data Analytics SS V
This slide provides an overview of market segmentation of prescriptive analytics at a global level. It covers segmentation analysis based on region, data type, component and deployment with key takeaways.Take your projects to the next level with our ultimate collection of Segmentation Of Global Prescriptive Analytics Market Data Analytics SS V. Slidegeeks has designed a range of layouts that are perfect for representing task or activity duration, keeping track of all your deadlines at a glance. Tailor these designs to your exact needs and give them a truly corporate look with your own brand colors they will make your projects stand out from the rest This slide provides an overview of market segmentation of prescriptive analytics at a global level. It covers segmentation analysis based on region, data type, component and deployment with key takeaways.
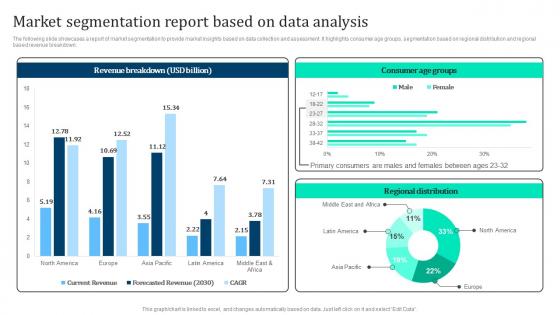
Market Segmentation Report Based Marketing Intelligence Guide Data Gathering Diagrams Pdf
The following slide showcases a report of market segmentation to provide market insights based on data collection and assessment. It highlights consumer age groups, segmentation based on regional distribution and regional based revenue breakdown. Retrieve professionally designed Market Segmentation Report Based Marketing Intelligence Guide Data Gathering Diagrams Pdf to effectively convey your message and captivate your listeners. Save time by selecting pre made slideshows that are appropriate for various topics, from business to educational purposes. These themes come in many different styles, from creative to corporate, and all of them are easily adjustable and can be edited quickly. Access them as PowerPoint templates or as Google Slides themes. You do not have to go on a hunt for the perfect presentation because Slidegeeks got you covered from everywhere. The following slide showcases a report of market segmentation to provide market insights based on data collection and assessment. It highlights consumer age groups, segmentation based on regional distribution and regional based revenue breakdown.
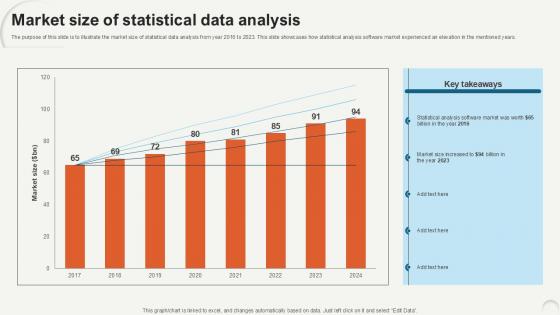
Market Size Of Statistical Data Analytics For Informed Decision Ppt Template
The purpose of this slide is to illustrate the market size of statistical data analysis from year 2016 to 2023. This slide showcases how statistical analysis software market experienced an elevation in the mentioned years. Explore a selection of the finest Market Size Of Statistical Data Analytics For Informed Decision Ppt Template here. With a plethora of professionally designed and pre-made slide templates, you can quickly and easily find the right one for your upcoming presentation. You can use our Market Size Of Statistical Data Analytics For Informed Decision Ppt Template to effectively convey your message to a wider audience. Slidegeeks has done a lot of research before preparing these presentation templates. The content can be personalized and the slides are highly editable. Grab templates today from Slidegeeks. The purpose of this slide is to illustrate the market size of statistical data analysis from year 2016 to 2023. This slide showcases how statistical analysis software market experienced an elevation in the mentioned years.
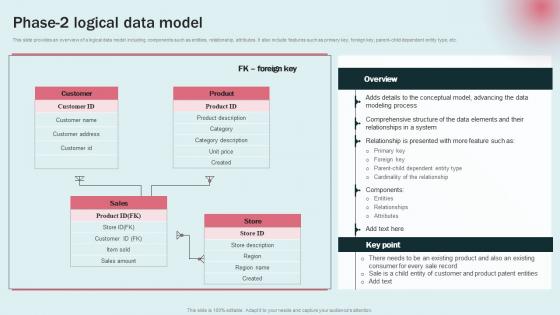
Phase 2 Logical Data Model Data Modeling Approaches For Modern Analytics Elements Pdf
This slide provides an overview of a logical data model including components such as entities, relationship, attributes. It also include features such as primary key, foreign key, parent child dependent entity type, etc. Welcome to our selection of the Phase 2 Logical Data Model Data Modeling Approaches For Modern Analytics Elements Pdf. These are designed to help you showcase your creativity and bring your sphere to life. Planning and Innovation are essential for any business that is just starting out. This collection contains the designs that you need for your everyday presentations. All of our PowerPoints are 100 percent editable, so you can customize them to suit your needs. This multi purpose template can be used in various situations. Grab these presentation templates today This slide provides an overview of a logical data model including components such as entities, relationship, attributes. It also include features such as primary key, foreign key, parent child dependent entity type, etc.
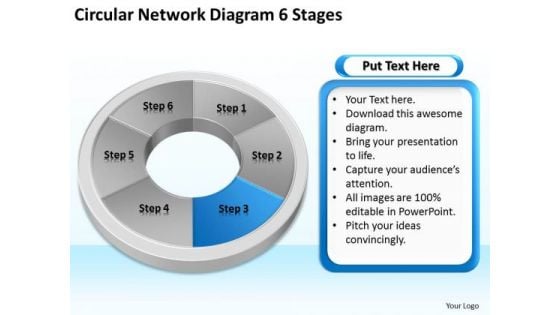
Circular Network Diagram 6 Stages Business Plan Professional PowerPoint Templates
We present our circular network diagram 6 stages business plan professional PowerPoint templates.Present our Process and Flows PowerPoint Templates because Our PowerPoint Templates and Slides will definately Enhance the stature of your presentation. Adorn the beauty of your thoughts with their colourful backgrounds. Present our Circle Charts PowerPoint Templates because you should Whip up a frenzy with our PowerPoint Templates and Slides. They will fuel the excitement of your team. Use our Shapes PowerPoint Templates because Our PowerPoint Templates and Slides are endowed to endure. Ideas conveyed through them will pass the test of time. Download and present our Business PowerPoint Templates because Our PowerPoint Templates and Slides are aesthetically designed to attract attention. We gaurantee that they will grab all the eyeballs you need. Download and present our Marketing PowerPoint Templates because It will Give impetus to the hopes of your colleagues. Our PowerPoint Templates and Slides will aid you in winning their trust.Use these PowerPoint slides for presentations relating to Pie, chart, business, concept, success, icon, account, market, isolated, slice, economy, presentation, diagram, circle, wealth, percentage, graphic,finance, data, report, marketing, analyzing, accounting, partition, management, graph, illustration, earnings, piece, strategy, money, planning, growth, progress,profit, part, information, investment, improvement, statistic, financial, measure, six, savings, performance. The prominent colors used in the PowerPoint template are Blue, White, Gray. Gather the data and present with our Circular Network Diagram 6 Stages Business Plan Professional PowerPoint Templates. Try us out and see what a difference our templates make.
Gold Medal For First Prize Winner Ppt PowerPoint Presentation Layouts Gridlines
Presenting this set of slides with name gold medal for first prize winner ppt powerpoint presentation layouts gridlines. This is a one stage process. The stages in this process are success, best icon, performers, winner. This is a completely editable PowerPoint presentation and is available for immediate download. Download now and impress your audience.

Golden Cup Winner Trophy Ppt PowerPoint Presentation Summary Demonstration
Presenting this set of slides with name golden cup winner trophy ppt powerpoint presentation summary demonstration. This is a one stage process. The stages in this process are success, best icon, performers, winner. This is a completely editable PowerPoint presentation and is available for immediate download. Download now and impress your audience.

Content Employee Assessment Ppt PowerPoint Presentation Professional Templates
Presenting this set of slides with name content employee assessment ppt powerpoint presentation professional templates. The topics discussed in these slides are content, employee assessment, employee skill, employee performance, icons. This is a completely editable PowerPoint presentation and is available for immediate download. Download now and impress your audience.
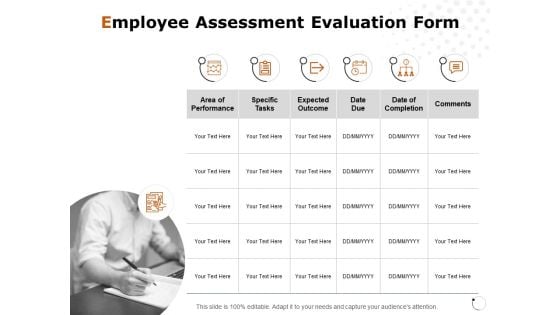
Employee Assessment Evaluation Form Ppt PowerPoint Presentation Gallery Graphics Pictures
Presenting this set of slides with name employee assessment evaluation form ppt powerpoint presentation gallery graphics pictures. This is a one stage process. The stages in this process are employee assessment, performance, completion, table, icons. This is a completely editable PowerPoint presentation and is available for immediate download. Download now and impress your audience.
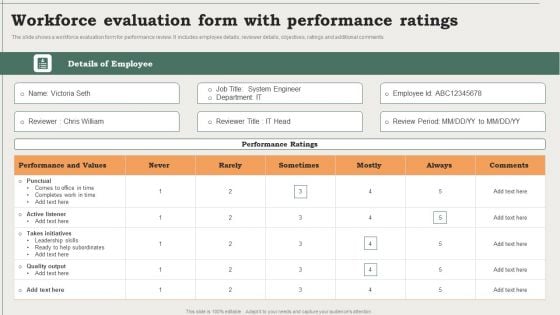
Workforce Evaluation Form With Performance Ratings Ppt PowerPoint Presentation Portfolio File Formats PDF
The slide shows a workforce evaluation form for performance review. It includes employee details, reviewer details, objectives, ratings and additional comments.Pitch your topic with ease and precision using this Workforce Evaluation Form With Performance Ratings Ppt PowerPoint Presentation Portfolio File Formats PDF. This layout presents information on Workforce Safety, Evaluation Checklist Icon. It is also available for immediate download and adjustment. So, changes can be made in the color, design, graphics or any other component to create a unique layout.
Vector Showing Data Breach From Pc Ppt PowerPoint Presentation Slides Aids PDF
Presenting vector showing data breach from pc ppt powerpoint presentation slides aids pdf to dispense important information. This template comprises three stages. It also presents valuable insights into the topics including vector showing data breach from pc icon. This is a completely customizable PowerPoint theme that can be put to use immediately. So, download it and address the topic impactfully.

 Home
Home