Dashboard Icon
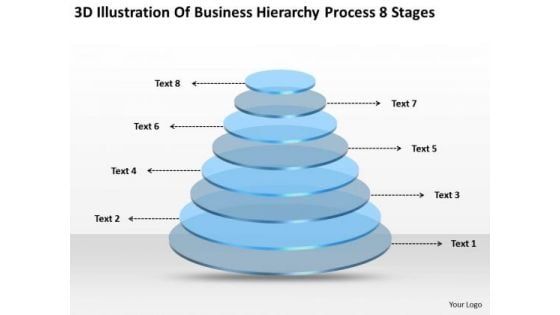
Business Hierarchy Process 8 Stages Template Plan PowerPoint Slides
We present our business hierarchy process 8 stages template plan PowerPoint Slides.Download our Business PowerPoint Templates because Our PowerPoint Templates and Slides are conceived by a dedicated team. Use them and give form to your wondrous ideas. Download and present our Process and Flows PowerPoint Templates because It can Conjure up grand ideas with our magical PowerPoint Templates and Slides. Leave everyone awestruck by the end of your presentation. Present our Success PowerPoint Templates because Our PowerPoint Templates and Slides will Embellish your thoughts. They will help you illustrate the brilliance of your ideas. Download our Marketing PowerPoint Templates because Our PowerPoint Templates and Slides are truly out of this world. Even the MIB duo has been keeping tabs on our team. Download our Shapes PowerPoint Templates because Our PowerPoint Templates and Slides will let your team Walk through your plans. See their energy levels rise as you show them the way.Use these PowerPoint slides for presentations relating to Abstract, bar, blue, bright, business, button, chart, circle, color, construction, diagram, element, green, group, growth, icon, illustration, layer, layered, level, multicolor, object, performance, progress, rating, reflection, round, set, shape, sign, statistic, symbol, template, website, yellow. The prominent colors used in the PowerPoint template are Blue, Blue light, Black. Experience craftsmanship with our Business Hierarchy Process 8 Stages Template Plan PowerPoint Slides. They are designed by excellent artisans.
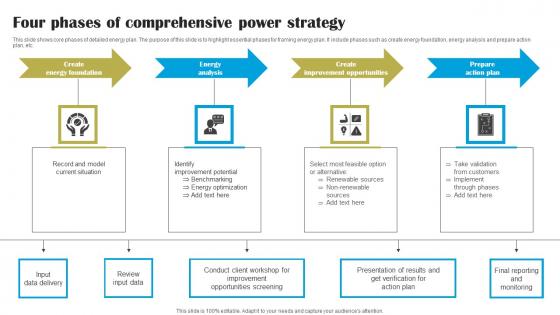
Four Phases Of Comprehensive Power Strategy Inspiration Pdf
This slide shows key performance indicators for energy plan. The purpose of this slide is to highlight main key performance indicators that should be considered for performance measurement. It include indicators such as facility wide units and process unit levels, etc.Showcasing this set of slides titled Four Phases Of Comprehensive Power Strategy Inspiration Pdf The topics addressed in these templates are Energy Analysis, Improvement Opportunities, Prepare Action Plan All the content presented in this PPT design is completely editable. Download it and make adjustments in color, background, font etc. as per your unique business setting. This slide shows key performance indicators for energy plan. The purpose of this slide is to highlight main key performance indicators that should be considered for performance measurement. It include indicators such as facility wide units and process unit levels, etc.

Business Data Analysis Media Themes PDF
This is a business data analysis media themes pdf template with various stages. Focus and dispense information on one stage using this creative set, that comes with editable features. It contains large content boxes to add your information on topics like media is the most popular source of big data, as it provides valuable insights on consumer preferences and changing trends, media includes social media and interactive platforms, like google, facebook, twitter, youtube, instagram. You can also showcase facts, figures, and other relevant content using this PPT layout. Grab it now.
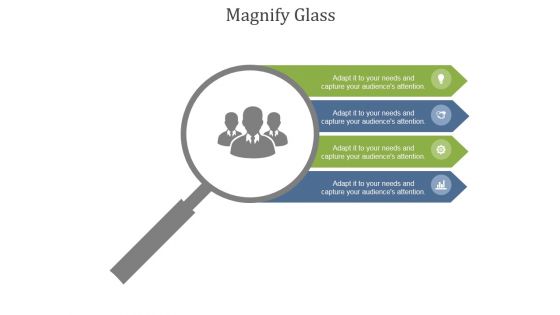
Magnify Glass Ppt PowerPoint Presentation Themes
This is a magnify glass ppt powerpoint presentation themes. This is a four stage process. The stages in this process are magnifier, search, analysis, marketing, strategy, success.
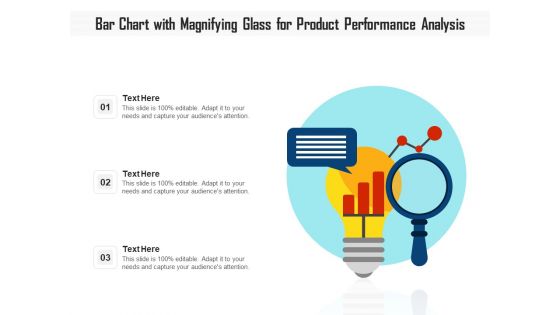
Bar Chart With Magnifying Glass For Product Performance Analysis Ppt PowerPoint Presentation Gallery Example File PDF
Presenting bar chart with magnifying glass for product performance analysis ppt powerpoint presentation gallery example file pdf to dispense important information. This template comprises three stages. It also presents valuable insights into the topics including bar chart with magnifying glass for product performance analysis. This is a completely customizable PowerPoint theme that can be put to use immediately. So, download it and address the topic impactfully.
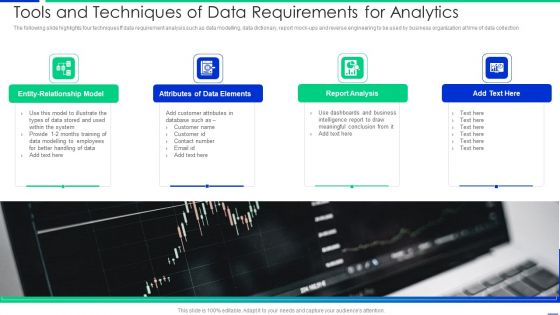
Tools And Techniques Of Data Requirements For Analytics Mockup PDF
The following slide highlights four techniques ff data requirement analysis such as data modelling, data dictionary, report mock-ups and reverse engineering to be used by business organization at time of data collection Presenting tools and techniques of data requirements for analytics mockup pdf to dispense important information. This template comprises four stages. It also presents valuable insights into the topics including system, customer, database. This is a completely customizable PowerPoint theme that can be put to use immediately. So, download it and address the topic impactfully.

Data Analysis Excel 3d Pie Chart For Marketing Process PowerPoint Templates
Our data analysis excel 3d pie chart for marketing process Powerpoint Templates Team Are A Dogged Lot. They Keep At It Till They Get It Right.
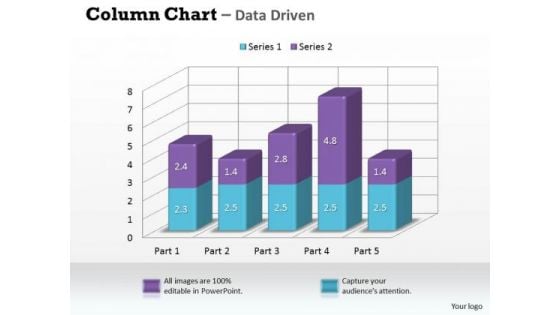
Data Analysis In Excel 3d Column Chart For Market Surveys PowerPoint Templates
Our data analysis in excel 3d column chart for market surveys Powerpoint Templates Leave No One In Doubt. Provide A Certainty To Your Views.
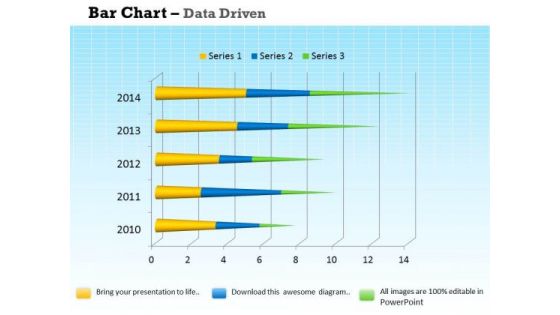
Data Analysis Programs 3d Bar Chart For Market Surveys PowerPoint Templates
Draw On The Experience Of Our data analysis programs 3d bar chart for market surveys Powerpoint Templates . They Imbibe From Past Masters.
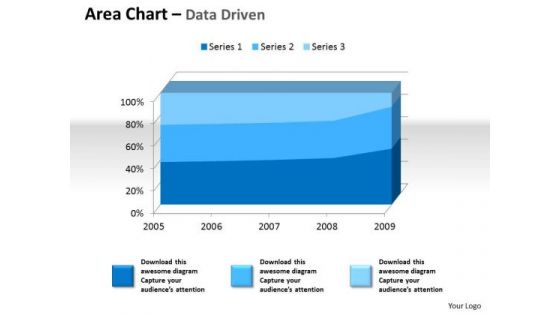
Examples Of Data Analysis Market 3d Area Chart For Quantiative PowerPoint Templates
Drum It Up With Our examples of data analysis market 3d area chart for quantiative Powerpoint Templates . Your Thoughts Will Raise The Tempo.
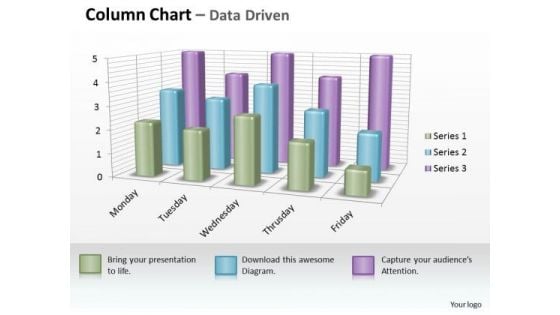
Examples Of Data Analysis Market 3d Business Inspection Procedure Chart PowerPoint Templates
However Dry Your Topic Maybe. Make It Catchy With Our examples of data analysis market 3d business inspection procedure chart Powerpoint Templates .
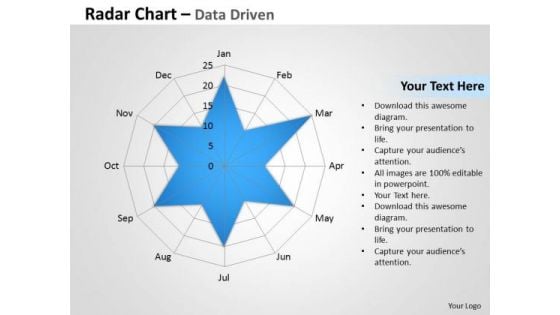
Examples Of Data Analysis Market Driven Radar Chart To Compare PowerPoint Slides Templates
Rely On Our examples of data analysis market driven radar chart to compare powerpoint slides Templates In Any Duel. They Will Drive Home Your Point.
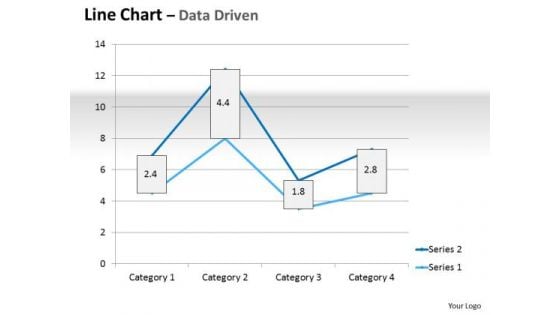
Multivariate Data Analysis Driven Line Chart Market Graph PowerPoint Slides Templates
Plan For All Contingencies With Our multivariate data analysis driven line chart market graph powerpoint slides Templates . Douse The Fire Before It Catches.
Sales Ppt Theme Succeeding Media Representation Theory PowerPoint Of 4 Arrows Design
We present our sales PPT Theme succeeding media representation theory power point of 4 arrows design. Use our Abstract PowerPoint Templates because; illustrate your plans on using the many social media modes available to inform society at large of the benefits of your product. Use our Symbol PowerPoint Templates because, Churn the mixture to the right degree and pound home your views and expectations in a spectacularly grand and virtuoso fluid performance. Use our Business PowerPoint Templates because; Blaze a brilliant trail from point to point. Use our Process and Flows PowerPoint Templates because, transmit your thoughts via our slides and prod your team to action. Use our Arrows PowerPoint Templates because, anticipate the doubts and questions in the minds of your colleagues and enlighten them with your inspired strategy to garner desired success. Use these PowerPoint slides for presentations relating to Arrow, Background, Business, Chart, Diagram, Financial, Flow, Graphic, Gray, Icon, Illustration, Linear, Management, Orange, Perspective, Process, Reflection, Spheres, Stage, Text. The prominent colors used in the PowerPoint template are Green, Gray, and Black Compile targets with our Sales Ppt Theme Succeeding Media Representation Theory PowerPoint Of 4 Arrows Design. Download without worries with our money back guaranteee.
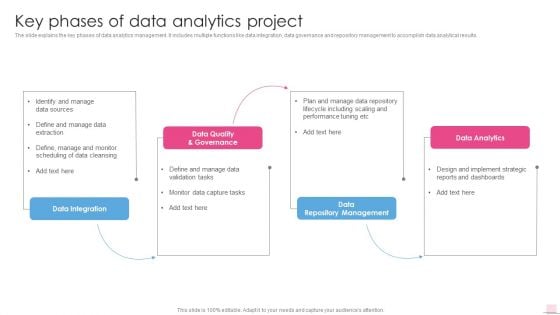
Key Phases Of Data Analytics Project Business Analysis Modification Toolkit Diagrams PDF
The slide explains the key phases of data analytics management. It includes multiple functions like data integration, data governance and repository management to accomplish data analytical results.Deliver and pitch your topic in the best possible manner with this Key Phases Of Data Analytics Project Business Analysis Modification Toolkit Diagrams PDF. Use them to share invaluable insights on Data Quality Governance, Performance Tuning, Including Scaling and impress your audience. This template can be altered and modified as per your expectations. So, grab it now.
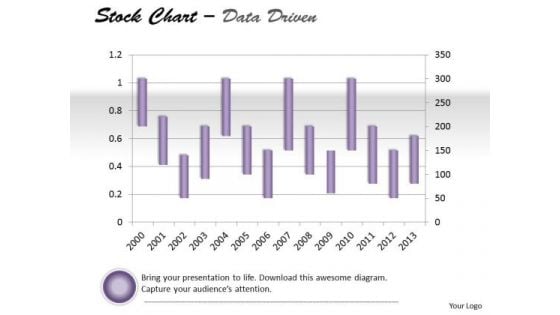
Data Analysis On Excel Driven Stock Chart For Market History PowerPoint Slides Templates
Draw Out The Best In You With Our data analysis on excel driven stock chart for market history powerpoint slides Templates . Let Your Inner Brilliance Come To The Surface.
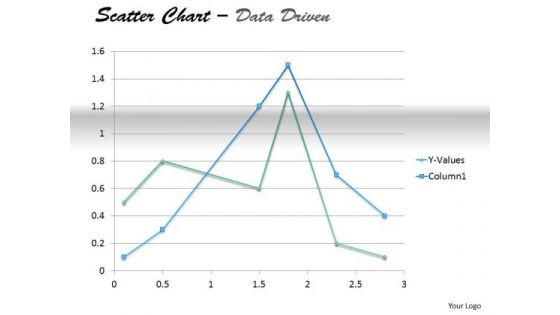
Examples Of Data Analysis Market Driven Present In Scatter Chart PowerPoint Slides Templates
Your Thoughts Will Take To Our examples of data analysis market driven present in scatter chart powerpoint slides Templates Like A Duck To Water. They Develop A Binding Affinity.
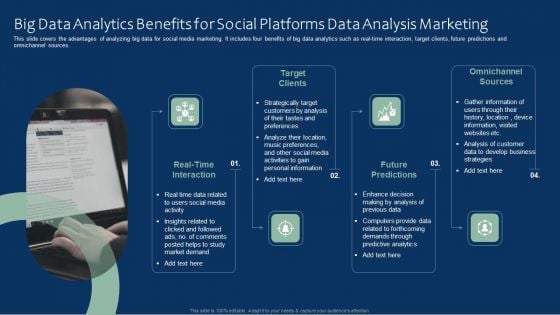
Big Data Analytics Benefits For Social Platforms Data Analysis Marketing Mockup PDF
This slide covers the advantages of analyzing big data for social media marketing. It includes four benefits of big data analytics such as real-time interaction, target clients, future predictions and omnichannel sources. Presenting Big Data Analytics Benefits For Social Platforms Data Analysis Marketing Mockup PDF to dispense important information. This template comprises four stages. It also presents valuable insights into the topics including Target Clients, Future Predictions, Omnichannel Sources. This is a completely customizable PowerPoint theme that can be put to use immediately. So, download it and address the topic impactfully.
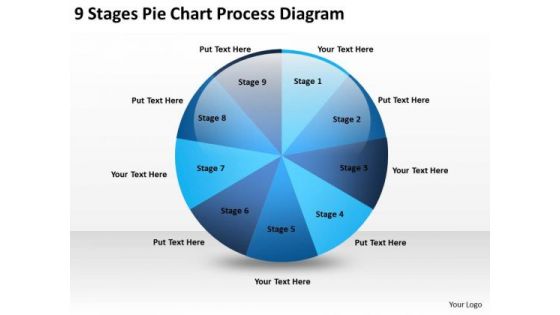
9 Stages Pie Chart Process Diagram How Do You Write Business Plan PowerPoint Slides
We present our 9 stages pie chart process diagram how do you write business plan PowerPoint Slides.Present our Process and Flows PowerPoint Templates because You can Zap them with our PowerPoint Templates and Slides. See them reel under the impact. Use our Circle Charts PowerPoint Templates because You can Create a matrix with our PowerPoint Templates and Slides. Feel the strength of your ideas click into place. Use our Business PowerPoint Templates because Our PowerPoint Templates and Slides are designed to help you succeed. They have all the ingredients you need. Present our Success PowerPoint Templates because Your audience will believe you are the cats whiskers. Download our Future PowerPoint Templates because Our PowerPoint Templates and Slides will give you great value for your money. Be assured of finding the best projection to highlight your words. Use these PowerPoint slides for presentations relating to Pie, chart, business, market, slice, isometric, display, perspective, green, corporate, blank, concept, sign, presentation, symbol, diagram,circle, graphic, finance, data, stock, element, bank, report, marketing, abstract, management, graph, modern, illustration, icon, motion, company,organization, information, environment, banking, financial. The prominent colors used in the PowerPoint template are Blue, Blue light, Blue navy. Add class with our 9 Stages Pie Chart Process Diagram How Do You Write Business Plan PowerPoint Slides. You will come out on top.
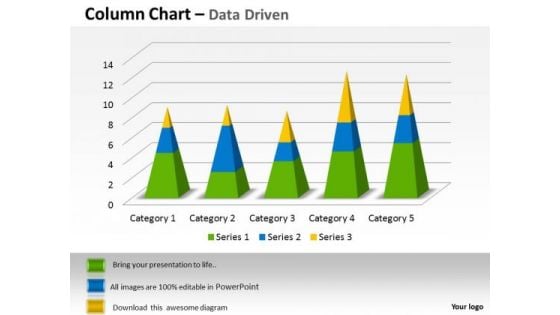
Examples Of Data Analysis Market 3d Categories Sets PowerPoint Templates
Our examples of data analysis market 3d categories sets Powerpoint Templates Give Your Thoughts Their Due. They Project Them With Full Intensity.
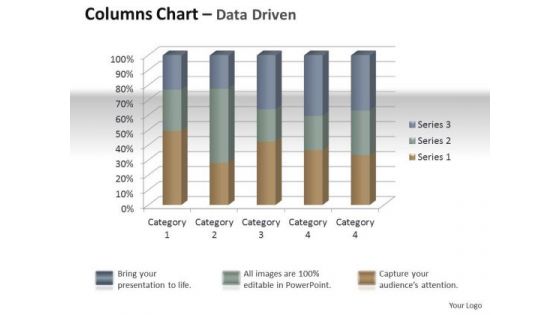
Marketing Data Analysis 3d Quality Control Of Units PowerPoint Templates
Establish Your Dominion With Our marketing data analysis 3d quality control of units Powerpoint Templates . Rule The Stage With Your Thoughts.

Statistical Data Analysis Chart Of Collected Data Formats PDF
Presenting statistical data analysis chart of collected data formats pdf to dispense important information. This template comprises four stages. It also presents valuable insights into the topics including statistical data analysis chart of collected data. This is a completely customizable PowerPoint theme that can be put to use immediately. So, download it and address the topic impactfully.
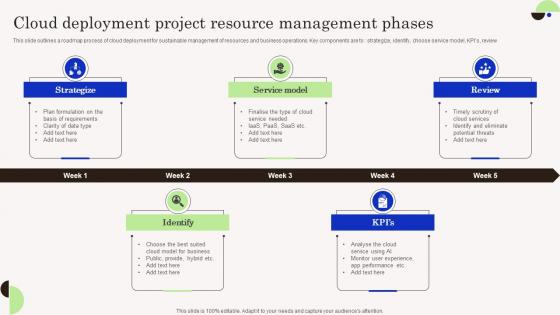
Cloud Deployment Project Resource Management Phases Demonstration Pdf
This slide outlines a roadmap process of cloud deployment for sustainable management of resources and business operations. Key components are to strategize, identify, choose service model, KPIs, review Pitch your topic with ease and precision using this Cloud Deployment Project Resource Management Phases Demonstration Pdf. This layout presents information on Strategize, Service Model, Review. It is also available for immediate download and adjustment. So, changes can be made in the color, design, graphics or any other component to create a unique layout. This slide outlines a roadmap process of cloud deployment for sustainable management of resources and business operations. Key components are to strategize, identify, choose service model, KPIs, review
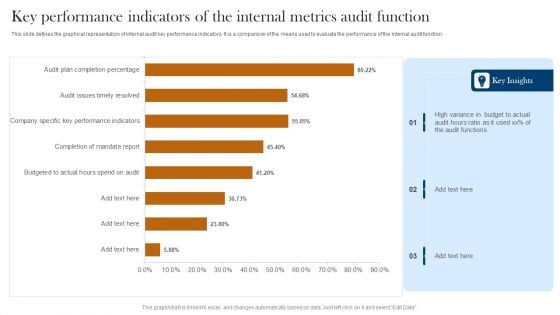
Key Performance Indicators Of The Internal Metrics Audit Function Infographics PDF
This slide defines the graphical representation of internal audit key performance indicators. It is a comparison of the means used to evaluate the performance of the internal audit function. Pitch your topic with ease and precision using this Key Performance Indicators Of The Internal Metrics Audit Function Infographics PDF. This layout presents information on High Variance, Budget To Actual, Audit Functions. It is also available for immediate download and adjustment. So, changes can be made in the color, design, graphics or any other component to create a unique layout.
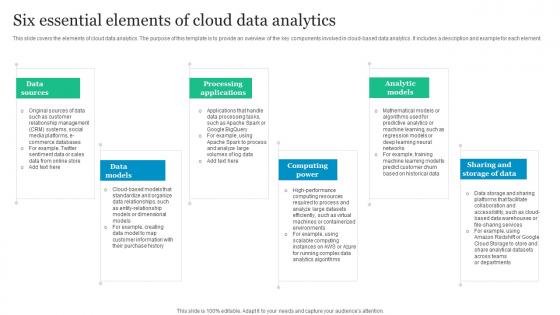
Six Essential Elements Of Cloud Data Analytics Diagrams Pdf
This slide covers the elements of cloud data analytics. The purpose of this template is to provide an overview of the key components involved in cloud based data analytics. It includes a description and example for each element. Showcasing this set of slides titled Six Essential Elements Of Cloud Data Analytics Diagrams Pdf. The topics addressed in these templates are Data Sources, Data Models, Processing Applications. All the content presented in this PPT design is completely editable. Download it and make adjustments in color, background, font etc. as per your unique business setting. This slide covers the elements of cloud data analytics. The purpose of this template is to provide an overview of the key components involved in cloud based data analytics. It includes a description and example for each element.
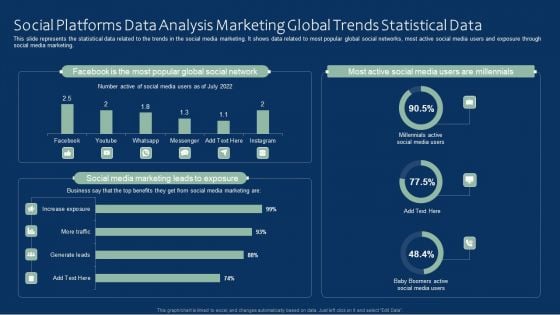
Social Platforms Data Analysis Marketing Global Trends Statistical Data Rules PDF
This slide represents the statistical data related to the trends in the social media marketing. It shows data related to most popular global social networks, most active social media users and exposure through social media marketing. Pitch your topic with ease and precision using this Social Platforms Data Analysis Marketing Global Trends Statistical Data Rules PDF. This layout presents information on Social Platforms Data Analysis, Marketing Global, Trends Statistical Data. It is also available for immediate download and adjustment. So, changes can be made in the color, design, graphics or any other component to create a unique layout.
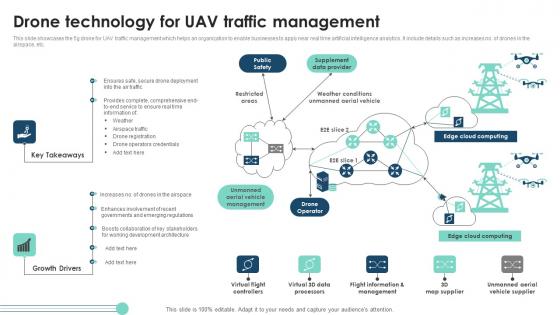
Drone Technology For Uav Traffic Management Themes Pdf
This slide showcases the 5g drone for UAV traffic management which helps an organization to enable businesses to apply near real time artificial intelligence analytics. It include details such as increases no. of drones in the airspace, etc. Showcasing this set of slides titled Drone Technology For Uav Traffic Management Themes Pdf The topics addressed in these templates are Supplement Data Provider, Cloud Computing, Growth Drivers All the content presented in this PPT design is completely editable. Download it and make adjustments in color, background, font etc. as per your unique business setting. This slide showcases the 5g drone for UAV traffic management which helps an organization to enable businesses to apply near real time artificial intelligence analytics. It include details such as increases no. of drones in the airspace, etc.
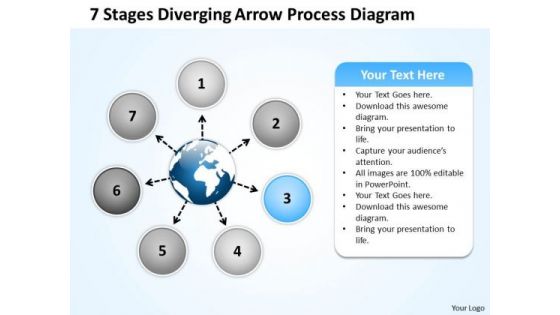
Diverging Arrow Process Diagram Relative Circular Flow PowerPoint Templates
We present our diverging arrow process diagram Relative Circular Flow PowerPoint templates.Present our Circle Charts PowerPoint Templates because this slide brings grey areas to the table and explain in detail you assessment of the need for care to ensure continued smooth progress. Download and present our Globe PowerPoint Templates because you can see In any endeavour people matter most. Present our Process and Flows PowerPoint Templates because this slide depicts the occasion for gifting and giving. Download and present our Flow Charts PowerPoint Templates because you can Organize your thoughts and illuminate your ideas accordingly. Use our Business PowerPoint Templates because you can Lead your flock steadily to greater heights. Look around at the vast potential of achievement around you.Use these PowerPoint slides for presentations relating to Arrow, art, artistic,background, caricature, chart, childish,circular, creative, design, diagram,doodle, draw, flow, graffiti, graphic,grunge, hand, handwritten, icon,illustration, image, isolated, object, pie, pieces, process, raster,report, retro, rough, scribble, segmented, simple, sketch, sketchy, slices,statistic, styling, succeed, success,symbol. The prominent colors used in the PowerPoint template are Green, Black, Blue. Professionals tell us our diverging arrow process diagram Relative Circular Flow PowerPoint templates look good visually. People tell us our chart PowerPoint templates and PPT Slides are second to none. The feedback we get is that our diverging arrow process diagram Relative Circular Flow PowerPoint templates are Wonderful. Presenters tell us our caricature PowerPoint templates and PPT Slides provide great value for your money. Be assured of finding the best projection to highlight your words. You can be sure our diverging arrow process diagram Relative Circular Flow PowerPoint templates are Lush. PowerPoint presentation experts tell us our artistic PowerPoint templates and PPT Slides are Attractive. Exult in the happiness of your performance. Convey your emotions through our Diverging Arrow Process Diagram Relative Circular Flow PowerPoint Templates.
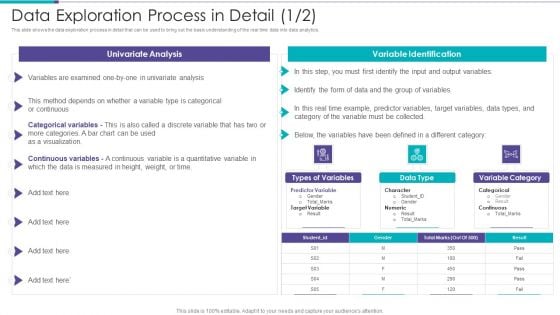
Data Exploration Process In Detail Data Preparation Infrastructure And Phases Themes PDF
This slide shows the data exploration process in detail that can be used to bring out the basic understanding of the real time data into data analytics.Deliver an awe inspiring pitch with this creative Data Exploration Process In Detail Data Preparation Infrastructure And Phases Themes PDF bundle. Topics like Assumptions About, Data Distributed, Document Everything can be discussed with this completely editable template. It is available for immediate download depending on the needs and requirements of the user.
Magnifying Glass Inbound And Outbound Marketing Tactics For Start Ups To Drive Business Clipart PDF
Whether you have daily or monthly meetings, a brilliant presentation is necessary. Magnifying Glass Inbound And Outbound Marketing Tactics For Start Ups To Drive Business Clipart PDF can be your best option for delivering a presentation. Represent everything in detail using Magnifying Glass Inbound And Outbound Marketing Tactics For Start Ups To Drive Business Clipart PDF and make yourself stand out in meetings. The template is versatile and follows a structure that will cater to your requirements. All the templates prepared by Slidegeeks are easy to download and edit. Our research experts have taken care of the corporate themes as well. So, give it a try and see the results.
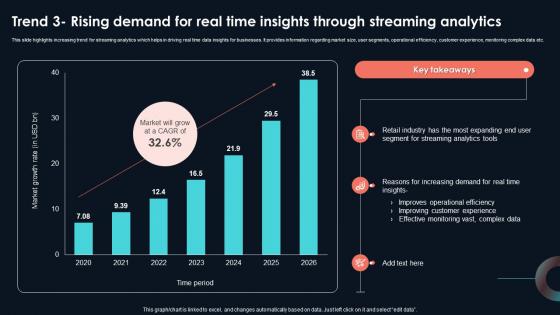
Trend 3 Rising Demand For Real Time Insights Developing Strategic Insights Using Big Data Analytics SS V
This slide highlights increasing trend for streaming analytics which helps in driving real time data insights for businesses. It provides information regarding market size, user segments, operational efficiency, customer experience, monitoring complex data etc. Take your projects to the next level with our ultimate collection of Trend 3 Rising Demand For Real Time Insights Developing Strategic Insights Using Big Data Analytics SS V. Slidegeeks has designed a range of layouts that are perfect for representing task or activity duration, keeping track of all your deadlines at a glance. Tailor these designs to your exact needs and give them a truly corporate look with your own brand colors they will make your projects stand out from the rest This slide highlights increasing trend for streaming analytics which helps in driving real time data insights for businesses. It provides information regarding market size, user segments, operational efficiency, customer experience, monitoring complex data etc.
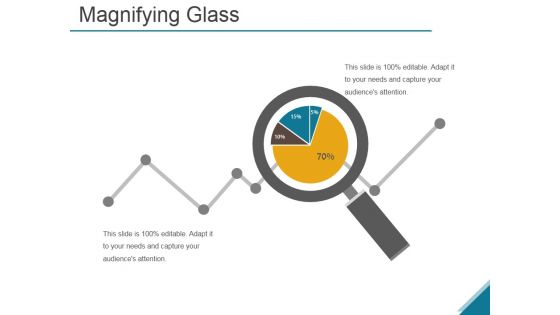
Magnifying Ppt PowerPoint Presentation Outline Maker
This is a magnifying ppt powerpoint presentation outline maker. This is a four stage process. The stages in this process are business, strategy, analysis, success, chart and graph, finance.

Human Resource Manager Evaluating Candidates For Professional Journey Inspiration PDF
Presenting Human Resource Manager Evaluating Candidates For Professional Journey Inspiration PDF to dispense important information. This template comprises three stages. It also presents valuable insights into the topics including Human Resource Manager, Evaluating Candidates, Professional Journey. This is a completely customizable PowerPoint theme that can be put to use immediately. So, download it and address the topic impactfully.
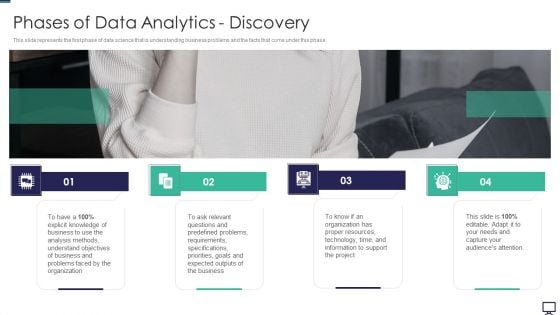
Phases Of Data Analytics Discovery Ppt Infographic Template Outfit PDF
This slide represents the first phase of data science that is understanding business problems and the facts that come under this phase. This is a phases of data analytics discovery ppt infographic template outfit pdf template with various stages. Focus and dispense information on four stages using this creative set, that comes with editable features. It contains large content boxes to add your information on topics like business, analysis, organization, requirements. You can also showcase facts, figures, and other relevant content using this PPT layout. Grab it now.
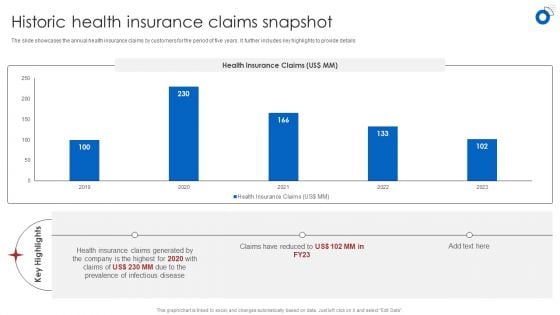
Insurance Business Financial Analysis Historic Health Insurance Claims Snapshot Diagrams PDF
The slide showcases the annual health insurance claims by customers for the period of five years. It further includes key highlights to provide details Boost your pitch with our creative Insurance Business Financial Analysis Historic Health Insurance Claims Snapshot Diagrams PDF. Deliver an awe-inspiring pitch that will mesmerize everyone. Using these presentation templates you will surely catch everyones attention. You can browse the ppts collection on our website. We have researchers who are experts at creating the right content for the templates. So you dont have to invest time in any additional work. Just grab the template now and use them.
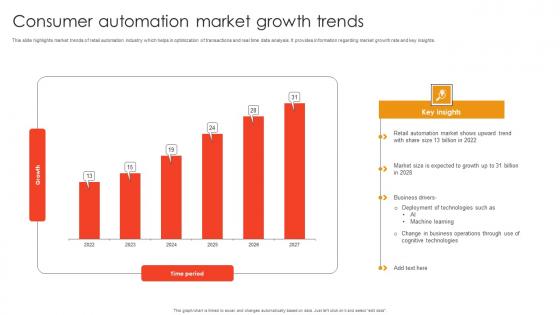
Consumer Automation Market Growth Trends Formats Pdf
This slide highlights market trends of retail automation industry which helps in optimization of transactions and real time data analysis. It provides information regarding market growth rate and key insights. Showcasing this set of slides titled Consumer Automation Market Growth Trends Formats Pdf. The topics addressed in these templates are Deployment Technologies Such, AI, Machine Learning. All the content presented in this PPT design is completely editable. Download it and make adjustments in color, background, font etc. as per your unique business setting. This slide highlights market trends of retail automation industry which helps in optimization of transactions and real time data analysis. It provides information regarding market growth rate and key insights.
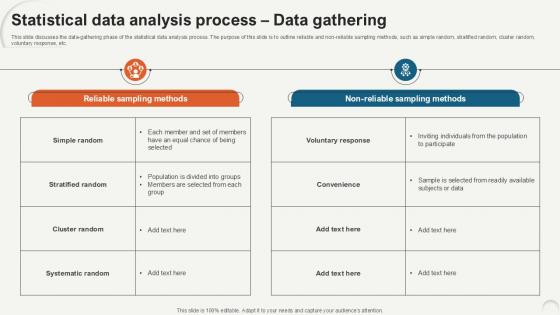
Statistical Data Analysis Process Data Gathering Ppt Example
This slide discusses the data-gathering phase of the statistical data analysis process. The purpose of this slide is to outline reliable and non-reliable sampling methods, such as simple random, stratified random, cluster random, voluntary response, etc. Slidegeeks is one of the best resources for PowerPoint templates. You can download easily and regulate Statistical Data Analysis Process Data Gathering Ppt Example for your personal presentations from our wonderful collection. A few clicks is all it takes to discover and get the most relevant and appropriate templates. Use our Templates to add a unique zing and appeal to your presentation and meetings. All the slides are easy to edit and you can use them even for advertisement purposes. This slide discusses the data-gathering phase of the statistical data analysis process. The purpose of this slide is to outline reliable and non-reliable sampling methods, such as simple random, stratified random, cluster random, voluntary response, etc.
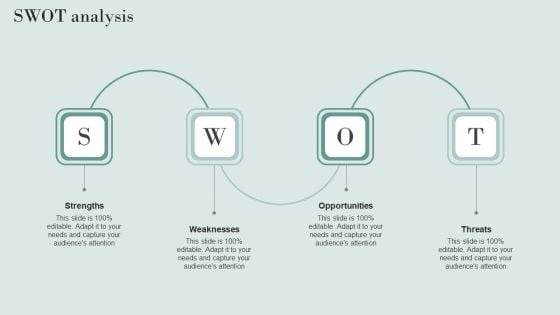
Data Structure IT Swot Analysis Diagrams PDF
Presenting this PowerPoint presentation, titled Data Structure IT Swot Analysis Diagrams PDF, with topics curated by our researchers after extensive research. This editable presentation is available for immediate download and provides attractive features when used. Download now and captivate your audience. Presenting this Data Structure IT Swot Analysis Diagrams PDF. Our researchers have carefully researched and created these slides with all aspects taken into consideration. This is a completely customizable Data Structure IT Swot Analysis Diagrams PDF that is available for immediate downloading. Download now and make an impact on your audience. Highlight the attractive features available with our PPTs.
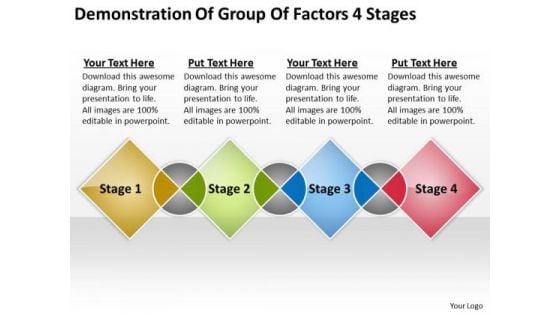
Group Factors 4 Stages Business Plan Examples PowerPoint Templates
We present our group factors 4 stages business plan examples PowerPoint templates.Use our Process and Flows PowerPoint Templates because Our PowerPoint Templates and Slides will let you Hit the target. Go the full distance with ease and elan. Present our Success PowerPoint Templates because Our PowerPoint Templates and Slides will give good value for money. They also have respect for the value of your time. Download and present our Business PowerPoint Templates because Our PowerPoint Templates and Slides are innately eco-friendly. Their high recall value negate the need for paper handouts. Download our Shapes PowerPoint Templates because They will Put the wind in your sails. Skim smoothly over the choppy waters of the market. Download our Spheres PowerPoint Templates because Our PowerPoint Templates and Slides will let Your superior ideas hit the target always and everytime.Use these PowerPoint slides for presentations relating to Vector, sign, icon, market, isolated, green, white, corporate, business, concept, success, symbol, diagram, graphic, finance, data, element, drawing, report, shape, abstract, illustration, strategy, money, design, growth, colorful, progress, part, information, background, investment, financial, communication . The prominent colors used in the PowerPoint template are Yellow, Green, Blue. Our Group Factors 4 Stages Business Plan Examples PowerPoint Templates will be an extension of you. You will accept them as your alter ego.
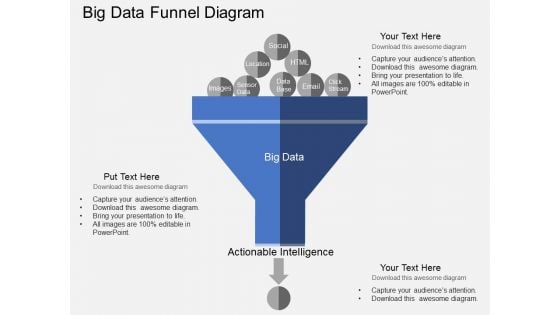
Big Data Funnel Diagram Powerpoint Templates
Our above business slide has been designed with graphics of big data funnel diagram. This slide is suitable to present data analysis, storage and sharing. Use this business diagram to present your work in a more smart and precise manner.
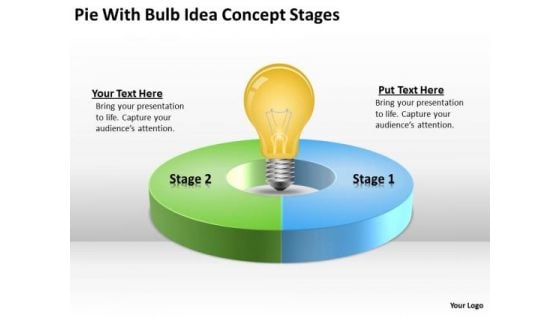
Pie With Bulb Idea Concept Stages What Is Business Continuity Plan PowerPoint Slides
We present our pie with bulb idea concept stages what is business continuity plan PowerPoint Slides.Download our Circle Charts PowerPoint Templates because It will Strengthen your hand with your thoughts. They have all the aces you need to win the day. Present our Signs PowerPoint Templates because Our PowerPoint Templates and Slides team portray an attitude of elegance. Personify this quality by using them regularly. Present our Shapes PowerPoint Templates because It can Bubble and burst with your ideas. Download our Ring Charts PowerPoint Templates because our bewitching PowerPoint Templates and Slides will delight your audience with the magic of your words. Download our Light Bulbs PowerPoint Templates because You can Score a slam dunk with our PowerPoint Templates and Slides. Watch your audience hang onto your every word.Use these PowerPoint slides for presentations relating to pie, chart, network, isolated, nobody, green, copy, white, red, flow, business, three-dimensional, sign, render, symbol, diagram, change, circle, finance, data, rendering, process, flowchart, plastic, graphics, shape, computer, abstract, graph, cycle, illustration, icon, connection, circular, strategy, round, up, shiny, reflection, solution, design, cylinder, color, growth, blue, background, single, financial, 3d. The prominent colors used in the PowerPoint template are Yellow, Blue, Green. Acquire the aura of a champion. Enhance your charisma with our Pie With Bulb Idea Concept Stages What Is Business Continuity Plan PowerPoint Slides.
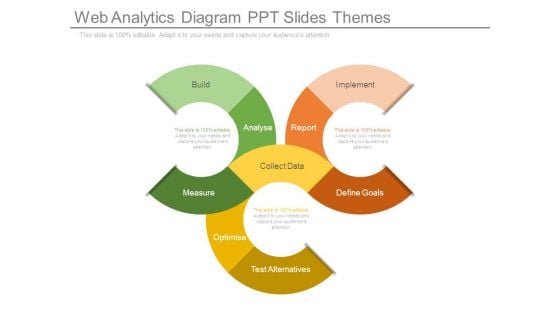
Web Analytics Diagram Ppt Slides Themes
This is a web analytics diagram ppt slides themes. This is a three stage process. The stages in this process are build, analyse, measure, test alternatives, optimise, collect data, define goals, report, implement.
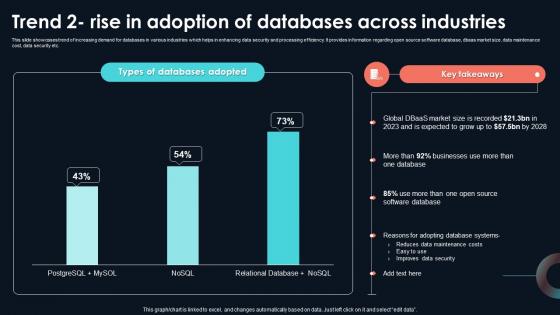
Trend 2 Rise In Adoption Of Databases Across Developing Strategic Insights Using Big Data Analytics SS V
This slide showcases trend of increasing demand for databases in various industries which helps in enhancing data security and processing efficiency. It provides information regarding open source software database, dbaas market size, data maintenance cost, data security etc. This Trend 2 Rise In Adoption Of Databases Across Developing Strategic Insights Using Big Data Analytics SS V from Slidegeeks makes it easy to present information on your topic with precision. It provides customization options, so you can make changes to the colors, design, graphics, or any other component to create a unique layout. It is also available for immediate download, so you can begin using it right away. Slidegeeks has done good research to ensure that you have everything you need to make your presentation stand out. Make a name out there for a brilliant performance. This slide showcases trend of increasing demand for databases in various industries which helps in enhancing data security and processing efficiency. It provides information regarding open source software database, dbaas market size, data maintenance cost, data security etc.
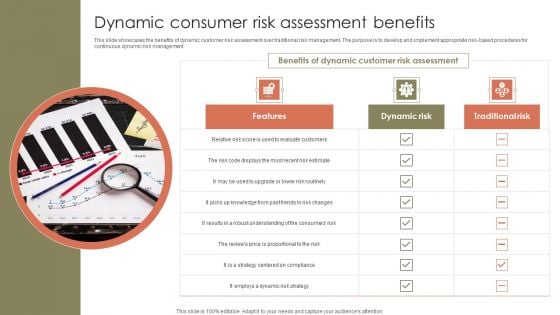
Dynamic Consumer Risk Assessment Benefits Ppt Styles Slides PDF
This slide showcases the benefits of dynamic customer risk assessment over traditional risk management. The purpose is to develop and implement appropriate risk-based procedures for continuous dynamic risk management. Presenting Dynamic Consumer Risk Assessment Benefits Ppt Styles Slides PDF to dispense important information. This template comprises THREE stages. It also presents valuable insights into the topics including Features, Dynamic Risk, Traditional Risk. This is a completely customizable PowerPoint theme that can be put to use immediately. So, download it and address the topic impactfully.
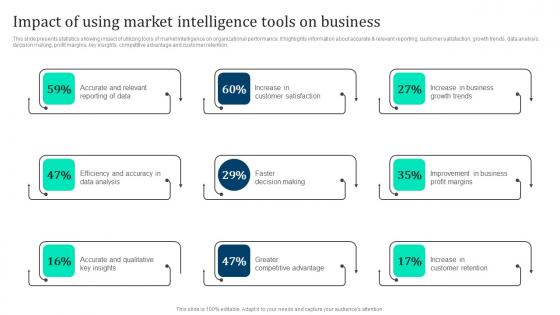
Impact Of Using Market Intelligence Marketing Intelligence Guide Data Gathering Portrait Pdf
This slide presents statistics showing impact of utilizing tools of market intelligence on organizational performance. It highlights information about accurate and relevant reporting, customer satisfaction, growth trends, data analysis, decision making, profit margins, key insights, competitive advantage and customer retention. If you are looking for a format to display your unique thoughts, then the professionally designed Impact Of Using Market Intelligence Marketing Intelligence Guide Data Gathering Portrait Pdf is the one for you. You can use it as a Google Slides template or a PowerPoint template. Incorporate impressive visuals, symbols, images, and other charts. Modify or reorganize the text boxes as you desire. Experiment with shade schemes and font pairings. Alter, share or cooperate with other people on your work. Download Impact Of Using Market Intelligence Marketing Intelligence Guide Data Gathering Portrait Pdf and find out how to give a successful presentation. Present a perfect display to your team and make your presentation unforgettable. This slide presents statistics showing impact of utilizing tools of market intelligence on organizational performance. It highlights information about accurate and relevant reporting, customer satisfaction, growth trends, data analysis, decision making, profit margins, key insights, competitive advantage and customer retention.
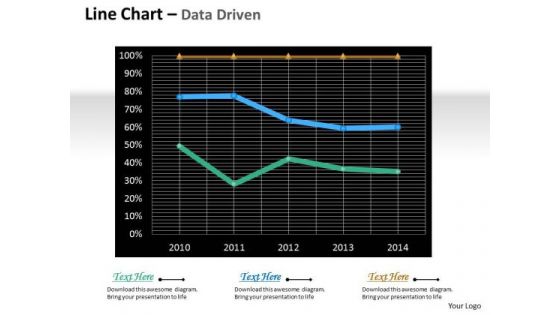
Multivariate Data Analysis Driven Line Chart For Market Survey PowerPoint Slides Templates
Rake In The Dough With

Data Mining Tools Market Restraints Using Data Mining Tools To Optimize Processes AI SS V
This slide showcases restraints of data mining tools market which can help associated players to gain insights and improvise their current offerings. It provides details about technological in-competence, data security, privacy, costs, etc. Are you searching for a Data Mining Tools Market Restraints Using Data Mining Tools To Optimize Processes AI SS V that is uncluttered, straightforward, and original Its easy to edit, and you can change the colors to suit your personal or business branding. For a presentation that expresses how much effort you have put in, this template is ideal With all of its features, including tables, diagrams, statistics, and lists, its perfect for a business plan presentation. Make your ideas more appealing with these professional slides. Download Data Mining Tools Market Restraints Using Data Mining Tools To Optimize Processes AI SS V from Slidegeeks today. This slide showcases restraints of data mining tools market which can help associated players to gain insights and improvise their current offerings. It provides details about technological in-competence, data security, privacy, costs, etc.
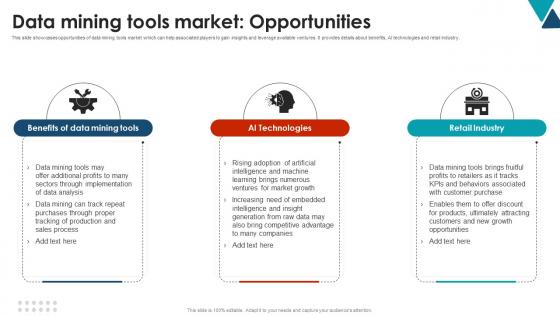
Data Mining Tools Market Opportunities Using Data Mining Tools To Optimize Processes AI SS V
This slide showcases opportunities of data mining tools market which can help associated players to gain insights and leverage available ventures. It provides details about benefits, AI technologies and retail industry. Do you know about Slidesgeeks Data Mining Tools Market Opportunities Using Data Mining Tools To Optimize Processes AI SS V These are perfect for delivering any kind od presentation. Using it, create PowerPoint presentations that communicate your ideas and engage audiences. Save time and effort by using our pre-designed presentation templates that are perfect for a wide range of topic. Our vast selection of designs covers a range of styles, from creative to business, and are all highly customizable and easy to edit. Download as a PowerPoint template or use them as Google Slides themes. This slide showcases opportunities of data mining tools market which can help associated players to gain insights and leverage available ventures. It provides details about benefits, AI technologies and retail industry.
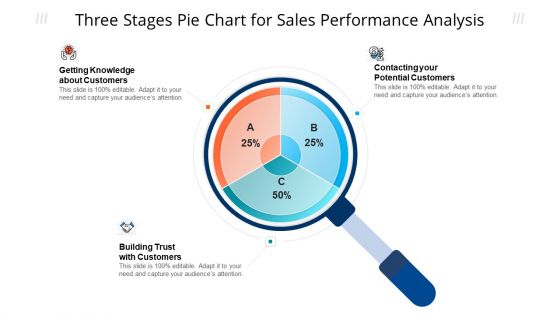
Three Stages Pie Chart For Sales Performance Analysis Ppt Model Tips PDF
Persuade your audience using this three stages pie chart for sales performance analysis ppt model tips pdf. This PPT design covers three stages, thus making it a great tool to use. It also caters to a variety of topics including potential customers, knowledge about customers, sales performance analysis. Download this PPT design now to present a convincing pitch that not only emphasizes the topic but also showcases your presentation skills.
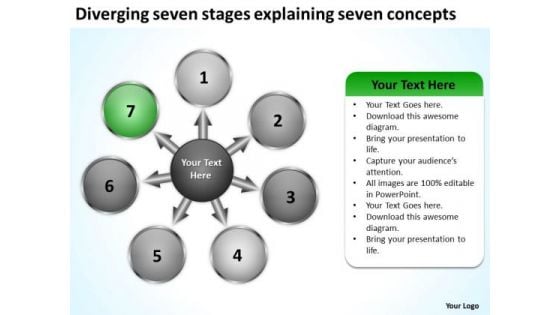
Seven Stages Explaining Concepts Circular Flow Motion Chart PowerPoint Slides
We present our seven stages explaining concepts Circular Flow Motion Chart PowerPoint Slides.Download our Process and Flows PowerPoint Templates because you are buzzing with ideas. Download and present our Business PowerPoint Templates because you are ready to flap your wings and launch off. All poised are you to touch the sky with glory. Download and present our Marketing PowerPoint Templates because you can Educate your team with the attention to be paid. Use our Signs PowerPoint Templates because this diagram provides range of options to garner your interest. Present our Arrows PowerPoint Templates because it helps to churn the mixture to the right degree and pound home your views and expectations in a spectacularly grand and virtuoso fluid performance.Use these PowerPoint slides for presentations relating to Arrows, background, blue, chart, circle, circular, circulation, color, connection, continuity, cycle, cyclic, diagram, direction, empty, flow, graph, icon, illustration, isolated, isolated on white, loop, motion, presentation, process, progress, reason, recycle, recycling, repetition, report, result, ring, rotation, round, scheme, section, step, symbol, teamwork, four dimensional. The prominent colors used in the PowerPoint template are Green, White, Gray. The feedback we get is that our seven stages explaining concepts Circular Flow Motion Chart PowerPoint Slides are Versatile. The feedback we get is that our circle PowerPoint templates and PPT Slides will save the presenter time. People tell us our seven stages explaining concepts Circular Flow Motion Chart PowerPoint Slides are Pretty. We assure you our chart PowerPoint templates and PPT Slides are Stunning. We assure you our seven stages explaining concepts Circular Flow Motion Chart PowerPoint Slides are One-of-a-kind. The feedback we get is that our circulation PowerPoint templates and PPT Slides will make the presenter look like a pro even if they are not computer savvy. Our Seven Stages Explaining Concepts Circular Flow Motion Chart PowerPoint Slides are like field glasses. Get a clearer view of events in the distance.
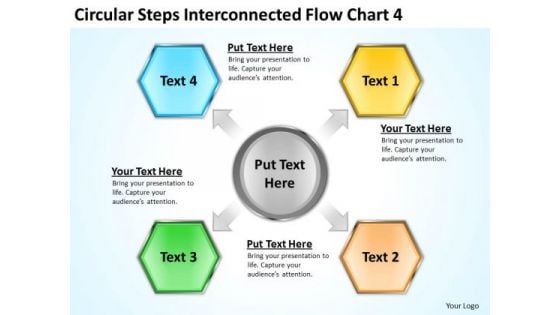
Steps Interconnected Flow Chart 4 Business Plan Preparation Service PowerPoint Templates
We present our steps interconnected flow chart 4 business plan preparation service PowerPoint templates.Present our Hexagon PowerPoint Templates because You can Be the star of the show with our PowerPoint Templates and Slides. Rock the stage with your ideas. Present our Circle Charts PowerPoint Templates because Our PowerPoint Templates and Slides are innately eco-friendly. Their high recall value negate the need for paper handouts. Use our Arrows PowerPoint Templates because You aspire to touch the sky with glory. Let our PowerPoint Templates and Slides provide the fuel for your ascent. Present our Shapes PowerPoint Templates because Our PowerPoint Templates and Slides offer you the needful to organise your thoughts. Use them to list out your views in a logical sequence. Download and present our Process and Flows PowerPoint Templates because You can Be the puppeteer with our PowerPoint Templates and Slides as your strings. Lead your team through the steps of your script.Use these PowerPoint slides for presentations relating to media, search, network, statistics, like, email, community, concept, arrow, tablet, sign, social media, internet, app, star, marketing, technology, computer, abstract, icon, optimization, connection, seo, frame, pc, web, design, blue, heart, global, smm, information, background, blog, advertising, analytics, message, promotion, software, site, infographics, communication. The prominent colors used in the PowerPoint template are Purple, Yellow, Orange. Make your ascent a delightful one. Give your career a booster dose with our Steps Interconnected Flow Chart 4 Business Plan Preparation Service PowerPoint Templates.
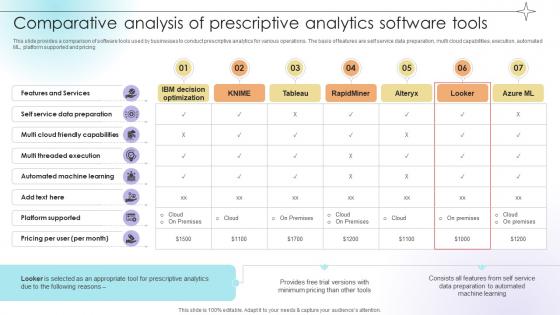
Comparative Analysis Of Prescriptive Analytics Software Tools Data Analytics SS V
This slide provides a comparison of software tools used by businesses to conduct prescriptive analytics for various operations. The basis of features are self service data preparation, multi cloud capabilities, execution, automated ML, platform supported and pricing.Are you searching for a Comparative Analysis Of Prescriptive Analytics Software Tools Data Analytics SS V that is uncluttered, straightforward, and original Its easy to edit, and you can change the colors to suit your personal or business branding. For a presentation that expresses how much effort you have put in, this template is ideal With all of its features, including tables, diagrams, statistics, and lists, its perfect for a business plan presentation. Make your ideas more appealing with these professional slides. Download Comparative Analysis Of Prescriptive Analytics Software Tools Data Analytics SS V from Slidegeeks today. This slide provides a comparison of software tools used by businesses to conduct prescriptive analytics for various operations. The basis of features are self service data preparation, multi cloud capabilities, execution, automated ML, platform supported and pricing.

Receivables Management Process Ppt PowerPoint Presentation Complete Deck With Slides
Deliver a credible and compelling presentation by deploying this Receivables Management Process Ppt PowerPoint Presentation Complete Deck With Slides. Intensify your message with the right graphics, images, icons, etc. presented in this complete deck. This PPT template is a great starting point to convey your messages and build a good collaboration. The fourteen slides added to this PowerPoint slideshow helps you present a thorough explanation of the topic. You can use it to study and present various kinds of information in the form of stats, figures, data charts, and many more. This Receivables Management Process Ppt PowerPoint Presentation Complete Deck With Slides PPT slideshow is available for use in standard and widescreen aspects ratios. So, you can use it as per your convenience. Apart from this, it can be downloaded in PNG, JPG, and PDF formats, all completely editable and modifiable. The most profound feature of this PPT design is that it is fully compatible with Google Slides making it suitable for every industry and business domain.
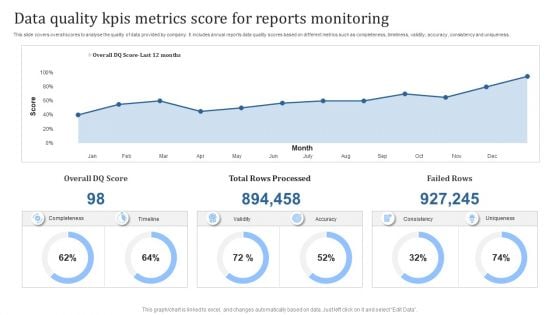
Data Quality Kpis Metrics Score For Reports Monitoring Download PDF
This slide covers overall scores to analyse the quality of data provided by company. It includes annual reports data quality scores based on different metrics such as completeness, timeliness, validity, accuracy, consistency and uniqueness. Showcasing this set of slides titled Data Quality Kpis Metrics Score For Reports Monitoring Download PDF. The topics addressed in these templates are Total Rows Processed, Failed Rows. All the content presented in this PPT design is completely editable. Download it and make adjustments in color, background, font etc. as per your unique business setting.
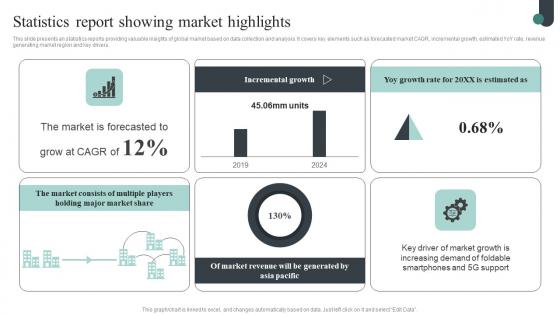
Competitive Intelligence Guide To Determine Market Statistics Report Showing Introduction Pdf
This slide presents an statistics reports providing valuable insights of global market based on data collection and analysis. It covers key elements such as forecasted market CAGR, incremental growth, estimated YoY rate, revenue generating market region and key drivers. The Competitive Intelligence Guide To Determine Market Statistics Report Showing Introduction Pdf is a compilation of the most recent design trends as a series of slides. It is suitable for any subject or industry presentation, containing attractive visuals and photo spots for businesses to clearly express their messages. This template contains a variety of slides for the user to input data, such as structures to contrast two elements, bullet points, and slides for written information. Slidegeeks is prepared to create an impression. This slide presents an statistics reports providing valuable insights of global market based on data collection and analysis. It covers key elements such as forecasted market CAGR, incremental growth, estimated YoY rate, revenue generating market region and key drivers.
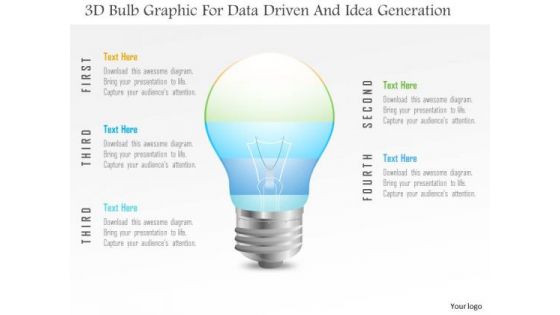
Business Diagram 3d Bulb Graphic For Data Driven And Idea Generation PowerPoint Slide
This Power Point template has been designed with 3d bulb graphic. Use this slide to represent technology idea and strategy concepts. Download this diagram for your business presentations and get exclusive comments on your efforts.
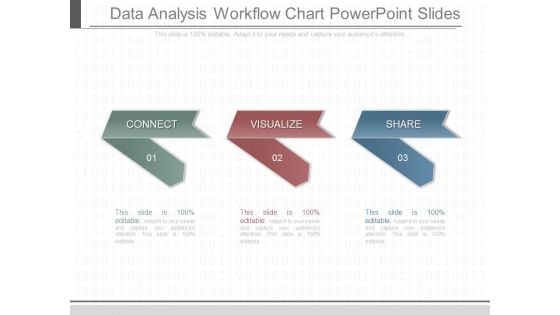
Data Analysis Workflow Chart Powerpoint Slides
This is a data analysis workflow chart powerpoint slides. This is a three stage process. The stages in this process are connect, visualize, share.
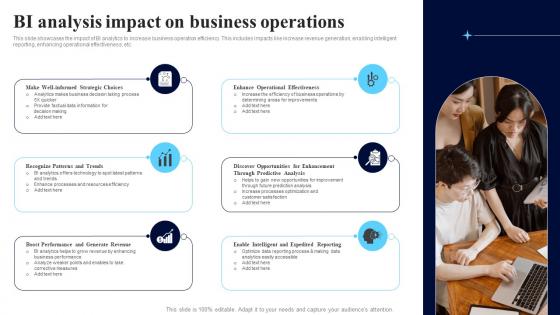
BI Analysis Impact On Business Operations Themes Pdf
This slide showcases the impact of BI analytics to increase business operation efficiency. This includes impacts like increase revenue generation, enabling intelligent reporting, enhancing operational effectiveness, etc. Showcasing this set of slides titled BI Analysis Impact On Business Operations Themes Pdf. The topics addressed in these templates are Recognize Patterns, Enhance Operational Effectiveness, Expedited Reporting. All the content presented in this PPT design is completely editable. Download it and make adjustments in color, background, font etc. as per your unique business setting. This slide showcases the impact of BI analytics to increase business operation efficiency. This includes impacts like increase revenue generation, enabling intelligent reporting, enhancing operational effectiveness, etc.

Illustration Of 6 Data Processes And Flows Cycle Arrow PowerPoint Templates
We present our illustration of 6 data processes and flows Cycle Arrow PowerPoint templates.Present our Arrows PowerPoint Templates because knowledge is power goes the popular saying. Download our Process and Flows PowerPoint Templates because there is a crucial aspect that requires extra attention. Present our Business PowerPoint Templates because the NASA Space programme took mankind to the moon and so much more. Like them you too can look far beyond normal boundaries. Show them that in your mind the sky is certainly not the limit. Download and present our Shapes PowerPoint Templates because this template helps you to bring your audiences to the table. Present our Circle Charts PowerPoint Templates because let your words be the drops of wisdom spreading knowledge and peace like ripples through the expectant minds of your devoted followers.Use these PowerPoint slides for presentations relating to Arrows, Background, Blue, Chart, Circle, Circular, Circulation, Color, Connection, Continuity, Cycle, Cyclic, Diagram, Direction, Empty, Flow, Four, Dimensional, Graph, Icon, Presentation, Process, Progress, Reason, Recycle, Recycling, Repetition, Report, Result, Ring, Rotation, Round, Scheme, Section, Step, Symbol, Teamwork. The prominent colors used in the PowerPoint template are Yellow, Gray, White. Professionals tell us our illustration of 6 data processes and flows Cycle Arrow PowerPoint templates will impress their bosses and teams. You can be sure our Circulation PowerPoint templates and PPT Slides are Functional. Customers tell us our illustration of 6 data processes and flows Cycle Arrow PowerPoint templates are specially created by a professional team with vast experience. They diligently strive to come up with the right vehicle for your brilliant Ideas. Professionals tell us our Connection PowerPoint templates and PPT Slides are Graceful. People tell us our illustration of 6 data processes and flows Cycle Arrow PowerPoint templates are Awesome. People tell us our Connection PowerPoint templates and PPT Slides are Spiffy. Examine all possibilities with our Illustration Of 6 Data Processes And Flows Cycle Arrow PowerPoint Templates. Give every option a real close look.
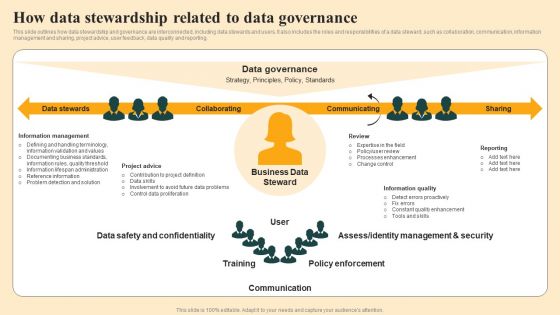
How Data Stewardship Related To Data Governance Introduction PDF
This slide outlines how data stewardship and governance are interconnected, including data stewards and users. It also includes the roles and responsibilities of a data steward, such as collaboration, communication, information management and sharing, project advice, user feedback, data quality and reporting. Do you know about Slidesgeeks How Data Stewardship Related To Data Governance Introduction PDF These are perfect for delivering any kind od presentation. Using it, create PowerPoint presentations that communicate your ideas and engage audiences. Save time and effort by using our pre designed presentation templates that are perfect for a wide range of topic. Our vast selection of designs covers a range of styles, from creative to business, and are all highly customizable and easy to edit. Download as a PowerPoint template or use them as Google Slides themes.

 Home
Home