Dashboard Icon
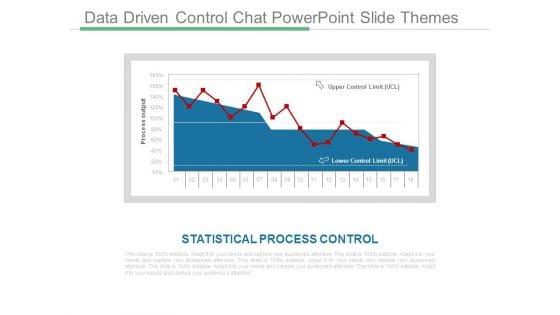
Data Driven Control Chat Powerpoint Slide Themes
This is a data driven control chat powerpoint slide themes. This is a one stage process. The stages in this process are process output, upper control limit, statistical process control, lower control limit.

Market Research Data Collection Chart Presentation
This is a market research data collection chart presentation. This is a five stage process. The stages in this process are concept testing, customer satisfaction, pricing research, market segmentation, awareness usage.
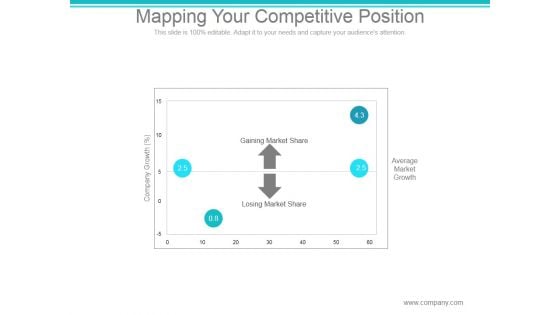
Mapping Your Competitive Position Ppt PowerPoint Presentation Files
This is a mapping your competitive position ppt powerpoint presentation files. This is a four stage process. The stages in this process are gaining market share, losing market share, company growth, average market growth.
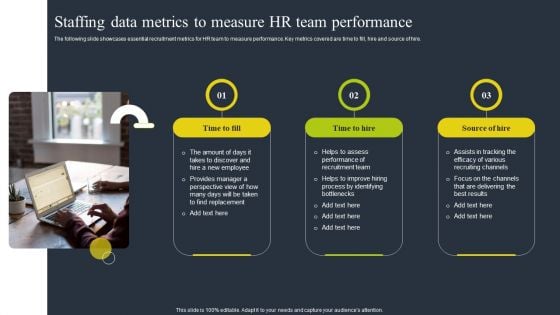
Staffing Data Metrics To Measure HR Team Performance Graphics PDF
The following slide showcases essential recruitment metrics for HR team to measure performance. Key metrics covered are time to fill, hire and source of hire. Presenting Staffing Data Metrics To Measure HR Team Performance Graphics PDF to dispense important information. This template comprises three stages. It also presents valuable insights into the topics including Employee, Recruitment Team, Recruiting Channels. This is a completely customizable PowerPoint theme that can be put to use immediately. So, download it and address the topic impactfully.
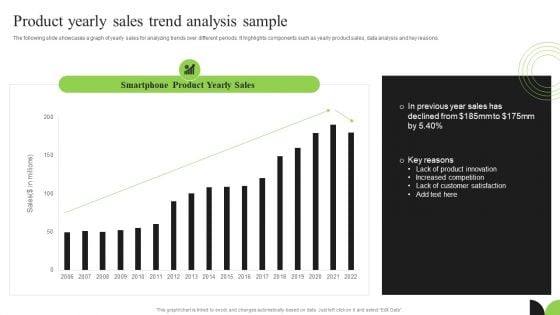
Guidebook For Executing Business Market Intelligence Product Yearly Sales Trend Analysis Sample Pictures PDF
The following slide showcases a graph of yearly sales for analyzing trends over different periods. It highlights components such as yearly product sales, data analysis and key reasons. There are so many reasons you need a Guidebook For Executing Business Market Intelligence Product Yearly Sales Trend Analysis Sample Pictures PDF. The first reason is you can not spend time making everything from scratch, Thus, Slidegeeks has made presentation templates for you too. You can easily download these templates from our website easily.

Customized Analytical Support Diagram Powerpoint Presentation Examples
This is a customized analytical support diagram powerpoint presentation examples. This is a four stage process. The stages in this process are scope and define the problem, data gathering and investigation, develop options, recommendation report.

Emerging Digital Trends Transforming Retail Sector Optimizing Retail Operations With Digital DT SS V
This slide presents the emerging trends that are transforming the retail industry marketing area. It include voice search optimization, user-generated content, virtual events and experiences, chatbots and conversational marketing and social commerce.Are you searching for a Emerging Digital Trends Transforming Retail Sector Optimizing Retail Operations With Digital DT SS V that is uncluttered, straightforward, and original Its easy to edit, and you can change the colors to suit your personal or business branding. For a presentation that expresses how much effort you have put in, this template is ideal With all of its features, including tables, diagrams, statistics, and lists, its perfect for a business plan presentation. Make your ideas more appealing with these professional slides. Download Emerging Digital Trends Transforming Retail Sector Optimizing Retail Operations With Digital DT SS V from Slidegeeks today. This slide presents the emerging trends that are transforming the retail industry marketing area. It include voice search optimization, user-generated content, virtual events and experiences, chatbots and conversational marketing and social commerce.

Iot And Digital Twin To Reduce Costs Post Covid Key Performance Indicators In Oil And Gas Industry Infographics PDF
This slide focuses on the key performance indicators in oil and gas industry which includes loss of primary containment, oil spills, greenhouse gas emissions, etc. Deliver an awe inspiring pitch with this creative iot and digital twin to reduce costs post covid key performance indicators in oil and gas industry infographics pdf bundle. Topics like reported recordable injury frequency, loss of primary containment, oil spills, diversity and inclusion, group priorities engagement can be discussed with this completely editable template. It is available for immediate download depending on the needs and requirements of the user.

Business Diagrams 3d Man With Com PowerPoint Templates
We present our business diagrams 3d man with com PowerPoint templates.Download and present our Technology PowerPoint Templates because Our PowerPoint Templates and Slides will provide weight to your words. They will bring out the depth of your thought process. Use our Business PowerPoint Templates because Our PowerPoint Templates and Slides are innately eco-friendly. Their high recall value negate the need for paper handouts. Present our Shapes PowerPoint Templates because Our PowerPoint Templates and Slides will let your team Walk through your plans. See their energy levels rise as you show them the way. Present our Process and Flows PowerPoint Templates because Our PowerPoint Templates and Slides will let you meet your Deadlines. Use our Leadership PowerPoint Templates because Our PowerPoint Templates and Slides are innately eco-friendly. Their high recall value negate the need for paper handouts.Use these PowerPoint slides for presentations relating to 3d, Com, Communication, Computer, Concepts, Connecting, Continent, Data, Discussion, Earth, Figure, Friendship, Global, Globe, Guy, Human, Icon, Idea, Information, Internet, Leadership, Male, Manager, Map, Medium, Men, Message, Network, Page, People, Person, Puppet, Render, Shape, Sign, Standing, Symbol, Text, Three-Dimensional, Web, White, World, Www. The prominent colors used in the PowerPoint template are Blue, Gray, White. Professionals tell us our business diagrams 3d man with com PowerPoint templates will generate and maintain the level of interest you desire. They will create the impression you want to imprint on your audience. The feedback we get is that our Computer PowerPoint templates and PPT Slides will make the presenter look like a pro even if they are not computer savvy. Professionals tell us our business diagrams 3d man with com PowerPoint templates will impress their bosses and teams. People tell us our Concepts PowerPoint templates and PPT Slides provide great value for your money. Be assured of finding the best projection to highlight your words. PowerPoint presentation experts tell us our business diagrams 3d man with com PowerPoint templates are incredible easy to use. You can be sure our Continent PowerPoint templates and PPT Slides will help you be quick off the draw. Just enter your specific text and see your points hit home. Construct organizations with our Business Diagrams 3d Man With Com PowerPoint Templates. Download without worries with our money back guaranteee.
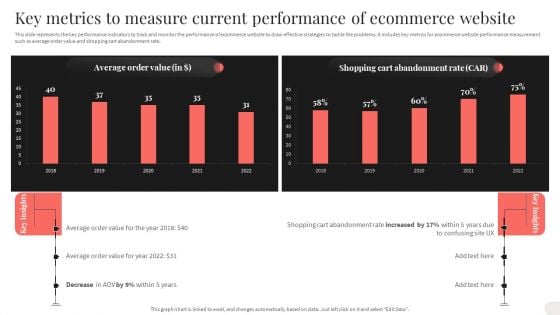
Key Metrics To Measure Current Performance Of Ecommerce Website Structure PDF
This slide represents the key performance indicators to track and monitor the performance of ecommerce website to draw effective strategies to tackle the problems. It includes key metrics for ecommerce website performance measurement such as average order value and shopping cart abandonment rate. There are so many reasons you need a Key Metrics To Measure Current Performance Of Ecommerce Website Structure PDF. The first reason is you can not spend time making everything from scratch, Thus, Slidegeeks has made presentation templates for you too. You can easily download these templates from our website easily.
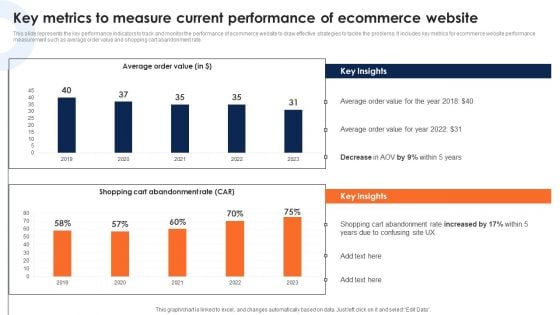
Key Metrics To Measure Current Performance Of Ecommerce Website Clipart PDF
This slide represents the key performance indicators to track and monitor the performance of ecommerce website to draw effective strategies to tackle the problems. It includes key metrics for ecommerce website performance measurement such as average order value and shopping cart abandonment rate.The best PPT templates are a great way to save time, energy, and resources. Slidegeeks have 100precent editable powerpoint slides making them incredibly versatile. With these quality presentation templates, you can create a captivating and memorable presentation by combining visually appealing slides and effectively communicating your message. Download Key Metrics To Measure Current Performance Of Ecommerce Website Clipart PDF from Slidegeeks and deliver a wonderful presentation.
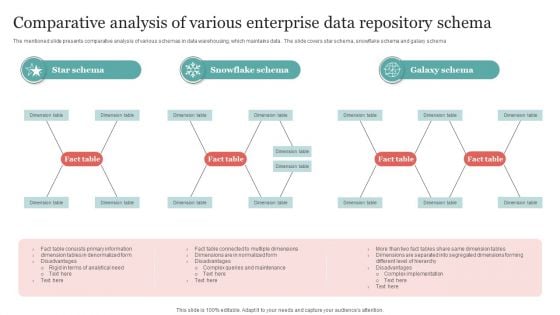
Comparative Analysis Of Various Enterprise Data Repository Schema Microsoft PDF
The mentioned slide presents comparative analysis of various schemas in data warehousing, which maintains data . The slide covers star schema, snowflake schema and galaxy schema Pitch your topic with ease and precision using this Comparative Analysis Of Various Enterprise Data Repository Schema Microsoft PDF. This layout presents information on Galaxy Schema, Snowflake Schema, Star Schema. It is also available for immediate download and adjustment. So, changes can be made in the color, design, graphics or any other component to create a unique layout.
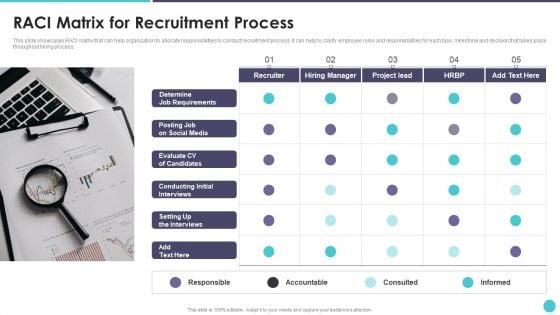
Action Plan To Optimize Hiring Process RACI Matrix For Recruitment Process Diagrams PDF
This slide showcases RACI matrix that can help organization to allocate responsibilities to conduct recruitment process. It can help to clarify employee roles and responsibilities for each task, milestone and decision that takes place throughout hiring process.This is a Action Plan To Optimize Hiring Process RACI Matrix For Recruitment Process Diagrams PDF template with various stages. Focus and dispense information on one stage using this creative set, that comes with editable features. It contains large content boxes to add your information on topics like Determine, Job Requirements, Conducting Initial Interviews You can also showcase facts, figures, and other relevant content using this PPT layout. Grab it now.
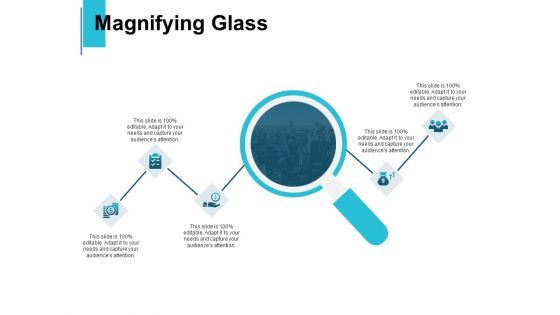
Magnifying Glass Technology Ppt PowerPoint Presentation Diagram Templates
Presenting this set of slides with name magnifying glass technology ppt powerpoint presentation diagram templates. This is a five stage process. The stages in this process are magnifying glass, research, marketing, strategy, business. This is a completely editable PowerPoint presentation and is available for immediate download. Download now and impress your audience.

Business Diagram Extract Transform Load Etl Business Intelligence Bug Data Analysis Pipeline Ppt Sli
This PowerPoint template has been designed with graphic of server. This diagram depicts the concept of ETL business intelligence with extract transform load. This slide also helps to display the data analysis pipeline.
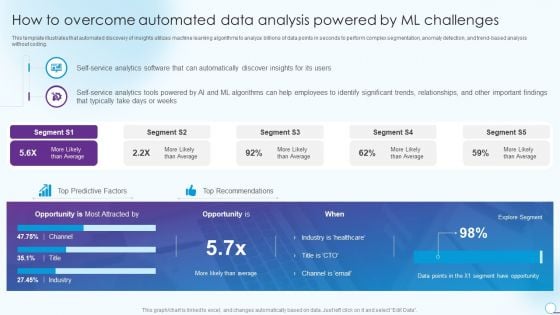
How To Overcome Automated Data Analysis Powered By Ml Challenges Elements PDF
This template illustrates that automated discovery of insights utilizes machine learning algorithms to analyze billions of data points in seconds to perform complex segmentation, anomaly detection, and trend based analysis without coding. Deliver an awe inspiring pitch with this creative How To Overcome Automated Data Analysis Powered By Ml Challenges Elements PDF bundle. Topics like Opportunity, Average, Self Service Analytics can be discussed with this completely editable template. It is available for immediate download depending on the needs and requirements of the user.
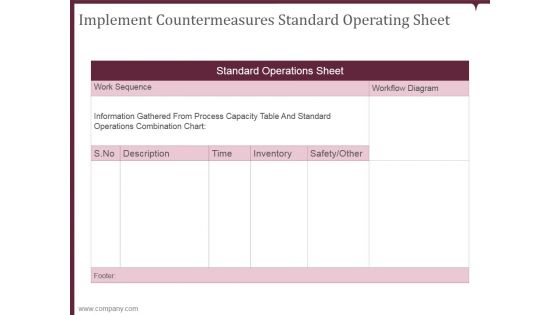
Implement Countermeasures Standard Operating Sheet Ppt PowerPoint Presentation Rules
This is a implement countermeasures standard operating sheet ppt powerpoint presentation rules. This is a three stage process. The stages in this process are work sequence, workflow diagram, description, time, inventory.
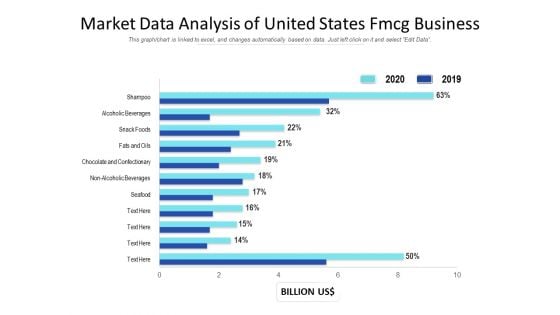
Market Data Analysis Of United States Fmcg Business Ppt PowerPoint Presentation Gallery Deck PDF
Showcasing this set of slides titled market data analysis of united states fmcg business ppt powerpoint presentation gallery deck pdf. The topics addressed in these templates are market data analysis of united states fmcg business. All the content presented in this PPT design is completely editable. Download it and make adjustments in color, background, font etc. as per your unique business setting.
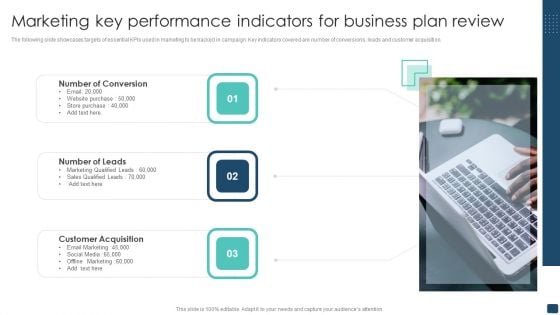
Marketing Key Performance Indicators For Business Plan Review Template PDF
The following slide showcases targets of essential KPIs used in marketing to be tracked in campaign. Key indicators covered are number of conversions, leads and customer acquisition. Presenting Marketing Key Performance Indicators For Business Plan Review Template PDF to dispense important information. This template comprises three stages. It also presents valuable insights into the topics including Number Of Conversion, Number Of Leads, Customer Acquisition. This is a completely customizable PowerPoint theme that can be put to use immediately. So, download it and address the topic impactfully.

Job Aid Layout With Data Analysis Ppt PowerPoint Presentation File Themes PDF
Presenting job aid layout with data analysis ppt powerpoint presentation file themes pdf to dispense important information. This template comprises five stages. It also presents valuable insights into the topics including data, plan, analysis. This is a completely customizable PowerPoint theme that can be put to use immediately. So, download it and address the topic impactfully.
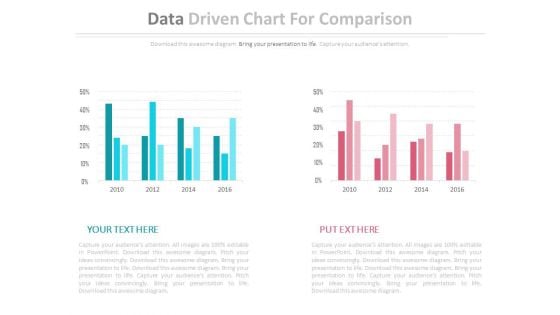
Two Data Driven Comparison Charts Powerpoint Slides
This PowerPoint template contains diagram of two data driven charts. You may use this PPT slide to depict strategic analysis for business. The color coding of this template is specifically designed to highlight you points.

Information Studies Phases Of Data Science Operationalize Pictures PDF
This slide describes the operational phase of data science and what tasks are performed in this phase, such as deliver final reports, pilot project implementation, and how it will be helpful in monitoring performance. This is a Information Studies Phases Of Data Science Operationalize Pictures PDF template with various stages. Focus and dispense information on three stages using this creative set, that comes with editable features. It contains large content boxes to add your information on topics like Technical Documents, Implemented, Production Platform. You can also showcase facts, figures, and other relevant content using this PPT layout. Grab it now.
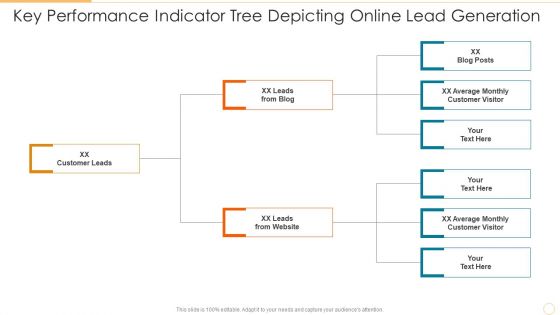
Key Performance Indicator Tree Depicting Online Lead Generation Information PDF
Persuade your audience using this key performance indicator tree depicting online lead generation information pdf. This PPT design covers three stages, thus making it a great tool to use. It also caters to a variety of topics including customer leads, leads from blog, leads from website. Download this PPT design now to present a convincing pitch that not only emphasizes the topic but also showcases your presentation skills.
Business Organizational Chart Template 3d Man And Red Folder PowerPoint Templates
We present our business organizational chart template 3d man and red folder PowerPoint templates.Use our Computer PowerPoint Templates because Our PowerPoint Templates and Slides are specially created by a professional team with vast experience. They diligently strive to come up with the right vehicle for your brilliant Ideas. Download and present our Business PowerPoint Templates because It will get your audience in sync. Use our Symbol PowerPoint Templates because You have gained great respect for your brilliant ideas. Use our PowerPoint Templates and Slides to strengthen and enhance your reputation. Use our Technology PowerPoint Templates because You aspire to touch the sky with glory. Let our PowerPoint Templates and Slides provide the fuel for your ascent. Present our Shapes PowerPoint Templates because our PowerPoint Templates and Slides are the string of your bow. Fire of your ideas and conquer the podium.Use these PowerPoint slides for presentations relating to 3d, Archive, Background, Binder, Bureaucracy, Business, Cartoon, Computer, Concept, Data, Document, File, Folder, Group, Heavy, Human, Icon, Idea, Illustration, Image, Information, Internet, Isolated, Manager, Men, Occupation, Office, Order, Organization, Paper, Paperwork, People, Person, Portfolio, Red, Render, Shape, Storage, Success, Support, Symbol, Technology, Three-Dimensional. The prominent colors used in the PowerPoint template are Red, Gray, White. We assure you our business organizational chart template 3d man and red folder PowerPoint templates will make you look like a winner. Use our Cartoon PowerPoint templates and PPT Slides will make the presenter successul in his career/life. We assure you our business organizational chart template 3d man and red folder PowerPoint templates are designed by a team of presentation professionals. Professionals tell us our Bureaucracy PowerPoint templates and PPT Slides are specially created by a professional team with vast experience. They diligently strive to come up with the right vehicle for your brilliant Ideas. The feedback we get is that our business organizational chart template 3d man and red folder PowerPoint templates will make you look like a winner. You can be sure our Bureaucracy PowerPoint templates and PPT Slides effectively help you save your valuable time. Our Business Organizational Chart Template 3d Man And Red Folder PowerPoint Templates are geared for excellence. They will have your thoughts accelerating away.
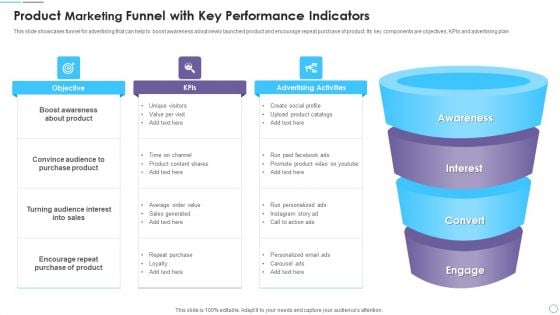
Product Marketing Funnel With Key Performance Indicators Guidelines PDF
This slide showcases funnel for advertising that can help to boost awareness about newly launched product and encourage repeat purchase of product. Its key components are objectives, KPIs and advertising plan. Presenting Product Marketing Funnel With Key Performance Indicators Guidelines PDF to dispense important information. This template comprises four stages. It also presents valuable insights into the topics including Awareness, Interest, Convert, Engage. This is a completely customizable PowerPoint theme that can be put to use immediately. So, download it and address the topic impactfully.
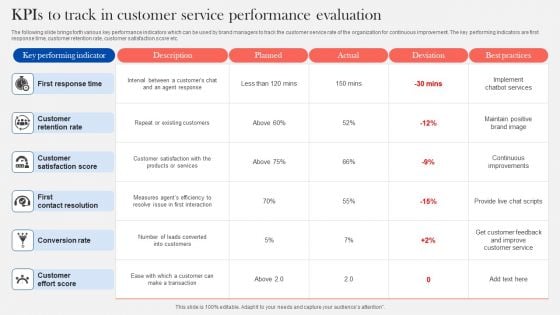
Kpis To Track In Customer Service Performance Evaluation Diagrams PDF
The following slide brings forth various key performance indicators which can be used by brand managers to track the customer service rate of the organization for continuous improvement. The key performing indicators are first response time, customer retention rate, customer satisfaction score etc. Showcasing this set of slides titled Kpis To Track In Customer Service Performance Evaluation Diagrams PDF. The topics addressed in these templates are First Response Time, Customer Retention Rate, Customer Satisfaction Score. All the content presented in this PPT design is completely editable. Download it and make adjustments in color, background, font etc. as per your unique business setting.
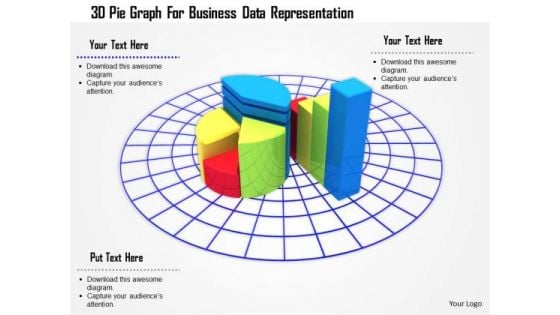
Stock Photo 3d Pie Graph For Business Data Representation PowerPoint Slide
3D business graph has been used to design this PowerPoint template. This Image slide is suitable to make business reports and charts. This slide can be used for business and marketing presentations.
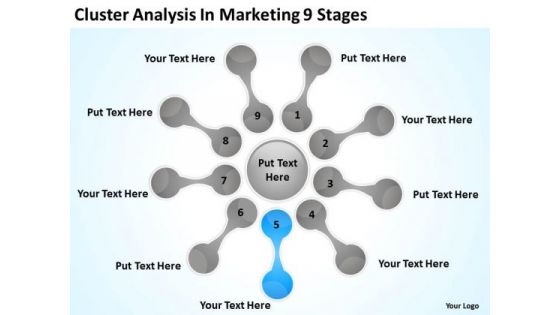
Cluster Analysis In Marketing 9 Stages Ppt Business Plan Format PowerPoint Templates
We present our cluster analysis in marketing 9 stages ppt business plan format PowerPoint templates.Download and present our Flow Charts PowerPoint Templates because Your ideas provide food for thought. Our PowerPoint Templates and Slides will help you create a dish to tickle the most discerning palate. Present our Process and Flows PowerPoint Templates because Our PowerPoint Templates and Slides help you pinpoint your timelines. Highlight the reasons for your deadlines with their use. Download and present our Shapes PowerPoint Templates because you can Break through with our PowerPoint Templates and Slides. Bring down the mental barriers of your audience. Use our Circle Charts PowerPoint Templates because Our PowerPoint Templates and Slides will let you Hit the target. Go the full distance with ease and elan. Download our Marketing PowerPoint Templates because our PowerPoint Templates and Slides will give your ideas the shape.Use these PowerPoint slides for presentations relating to Mapping, vector, chart, flow, flowchart, process, model, step, tool, blank, processdiagram, concept, topic, presentation, relate, circle, graphic, data, report, marketing, idea, circlepattern, team, management, graph, cycle, illustration, connection, processchart,direction, plans, color, text, phase, organization, control, connect, link, explanation, mapping, present. The prominent colors used in the PowerPoint template are Blue light, White, Gray. Lean is in, fat is out. Our Cluster Analysis In Marketing 9 Stages Ppt Business Plan Format PowerPoint Templates achieve the desired look.
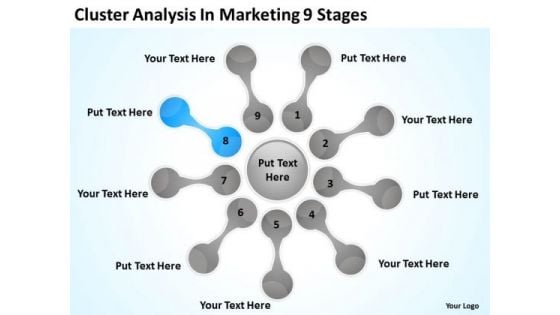
Cluster Analysis In Marketing 9 Stages Ppt Fill The Blank Business Plan PowerPoint Slides
We present our cluster analysis in marketing 9 stages ppt fill the blank business plan PowerPoint Slides.Download and present our Flow Charts PowerPoint Templates because Our PowerPoint Templates and Slides are focused like a searchlight beam. They highlight your ideas for your target audience. Use our Process and Flows PowerPoint Templates because They will Put your wonderful verbal artistry on display. Our PowerPoint Templates and Slides will provide you the necessary glam and glitter. Use our Shapes PowerPoint Templates because They will Put your wonderful verbal artistry on display. Our PowerPoint Templates and Slides will provide you the necessary glam and glitter. Use our Circle Charts PowerPoint Templates because Our PowerPoint Templates and Slides will weave a web of your great ideas. They are gauranteed to attract even the most critical of your colleagues. Use our Marketing PowerPoint Templates because These PowerPoint Templates and Slides will give the updraft to your ideas. See them soar to great heights with ease.Use these PowerPoint slides for presentations relating to Mapping, vector, chart, flow, flowchart, process, model, step, tool, blank, processdiagram, concept, topic, presentation, relate, circle, graphic, data, report, marketing, idea, circlepattern, team, management, graph, cycle, illustration, connection, processchart,direction, plans, color, text, phase, organization, control, connect, link, explanation, mapping, present. The prominent colors used in the PowerPoint template are Blue light, White, Gray. An array of colors give our Cluster Analysis In Marketing 9 Stages Ppt Fill The Blank Business Plan PowerPoint Slides an alluring blend. They make your thoughts very enticing.
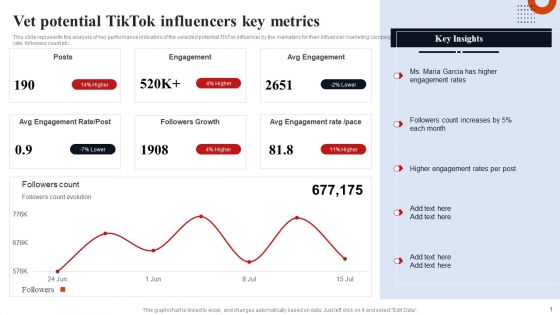
Vet Potential Tiktok Influencers Key Metrics Template PDF
This slide represents the analysis of key performance indicators of the selected potential TikTok influencer by the marketers for their influencer marketing campaign. It includes details related to key metrics such as engagement rate, followers count etc. Explore a selection of the finest Vet Potential Tiktok Influencers Key Metrics Template PDF here. With a plethora of professionally designed and pre made slide templates, you can quickly and easily find the right one for your upcoming presentation. You can use our Vet Potential Tiktok Influencers Key Metrics Template PDF to effectively convey your message to a wider audience. Slidegeeks has done a lot of research before preparing these presentation templates. The content can be personalized and the slides are highly editable. Grab templates today from Slidegeeks.
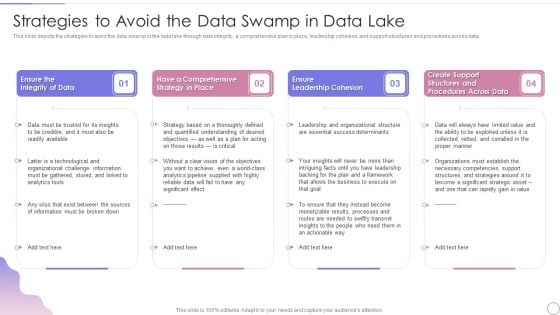
Data Lake Architecture Future Of Data Analysis Strategies To Avoid The Data Swamp In Data Lake Themes PDF
This slide depicts the strategies to avoid the data swamp in the data lake through data integrity, a comprehensive plan in place, leadership cohesion, and support structures and procedures across data.Deliver and pitch your topic in the best possible manner with this Data Lake Architecture Future Of Data Analysis Strategies To Avoid The Data Swamp In Data Lake Themes PDF. Use them to share invaluable insights on Leadership Cohesion, Procedures Across, Success Determinants and impress your audience. This template can be altered and modified as per your expectations. So, grab it now.

Business People 3d Men On Pie Chart Dealing PowerPoint Templates Ppt Backgrounds For Slides
We present our business people 3d men on pie chart dealing PowerPoint templates PPT backgrounds for slides.Present our Business PowerPoint Templates because Our PowerPoint Templates and Slides are specially created by a professional team with vast experience. They diligently strive to come up with the right vehicle for your brilliant Ideas. Present our Handshake PowerPoint Templates because Our PowerPoint Templates and Slides provide you with a vast range of viable options. Select the appropriate ones and just fill in your text. Download our Pie Charts PowerPoint Templates because Our PowerPoint Templates and Slides will let you meet your Deadlines. Download our Ring Charts PowerPoint Templates because Our PowerPoint Templates and Slides are created with admirable insight. Use them and give your group a sense of your logical mind. Present our Shapes PowerPoint Templates because Our PowerPoint Templates and Slides come in all colours, shades and hues. They help highlight every nuance of your views.Use these PowerPoint slides for presentations relating to 3d, agreement, bar, boardroom, business, cartoon, cash, cgi, chart, company,concept, conceptual, corporate, council, deal, decision, graph, guy,handshake, handshake, icon, illustration, in,between, man, market, , meeting, merger, metaphor, middle, middleground, office, partner,partnership, person, pie, report, shake, silver, success, team, teamwork, together,toon, union, united. The prominent colors used in the PowerPoint template are Red, Blue, Gray. Professionals tell us our business people 3d men on pie chart dealing PowerPoint templates PPT backgrounds for slides effectively help you save your valuable time. Professionals tell us our bar PowerPoint templates and PPT Slides effectively help you save your valuable time. People tell us our business people 3d men on pie chart dealing PowerPoint templates PPT backgrounds for slides will make the presenter look like a pro even if they are not computer savvy. Customers tell us our boardroom PowerPoint templates and PPT Slides look good visually. The feedback we get is that our business people 3d men on pie chart dealing PowerPoint templates PPT backgrounds for slides effectively help you save your valuable time. Use our business PowerPoint templates and PPT Slides look good visually. Create plans with our Business People 3d Men On Pie Chart Dealing PowerPoint Templates Ppt Backgrounds For Slides. Download without worries with our money back guaranteee.
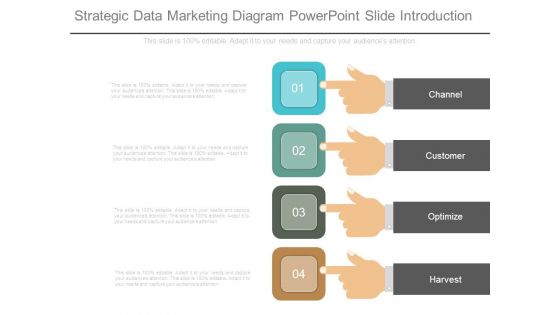
Strategic Data Marketing Diagram Powerpoint Slide Introduction
This is a strategic data marketing diagram powerpoint slide introduction. This is a four stage process. The stages in this process are channel, customer, optimize, harvest.

Business Flowchart 3d Man With Blog Discussion PowerPoint Templates
We present our business flowchart 3d man with blog discussion PowerPoint templates.Download and present our Global PowerPoint Templates because Our PowerPoint Templates and Slides are effectively colour coded to prioritise your plans They automatically highlight the sequence of events you desire. Download and present our People PowerPoint Templates because Our PowerPoint Templates and Slides will definately Enhance the stature of your presentation. Adorn the beauty of your thoughts with their colourful backgrounds. Present our Business PowerPoint Templates because You have gained great respect for your brilliant ideas. Use our PowerPoint Templates and Slides to strengthen and enhance your reputation. Present our Internet PowerPoint Templates because Our PowerPoint Templates and Slides has conjured up a web of all you need with the help of our great team. Use them to string together your glistening ideas. Present our Computer PowerPoint Templates because Our PowerPoint Templates and Slides are conceived by a dedicated team. Use them and give form to your wondrous ideas.Use these PowerPoint slides for presentations relating to 3d, Blog, Character, Communication, Computer, Concepts, Connecting, Continent, Data, Discussion, Earth, Figure, Friendship, Global, Guy, Human, Icon, Idea, Information, Internet, Leadership, Manager, Map, Medium, Men, Message, Network, Page, People, Person, Puppet, Render, Shapes, Sign, Standing, Symbol, Text, Three-Dimensional, Web, Weblog, World, Www. The prominent colors used in the PowerPoint template are Green, White, Gray. Use our business flowchart 3d man with blog discussion PowerPoint templates will get their audience's attention. We assure you our Concepts PowerPoint templates and PPT Slides are specially created by a professional team with vast experience. They diligently strive to come up with the right vehicle for your brilliant Ideas. Use our business flowchart 3d man with blog discussion PowerPoint templates will save the presenter time. Customers tell us our Character PowerPoint templates and PPT Slides are second to none. Presenters tell us our business flowchart 3d man with blog discussion PowerPoint templates provide great value for your money. Be assured of finding the best projection to highlight your words. PowerPoint presentation experts tell us our Concepts PowerPoint templates and PPT Slides are aesthetically designed to attract attention. We guarantee that they will grab all the eyeballs you need. Create failsafe designs with our Business Flowchart 3d Man With Blog Discussion PowerPoint Templates. Examine likely defects in detail.
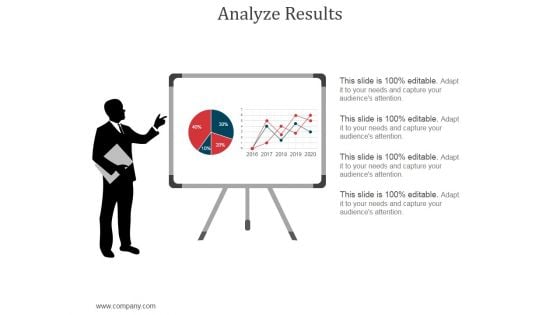
Analyze Results Ppt PowerPoint Presentation Slide
This is a analyze results ppt powerpoint presentation slide. This is a two stage process. The stages in this process are analysis, business, marketing, finance, pie chart.
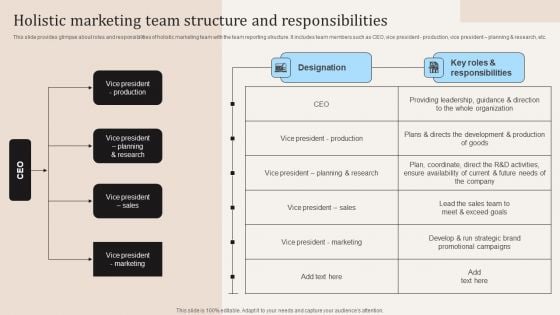
Holistic Marketing Team Structure And Responsibilities Ppt PowerPoint Presentation Diagram Images PDF
This slide provides glimpse about roles and responsibilities of holistic marketing team with the team reporting structure. It includes team members such as CEO, vice president production, vice president planning and research, etc. The Holistic Marketing Team Structure And Responsibilities Ppt PowerPoint Presentation Diagram Images PDF is a compilation of the most recent design trends as a series of slides. It is suitable for any subject or industry presentation, containing attractive visuals and photo spots for businesses to clearly express their messages. This template contains a variety of slides for the user to input data, such as structures to contrast two elements, bullet points, and slides for written information. Slidegeeks is prepared to create an impression.
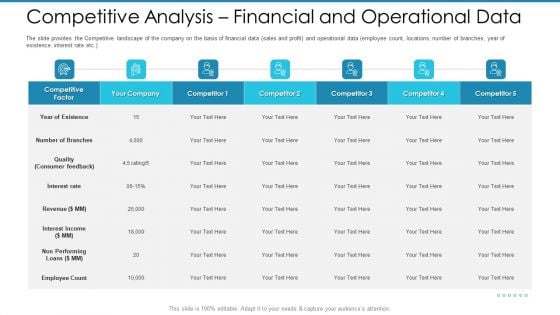
Post Initial Pubic Offering Market Pitch Deck Competitive Analysis Financial And Operational Data Diagrams PDF
The slide provides the Competitive landscape of the company on the basis of financial data sales and profit and operational data employee count, locations, number of branches, year of existence, interest rate etc.Deliver an awe-inspiring pitch with this creative post initial pubic offering market pitch deck competitive analysis financial and operational data diagrams pdf. bundle. Topics like interest rate, revenue interest income, non performing can be discussed with this completely editable template. It is available for immediate download depending on the needs and requirements of the user.
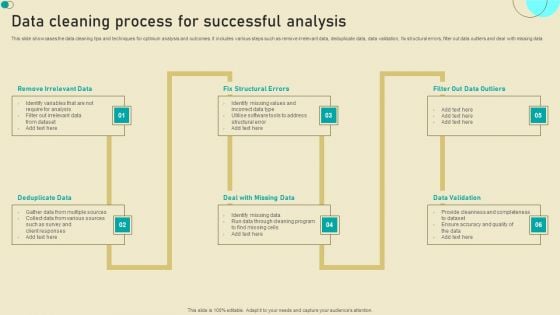
Data Cleaning Process For Successful Analysis Diagrams PDF
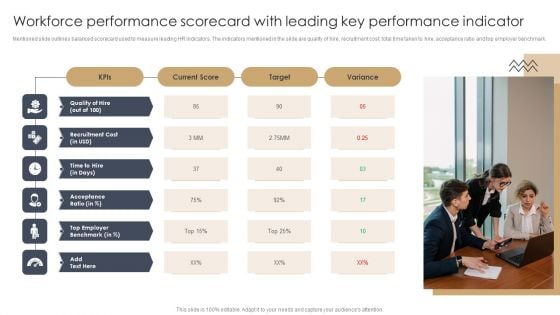
Workforce Performance Scorecard With Leading Key Performance Indicator Information PDF
Mentioned slide outlines balanced scorecard used to measure leading HR indicators. The indicators mentioned in the slide are quality of hire, recruitment cost, total time taken to hire, acceptance ratio and top employer benchmark.Presenting Workforce Performance Scorecard With Leading Key Performance Indicator Information PDF to dispense important information. This template comprises one stage. It also presents valuable insights into the topics including Top Employer, Acceptance Ratio, Recruitment Cost. This is a completely customizable PowerPoint theme that can be put to use immediately. So, download it and address the topic impactfully.
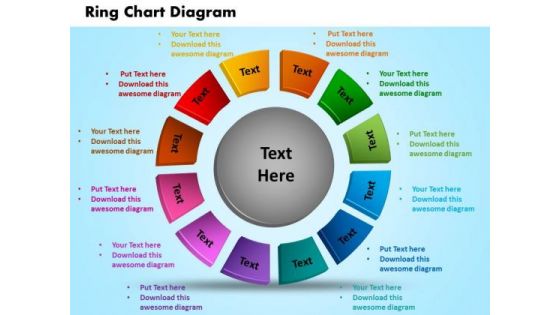
PowerPoint Theme Ring Chart Diagram Growth Ppt Template
PowerPoint Theme Ring Chart Diagram Growth PPT Template-Use this graphical approach to represent global business issues such as financial data, stock market Exchange, increase in sales, corporate presentations and more.-PowerPoint Theme Ring Chart Diagram Growth PPT Template Do exciting things with our PowerPoint Theme Ring Chart Diagram Growth Ppt Template. Create intelligent and delightful choices with your ideas.
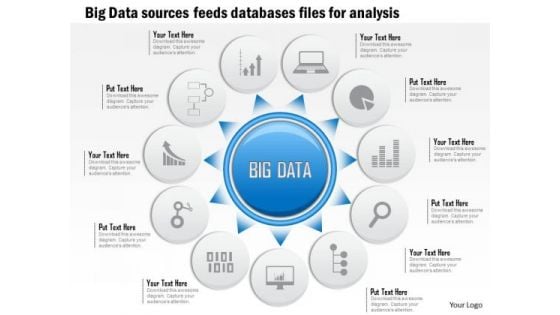
Business Diagram Big Data Sources Sensors Feeds Databases Files For Analysis Ppt Slide
This slide has been designed with graphic of circular source diagram. This diagram contains the concept of data source sensors and feeds of database files. Download this editable slide to build an exclusive presentation for your viewers.
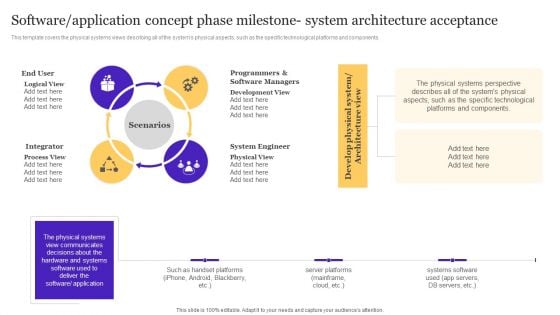
Software Application Concept Phase Milestone System Architecture Acceptance Diagrams PDF
This template covers the physical systems views describing all of the systems physical aspects, such as the specific technological platforms and components.The Software Application Concept Phase Milestone System Architecture Acceptance Diagrams PDF is a compilation of the most recent design trends as a series of slides. It is suitable for any subject or industry presentation, containing attractive visuals and photo spots for businesses to clearly express their messages. This template contains a variety of slides for the user to input data, such as structures to contrast two elements, bullet points, and slides for written information. Slidegeeks is prepared to create an impression.
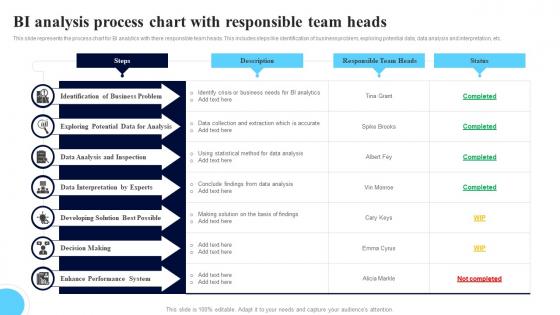
BI Analysis Process Chart With Responsible Team Heads Mockup Pdf
This slide represents the process chart for BI analytics with there responsible team heads. This includes steps like identification of business problem, exploring potential data, data analysis and interpretation, etc. Showcasing this set of slides titled BI Analysis Process Chart With Responsible Team Heads Mockup Pdf. The topics addressed in these templates are Identification Of Business, Data Analysis, Data Interpretation. All the content presented in this PPT design is completely editable. Download it and make adjustments in color, background, font etc. as per your unique business setting. This slide represents the process chart for BI analytics with there responsible team heads. This includes steps like identification of business problem, exploring potential data, data analysis and interpretation, etc.
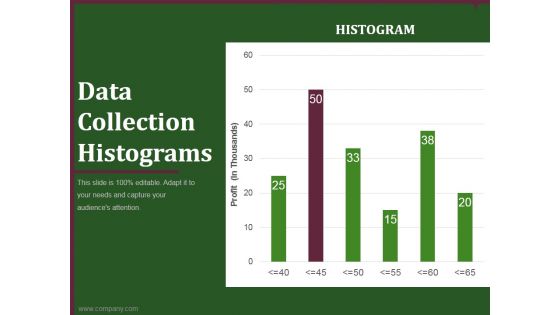
data collection histograms ppt powerpoint presentation example
This is a data collection histograms ppt powerpoint presentation example. This is a six stage process. The stages in this process are business, planning, marketing, histograms, graph.
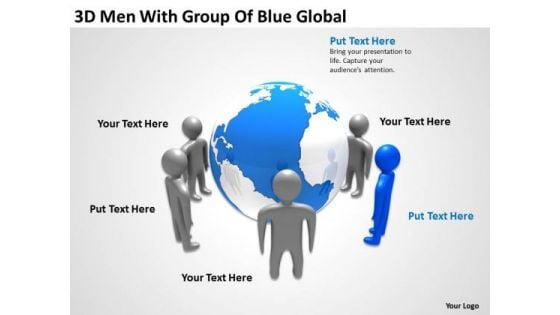
How To Draw Business Process Diagram 3d Men With Group Of Blue Global PowerPoint Templates
We present our how to draw business process diagram 3d men with group of blue global PowerPoint templates.Download our Global PowerPoint Templates because you should Experience excellence with our PowerPoint Templates and Slides. They will take your breath away. Download and present our Earth PowerPoint Templates because You can Be the puppeteer with our PowerPoint Templates and Slides as your strings. Lead your team through the steps of your script. Download and present our People PowerPoint Templates because You have a driving passion to excel in your field. Our PowerPoint Templates and Slides will prove ideal vehicles for your ideas. Download our Globe PowerPoint Templates because These PowerPoint Templates and Slides will give the updraft to your ideas. See them soar to great heights with ease. Use our Communication PowerPoint Templates because Our PowerPoint Templates and Slides are innately eco-friendly. Their high recall value negate the need for paper handouts.Use these PowerPoint slides for presentations relating to 3d, abstract, america, blue, business, circle, collective, communication, concept, contact, continent, country, crowd, cyber, data, design, digital, earth, establish, europe, figure, global, globe, group, icon, idea, illustration, internet, isolated, man, map, offer, peace, people, planet, population, render, society, sphere, stand, strong, structure, team, teamwork, tech, technology, unity, web, woman, world. The prominent colors used in the PowerPoint template are Blue, Gray, White. The feedback we get is that our how to draw business process diagram 3d men with group of blue global PowerPoint templates are readymade to fit into any presentation structure. Customers tell us our america PowerPoint templates and PPT Slides provide great value for your money. Be assured of finding the best projection to highlight your words. The feedback we get is that our how to draw business process diagram 3d men with group of blue global PowerPoint templates will impress their bosses and teams. Professionals tell us our business PowerPoint templates and PPT Slides are incredible easy to use. Presenters tell us our how to draw business process diagram 3d men with group of blue global PowerPoint templates will make you look like a winner. You can be sure our blue PowerPoint templates and PPT Slides are readymade to fit into any presentation structure. Import ideas with our How To Draw Business Process Diagram 3d Men With Group Of Blue Global PowerPoint Templates. Download without worries with our money back guaranteee.
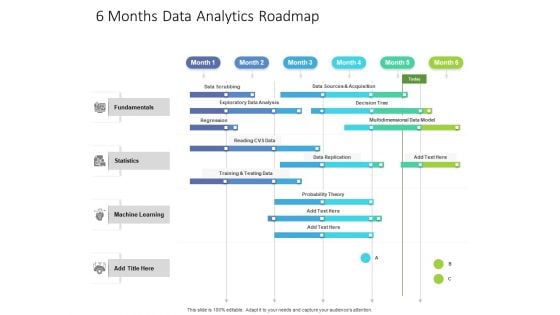
6 Months Data Analytics Roadmap Diagrams
Presenting our innovatively-structured 6 months data analytics roadmap diagrams Template. Showcase your roadmap process in different formats like PDF, PNG, and JPG by clicking the download button below. This PPT design is available in both Standard Screen and Widescreen aspect ratios. It can also be easily personalized and presented with modified font size, font type, color, and shapes to measure your progress in a clear way.
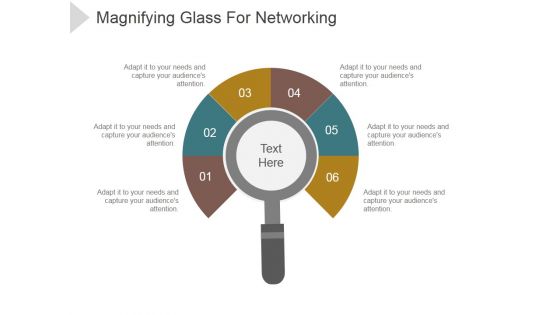
Magnifying Glass For Networking Ppt PowerPoint Presentation Templates
This is a magnifying glass for networking ppt powerpoint presentation templates. This is a six stage process. The stages in this process are business, marketing, management, technology, communication.

Magnifier Glass Ppt PowerPoint Presentation Guide
This is a magnifier glass ppt powerpoint presentation guide. This is a one stage process. The stages in this process are magnifier, searching, business, marketing, management.
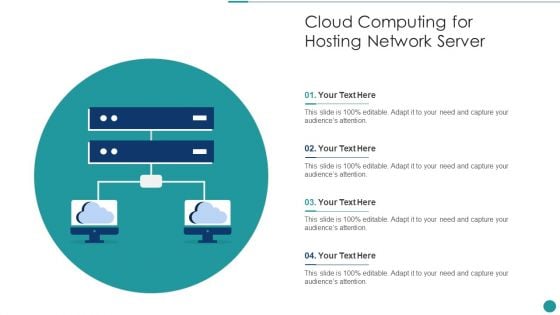
Cloud Computing For Hosting Network Server Ppt Diagram Graph Charts PDF
Persuade your audience using this Cloud Computing For Hosting Network Server Ppt Diagram Graph Charts PDF. This PPT design covers four stages, thus making it a great tool to use. It also caters to a variety of topics including Cloud Computing, Hosting Network Server. Download this PPT design now to present a convincing pitch that not only emphasizes the topic but also showcases your presentation skills.
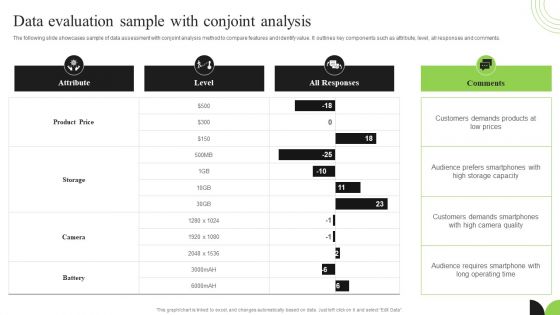
Guidebook For Executing Business Market Intelligence Data Evaluation Sample With Conjoint Analysis Ideas PDF
The following slide showcases sample of data assessment with conjoint analysis method to compare features and identify value. It outlines key components such as attribute, level, all responses and comments. Boost your pitch with our creative Guidebook For Executing Business Market Intelligence Data Evaluation Sample With Conjoint Analysis Ideas PDF. Deliver an awe inspiring pitch that will mesmerize everyone. Using these presentation templates you will surely catch everyones attention. You can browse the ppts collection on our website. We have researchers who are experts at creating the right content for the templates. So you do not have to invest time in any additional work. Just grab the template now and use them.
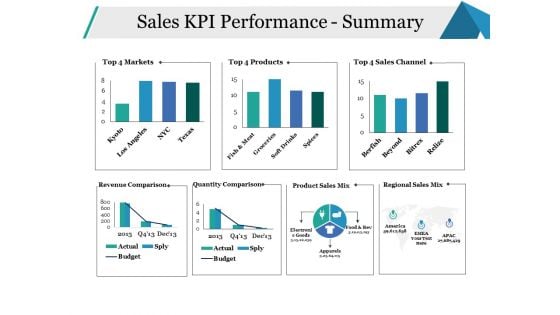
Sales KPI Performance Summary Ppt PowerPoint Presentation Infographics Model
This is a sales kpi performance summary ppt powerpoint presentation infographics model. This is a seven stage process. The stages in this process are sales channel, revenue comparison, quantity comparison, business, marketing.
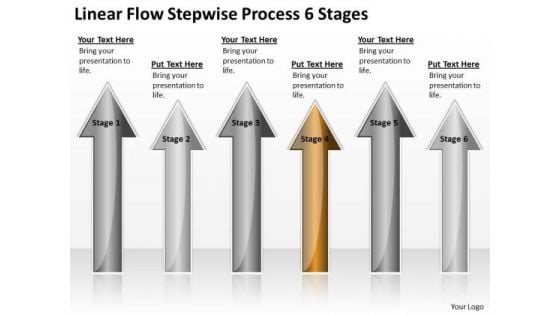
Power Point Arrows Stepwise Process 6 Stages PowerPoint Templates Backgrounds For Slides
We present our power point arrows stepwise process 6 stages PowerPoint templates backgrounds for slides.Use our Flow Charts PowerPoint Templates because Our PowerPoint Templates and Slides will let Your superior ideas hit the target always and everytime. Download our Business PowerPoint Templates because Our PowerPoint Templates and Slides will let you Leave a lasting impression to your audiences. They possess an inherent longstanding recall factor. Download and present our Process and Flows PowerPoint Templates because You can Connect the dots. Fan expectations as the whole picture emerges. Present our Shapes PowerPoint Templates because Our PowerPoint Templates and Slides are the chords of your song. String them along and provide the lilt to your views. Present our Target PowerPoint Templates because Our PowerPoint Templates and Slides are created by a hardworking bunch of busybees. Always flitting around with solutions gauranteed to please.Use these PowerPoint slides for presentations relating to Arrow, art, business, chart, concept,connection, cycle, development,diagram, direction, element,environment, exchange, finance,financial, flow, graph, graphic, graphic,presentation, group, icon, illustration,investment, isolated, isometric, market,motion, movement, organization, passive,income, perspective, process, process chart, recycle, report, sign, step. The prominent colors used in the PowerPoint template are Gray, Brown, Black. PowerPoint presentation experts tell us our power point arrows stepwise process 6 stages PowerPoint templates backgrounds for slides will get their audience's attention. Presenters tell us our chart PowerPoint templates and PPT Slides look good visually. Use our power point arrows stepwise process 6 stages PowerPoint templates backgrounds for slides are effectively colour coded to prioritise your plans They automatically highlight the sequence of events you desire. People tell us our connection PowerPoint templates and PPT Slides are incredible easy to use. Presenters tell us our power point arrows stepwise process 6 stages PowerPoint templates backgrounds for slides are designed by a team of presentation professionals. Presenters tell us our diagram PowerPoint templates and PPT Slides will get their audience's attention. Our content is tried and tested by thousands. Join them with our Power Point Arrows Stepwise Process 6 Stages PowerPoint Templates Backgrounds For Slides. You'll always stay ahead of the game.
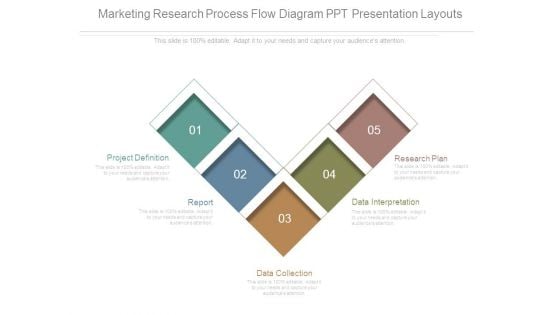
Marketing Research Process Flow Diagram Ppt Presentation Layouts
This is a marketing research process flow diagram ppt presentation layouts. This is a five stage process. The stages in this process are project definition, report, data collection, data interpretation, research plan.
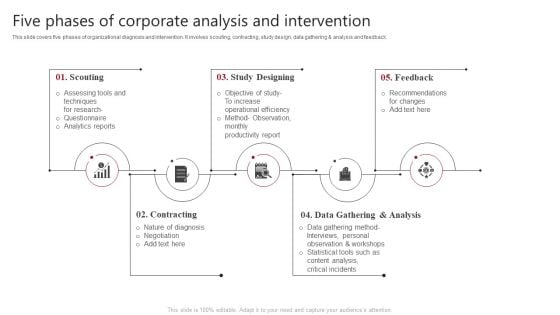
Five Phases Of Corporate Analysis And Intervention Clipart PDF
This slide covers five phases of organizational diagnosis and intervention. It involves scouting, contracting, study design, data gathering and analysis and feedback. Presenting Five Phases Of Corporate Analysis And Intervention Clipart PDF to dispense important information. This template comprises five stages. It also presents valuable insights into the topics including Contracting, Data Gathering, Analysis. This is a completely customizable PowerPoint theme that can be put to use immediately. So, download it and address the topic impactfully.

Market Research Analysis Of Housing Sector Real Estate Price And Sales Historical Data Background PDF
Deliver and pitch your topic in the best possible manner with this market research analysis of housing sector real estate price and sales historical data background pdf. Use them to share invaluable insights on prices, sales and impress your audience. This template can be altered and modified as per your expectations. So, grab it now.
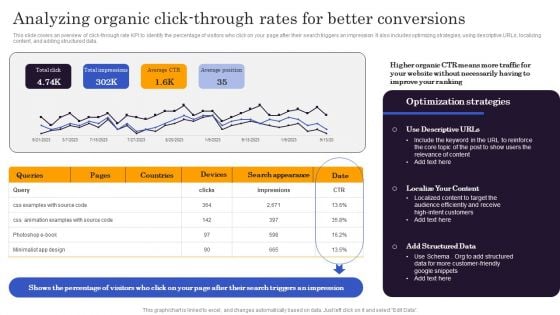
Marketers Guide To Data Analysis Optimization Analyzing Organic Click Through Rates For Better Conversions Structure PDF
This slide covers an overview of click-through rate KPI to identify the percentage of visitors who click on your page after their search triggers an impression. It also includes optimizing strategies, using descriptive URLs, localizing content, and adding structured data. Find highly impressive Marketers Guide To Data Analysis Optimization Analyzing Organic Click Through Rates For Better Conversions Structure PDF on Slidegeeks to deliver a meaningful presentation. You can save an ample amount of time using these presentation templates. No need to worry to prepare everything from scratch because Slidegeeks experts have already done a huge research and work for you. You need to download Marketers Guide To Data Analysis Optimization Analyzing Organic Click Through Rates For Better Conversions Structure PDF for your upcoming presentation. All the presentation templates are 100 percent editable and you can change the color and personalize the content accordingly. Download now.
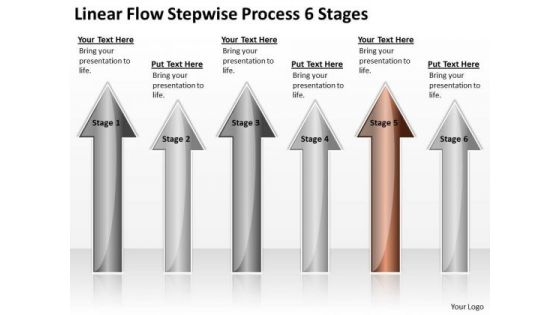
Power Point Arrows Stepwise Process 6 Stages Arrow PowerPoint Templates Backgrounds For Slides
We present our power point arrows stepwise process 6 stages arrow PowerPoint templates backgrounds for slides.Download and present our Arrows PowerPoint Templates because It can be used to Set your controls for the heart of the sun. Our PowerPoint Templates and Slides will be the propellant to get you there. Download our Business PowerPoint Templates because Our PowerPoint Templates and Slides will fulfill your every need. Use them and effectively satisfy the desires of your audience. Download and present our Flow Charts PowerPoint Templates because It can Conjure up grand ideas with our magical PowerPoint Templates and Slides. Leave everyone awestruck by the end of your presentation. Download our Process and Flows PowerPoint Templates because You can Be the puppeteer with our PowerPoint Templates and Slides as your strings. Lead your team through the steps of your script. Use our Success PowerPoint Templates because You have gained great respect for your brilliant ideas. Use our PowerPoint Templates and Slides to strengthen and enhance your reputation.Use these PowerPoint slides for presentations relating to Arrow, art, background,blank, business, chart, concept,connection, cycle, development,diagram, direction, element,environment, exchange, finance,financial, flow, graph, graphic, graphic,presentation, group, icon, illustration,investment, isolated, isometric, market,motion, movement, organization, passive,income, perspective, process, process chart, recycle, report, sign, step. The prominent colors used in the PowerPoint template are Brown, Gray, White. PowerPoint presentation experts tell us our power point arrows stepwise process 6 stages arrow PowerPoint templates backgrounds for slides help you meet deadlines which are an element of today's workplace. Just browse and pick the slides that appeal to your intuitive senses. Presenters tell us our connection PowerPoint templates and PPT Slides help you meet deadlines which are an element of today's workplace. Just browse and pick the slides that appeal to your intuitive senses. Use our power point arrows stepwise process 6 stages arrow PowerPoint templates backgrounds for slides help you meet deadlines which are an element of today's workplace. Just browse and pick the slides that appeal to your intuitive senses. People tell us our cycle PowerPoint templates and PPT Slides are designed by a team of presentation professionals. Presenters tell us our power point arrows stepwise process 6 stages arrow PowerPoint templates backgrounds for slides will make the presenter look like a pro even if they are not computer savvy. Presenters tell us our background PowerPoint templates and PPT Slides are incredible easy to use. Your audience will fawn on you. Our Power Point Arrows Stepwise Process 6 Stages Arrow PowerPoint Templates Backgrounds For Slides will certainly capture their fancy.
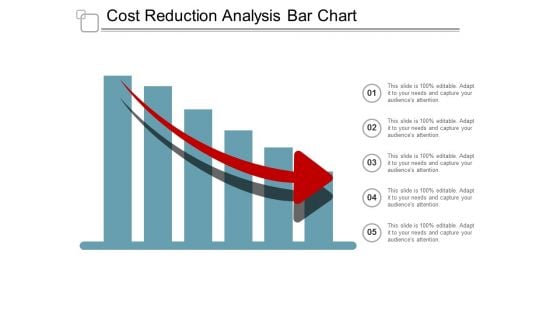
Cost Reduction Analysis Bar Chart Ppt Powerpoint Presentation File Graphics Design
This is a cost reduction analysis bar chart ppt powerpoint presentation file graphics design. This is a five stage process. The stages in this process are data analysis, data science, information science.
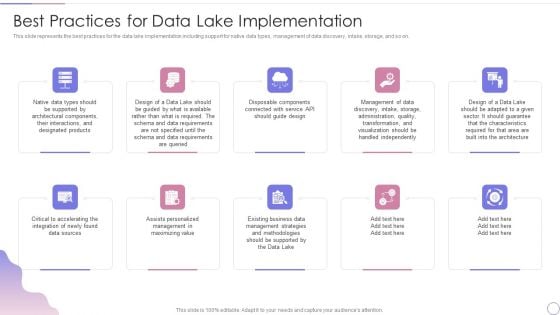
Data Lake Architecture Future Of Data Analysis Best Practices For Data Lake Implementation Diagrams PDF
This slide represents the best practices for the data lake implementation including support for native data types, management of data discovery, intake, storage, and so on.Presenting Data Lake Architecture Future Of Data Analysis Best Practices For Data Lake Implementation Diagrams PDF to provide visual cues and insights. Share and navigate important information on ten stages that need your due attention. This template can be used to pitch topics like Architectural Components, Critical To Accelerating, Management Strategies. In addtion, this PPT design contains high resolution images, graphics, etc, that are easily editable and available for immediate download.
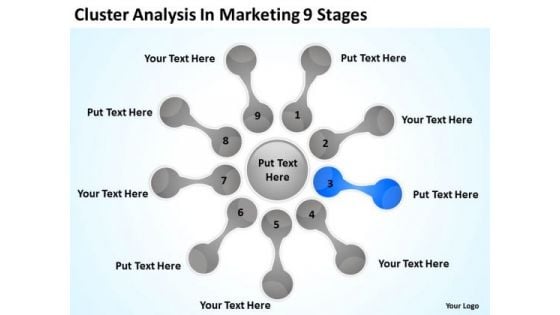
Cluster Analysis In Marketing 9 Stages Good Business Plan PowerPoint Templates
We present our cluster analysis in marketing 9 stages good business plan PowerPoint templates.Download our Flow Charts PowerPoint Templates because It can Conjure up grand ideas with our magical PowerPoint Templates and Slides. Leave everyone awestruck by the end of your presentation. Download our Business PowerPoint Templates because Our PowerPoint Templates and Slides are specially created by a professional team with vast experience. They diligently strive to come up with the right vehicle for your brilliant Ideas. Use our Shapes PowerPoint Templates because You should Kick up a storm with our PowerPoint Templates and Slides. The heads of your listeners will swirl with your ideas. Use our Process and Flows PowerPoint Templates because It will Raise the bar of your Thoughts. They are programmed to take you to the next level. Use our Circle Charts PowerPoint Templates because Our PowerPoint Templates and Slides will let you meet your Deadlines.Use these PowerPoint slides for presentations relating to Mapping, vector, chart, flow, flowchart, process, model, step, tool, blank, processdiagram, concept, topic, presentation, relate, circle, graphic, data, report, marketing, idea, circlepattern, team, management, graph, cycle, illustration, connection, processchart,direction, plans, color, text, phase, organization, control, connect, link, explanation, mapping, present. The prominent colors used in the PowerPoint template are Blue, Black, Gray. Our Cluster Analysis In Marketing 9 Stages Good Business Plan PowerPoint Templates save time creating a mind blowing presentation. With our money back guarantee you have nothing to lose.

 Home
Home