Dashboard Icon
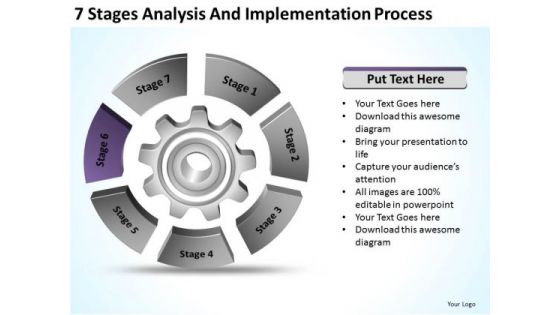
7 Stages Analysis And Implementation Process Business Plans PowerPoint Slides
We present our 7 stages analysis and implementation process business plans PowerPoint Slides.Download and present our Business PowerPoint Templates because It will let you Set new benchmarks with our PowerPoint Templates and Slides. They will keep your prospects well above par. Download our Venn Diagrams PowerPoint Templates because You are an avid believer in ethical practices. Highlight the benefits that accrue with our PowerPoint Templates and Slides. Use our Layers PowerPoint Templates because Our PowerPoint Templates and Slides will provide weight to your words. They will bring out the depth of your thought process. Use our Circle Charts PowerPoint Templates because Our PowerPoint Templates and Slides provide you with a vast range of viable options. Select the appropriate ones and just fill in your text. Download our Shapes PowerPoint Templates because you should once Tap the ingenuity of our PowerPoint Templates and Slides. They are programmed to succeed.Use these PowerPoint slides for presentations relating to diagram, process, business, graphic, design, ideas, model, data, chart, project, schema, corporate, implementation, tag, plan, engineering, concept, vector, success, symbol, stack, circle, guide, work flow, development, shape, team, management, cycle, steps, illustration, system, strategy, objects, phase, professional, organization, implement, background, image, detail, structure, product. The prominent colors used in the PowerPoint template are Blue, Black, Gray. You will rarely find fault with our 7 Stages Analysis And Implementation Process Business Plans PowerPoint Slides. They are designed by a fastidious team.
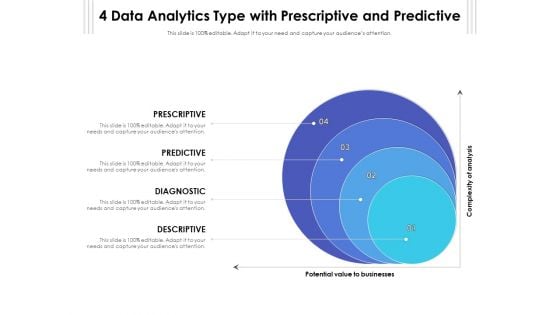
4 Data Analytics Type With Prescriptive And Predictive Ppt PowerPoint Presentation File Infographic Template PDF
Presenting 4 data analytics type with prescriptive and predictive ppt powerpoint presentation file infographic template pdf to dispense important information. This template comprises four stages. It also presents valuable insights into the topics including prescriptive, predictive, diagnostic. This is a completely customizable PowerPoint theme that can be put to use immediately. So, download it and address the topic impactfully.
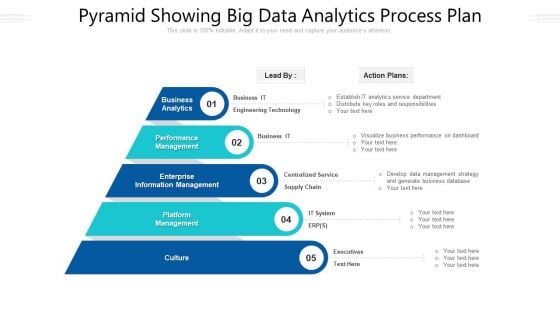
Pyramid Showing Big Data Analytics Process Plan Ppt PowerPoint Presentation File Ideas PDF
Presenting pyramid showing big data analytics process plan ppt powerpoint presentation file ideas pdf to dispense important information. This template comprises five stages. It also presents valuable insights into the topics including culture, management, performance. This is a completely customizable PowerPoint theme that can be put to use immediately. So, download it and address the topic impactfully.
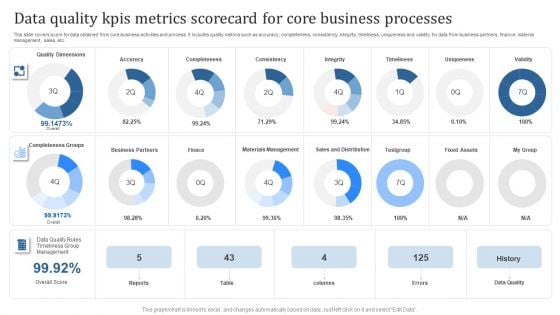
Data Quality Kpis Metrics Scorecard For Core Business Processes Topics PDF
This slide covers score for data obtained from core business activities and process. It includes quality metrics such as accuracy, completeness, consistency, integrity, timeliness, uniqueness and validity for data from business partners, finance, material management, sales, etc. Showcasing this set of slides titled Data Quality Kpis Metrics Scorecard For Core Business Processes Topics PDF. The topics addressed in these templates are Data Quality, Errors, Reports. All the content presented in this PPT design is completely editable. Download it and make adjustments in color, background, font etc. as per your unique business setting.
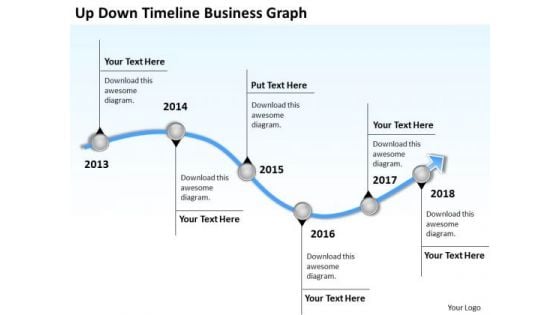
Business Analysis Diagrams PowerPoint Presentations Graph Templates
We present our business analysis diagrams powerpoint presentations graph templates.Download and present our Curves and Lines PowerPoint Templates because Your audience will believe you are the cats whiskers. Present our Business PowerPoint Templates because Our PowerPoint Templates and Slides will effectively help you save your valuable time. They are readymade to fit into any presentation structure. Present our Business PowerPoint Templates because Our PowerPoint Templates and Slides will give good value for money. They also have respect for the value of your time. Use our Arrows PowerPoint Templates because It will get your audience in sync. Present our Process and Flows PowerPoint Templates because It can Conjure up grand ideas with our magical PowerPoint Templates and Slides. Leave everyone awestruck by the end of your presentation.Use these PowerPoint slides for presentations relating to 3d, account, accounting, annual, balance, business, chart, commerce, crisis, data,earnings, economics, economy, exchange, figures, finance, financial, graph,graphic, growth, illustration, index, information, investment, list, line,management,market, marketing, money, monitoring, numbers, office, paperwork, plan, price,printout, report, research, sale, statistical, statistics, stock, success, tax, trade,work. The prominent colors used in the PowerPoint template are Blue light, Gray, White. Examine the causes with our Business Analysis Diagrams PowerPoint Presentations Graph Templates. Let everyone know what's behind it all.
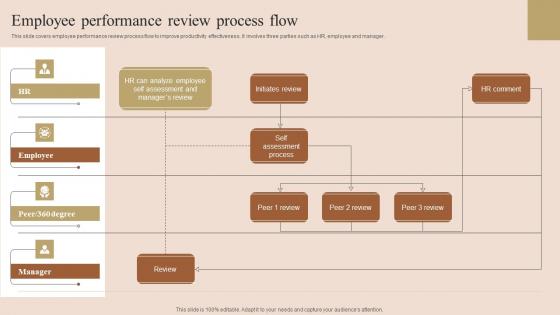
Employee Performance Review Employee Performance Improvement Techniques Infographics Pdf
This slide covers employee performance review process flow to improve productivity effectiveness. It involves three parties such as HR, employee and manager. Whether you have daily or monthly meetings, a brilliant presentation is necessary. Employee Performance Review Employee Performance Improvement Techniques Infographics Pdf can be your best option for delivering a presentation. Represent everything in detail using Employee Performance Review Employee Performance Improvement Techniques Infographics Pdf and make yourself stand out in meetings. The template is versatile and follows a structure that will cater to your requirements. All the templates prepared by Slidegeeks are easy to download and edit. Our research experts have taken care of the corporate themes as well. So, give it a try and see the results. This slide covers employee performance review process flow to improve productivity effectiveness. It involves three parties such as HR, employee and manager.
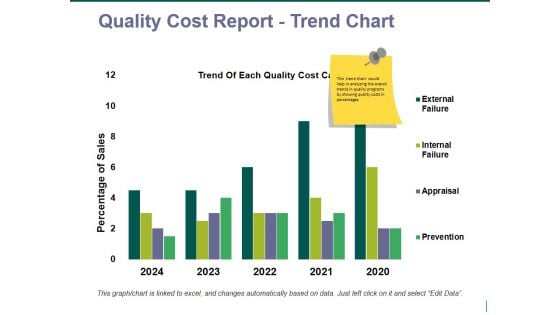
quality cost report trend chart ppt powerpoint presentation pictures vector
This is a quality cost report trend chart ppt powerpoint presentation pictures vector. This is a four stage process. The stages in this process are business, finance, marketing, strategy, analysis.
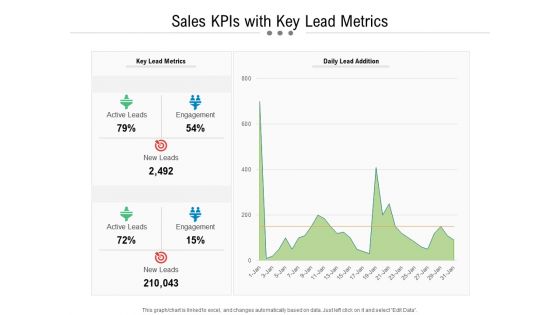
Sales Kpis With Key Lead Metrics Ppt PowerPoint Presentation Layouts Background PDF
Presenting this set of slides with name sales kpis with key lead metrics ppt powerpoint presentation layouts background pdf. The topics discussed in these slides are key lead metrics, daily lead addition, active leads, engagement, new leads, active leads, engagement. This is a completely editable PowerPoint presentation and is available for immediate download. Download now and impress your audience.
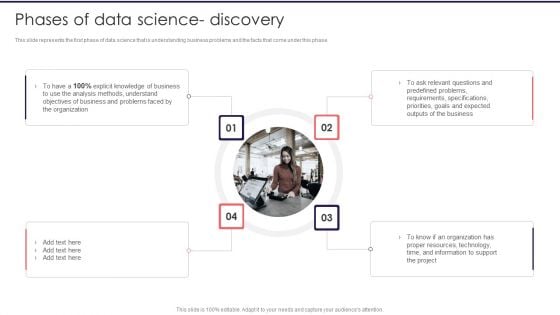
Information Studies Phases Of Data Science Discovery Template PDF
This slide represents the first phase of data science that is understanding business problems and the facts that come under this phase. Presenting Information Studies Phases Of Data Science Discovery Template PDF to provide visual cues and insights. Share and navigate important information on four stages that need your due attention. This template can be used to pitch topics like Organization, Analysis Methods, Proper Resources. In addtion, this PPT design contains high resolution images, graphics, etc, that are easily editable and available for immediate download.
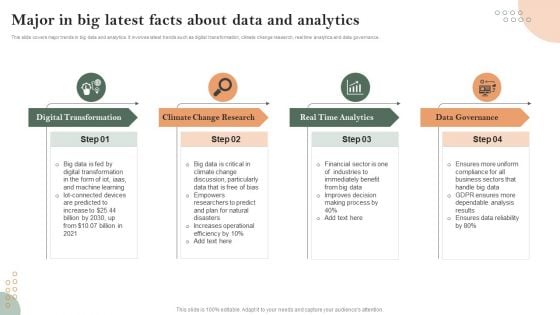
Major In Big Latest Facts About Data And Analytics Portrait PDF
This slide covers major trends in big data and analytics. It involves latest trends such as digital transformation, climate change research, real time analytics and data governance. Presenting Major In Big Latest Facts About Data And Analytics Portrait PDF to dispense important information. This template comprises Four stages. It also presents valuable insights into the topics including Digital Transformation, Climate Change Research, Real Time Analytics. This is a completely customizable PowerPoint theme that can be put to use immediately. So, download it and address the topic impactfully.
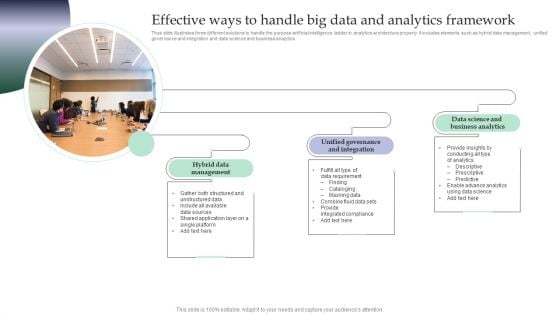
Effective Ways To Handle Big Data And Analytics Framework Pictures PDF
Thus slide illustrates three different solutions to handle the purpose artificial intelligence ladder in analytics architecture properly. It includes elements such as hybrid data management, unified governance and integration and data science and business analytics Presenting Effective Ways To Handle Big Data And Analytics Framework Pictures PDF to dispense important information. This template comprises three stages. It also presents valuable insights into the topics including Management, Integration, Business Analytics. This is a completely customizable PowerPoint theme that can be put to use immediately. So, download it and address the topic impactfully.
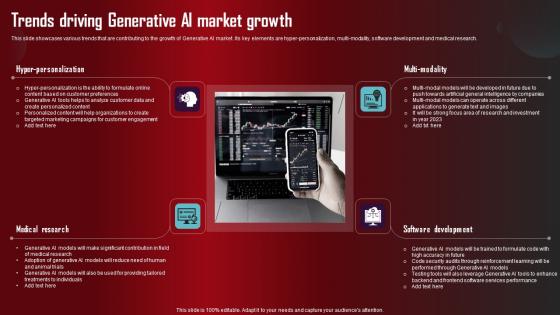
Trends Driving Generative AI Role Of Generative AI Tools Across Infographics Pdf
This slide showcases various trends that are contributing to the growth of Generative AI market. Its key elements are hyper personalization, multi modality, software development and medical research. Whether you have daily or monthly meetings, a brilliant presentation is necessary. Trends Driving Generative AI Role Of Generative AI Tools Across Infographics Pdf can be your best option for delivering a presentation. Represent everything in detail using Trends Driving Generative AI Role Of Generative AI Tools Across Infographics Pdf and make yourself stand out in meetings. The template is versatile and follows a structure that will cater to your requirements. All the templates prepared by Slidegeeks are easy to download and edit. Our research experts have taken care of the corporate themes as well. So, give it a try and see the results. This slide showcases various trends that are contributing to the growth of Generative AI market. Its key elements are hyper-personalization, multi modality, software development and medical research.
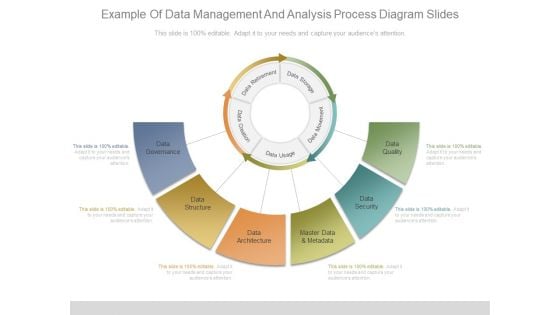
Example Of Data Management And Analysis Process Diagram Slides
Presenting this set of slides with name example of data management and analysis process diagram slides. This is a six stage process. The stages in this process are data governance, data structure, data architecture, master data and metadata, data security, data quality. This is a completely editable PowerPoint presentation and is available for immediate download. Download now and impress your audience.
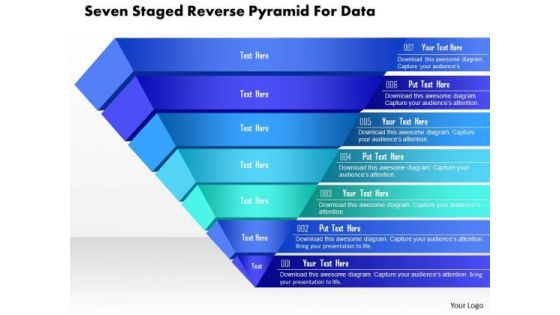
Business Diagram Seven Staged Reverse Pyramid For Data Presentation Template
This business slide is designed with seven staged pyramid diagram. Download this professional slide to depict sales and marketing analysis. This image slide is best to present your newer thoughts.
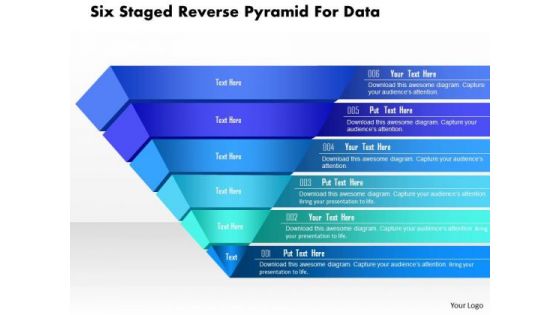
Business Diagram Six Staged Reverse Pyramid For Data Presentation Template
This business slide is designed with six staged pyramid diagram. Download this professional slide to depict sales and marketing analysis. This image slide is best to present your newer thoughts.

Stock Photo 3d Globe With Social Web For Data Protection Concept PowerPoint Slide
Graphic of 3d globe and web has been used to craft this power point image template. This PPT contains the concept of data protection and social network. Use this PPT and build quality presentation for your viewers.
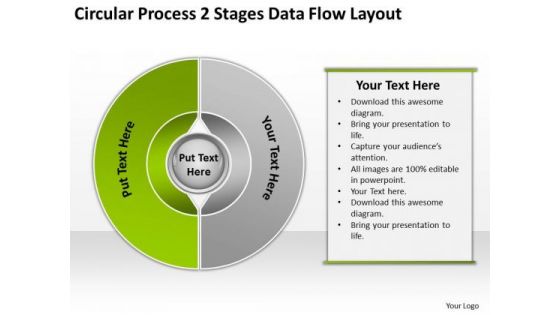
Circular Process 2 Stages Data Flow Layout Market Plan Example PowerPoint Slides
We present our circular process 2 stages data flow layout market plan example PowerPoint Slides.Use our Process and Flows PowerPoint Templates because Our PowerPoint Templates and Slides will let your team Walk through your plans. See their energy levels rise as you show them the way. Download our Circle Charts PowerPoint Templates because Our PowerPoint Templates and Slides will Activate the energies of your audience. Get their creative juices flowing with your words. Download our Business PowerPoint Templates because These PowerPoint Templates and Slides will give the updraft to your ideas. See them soar to great heights with ease. Use our Marketing PowerPoint Templates because You are an avid believer in ethical practices. Highlight the benefits that accrue with our PowerPoint Templates and Slides. Use our Success PowerPoint Templates because Our PowerPoint Templates and Slides will let you meet your Deadlines.Use these PowerPoint slides for presentations relating to Cross, circle,statistics, model, target,two,steps, statement, interface, business, arrow, list, presentation, glossy, internet, diagram, circle,brochure, description, report, marketing, level, abstract, wheel, steps, illustration, pie, chart, sphere, registry, catalog, section, futuristic, colors, web, design,information, space, demonstration, navigation, pattern, webdesign, structure, multiple, button, goals. The prominent colors used in the PowerPoint template are Green lime, White, Gray. Our Circular Process 2 Stages Data Flow Layout Market Plan Example PowerPoint Slides have a everlasting effect. They remain in the memory for ages.
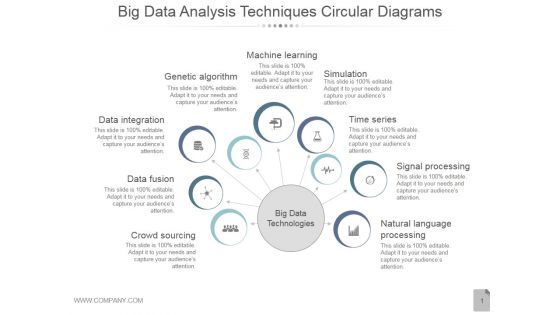
Big Data Analysis Techniques Circular Diagrams Ppt PowerPoint Presentation Shapes
This is a big data analysis techniques circular diagrams ppt powerpoint presentation shapes. This is a nine stage process. The stages in this process are data fusion, data integration, genetic algorithm, machine learning, simulation.
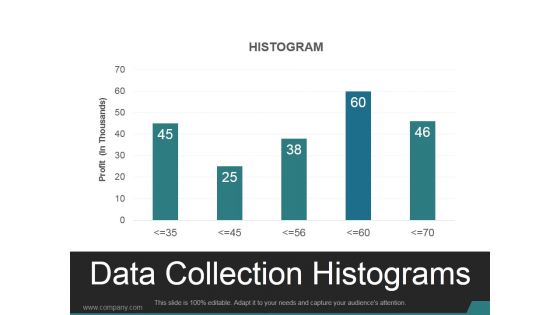
Data Collection Histograms Ppt PowerPoint Presentation Design Templates
This is a data collection histograms ppt powerpoint presentation design templates. This is a five stage process. The stages in this process are histogram, business, marketing, analysis, chart.
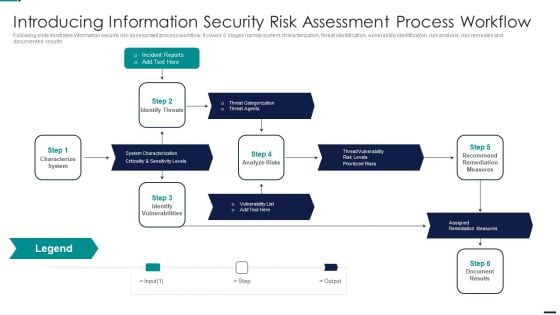
Risk Management Model For Data Introducing Information Security Risk Assessment Process Sample PDF
Following slide illustrates information security risk assessment process workflow. It covers 6 stages namely system characterization, threat identification, vulnerability identification, risk analysis, risk remedies and documented results. This is a Risk Management Model For Data Introducing Information Security Risk Assessment Process Sample PDF template with various stages. Focus and dispense information on five stages using this creative set, that comes with editable features. It contains large content boxes to add your information on topics like Incident Reports, Characterize System, Identify Vulnerabilities, Assigned Remediation Measures. You can also showcase facts, figures, and other relevant content using this PPT layout. Grab it now.
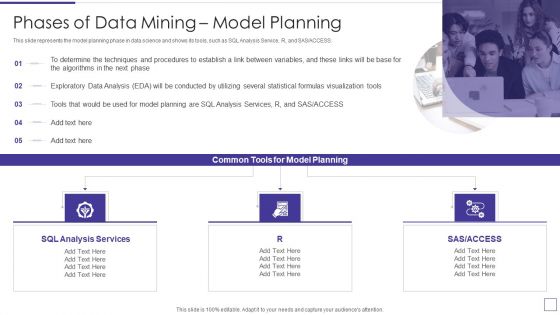
Data Mining Implementation Phases Of Data Mining Model Planning Portrait PDF
This slide represents the model planning phase in data science and shows its tools, such as SQL Analysis Service, R, and SAS or ACCESS.This is a data mining implementation phases of data mining model planning portrait pdf template with various stages. Focus and dispense information on five stages using this creative set, that comes with editable features. It contains large content boxes to add your information on topics like determine the techniques, exploratory data analysis, several statistical formulas You can also showcase facts, figures, and other relevant content using this PPT layout. Grab it now.
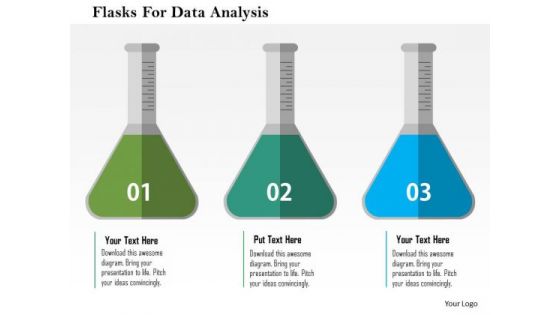
Business Diagram Flasks For Data Analysis Presentation Template
This business diagram displays three flasks. You may use this slide for data analysis. Make your mark with this unique slide. Create an impression that will endure.
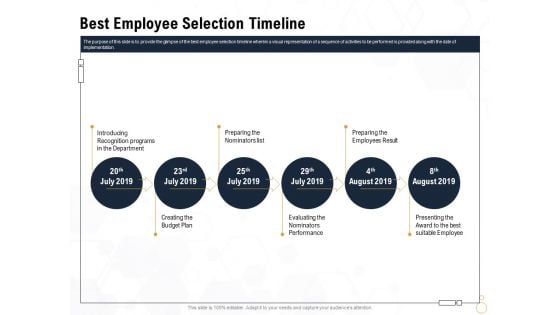
Star Employee Best Employee Selection Timeline Ppt Model Infographics PDF
Presenting this set of slides with name star employee best employee selection timeline ppt model infographics pdf. This is a six stage process. The stages in this process are introducing recognition programs in the department, preparing the nominators list, creating the budget plan, evaluating the nominators performance. This is a completely editable PowerPoint presentation and is available for immediate download. Download now and impress your audience.
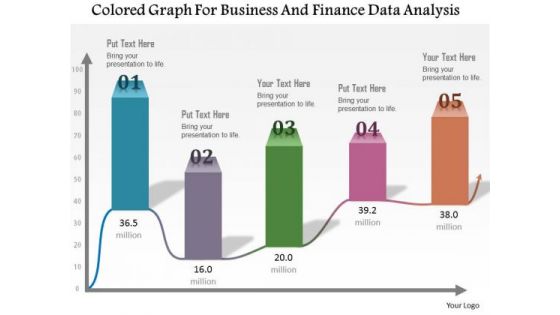
Business Diagram Colored Graph For Business And Finance Data Analysis Presentation Template
This Power Point template has been designed with graphic of colored bar graph. Use this slide to represent five steps of any business process. Use this diagram for your business presentations and get exclusive comments on your efforts.
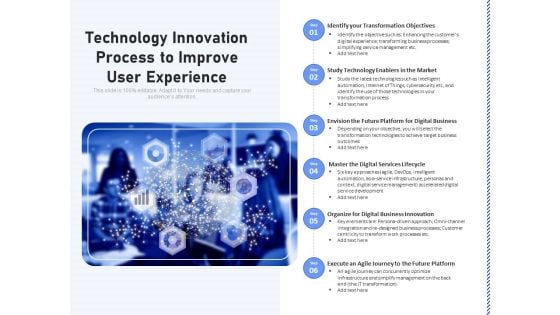
Technology Innovation Process To Improve User Experience Ppt PowerPoint Presentation Slides Elements PDF
Presenting technology innovation process to improve user experience ppt powerpoint presentation slides elements pdf to dispense important information. This template comprises six stages. It also presents valuable insights into the topics including identify your transformation objectives, study technology enablers in the market, envision the future platform for digital business, master the digital services lifecycle, organize for digital business innovation, execute an agile journey to the future platform. This is a completely customizable PowerPoint theme that can be put to use immediately. So, download it and address the topic impactfully.
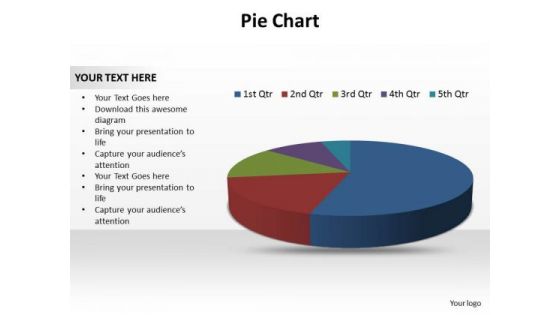
Buisness Leadership PowerPoint Templates Business Pie Chart Data Ppt Slides
Business Leadership PowerPoint Templates Business pie chart data PPT Slides-use this diagram to show your ideas all together to form the complete picture and reach the goal-Business Leadership PowerPoint Templates Business pie chart data PPT Slides-This ppt can be used for concepts relating to-Answer, Assemble, Assembly, Attention, Background, Brains, Build, Business, Challenge, Challenging, Clue, Complete, Complex, Concentration, Concept, Connect, Connection, Education, Entertainment, Finish Educate teams with our Buisness Leadership PowerPoint Templates Business Pie Chart Data Ppt Slides. Download without worries with our money back guaranteee.
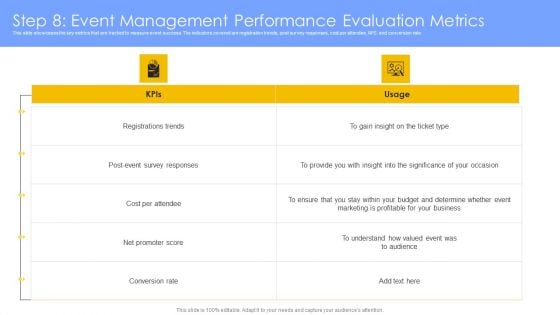
Step 8 Event Management Performance Evaluation Metrics Themes PDF
This slide showcases the key metrics that are tracked to measure event success. The indicators covered are registration trends, post survey responses, cost per attendee, NPS and conversion rate. Take your projects to the next level with our ultimate collection of Step 8 Event Management Performance Evaluation Metrics Themes PDF. Slidegeeks has designed a range of layouts that are perfect for representing task or activity duration, keeping track of all your deadlines at a glance. Tailor these designs to your exact needs and give them a truly corporate look with your own brand colors they will make your projects stand out from the rest

Comparative Analysis Of Enterprise Repository And Data Mart Diagrams PDF
The slide analyses a comparative matrix of data warehouse and data mart. The slide includes definition, usage, objective , data type , data value, size, design and approach. Showcasing this set of slides titled Comparative Analysis Of Enterprise Repository And Data Mart Diagrams PDF. The topics addressed in these templates are Parameters, Data Warehouse, Data Mart. All the content presented in this PPT design is completely editable. Download it and make adjustments in color, background, font etc. as per your unique business setting.
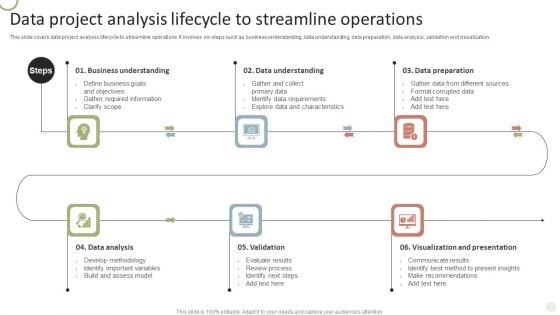
Data Project Analysis Lifecycle To Streamline Operations Diagrams PDF
This slide covers data project analysis lifecycle to streamline operations. It involves six steps such as business understanding, data understanding, data preparation, data analysis, validation and visualization.Persuade your audience using this Data Project Analysis Lifecycle To Streamline Operations Diagrams PDF. This PPT design covers six stages, thus making it a great tool to use. It also caters to a variety of topics including Business Understanding, Data Understanding, Data Preparation. Download this PPT design now to present a convincing pitch that not only emphasizes the topic but also showcases your presentation skills.
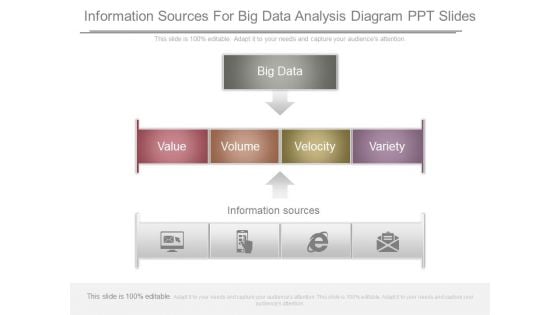
Information Sources For Big Data Analysis Diagram Ppt Slides
This is a information sources for big data analysis diagram ppt slides. This is a three stage process. The stages in this process are big data, value, volume, velocity, variety, information sources.
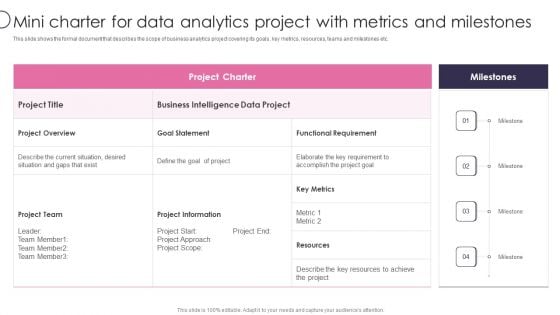
Information Transformation Process Toolkit Mini Charter For Data Analytics Project With Metrics And Milestones Themes PDF
This slide shows the formal document that describes the scope of business analytics project covering its goals, key metrics, resources, teams and milestones etc. Deliver and pitch your topic in the best possible manner with this Information Transformation Process Toolkit Mini Charter For Data Analytics Project With Metrics And Milestones Themes PDF. Use them to share invaluable insights on Project Team, Project Information, Key Metrics and impress your audience. This template can be altered and modified as per your expectations. So, grab it now.
Magnifying Glass Ppt PowerPoint Presentation Infographic Template Example File
This is a magnifying glass ppt powerpoint presentation infographic template example file. This is a two stage process. The stages in this process are magnifying glass, gears, technology, marketing, strategy, business.
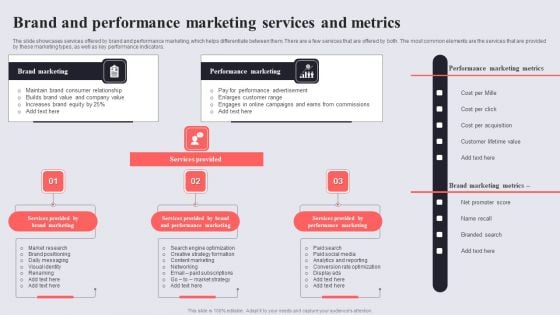
Brand And Performance Marketing Services And Metrics Themes PDF
The slide showcases services offered by brand and performance marketing, which helps differentiate between them. There are a few services that are offered by both. The most common elements are the services that are provided by these marketing types, as well as key performance indicators. Presenting Brand And Performance Marketing Services And Metrics Themes PDF to dispense important information. This template comprises three stages. It also presents valuable insights into the topics including Services Provided, Services Provided, Services Provided Performance Marketing. This is a completely customizable PowerPoint theme that can be put to use immediately. So, download it and address the topic impactfully.
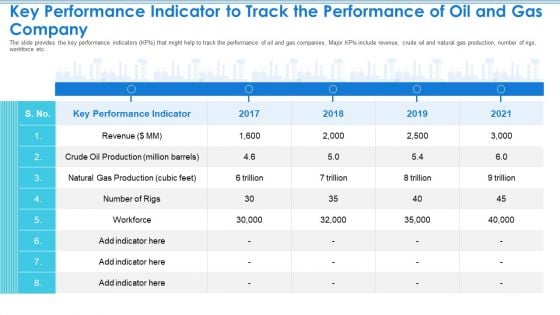
Case Competition Petroleum Sector Issues Key Performance Indicator To Track The Performance Of Oil And Gas Company Diagrams PDF
The slide provides the key performance indicators KPIs that might help to track the performance of oil and gas companies. Major KPIs include revenue, crude oil and natural gas production, number of rigs, workforce etc. Deliver and pitch your topic in the best possible manner with this case competition petroleum sector issues key performance indicator to track the performance of oil and gas company diagrams pdf. Use them to share invaluable insights on key performance indicator, revenue, 2017 to 2021 and impress your audience. This template can be altered and modified as per your expectations. So, grab it now.
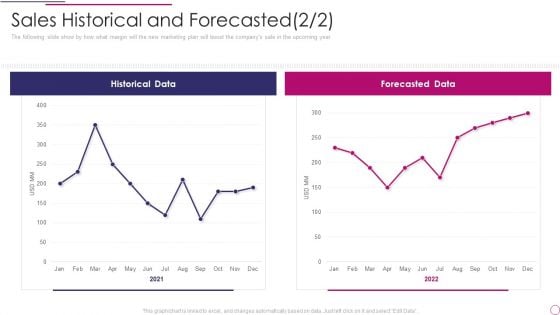
Performance Analysis Of New Product Development Sales Historical And Forecasted Data Rules PDF
The following slide show by how what margin will the new marketing plan will boost the companys sale in the upcoming year. Deliver and pitch your topic in the best possible manner with this performance analysis of new product development sales historical and forecasted data rules pdf. Use them to share invaluable insights on historical data, forecasted data and impress your audience. This template can be altered and modified as per your expectations. So, grab it now.
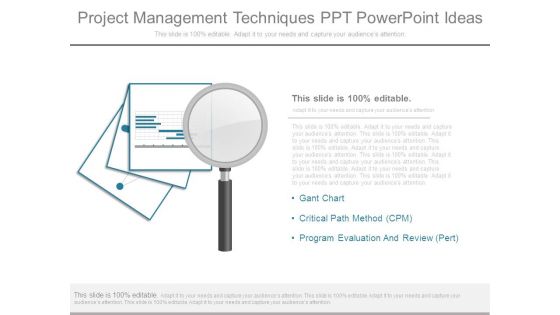
Project Management Techniques Ppt Powerpoint Ideas
This is a project management techniques ppt powerpoint ideas. This is a three stage process. The stages in this process are gant chart, critical path method cpm, program evaluation and review pert.
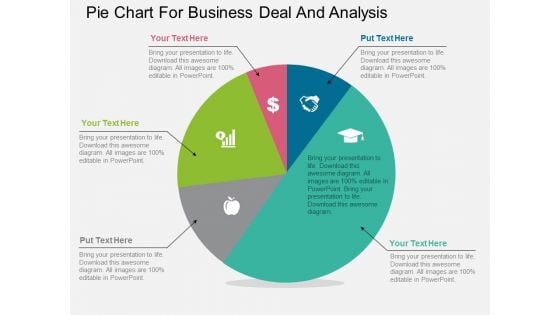
Pie Chart For Business Deal And Analysis Powerpoint Template
Our above PPT slide contains diagram of pentagon infographic. It helps to display steps of corporate marketing. Use this diagram to impart more clarity to data and to create more sound impact on viewers.
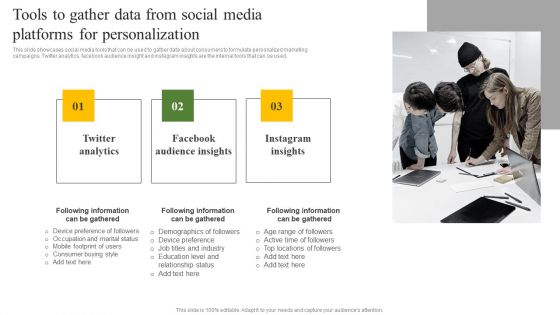
Tools To Gather Data From Social Media Platforms For Personalization Ppt Summary Microsoft PDF
This slide showcases social media tools that can be used to gather data about consumers to formulate personalized marketing campaigns. Twitter analytics, facebook audience insight and instagram insights are the internal tools that can be used. If you are looking for a format to display your unique thoughts, then the professionally designed Tools To Gather Data From Social Media Platforms For Personalization Ppt Summary Microsoft PDF is the one for you. You can use it as a Google Slides template or a PowerPoint template. Incorporate impressive visuals, symbols, images, and other charts. Modify or reorganize the text boxes as you desire. Experiment with shade schemes and font pairings. Alter, share or cooperate with other people on your work. Download Tools To Gather Data From Social Media Platforms For Personalization Ppt Summary Microsoft PDF and find out how to give a successful presentation. Present a perfect display to your team and make your presentation unforgettable.
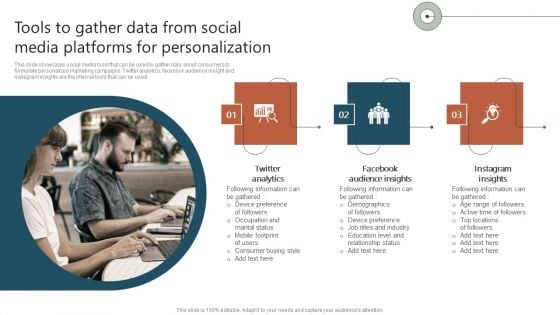
Tools To Gather Data From Social Media Platforms For Personalization Ppt Infographic Template Information PDF
This slide showcases social media tools that can be used to gather data about consumers to formulate personalized marketing campaigns. Twitter analytics, facebook audience insight and instagram insights are the internal tools that can be used. If you are looking for a format to display your unique thoughts, then the professionally designed Tools To Gather Data From Social Media Platforms For Personalization Ppt Infographic Template Information PDF is the one for you. You can use it as a Google Slides template or a PowerPoint template. Incorporate impressive visuals, symbols, images, and other charts. Modify or reorganize the text boxes as you desire. Experiment with shade schemes and font pairings. Alter, share or cooperate with other people on your work. Download Tools To Gather Data From Social Media Platforms For Personalization Ppt Infographic Template Information PDF and find out how to give a successful presentation. Present a perfect display to your team and make your presentation unforgettable.
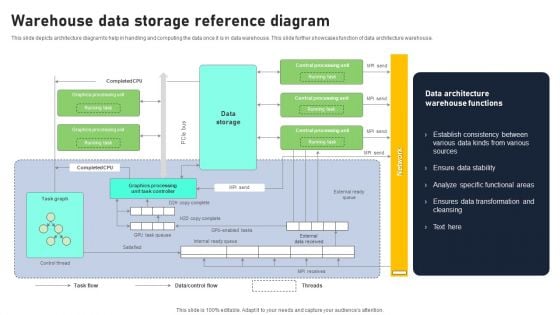
Warehouse Data Storage Reference Diagram Download PDF
This slide depicts architecture diagram to help in handling and computing the data once it is in data warehouse. This slide further showcases function of data architecture warehouse. Pitch your topic with ease and precision using this Warehouse Data Storage Reference Diagram Download PDF. This layout presents information on Ensure Data Stability, Specific Functional Areas, Data Transformation. It is also available for immediate download and adjustment. So, changes can be made in the color, design, graphics or any other component to create a unique layout.
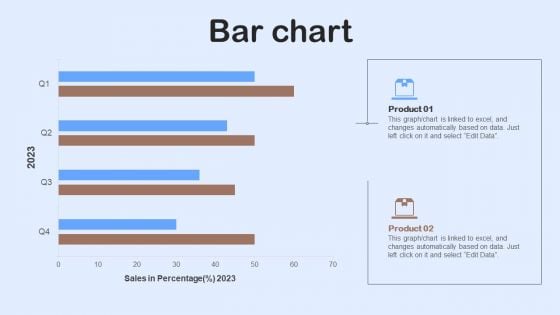
Nestle Performance Management Report Bar Chart Ppt Inspiration Shapes PDF
This graph or chart is linked to excel, and changes automatically based on data. Just left click on it and select Edit Data. Whether you have daily or monthly meetings, a brilliant presentation is necessary. Nestle Performance Management Report Bar Chart Ppt Inspiration Shapes PDF can be your best option for delivering a presentation. Represent everything in detail using Nestle Performance Management Report Bar Chart Ppt Inspiration Shapes PDF and make yourself stand out in meetings. The template is versatile and follows a structure that will cater to your requirements. All the templates prepared by Slidegeeks are easy to download and edit. Our research experts have taken care of the corporate themes as well. So, give it a try and see the results.
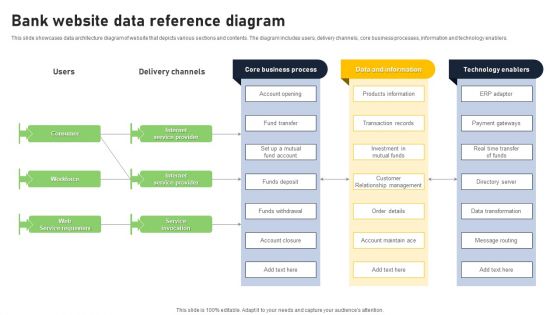
Bank Website Data Reference Diagram Mockup PDF
This slide showcases data architecture diagram of website that depicts various sections and contents. The diagram includes users, delivery channels, core business processes, information and technology enablers. Showcasing this set of slides titled Bank Website Data Reference Diagram Mockup PDF. The topics addressed in these templates are Core Business Process, Data Information, Technology Enablers. All the content presented in this PPT design is completely editable. Download it and make adjustments in color, background, font etc. as per your unique business setting.

Social Application Data Reference Diagram Introduction PDF
This slide depicts architecture diagram depicting data management. The diagram includes core and processing components, users application, core streaming and data management. Showcasing this set of slides titled Social Application Data Reference Diagram Introduction PDF. The topics addressed in these templates are Quality Assessment, Cotent Delivery, Content Enhancement. All the content presented in this PPT design is completely editable. Download it and make adjustments in color, background, font etc. as per your unique business setting.
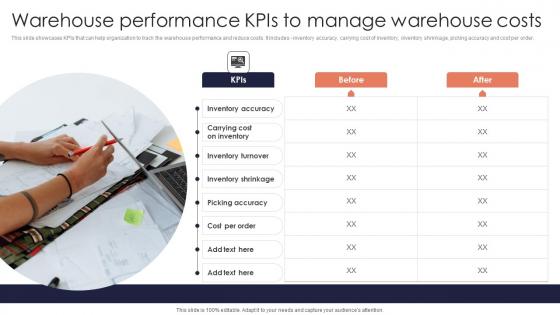
Warehouse Performance KPIs Minimizing Inventory Wastage Through Warehouse Slides Pdf
This slide showcases KPIs that can help organization to track the warehouse performance and reduce costs. It includes inventory accuracy, carrying cost of inventory, inventory shrinkage, picking accuracy and cost per order. Retrieve professionally designed Warehouse Performance KPIs Minimizing Inventory Wastage Through Warehouse Slides Pdf to effectively convey your message and captivate your listeners. Save time by selecting pre made slideshows that are appropriate for various topics, from business to educational purposes. These themes come in many different styles, from creative to corporate, and all of them are easily adjustable and can be edited quickly. Access them as PowerPoint templates or as Google Slides themes. You do not have to go on a hunt for the perfect presentation because Slidegeeks got you covered from everywhere. This slide showcases KPIs that can help organization to track the warehouse performance and reduce costs. It includes inventory accuracy, carrying cost of inventory, inventory shrinkage, picking accuracy and cost per order.
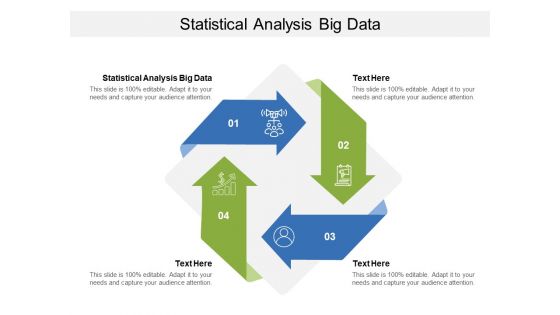
Statistical Analysis Big Data Ppt PowerPoint Presentation Ideas Diagrams Cpb
Presenting this set of slides with name statistical analysis big data ppt powerpoint presentation ideas diagrams cpb. This is an editable Powerpoint four stages graphic that deals with topics like statistical analysis big data to help convey your message better graphically. This product is a premium product available for immediate download and is 100 percent editable in Powerpoint. Download this now and use it in your presentations to impress your audience.
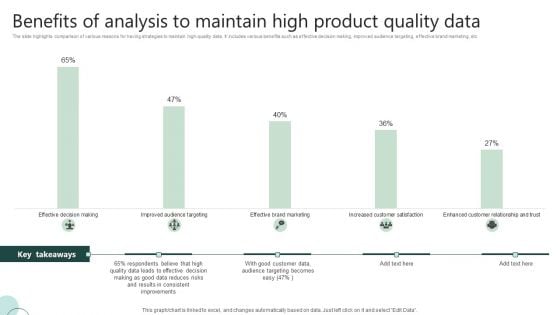
Benefits Of Analysis To Maintain High Product Quality Data Ppt Portfolio Gallery PDF
The slide highlights comparison of various reasons for having strategies to maintain high-quality data. It includes various benefits such as effective decision making, improved audience targeting, effective brand marketing, etc. Showcasing this set of slides titled Benefits Of Analysis To Maintain High Product Quality Data Ppt Portfolio Gallery PDF. The topics addressed in these templates are Effective Decision, Quality Data Leads, Good Customer Data. All the content presented in this PPT design is completely editable. Download it and make adjustments in color, background, font etc. as per your unique business setting.
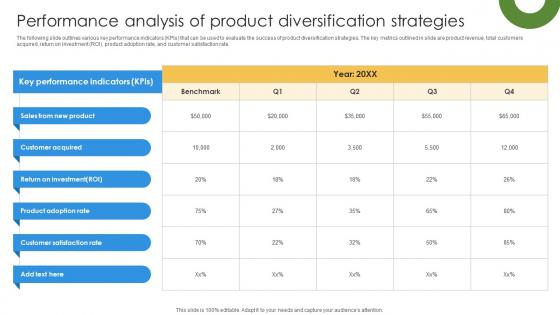
Marketing Growth Strategy To Strengthen Performance Analysis Of Product Strategy SS V
The following slide outlines various key performance indicators KPIs that can be used to evaluate the success of product diversification strategies. The key metrics outlined in slide are product revenue, total customers acquired, return on investment ROI, product adoption rate, and customer satisfaction rate. If you are looking for a format to display your unique thoughts, then the professionally designed Marketing Growth Strategy To Strengthen Performance Analysis Of Product Strategy SS V is the one for you. You can use it as a Google Slides template or a PowerPoint template. Incorporate impressive visuals, symbols, images, and other charts. Modify or reorganize the text boxes as you desire. Experiment with shade schemes and font pairings. Alter, share or cooperate with other people on your work. Download Marketing Growth Strategy To Strengthen Performance Analysis Of Product Strategy SS V and find out how to give a successful presentation. Present a perfect display to your team and make your presentation unforgettable. The following slide outlines various key performance indicators KPIs that can be used to evaluate the success of product diversification strategies. The key metrics outlined in slide are product revenue, total customers acquired, return on investment ROI, product adoption rate, and customer satisfaction rate.
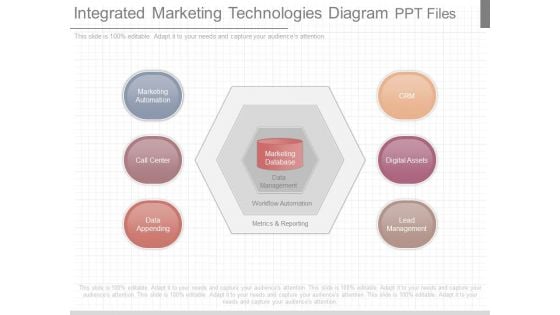
Integrated Marketing Technologies Diagram Ppt Files
This is a integrated marketing technologies diagram ppt files. This is a six stage process. The stages in this process are crm, digital assets, lead management, marketing, automation, call center, data appending, marketing database, data management, workflow automation, metrics and reporting.
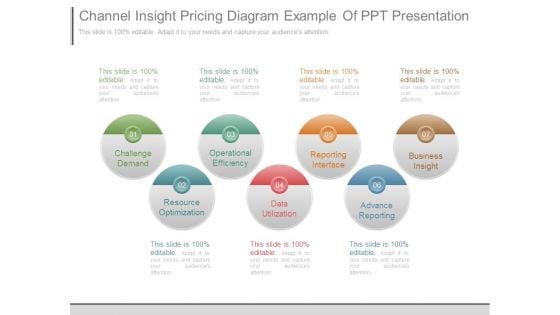
Channel Insight Pricing Diagram Example Of Ppt Presentation
This is a channel insight pricing diagram example of ppt presentation. This is a seven stage process. The stages in this process are challenge demand, operational efficiency, reporting interface, business insight, resource optimization, data utilization, advance reporting.
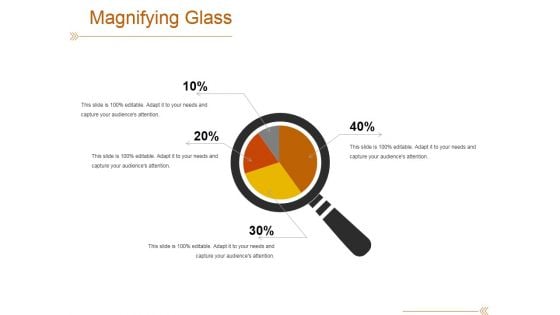
Magnifying Glass Ppt PowerPoint Presentation Outline Graphics Design
This is a magnifying glass ppt powerpoint presentation outline graphics design. This is a four stage process. The stages in this process are magnifier glass, research, business, marketing.

Product Analytics Implementation For Enhanced Business Insights Data Analytics V
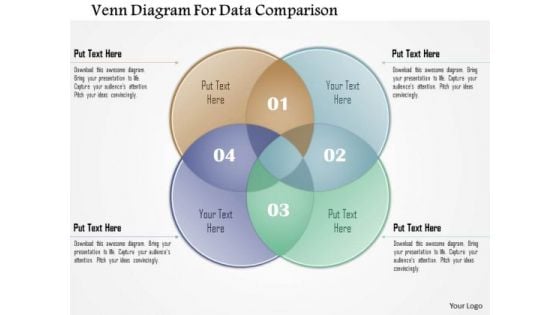
Business Diagram Venn Diagram For Data Comparison Presentation Template
Our above diagram displays venn diagrams that helps to display the interrelation of concepts by placing interrelated words in overlapping circles. This diagram helps you to communicate information visually.
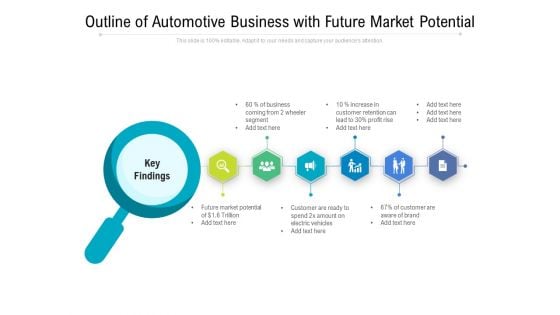
Outline Of Automotive Business With Future Market Potential Ppt PowerPoint Presentation Gallery Inspiration PDF
Presenting outline of automotive business with future market potential ppt powerpoint presentation gallery inspiration pdf to dispense important information. This template comprises six stages. It also presents valuable insights into the topics including business coming from 2 wheeler segment, increase in customer retention can lead, profit rise, future market potential, customer, customer aware brand. This is a completely customizable PowerPoint theme that can be put to use immediately. So, download it and address the topic impactfully.
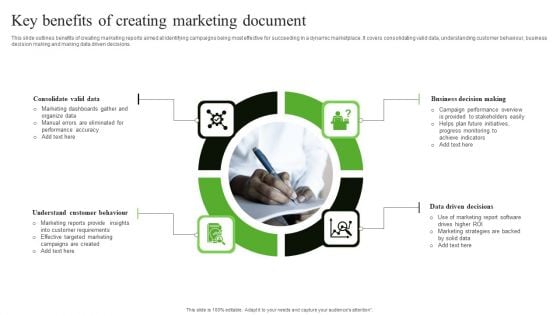
Key Benefits Of Creating Marketing Document Infographics PDF
This slide outlines benefits of creating marketing reports aimed at identifying campaigns being most effective for succeeding in a dynamic marketplace. It covers consolidating valid data, understanding customer behaviour, business decision making and making data driven decisions. Presenting Key Benefits Of Creating Marketing Document Infographics PDF to dispense important information. This template comprises four stages. It also presents valuable insights into the topics including Consolidate Valid Data, Understand Customer Behaviour, Business Decision Making. This is a completely customizable PowerPoint theme that can be put to use immediately. So, download it and address the topic impactfully.
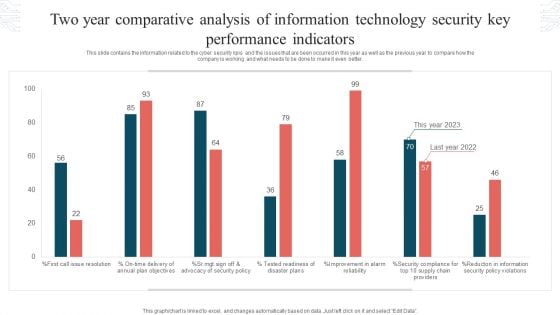
Two Year Comparative Analysis Of Information Technology Security Key Performance Indicators Graphics PDF
This slide contains the information related to the cyber security kpis and the issues that are been occurred in this year as well as the previous year to compare how the company is working and what needs to be done to make it even better. Showcasing this set of slides titled Two Year Comparative Analysis Of Information Technology Security Key Performance Indicators Graphics PDF. The topics addressed in these templates are Tested Readiness, Disaster Plans, Security Policy Violations. All the content presented in this PPT design is completely editable. Download it and make adjustments in color, background, font etc. as per your unique business setting.
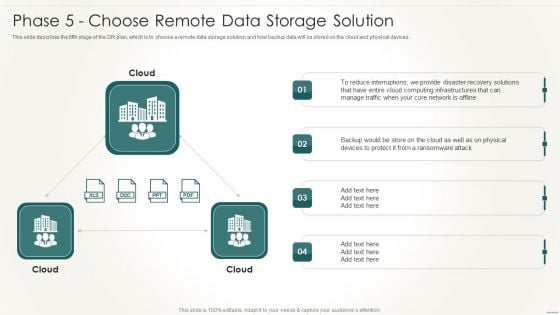
Information Technology Disaster Resilience Plan Phase 5 Choose Remote Data Storage Solution Slides PDF
This slide describes the fifth stage of the DR plan, which is to choose a remote data storage solution and how backup data will be stored on the cloud and physical devices.Deliver an awe inspiring pitch with this creative Information Technology Disaster Resilience Plan Phase 5 Choose Remote Data Storage Solution Slides PDF bundle. Topics like Reduce Interruptions, Computing Infrastructures, Ransomware Attack can be discussed with this completely editable template. It is available for immediate download depending on the needs and requirements of the user.
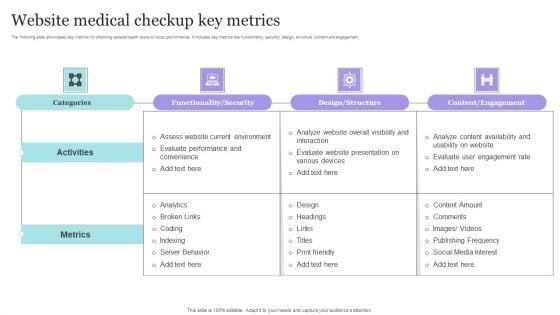
Website Medical Checkup Key Metrics Themes PDF
The following slide showcases key metrics for checking website health score to boost performance. It includes key metrics like functionality, security, design, structure, content and engagement. Pitch your topic with ease and precision using this Website Medical Checkup Key Metrics Themes PDF. This layout presents information on Evaluate Performance, Environment, Metrics. It is also available for immediate download and adjustment. So, changes can be made in the color, design, graphics or any other component to create a unique layout.
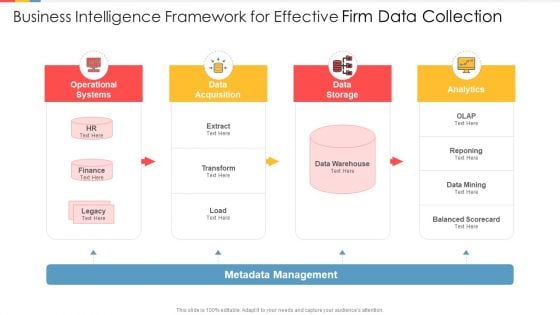
Business Intelligence Framework For Effective Firm Data Collection Ideas PDF
Presenting business intelligence framework for effective firm data collection ideas pdf to dispense important information. This template comprises four stages. It also presents valuable insights into the topics including operational systems, data acquisition, data storage, analytics. This is a completely customizable PowerPoint theme that can be put to use immediately. So, download it and address the topic impactfully.
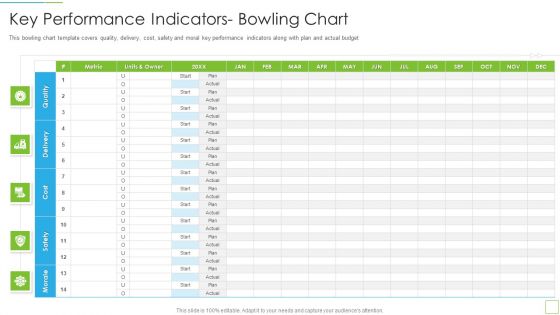
Hoshin Kanri Pitch Deck Key Performance Indicators Bowling Chart Introduction PDF
This bowling chart template covers quality, delivery, cost, safety and moral key performance indicators along with plan and actual budget Deliver an awe inspiring pitch with this creative hoshin kanri pitch deck key performance indicators bowling chart introduction pdf bundle. Topics like key performance indicators bowling chart can be discussed with this completely editable template. It is available for immediate download depending on the needs and requirements of the user.
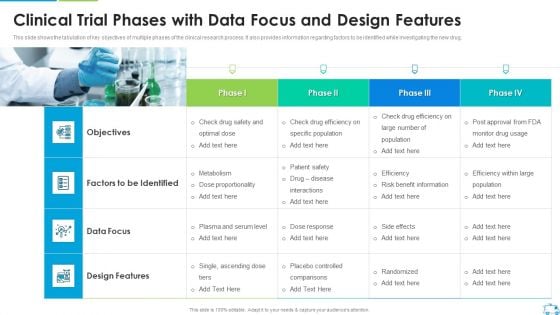
Clinical Trial Phases With Data Focus And Design Features Introduction PDF
This slide shows the tabulation of key objectives of multiple phases of the clinical research process. It also provides information regarding factors to be identified while investigating the new drug.Deliver and pitch your topic in the best possible manner with this Clinical Trial Phases With Data Focus And Design Features Introduction PDF Use them to share invaluable insights on Specific Population, Factors To Be Identified, Design Features and impress your audience. This template can be altered and modified as per your expectations. So, grab it now.

 Home
Home