Dashboard Icon
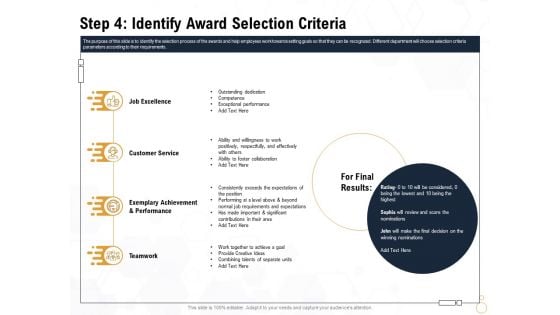
Star Employee Step 4 Identify Award Selection Criteria Infographics PDF
Presenting this set of slides with name star employee step 4 identify award selection criteria infographics pdf. This is a four stage process. The stages in this process are job excellence, customer service, teamwork, exemplary achievement and performance. This is a completely editable PowerPoint presentation and is available for immediate download. Download now and impress your audience.
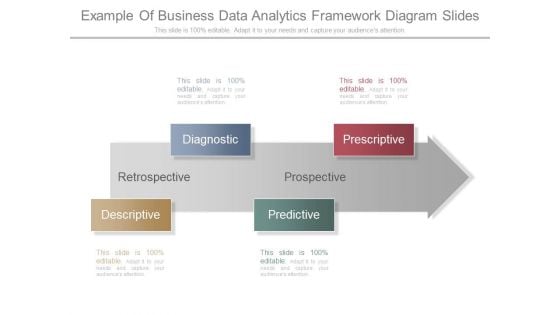
Example Of Business Data Analytics Framework Diagram Slides
This is a example of business data analytics framework diagram slides. This is a four stage process. The stages in this process are diagnostic, descriptive, predictive, prescriptive, retrospective, prospective.

Comparative Analysis Of Quantitative And Qualitative Data Analysis Pictures PDF
Presenting Comparative Analysis Of Quantitative And Qualitative Data Analysis Pictures PDF to dispense important information. This template comprises five stages. It also presents valuable insights into the topics including Data Format, Analysis, Definition. This is a completely customizable PowerPoint theme that can be put to use immediately. So, download it and address the topic impactfully.
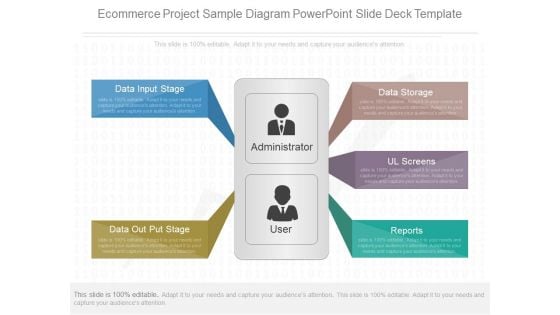
Ecommerce Project Sample Diagram Powerpoint Slide Deck Template
This is a ecommerce project sample diagram powerpoint slide deck template. This is a five stage process. The stages in this process are data input stage, data out put stage, data storage, ul screens, reports.
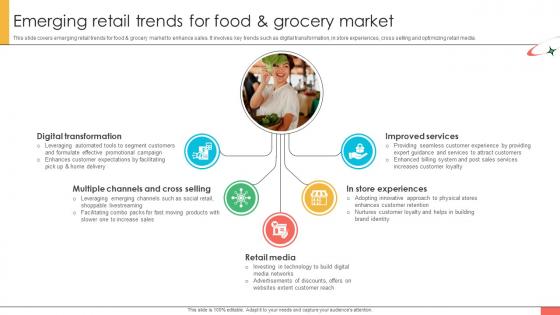
Marketing Strategies For Effective Emerging Retail Trends For Food And Grocery
This slide covers emerging retail trends for food and grocery market to enhance sales. It involves key trends such as digital transformation, in store experiences, cross selling and optimizing retail media. Whether you have daily or monthly meetings, a brilliant presentation is necessary. Marketing Strategies For Effective Emerging Retail Trends For Food And Grocery can be your best option for delivering a presentation. Represent everything in detail using Marketing Strategies For Effective Emerging Retail Trends For Food And Grocery and make yourself stand out in meetings. The template is versatile and follows a structure that will cater to your requirements. All the templates prepared by Slidegeeks are easy to download and edit. Our research experts have taken care of the corporate themes as well. So, give it a try and see the results. This slide covers emerging retail trends for food and grocery market to enhance sales. It involves key trends such as digital transformation, in store experiences, cross selling and optimizing retail media.
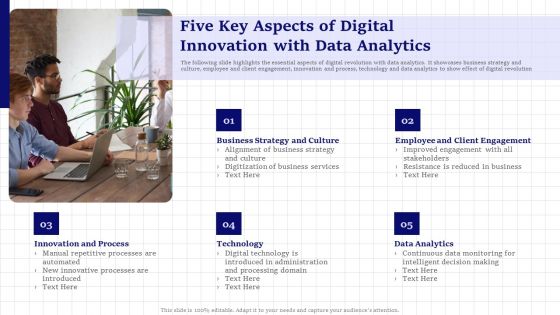
Five Key Aspects Of Digital Innovation With Data Analytics Brochure PDF
The following slide highlights the essential aspects of digital revolution with data analytics. It showcases business strategy and culture, employee and client engagement, innovation and process, technology and data analytics to show effect of digital revolution. Presenting Five Key Aspects Of Digital Innovation With Data Analytics Brochure PDF to dispense important information. This template comprises five stages. It also presents valuable insights into the topics including Innovation And Process, Technology, Data Analytics. This is a completely customizable PowerPoint theme that can be put to use immediately. So, download it and address the topic impactfully.

Picture Of Star Performance Trophy Ppt PowerPoint Presentation Infographic Template Infographic Template
Presenting this set of slides with name picture of star performance trophy ppt powerpoint presentation infographic template infographic template. This is a one stage process. The stages in this process are picture of star performance trophy. This is a completely editable PowerPoint presentation and is available for immediate download. Download now and impress your audience.
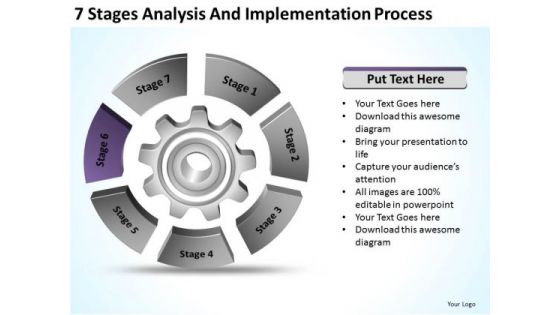
7 Stages Analysis And Implementation Process Business Plans PowerPoint Slides
We present our 7 stages analysis and implementation process business plans PowerPoint Slides.Download and present our Business PowerPoint Templates because It will let you Set new benchmarks with our PowerPoint Templates and Slides. They will keep your prospects well above par. Download our Venn Diagrams PowerPoint Templates because You are an avid believer in ethical practices. Highlight the benefits that accrue with our PowerPoint Templates and Slides. Use our Layers PowerPoint Templates because Our PowerPoint Templates and Slides will provide weight to your words. They will bring out the depth of your thought process. Use our Circle Charts PowerPoint Templates because Our PowerPoint Templates and Slides provide you with a vast range of viable options. Select the appropriate ones and just fill in your text. Download our Shapes PowerPoint Templates because you should once Tap the ingenuity of our PowerPoint Templates and Slides. They are programmed to succeed.Use these PowerPoint slides for presentations relating to diagram, process, business, graphic, design, ideas, model, data, chart, project, schema, corporate, implementation, tag, plan, engineering, concept, vector, success, symbol, stack, circle, guide, work flow, development, shape, team, management, cycle, steps, illustration, system, strategy, objects, phase, professional, organization, implement, background, image, detail, structure, product. The prominent colors used in the PowerPoint template are Blue, Black, Gray. You will rarely find fault with our 7 Stages Analysis And Implementation Process Business Plans PowerPoint Slides. They are designed by a fastidious team.
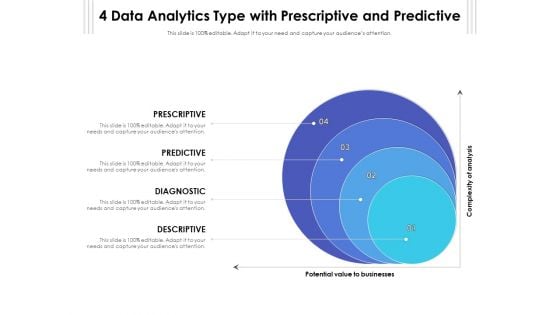
4 Data Analytics Type With Prescriptive And Predictive Ppt PowerPoint Presentation File Infographic Template PDF
Presenting 4 data analytics type with prescriptive and predictive ppt powerpoint presentation file infographic template pdf to dispense important information. This template comprises four stages. It also presents valuable insights into the topics including prescriptive, predictive, diagnostic. This is a completely customizable PowerPoint theme that can be put to use immediately. So, download it and address the topic impactfully.
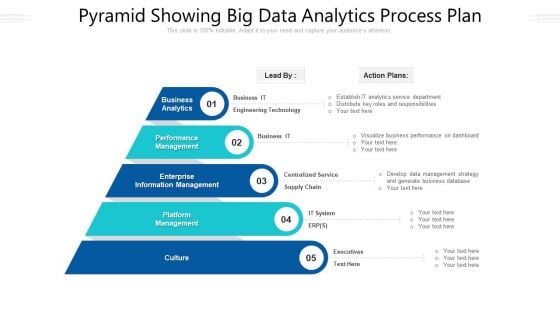
Pyramid Showing Big Data Analytics Process Plan Ppt PowerPoint Presentation File Ideas PDF
Presenting pyramid showing big data analytics process plan ppt powerpoint presentation file ideas pdf to dispense important information. This template comprises five stages. It also presents valuable insights into the topics including culture, management, performance. This is a completely customizable PowerPoint theme that can be put to use immediately. So, download it and address the topic impactfully.
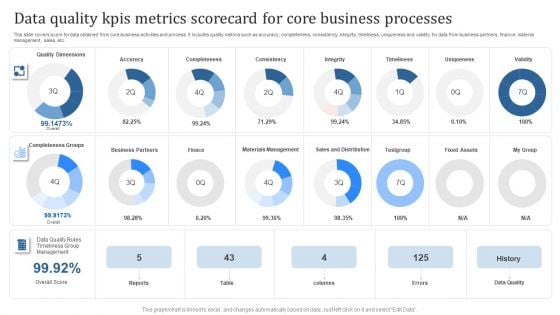
Data Quality Kpis Metrics Scorecard For Core Business Processes Topics PDF
This slide covers score for data obtained from core business activities and process. It includes quality metrics such as accuracy, completeness, consistency, integrity, timeliness, uniqueness and validity for data from business partners, finance, material management, sales, etc. Showcasing this set of slides titled Data Quality Kpis Metrics Scorecard For Core Business Processes Topics PDF. The topics addressed in these templates are Data Quality, Errors, Reports. All the content presented in this PPT design is completely editable. Download it and make adjustments in color, background, font etc. as per your unique business setting.
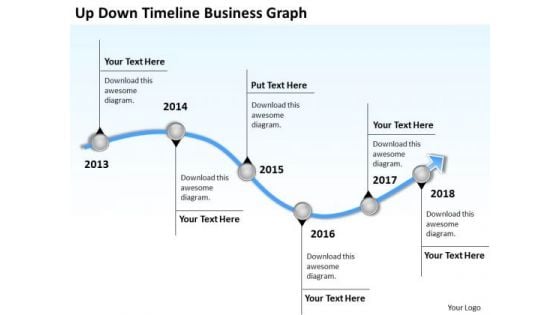
Business Analysis Diagrams PowerPoint Presentations Graph Templates
We present our business analysis diagrams powerpoint presentations graph templates.Download and present our Curves and Lines PowerPoint Templates because Your audience will believe you are the cats whiskers. Present our Business PowerPoint Templates because Our PowerPoint Templates and Slides will effectively help you save your valuable time. They are readymade to fit into any presentation structure. Present our Business PowerPoint Templates because Our PowerPoint Templates and Slides will give good value for money. They also have respect for the value of your time. Use our Arrows PowerPoint Templates because It will get your audience in sync. Present our Process and Flows PowerPoint Templates because It can Conjure up grand ideas with our magical PowerPoint Templates and Slides. Leave everyone awestruck by the end of your presentation.Use these PowerPoint slides for presentations relating to 3d, account, accounting, annual, balance, business, chart, commerce, crisis, data,earnings, economics, economy, exchange, figures, finance, financial, graph,graphic, growth, illustration, index, information, investment, list, line,management,market, marketing, money, monitoring, numbers, office, paperwork, plan, price,printout, report, research, sale, statistical, statistics, stock, success, tax, trade,work. The prominent colors used in the PowerPoint template are Blue light, Gray, White. Examine the causes with our Business Analysis Diagrams PowerPoint Presentations Graph Templates. Let everyone know what's behind it all.
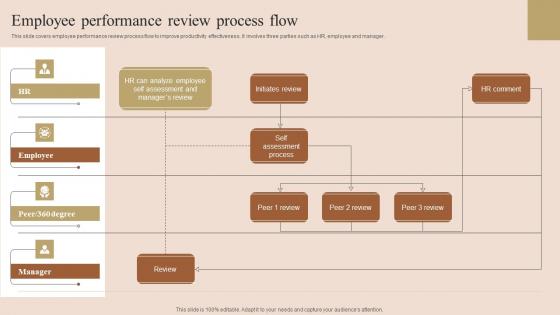
Employee Performance Review Employee Performance Improvement Techniques Infographics Pdf
This slide covers employee performance review process flow to improve productivity effectiveness. It involves three parties such as HR, employee and manager. Whether you have daily or monthly meetings, a brilliant presentation is necessary. Employee Performance Review Employee Performance Improvement Techniques Infographics Pdf can be your best option for delivering a presentation. Represent everything in detail using Employee Performance Review Employee Performance Improvement Techniques Infographics Pdf and make yourself stand out in meetings. The template is versatile and follows a structure that will cater to your requirements. All the templates prepared by Slidegeeks are easy to download and edit. Our research experts have taken care of the corporate themes as well. So, give it a try and see the results. This slide covers employee performance review process flow to improve productivity effectiveness. It involves three parties such as HR, employee and manager.
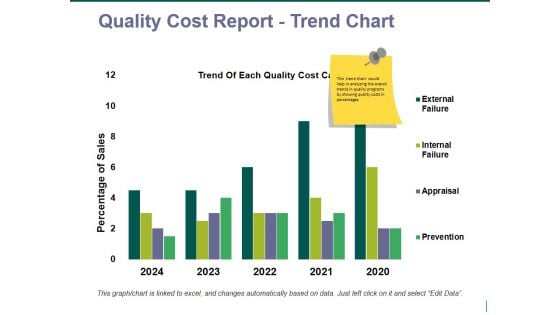
quality cost report trend chart ppt powerpoint presentation pictures vector
This is a quality cost report trend chart ppt powerpoint presentation pictures vector. This is a four stage process. The stages in this process are business, finance, marketing, strategy, analysis.
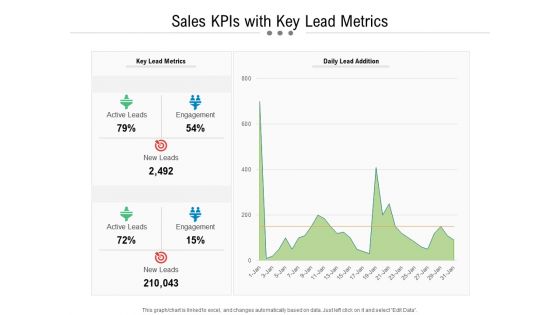
Sales Kpis With Key Lead Metrics Ppt PowerPoint Presentation Layouts Background PDF
Presenting this set of slides with name sales kpis with key lead metrics ppt powerpoint presentation layouts background pdf. The topics discussed in these slides are key lead metrics, daily lead addition, active leads, engagement, new leads, active leads, engagement. This is a completely editable PowerPoint presentation and is available for immediate download. Download now and impress your audience.
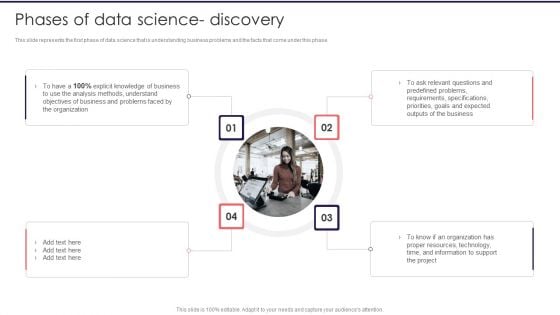
Information Studies Phases Of Data Science Discovery Template PDF
This slide represents the first phase of data science that is understanding business problems and the facts that come under this phase. Presenting Information Studies Phases Of Data Science Discovery Template PDF to provide visual cues and insights. Share and navigate important information on four stages that need your due attention. This template can be used to pitch topics like Organization, Analysis Methods, Proper Resources. In addtion, this PPT design contains high resolution images, graphics, etc, that are easily editable and available for immediate download.
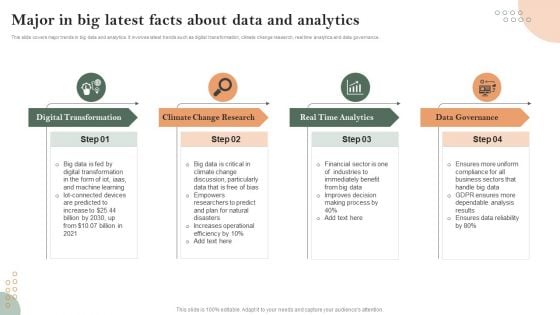
Major In Big Latest Facts About Data And Analytics Portrait PDF
This slide covers major trends in big data and analytics. It involves latest trends such as digital transformation, climate change research, real time analytics and data governance. Presenting Major In Big Latest Facts About Data And Analytics Portrait PDF to dispense important information. This template comprises Four stages. It also presents valuable insights into the topics including Digital Transformation, Climate Change Research, Real Time Analytics. This is a completely customizable PowerPoint theme that can be put to use immediately. So, download it and address the topic impactfully.
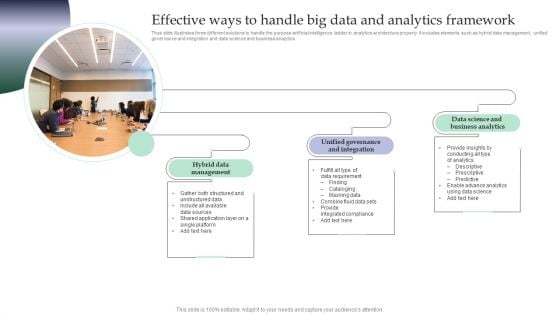
Effective Ways To Handle Big Data And Analytics Framework Pictures PDF
Thus slide illustrates three different solutions to handle the purpose artificial intelligence ladder in analytics architecture properly. It includes elements such as hybrid data management, unified governance and integration and data science and business analytics Presenting Effective Ways To Handle Big Data And Analytics Framework Pictures PDF to dispense important information. This template comprises three stages. It also presents valuable insights into the topics including Management, Integration, Business Analytics. This is a completely customizable PowerPoint theme that can be put to use immediately. So, download it and address the topic impactfully.
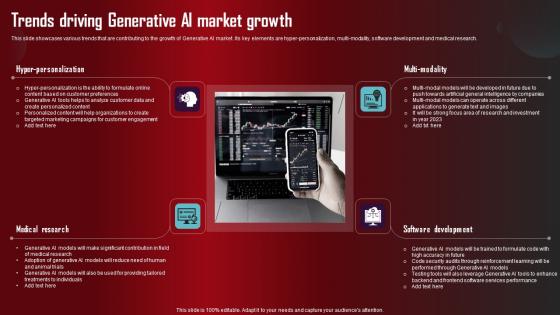
Trends Driving Generative AI Role Of Generative AI Tools Across Infographics Pdf
This slide showcases various trends that are contributing to the growth of Generative AI market. Its key elements are hyper personalization, multi modality, software development and medical research. Whether you have daily or monthly meetings, a brilliant presentation is necessary. Trends Driving Generative AI Role Of Generative AI Tools Across Infographics Pdf can be your best option for delivering a presentation. Represent everything in detail using Trends Driving Generative AI Role Of Generative AI Tools Across Infographics Pdf and make yourself stand out in meetings. The template is versatile and follows a structure that will cater to your requirements. All the templates prepared by Slidegeeks are easy to download and edit. Our research experts have taken care of the corporate themes as well. So, give it a try and see the results. This slide showcases various trends that are contributing to the growth of Generative AI market. Its key elements are hyper-personalization, multi modality, software development and medical research.
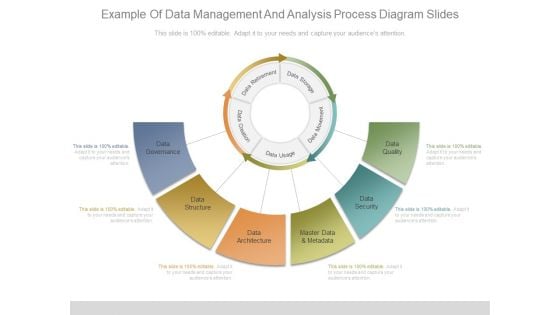
Example Of Data Management And Analysis Process Diagram Slides
Presenting this set of slides with name example of data management and analysis process diagram slides. This is a six stage process. The stages in this process are data governance, data structure, data architecture, master data and metadata, data security, data quality. This is a completely editable PowerPoint presentation and is available for immediate download. Download now and impress your audience.
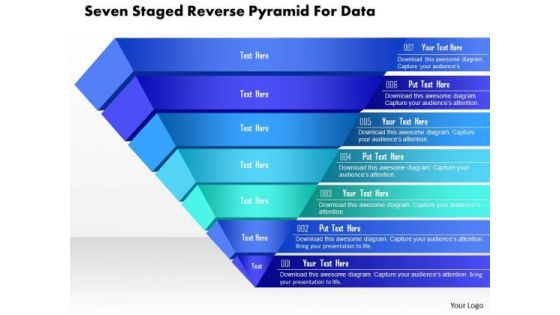
Business Diagram Seven Staged Reverse Pyramid For Data Presentation Template
This business slide is designed with seven staged pyramid diagram. Download this professional slide to depict sales and marketing analysis. This image slide is best to present your newer thoughts.
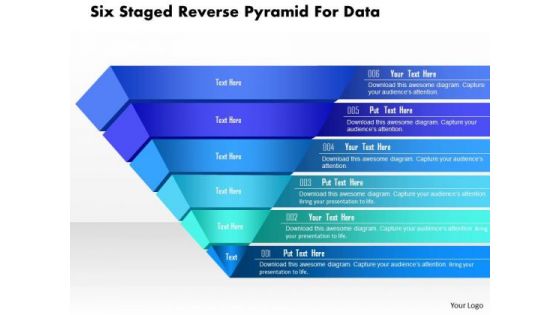
Business Diagram Six Staged Reverse Pyramid For Data Presentation Template
This business slide is designed with six staged pyramid diagram. Download this professional slide to depict sales and marketing analysis. This image slide is best to present your newer thoughts.

Stock Photo 3d Globe With Social Web For Data Protection Concept PowerPoint Slide
Graphic of 3d globe and web has been used to craft this power point image template. This PPT contains the concept of data protection and social network. Use this PPT and build quality presentation for your viewers.
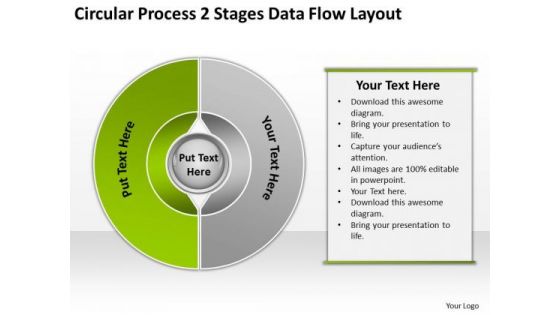
Circular Process 2 Stages Data Flow Layout Market Plan Example PowerPoint Slides
We present our circular process 2 stages data flow layout market plan example PowerPoint Slides.Use our Process and Flows PowerPoint Templates because Our PowerPoint Templates and Slides will let your team Walk through your plans. See their energy levels rise as you show them the way. Download our Circle Charts PowerPoint Templates because Our PowerPoint Templates and Slides will Activate the energies of your audience. Get their creative juices flowing with your words. Download our Business PowerPoint Templates because These PowerPoint Templates and Slides will give the updraft to your ideas. See them soar to great heights with ease. Use our Marketing PowerPoint Templates because You are an avid believer in ethical practices. Highlight the benefits that accrue with our PowerPoint Templates and Slides. Use our Success PowerPoint Templates because Our PowerPoint Templates and Slides will let you meet your Deadlines.Use these PowerPoint slides for presentations relating to Cross, circle,statistics, model, target,two,steps, statement, interface, business, arrow, list, presentation, glossy, internet, diagram, circle,brochure, description, report, marketing, level, abstract, wheel, steps, illustration, pie, chart, sphere, registry, catalog, section, futuristic, colors, web, design,information, space, demonstration, navigation, pattern, webdesign, structure, multiple, button, goals. The prominent colors used in the PowerPoint template are Green lime, White, Gray. Our Circular Process 2 Stages Data Flow Layout Market Plan Example PowerPoint Slides have a everlasting effect. They remain in the memory for ages.
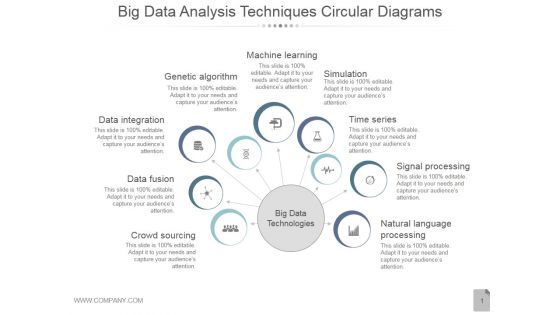
Big Data Analysis Techniques Circular Diagrams Ppt PowerPoint Presentation Shapes
This is a big data analysis techniques circular diagrams ppt powerpoint presentation shapes. This is a nine stage process. The stages in this process are data fusion, data integration, genetic algorithm, machine learning, simulation.
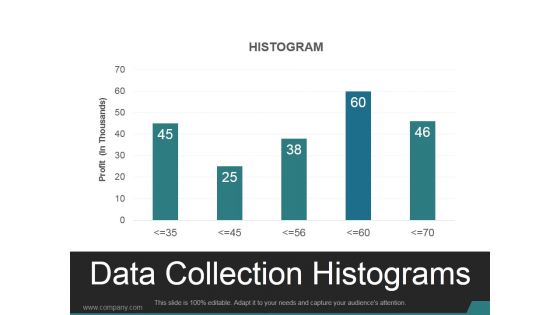
Data Collection Histograms Ppt PowerPoint Presentation Design Templates
This is a data collection histograms ppt powerpoint presentation design templates. This is a five stage process. The stages in this process are histogram, business, marketing, analysis, chart.
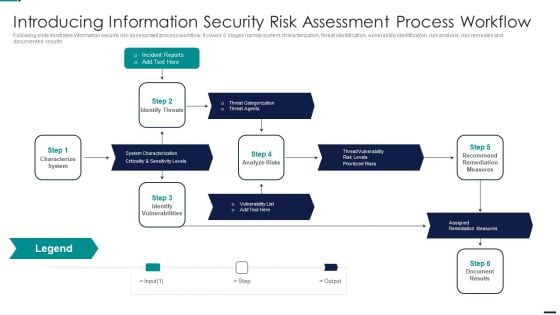
Risk Management Model For Data Introducing Information Security Risk Assessment Process Sample PDF
Following slide illustrates information security risk assessment process workflow. It covers 6 stages namely system characterization, threat identification, vulnerability identification, risk analysis, risk remedies and documented results. This is a Risk Management Model For Data Introducing Information Security Risk Assessment Process Sample PDF template with various stages. Focus and dispense information on five stages using this creative set, that comes with editable features. It contains large content boxes to add your information on topics like Incident Reports, Characterize System, Identify Vulnerabilities, Assigned Remediation Measures. You can also showcase facts, figures, and other relevant content using this PPT layout. Grab it now.
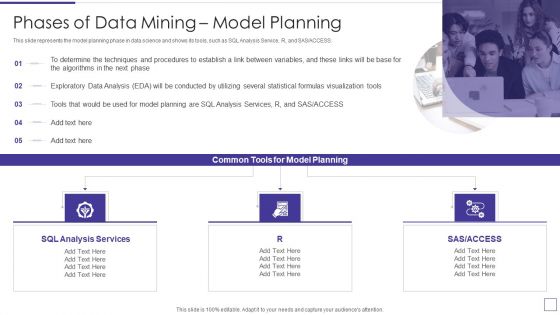
Data Mining Implementation Phases Of Data Mining Model Planning Portrait PDF
This slide represents the model planning phase in data science and shows its tools, such as SQL Analysis Service, R, and SAS or ACCESS.This is a data mining implementation phases of data mining model planning portrait pdf template with various stages. Focus and dispense information on five stages using this creative set, that comes with editable features. It contains large content boxes to add your information on topics like determine the techniques, exploratory data analysis, several statistical formulas You can also showcase facts, figures, and other relevant content using this PPT layout. Grab it now.
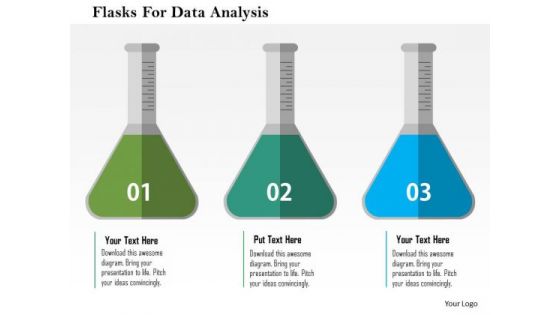
Business Diagram Flasks For Data Analysis Presentation Template
This business diagram displays three flasks. You may use this slide for data analysis. Make your mark with this unique slide. Create an impression that will endure.
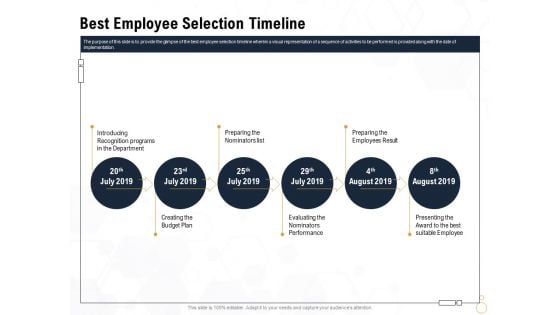
Star Employee Best Employee Selection Timeline Ppt Model Infographics PDF
Presenting this set of slides with name star employee best employee selection timeline ppt model infographics pdf. This is a six stage process. The stages in this process are introducing recognition programs in the department, preparing the nominators list, creating the budget plan, evaluating the nominators performance. This is a completely editable PowerPoint presentation and is available for immediate download. Download now and impress your audience.
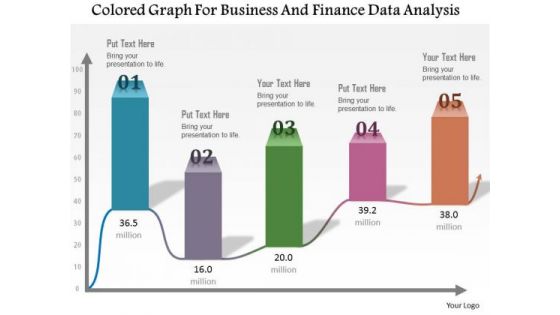
Business Diagram Colored Graph For Business And Finance Data Analysis Presentation Template
This Power Point template has been designed with graphic of colored bar graph. Use this slide to represent five steps of any business process. Use this diagram for your business presentations and get exclusive comments on your efforts.
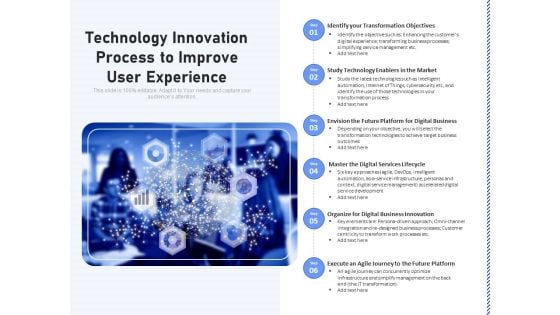
Technology Innovation Process To Improve User Experience Ppt PowerPoint Presentation Slides Elements PDF
Presenting technology innovation process to improve user experience ppt powerpoint presentation slides elements pdf to dispense important information. This template comprises six stages. It also presents valuable insights into the topics including identify your transformation objectives, study technology enablers in the market, envision the future platform for digital business, master the digital services lifecycle, organize for digital business innovation, execute an agile journey to the future platform. This is a completely customizable PowerPoint theme that can be put to use immediately. So, download it and address the topic impactfully.
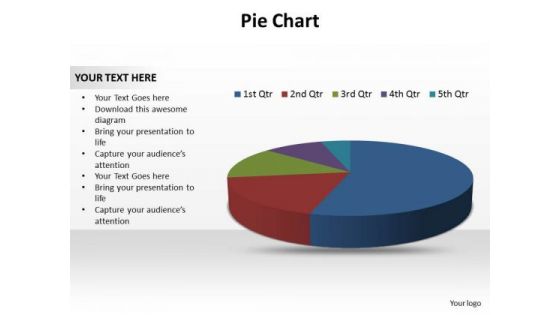
Buisness Leadership PowerPoint Templates Business Pie Chart Data Ppt Slides
Business Leadership PowerPoint Templates Business pie chart data PPT Slides-use this diagram to show your ideas all together to form the complete picture and reach the goal-Business Leadership PowerPoint Templates Business pie chart data PPT Slides-This ppt can be used for concepts relating to-Answer, Assemble, Assembly, Attention, Background, Brains, Build, Business, Challenge, Challenging, Clue, Complete, Complex, Concentration, Concept, Connect, Connection, Education, Entertainment, Finish Educate teams with our Buisness Leadership PowerPoint Templates Business Pie Chart Data Ppt Slides. Download without worries with our money back guaranteee.
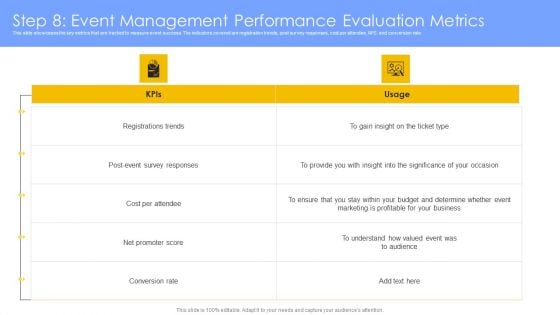
Step 8 Event Management Performance Evaluation Metrics Themes PDF
This slide showcases the key metrics that are tracked to measure event success. The indicators covered are registration trends, post survey responses, cost per attendee, NPS and conversion rate. Take your projects to the next level with our ultimate collection of Step 8 Event Management Performance Evaluation Metrics Themes PDF. Slidegeeks has designed a range of layouts that are perfect for representing task or activity duration, keeping track of all your deadlines at a glance. Tailor these designs to your exact needs and give them a truly corporate look with your own brand colors they will make your projects stand out from the rest

Comparative Analysis Of Enterprise Repository And Data Mart Diagrams PDF
The slide analyses a comparative matrix of data warehouse and data mart. The slide includes definition, usage, objective , data type , data value, size, design and approach. Showcasing this set of slides titled Comparative Analysis Of Enterprise Repository And Data Mart Diagrams PDF. The topics addressed in these templates are Parameters, Data Warehouse, Data Mart. All the content presented in this PPT design is completely editable. Download it and make adjustments in color, background, font etc. as per your unique business setting.
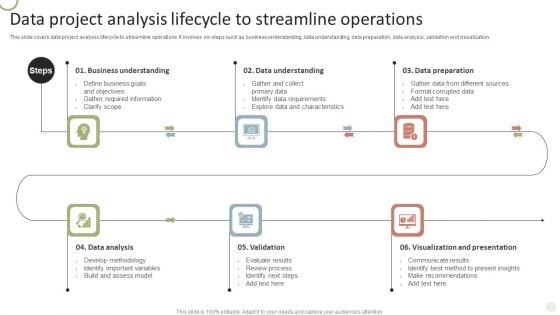
Data Project Analysis Lifecycle To Streamline Operations Diagrams PDF
This slide covers data project analysis lifecycle to streamline operations. It involves six steps such as business understanding, data understanding, data preparation, data analysis, validation and visualization.Persuade your audience using this Data Project Analysis Lifecycle To Streamline Operations Diagrams PDF. This PPT design covers six stages, thus making it a great tool to use. It also caters to a variety of topics including Business Understanding, Data Understanding, Data Preparation. Download this PPT design now to present a convincing pitch that not only emphasizes the topic but also showcases your presentation skills.
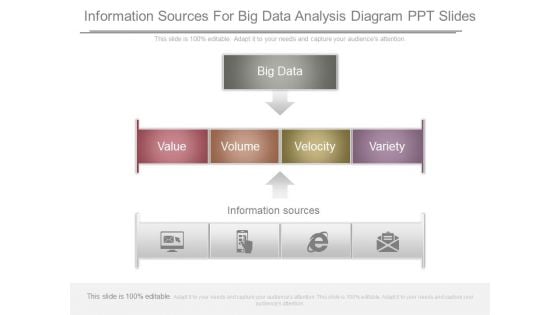
Information Sources For Big Data Analysis Diagram Ppt Slides
This is a information sources for big data analysis diagram ppt slides. This is a three stage process. The stages in this process are big data, value, volume, velocity, variety, information sources.
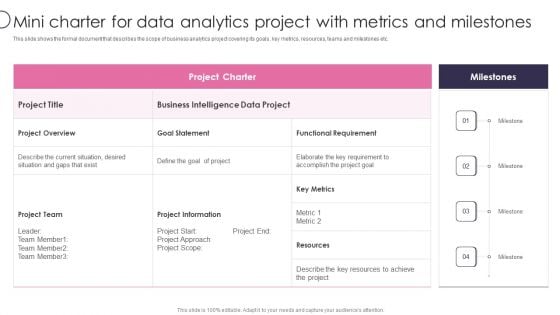
Information Transformation Process Toolkit Mini Charter For Data Analytics Project With Metrics And Milestones Themes PDF
This slide shows the formal document that describes the scope of business analytics project covering its goals, key metrics, resources, teams and milestones etc. Deliver and pitch your topic in the best possible manner with this Information Transformation Process Toolkit Mini Charter For Data Analytics Project With Metrics And Milestones Themes PDF. Use them to share invaluable insights on Project Team, Project Information, Key Metrics and impress your audience. This template can be altered and modified as per your expectations. So, grab it now.
Magnifying Glass Ppt PowerPoint Presentation Infographic Template Example File
This is a magnifying glass ppt powerpoint presentation infographic template example file. This is a two stage process. The stages in this process are magnifying glass, gears, technology, marketing, strategy, business.
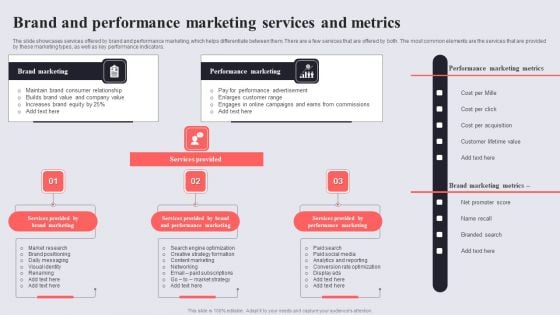
Brand And Performance Marketing Services And Metrics Themes PDF
The slide showcases services offered by brand and performance marketing, which helps differentiate between them. There are a few services that are offered by both. The most common elements are the services that are provided by these marketing types, as well as key performance indicators. Presenting Brand And Performance Marketing Services And Metrics Themes PDF to dispense important information. This template comprises three stages. It also presents valuable insights into the topics including Services Provided, Services Provided, Services Provided Performance Marketing. This is a completely customizable PowerPoint theme that can be put to use immediately. So, download it and address the topic impactfully.
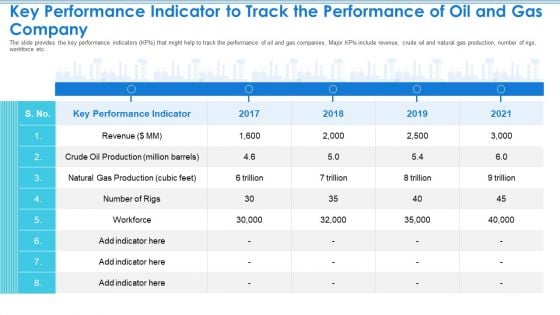
Case Competition Petroleum Sector Issues Key Performance Indicator To Track The Performance Of Oil And Gas Company Diagrams PDF
The slide provides the key performance indicators KPIs that might help to track the performance of oil and gas companies. Major KPIs include revenue, crude oil and natural gas production, number of rigs, workforce etc. Deliver and pitch your topic in the best possible manner with this case competition petroleum sector issues key performance indicator to track the performance of oil and gas company diagrams pdf. Use them to share invaluable insights on key performance indicator, revenue, 2017 to 2021 and impress your audience. This template can be altered and modified as per your expectations. So, grab it now.
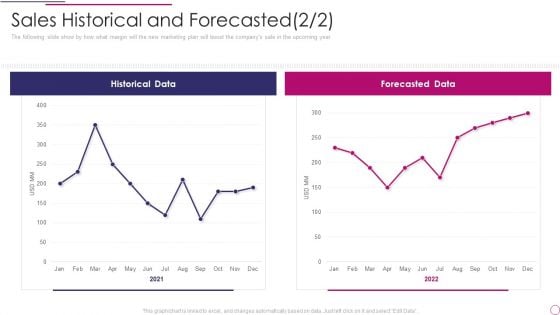
Performance Analysis Of New Product Development Sales Historical And Forecasted Data Rules PDF
The following slide show by how what margin will the new marketing plan will boost the companys sale in the upcoming year. Deliver and pitch your topic in the best possible manner with this performance analysis of new product development sales historical and forecasted data rules pdf. Use them to share invaluable insights on historical data, forecasted data and impress your audience. This template can be altered and modified as per your expectations. So, grab it now.
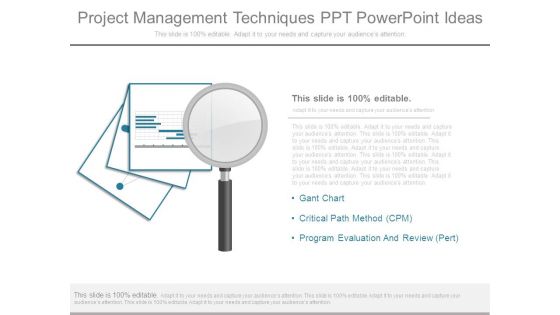
Project Management Techniques Ppt Powerpoint Ideas
This is a project management techniques ppt powerpoint ideas. This is a three stage process. The stages in this process are gant chart, critical path method cpm, program evaluation and review pert.
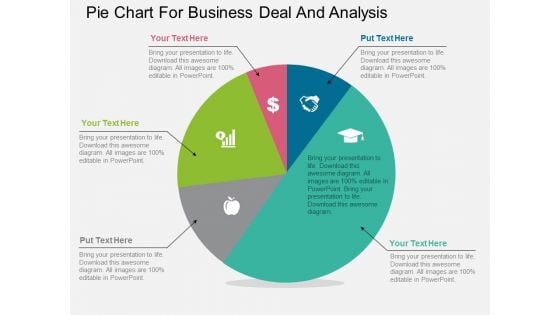
Pie Chart For Business Deal And Analysis Powerpoint Template
Our above PPT slide contains diagram of pentagon infographic. It helps to display steps of corporate marketing. Use this diagram to impart more clarity to data and to create more sound impact on viewers.
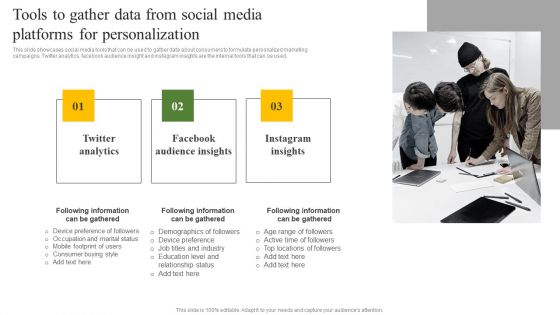
Tools To Gather Data From Social Media Platforms For Personalization Ppt Summary Microsoft PDF
This slide showcases social media tools that can be used to gather data about consumers to formulate personalized marketing campaigns. Twitter analytics, facebook audience insight and instagram insights are the internal tools that can be used. If you are looking for a format to display your unique thoughts, then the professionally designed Tools To Gather Data From Social Media Platforms For Personalization Ppt Summary Microsoft PDF is the one for you. You can use it as a Google Slides template or a PowerPoint template. Incorporate impressive visuals, symbols, images, and other charts. Modify or reorganize the text boxes as you desire. Experiment with shade schemes and font pairings. Alter, share or cooperate with other people on your work. Download Tools To Gather Data From Social Media Platforms For Personalization Ppt Summary Microsoft PDF and find out how to give a successful presentation. Present a perfect display to your team and make your presentation unforgettable.
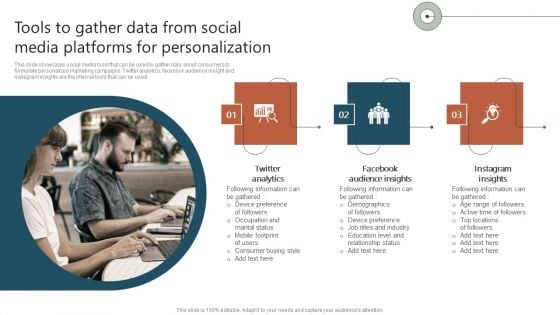
Tools To Gather Data From Social Media Platforms For Personalization Ppt Infographic Template Information PDF
This slide showcases social media tools that can be used to gather data about consumers to formulate personalized marketing campaigns. Twitter analytics, facebook audience insight and instagram insights are the internal tools that can be used. If you are looking for a format to display your unique thoughts, then the professionally designed Tools To Gather Data From Social Media Platforms For Personalization Ppt Infographic Template Information PDF is the one for you. You can use it as a Google Slides template or a PowerPoint template. Incorporate impressive visuals, symbols, images, and other charts. Modify or reorganize the text boxes as you desire. Experiment with shade schemes and font pairings. Alter, share or cooperate with other people on your work. Download Tools To Gather Data From Social Media Platforms For Personalization Ppt Infographic Template Information PDF and find out how to give a successful presentation. Present a perfect display to your team and make your presentation unforgettable.
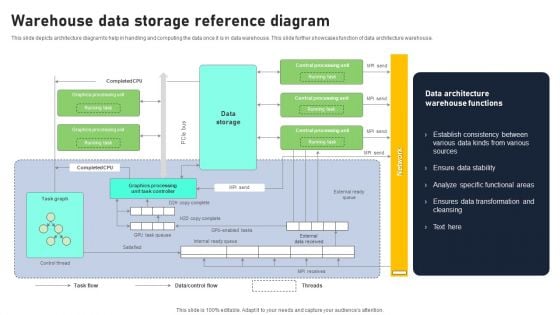
Warehouse Data Storage Reference Diagram Download PDF
This slide depicts architecture diagram to help in handling and computing the data once it is in data warehouse. This slide further showcases function of data architecture warehouse. Pitch your topic with ease and precision using this Warehouse Data Storage Reference Diagram Download PDF. This layout presents information on Ensure Data Stability, Specific Functional Areas, Data Transformation. It is also available for immediate download and adjustment. So, changes can be made in the color, design, graphics or any other component to create a unique layout.
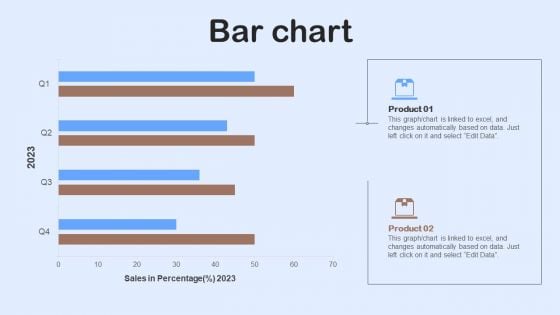
Nestle Performance Management Report Bar Chart Ppt Inspiration Shapes PDF
This graph or chart is linked to excel, and changes automatically based on data. Just left click on it and select Edit Data. Whether you have daily or monthly meetings, a brilliant presentation is necessary. Nestle Performance Management Report Bar Chart Ppt Inspiration Shapes PDF can be your best option for delivering a presentation. Represent everything in detail using Nestle Performance Management Report Bar Chart Ppt Inspiration Shapes PDF and make yourself stand out in meetings. The template is versatile and follows a structure that will cater to your requirements. All the templates prepared by Slidegeeks are easy to download and edit. Our research experts have taken care of the corporate themes as well. So, give it a try and see the results.
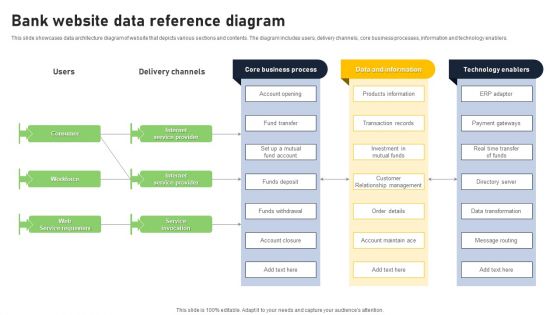
Bank Website Data Reference Diagram Mockup PDF
This slide showcases data architecture diagram of website that depicts various sections and contents. The diagram includes users, delivery channels, core business processes, information and technology enablers. Showcasing this set of slides titled Bank Website Data Reference Diagram Mockup PDF. The topics addressed in these templates are Core Business Process, Data Information, Technology Enablers. All the content presented in this PPT design is completely editable. Download it and make adjustments in color, background, font etc. as per your unique business setting.

Social Application Data Reference Diagram Introduction PDF
This slide depicts architecture diagram depicting data management. The diagram includes core and processing components, users application, core streaming and data management. Showcasing this set of slides titled Social Application Data Reference Diagram Introduction PDF. The topics addressed in these templates are Quality Assessment, Cotent Delivery, Content Enhancement. All the content presented in this PPT design is completely editable. Download it and make adjustments in color, background, font etc. as per your unique business setting.
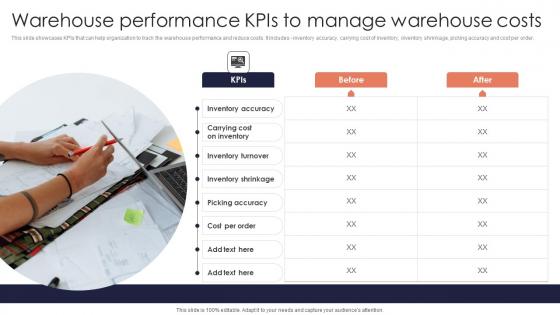
Warehouse Performance KPIs Minimizing Inventory Wastage Through Warehouse Slides Pdf
This slide showcases KPIs that can help organization to track the warehouse performance and reduce costs. It includes inventory accuracy, carrying cost of inventory, inventory shrinkage, picking accuracy and cost per order. Retrieve professionally designed Warehouse Performance KPIs Minimizing Inventory Wastage Through Warehouse Slides Pdf to effectively convey your message and captivate your listeners. Save time by selecting pre made slideshows that are appropriate for various topics, from business to educational purposes. These themes come in many different styles, from creative to corporate, and all of them are easily adjustable and can be edited quickly. Access them as PowerPoint templates or as Google Slides themes. You do not have to go on a hunt for the perfect presentation because Slidegeeks got you covered from everywhere. This slide showcases KPIs that can help organization to track the warehouse performance and reduce costs. It includes inventory accuracy, carrying cost of inventory, inventory shrinkage, picking accuracy and cost per order.
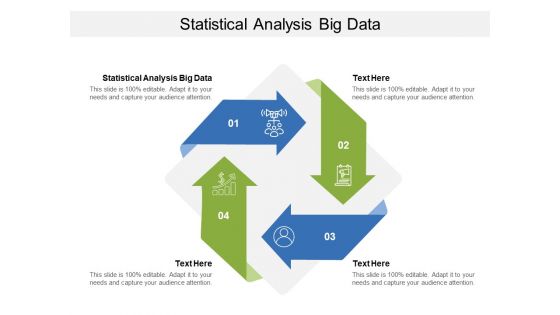
Statistical Analysis Big Data Ppt PowerPoint Presentation Ideas Diagrams Cpb
Presenting this set of slides with name statistical analysis big data ppt powerpoint presentation ideas diagrams cpb. This is an editable Powerpoint four stages graphic that deals with topics like statistical analysis big data to help convey your message better graphically. This product is a premium product available for immediate download and is 100 percent editable in Powerpoint. Download this now and use it in your presentations to impress your audience.
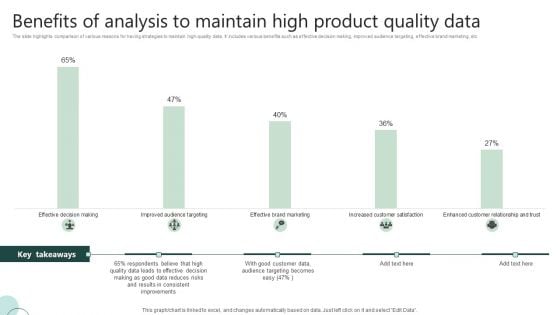
Benefits Of Analysis To Maintain High Product Quality Data Ppt Portfolio Gallery PDF
The slide highlights comparison of various reasons for having strategies to maintain high-quality data. It includes various benefits such as effective decision making, improved audience targeting, effective brand marketing, etc. Showcasing this set of slides titled Benefits Of Analysis To Maintain High Product Quality Data Ppt Portfolio Gallery PDF. The topics addressed in these templates are Effective Decision, Quality Data Leads, Good Customer Data. All the content presented in this PPT design is completely editable. Download it and make adjustments in color, background, font etc. as per your unique business setting.
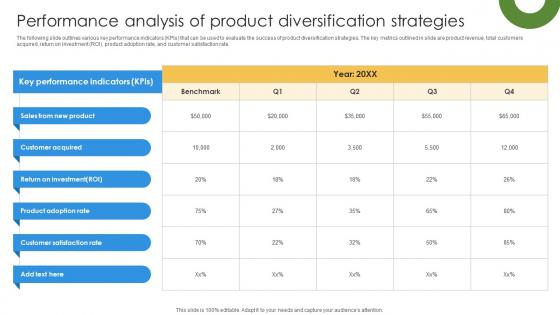
Marketing Growth Strategy To Strengthen Performance Analysis Of Product Strategy SS V
The following slide outlines various key performance indicators KPIs that can be used to evaluate the success of product diversification strategies. The key metrics outlined in slide are product revenue, total customers acquired, return on investment ROI, product adoption rate, and customer satisfaction rate. If you are looking for a format to display your unique thoughts, then the professionally designed Marketing Growth Strategy To Strengthen Performance Analysis Of Product Strategy SS V is the one for you. You can use it as a Google Slides template or a PowerPoint template. Incorporate impressive visuals, symbols, images, and other charts. Modify or reorganize the text boxes as you desire. Experiment with shade schemes and font pairings. Alter, share or cooperate with other people on your work. Download Marketing Growth Strategy To Strengthen Performance Analysis Of Product Strategy SS V and find out how to give a successful presentation. Present a perfect display to your team and make your presentation unforgettable. The following slide outlines various key performance indicators KPIs that can be used to evaluate the success of product diversification strategies. The key metrics outlined in slide are product revenue, total customers acquired, return on investment ROI, product adoption rate, and customer satisfaction rate.
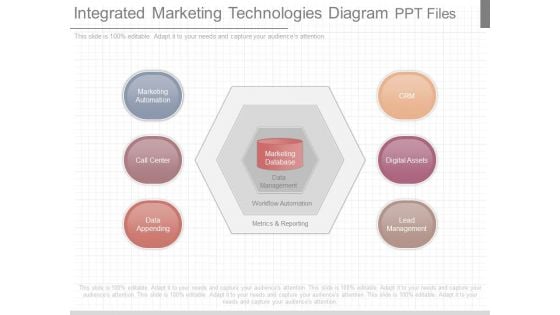
Integrated Marketing Technologies Diagram Ppt Files
This is a integrated marketing technologies diagram ppt files. This is a six stage process. The stages in this process are crm, digital assets, lead management, marketing, automation, call center, data appending, marketing database, data management, workflow automation, metrics and reporting.
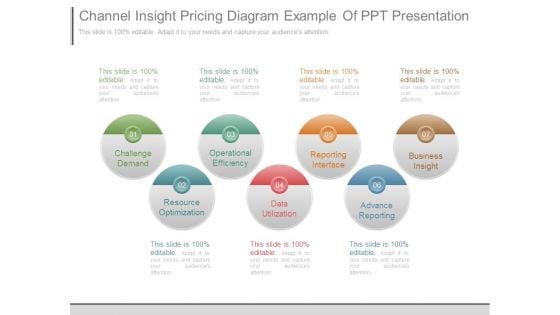
Channel Insight Pricing Diagram Example Of Ppt Presentation
This is a channel insight pricing diagram example of ppt presentation. This is a seven stage process. The stages in this process are challenge demand, operational efficiency, reporting interface, business insight, resource optimization, data utilization, advance reporting.
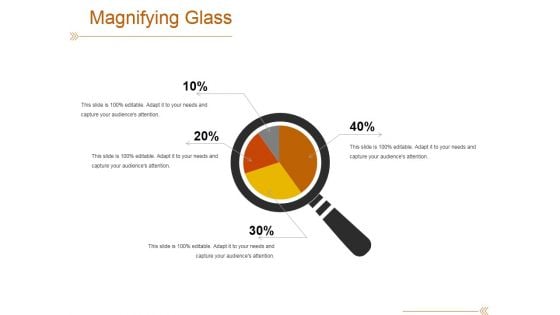
Magnifying Glass Ppt PowerPoint Presentation Outline Graphics Design
This is a magnifying glass ppt powerpoint presentation outline graphics design. This is a four stage process. The stages in this process are magnifier glass, research, business, marketing.

Product Analytics Implementation For Enhanced Business Insights Data Analytics V
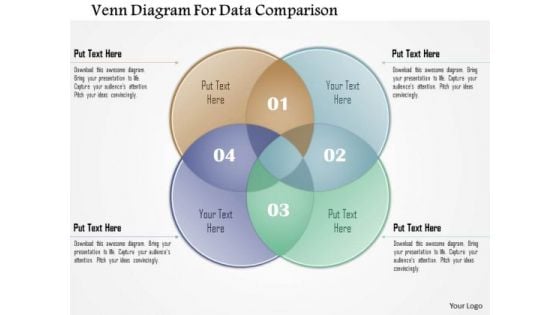
Business Diagram Venn Diagram For Data Comparison Presentation Template
Our above diagram displays venn diagrams that helps to display the interrelation of concepts by placing interrelated words in overlapping circles. This diagram helps you to communicate information visually.
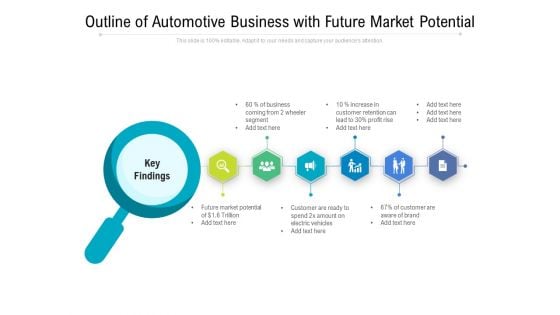
Outline Of Automotive Business With Future Market Potential Ppt PowerPoint Presentation Gallery Inspiration PDF
Presenting outline of automotive business with future market potential ppt powerpoint presentation gallery inspiration pdf to dispense important information. This template comprises six stages. It also presents valuable insights into the topics including business coming from 2 wheeler segment, increase in customer retention can lead, profit rise, future market potential, customer, customer aware brand. This is a completely customizable PowerPoint theme that can be put to use immediately. So, download it and address the topic impactfully.
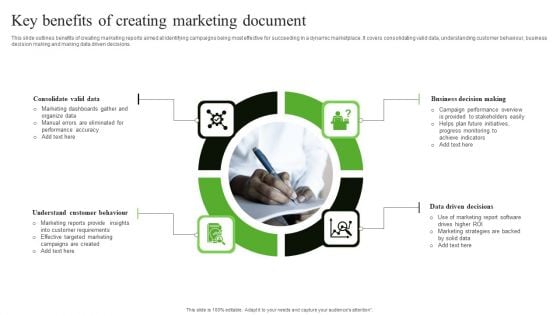
Key Benefits Of Creating Marketing Document Infographics PDF
This slide outlines benefits of creating marketing reports aimed at identifying campaigns being most effective for succeeding in a dynamic marketplace. It covers consolidating valid data, understanding customer behaviour, business decision making and making data driven decisions. Presenting Key Benefits Of Creating Marketing Document Infographics PDF to dispense important information. This template comprises four stages. It also presents valuable insights into the topics including Consolidate Valid Data, Understand Customer Behaviour, Business Decision Making. This is a completely customizable PowerPoint theme that can be put to use immediately. So, download it and address the topic impactfully.
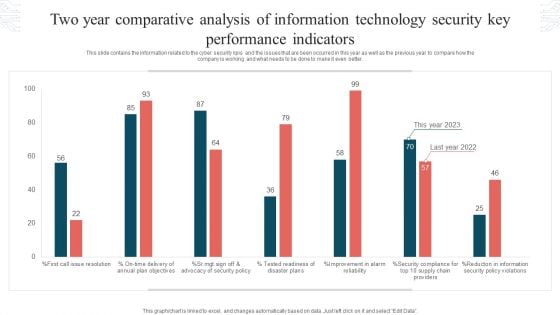
Two Year Comparative Analysis Of Information Technology Security Key Performance Indicators Graphics PDF
This slide contains the information related to the cyber security kpis and the issues that are been occurred in this year as well as the previous year to compare how the company is working and what needs to be done to make it even better. Showcasing this set of slides titled Two Year Comparative Analysis Of Information Technology Security Key Performance Indicators Graphics PDF. The topics addressed in these templates are Tested Readiness, Disaster Plans, Security Policy Violations. All the content presented in this PPT design is completely editable. Download it and make adjustments in color, background, font etc. as per your unique business setting.
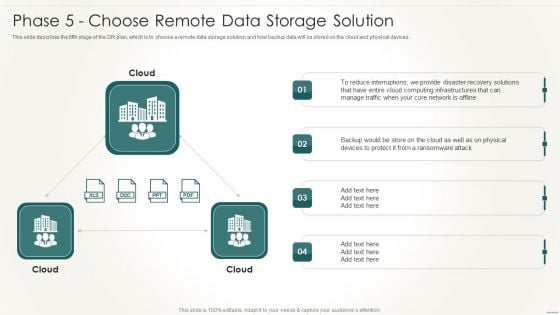
Information Technology Disaster Resilience Plan Phase 5 Choose Remote Data Storage Solution Slides PDF
This slide describes the fifth stage of the DR plan, which is to choose a remote data storage solution and how backup data will be stored on the cloud and physical devices.Deliver an awe inspiring pitch with this creative Information Technology Disaster Resilience Plan Phase 5 Choose Remote Data Storage Solution Slides PDF bundle. Topics like Reduce Interruptions, Computing Infrastructures, Ransomware Attack can be discussed with this completely editable template. It is available for immediate download depending on the needs and requirements of the user.
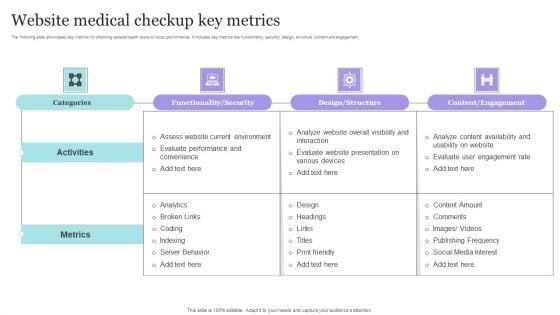
Website Medical Checkup Key Metrics Themes PDF
The following slide showcases key metrics for checking website health score to boost performance. It includes key metrics like functionality, security, design, structure, content and engagement. Pitch your topic with ease and precision using this Website Medical Checkup Key Metrics Themes PDF. This layout presents information on Evaluate Performance, Environment, Metrics. It is also available for immediate download and adjustment. So, changes can be made in the color, design, graphics or any other component to create a unique layout.
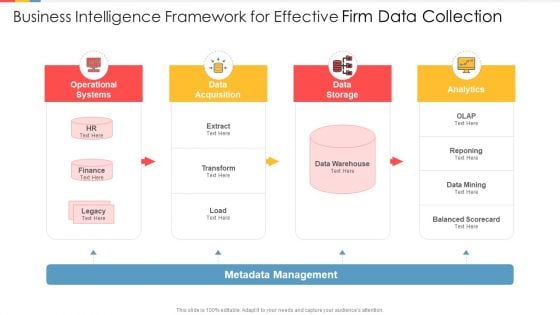
Business Intelligence Framework For Effective Firm Data Collection Ideas PDF
Presenting business intelligence framework for effective firm data collection ideas pdf to dispense important information. This template comprises four stages. It also presents valuable insights into the topics including operational systems, data acquisition, data storage, analytics. This is a completely customizable PowerPoint theme that can be put to use immediately. So, download it and address the topic impactfully.
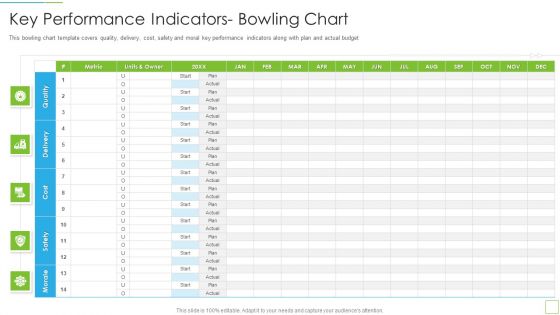
Hoshin Kanri Pitch Deck Key Performance Indicators Bowling Chart Introduction PDF
This bowling chart template covers quality, delivery, cost, safety and moral key performance indicators along with plan and actual budget Deliver an awe inspiring pitch with this creative hoshin kanri pitch deck key performance indicators bowling chart introduction pdf bundle. Topics like key performance indicators bowling chart can be discussed with this completely editable template. It is available for immediate download depending on the needs and requirements of the user.
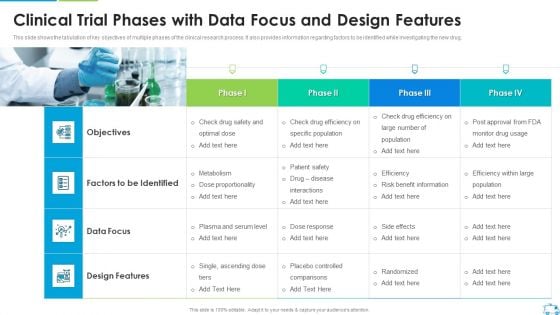
Clinical Trial Phases With Data Focus And Design Features Introduction PDF
This slide shows the tabulation of key objectives of multiple phases of the clinical research process. It also provides information regarding factors to be identified while investigating the new drug.Deliver and pitch your topic in the best possible manner with this Clinical Trial Phases With Data Focus And Design Features Introduction PDF Use them to share invaluable insights on Specific Population, Factors To Be Identified, Design Features and impress your audience. This template can be altered and modified as per your expectations. So, grab it now.
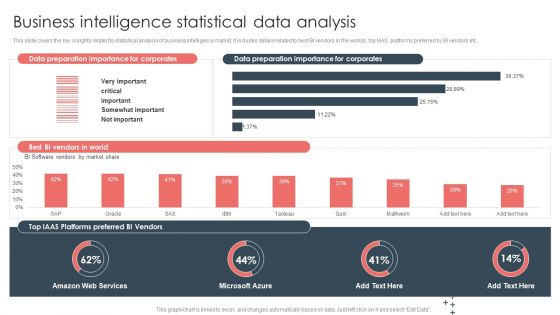
Overview Of BI For Enhanced Decision Making Business Intelligence Statistical Data Analysis Guidelines PDF
This slide covers the key insights related to statistical analysis of business intelligence market. It includes details related to best BI vendors in the worlds, top IAAS platforms preferred by BI vendors etc. There are so many reasons you need a Overview Of BI For Enhanced Decision Making Business Intelligence Statistical Data Analysis Guidelines PDF. The first reason is you cannot spend time making everything from scratch, Thus, Slidegeeks has made presentation templates for you too. You can easily download these templates from our website easily.
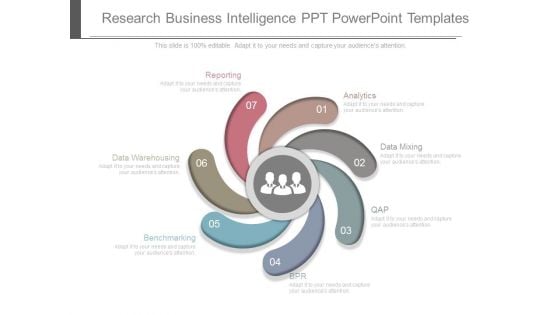
Research Business Intelligence Ppt Powerpoint Templates
This is a research business intelligence ppt powerpoint templates. This is a seven stage process. The stages in this process are data warehousing, reporting, analytics, datamining, qap, epr, benchmarking.
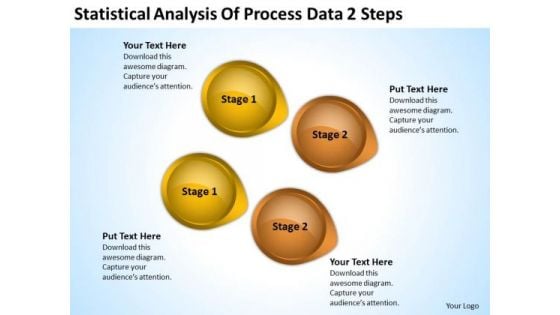
Power Point Arrows Statistical Analysis Of Process Data 2 Steps PowerPoint Templates
We present our power point arrows statistical analysis of process data 2 steps PowerPoint templates.Download and present our Business PowerPoint Templates because It is Aesthetically crafted by artistic young minds. Our PowerPoint Templates and Slides are designed to display your dexterity. Present our Arrows PowerPoint Templates because You can Rise to the occasion with our PowerPoint Templates and Slides. You will bring your audience on their feet in no time. Download and present our Circle Charts PowerPoint Templates because Our PowerPoint Templates and Slides help you pinpoint your timelines. Highlight the reasons for your deadlines with their use. Present our Shapes PowerPoint Templates because You aspire to touch the sky with glory. Let our PowerPoint Templates and Slides provide the fuel for your ascent. Present our Symbol PowerPoint Templates because You have gained great respect for your brilliant ideas. Use our PowerPoint Templates and Slides to strengthen and enhance your reputation.Use these PowerPoint slides for presentations relating to abstract, arrow, art, background, banner, blue, bright, business, circle, color, colorful, concept, conceptual, connection, creative, cycle, design, different, element, empty, flower, form, frame, graphic, green, group, idea, illustration, match, message, order, part, petal, piece, place, red, ring, shape, solution, special, speech, strategy, symbol, template, text, usable, vector, web, website. The prominent colors used in the PowerPoint template are Yellow, Brown, Black. People tell us our power point arrows statistical analysis of process data 2 steps PowerPoint templates will impress their bosses and teams. People tell us our circle PowerPoint templates and PPT Slides are designed by professionals Presenters tell us our power point arrows statistical analysis of process data 2 steps PowerPoint templates are second to none. We assure you our banner PowerPoint templates and PPT Slides will make the presenter successul in his career/life. Presenters tell us our power point arrows statistical analysis of process data 2 steps PowerPoint templates will help you be quick off the draw. Just enter your specific text and see your points hit home. Professionals tell us our background PowerPoint templates and PPT Slides will make the presenter look like a pro even if they are not computer savvy. File it down with our Power Point Arrows Statistical Analysis Of Process Data 2 Steps PowerPoint Templates. Get your thoughts into the shape you desire.
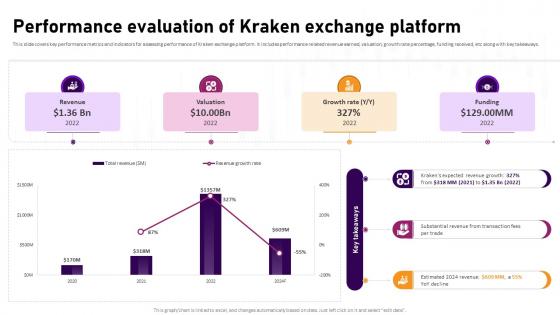
Performance Evaluation Of Kraken Exchange Platform Complete Roadmap To Blockchain BCT SS V
This slide covers key performance metrics and indicators for assessing performance of Kraken exchange platform. It includes performance related revenue earned, valuation, growth rate percentage, funding received, etc along with key takeaways. Find highly impressive Performance Evaluation Of Kraken Exchange Platform Complete Roadmap To Blockchain BCT SS V on Slidegeeks to deliver a meaningful presentation. You can save an ample amount of time using these presentation templates. No need to worry to prepare everything from scratch because Slidegeeks experts have already done a huge research and work for you. You need to download Performance Evaluation Of Kraken Exchange Platform Complete Roadmap To Blockchain BCT SS V for your upcoming presentation. All the presentation templates are 100 percent editable and you can change the color and personalize the content accordingly. Download now This slide covers key performance metrics and indicators for assessing performance of Kraken exchange platform. It includes performance related revenue earned, valuation, growth rate percentage, funding received, etc along with key takeaways.
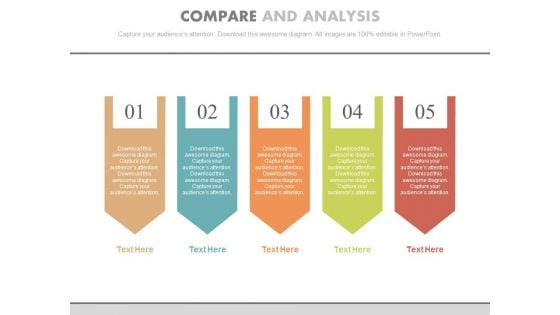
Five Steps For Data Compare And Analysis Powerpoint Template
Our above slide contains graphics of five steps chart. This PowerPoint template is useful for data compare and analysis. Use this diagram to impart more clarity to subject and to create more sound impact on viewers.
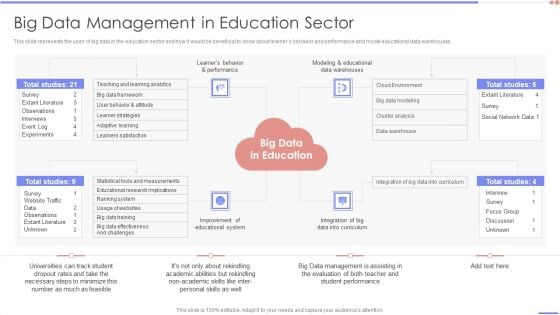
Data Analytics Management Big Data Management In Education Sector Diagrams PDF
This slide represents the uses of big data in the education sector and how it would be beneficial to know about learners behavior and performance and model educational data warehouses.This is a Data Analytics Management Big Data Management In Education Sector Diagrams PDF template with various stages. Focus and dispense information on four stages using this creative set, that comes with editable features. It contains large content boxes to add your information on topics like Extant Literature, Observations, Experiments . You can also showcase facts, figures, and other relevant content using this PPT layout. Grab it now.
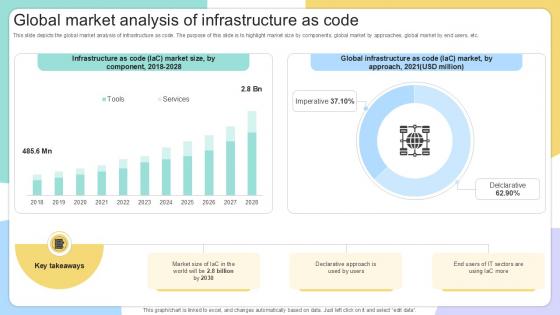
Global Market Analysis Of Infrastructure IAC Tools For Performance Analysis PPT Presentation
This slide depicts the global market analysis of infrastructure as code. The purpose of this slide is to highlight market size by components, global market by approaches, global market by end users, etc. The Global Market Analysis Of Infrastructure IAC Tools For Performance Analysis PPT Presentation is a compilation of the most recent design trends as a series of slides. It is suitable for any subject or industry presentation, containing attractive visuals and photo spots for businesses to clearly express their messages. This template contains a variety of slides for the user to input data, such as structures to contrast two elements, bullet points, and slides for written information. Slidegeeks is prepared to create an impression. This slide depicts the global market analysis of infrastructure as code. The purpose of this slide is to highlight market size by components, global market by approaches, global market by end users, etc.
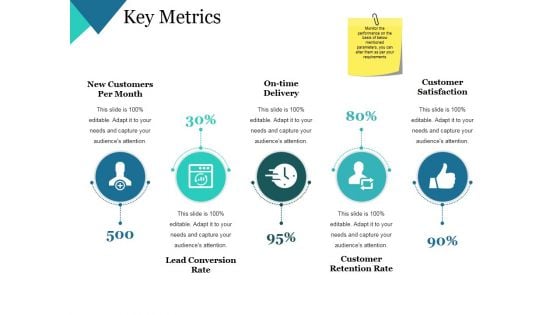
Key Metrics Ppt PowerPoint Presentation Themes
This is a key metrics ppt powerpoint presentation themes. This is a five stage process. The stages in this process are new customers per month, on time delivery, customer satisfaction, customer retention rate, lead conversion rate.
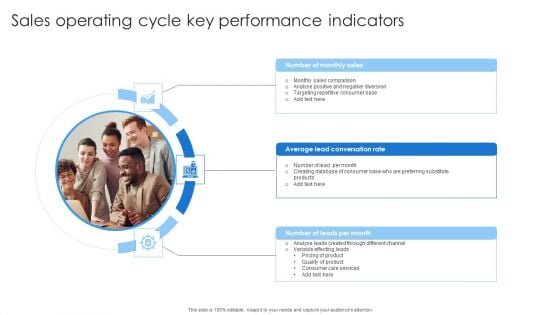
Sales Operating Cycle Key Performance Indicators Professional PDF
Presenting Sales Operating Cycle Key Performance Indicators Professional PDF to dispense important information. This template comprises three stages. It also presents valuable insights into the topics including Sales Comparison, Lead Conversation, Quality Product. This is a completely customizable PowerPoint theme that can be put to use immediately. So, download it and address the topic impactfully.
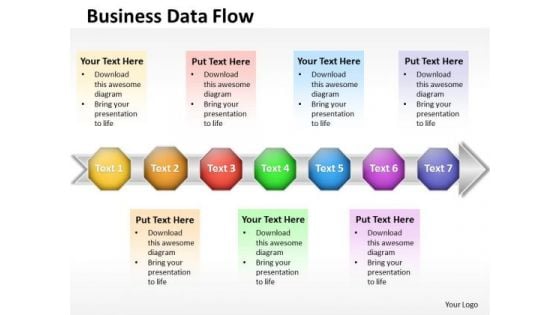
Ppt 7 Stages Self Concept PowerPoint Presentation Download Data Flow Diagram Templates
PPT 7 stages self concept powerpoint presentation download data flow diagram Templates-Use this 3D PowerPoint Diagram to describe seven stages of Linear Process through text boxes on Arrow. PowerPoint text boxes diagram templates are designed to help you place your text in a professional layout.-PPT 7 stages self concept powerpoint presentation download data flow diagram Templates-Achievement, Actualization, Basic, Belonging, Blue, Chart, Confidence, Diagram, Elements, Essential, Fundamental, Glossy, Goals, Gradient, Health, Hierarchical, Hierarchy, Human, Illustration, Isolated, Layer, Level, Love, Morality, Motivation, Needs, Person, Psychological, Psychology, Pyramid Inform teams with our Ppt 7 Stages Self Concept PowerPoint Presentation Download Data Flow Diagram Templates. Download without worries with our money back guaranteee.
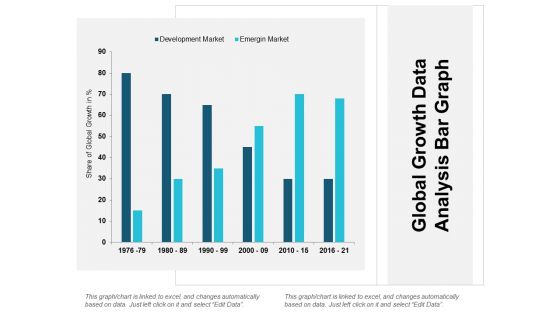
Global Growth Data Analysis Bar Graph Ppt Powerpoint Presentation Infographic Template Outfit
This is a global growth data analysis bar graph ppt powerpoint presentation infographic template outfit. The topics discussed in this diagram are market growth, market opportunity, market profitability. This is a completely editable PowerPoint presentation, and is available for immediate download.
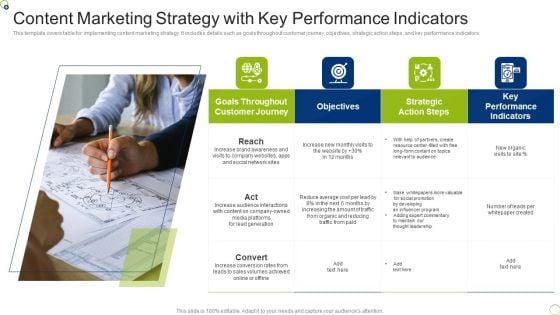
Content Marketing Strategy With Key Performance Indicators Microsoft PDF
This template covers table for implementing content marketing strategy. It includes details such as goals throughout customer journey, objectives, strategic action steps, and key performance indicators. Presenting Content Marketing Strategy With Key Performance Indicators Microsoft PDF to dispense important information. This template comprises four stages. It also presents valuable insights into the topics including Resource, Strategic, Cost. This is a completely customizable PowerPoint theme that can be put to use immediately. So, download it and address the topic impactfully.
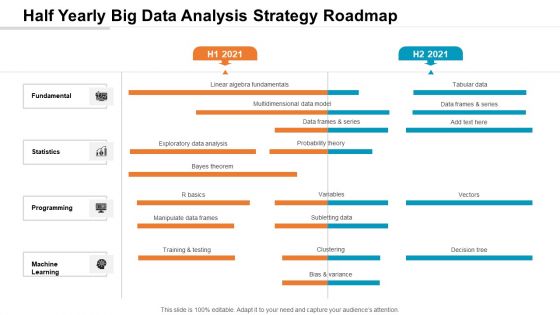
Half Yearly Big Data Analysis Strategy Roadmap Infographics
We present our half yearly big data analysis strategy roadmap infographics. This PowerPoint layout is easy-to-edit so you can change the font size, font type, color, and shape conveniently. In addition to this, the PowerPoint layout is Google Slides compatible, so you can share it with your audience and give them access to edit it. Therefore, download and save this well-researched half yearly big data analysis strategy roadmap infographics in different formats like PDF, PNG, and JPG to smoothly execute your business plan.
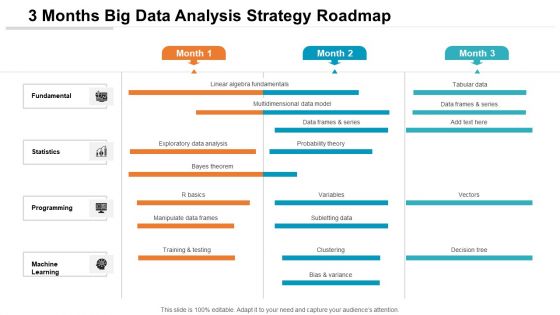
3 Months Big Data Analysis Strategy Roadmap Sample
We present our 3 months big data analysis strategy roadmap sample. This PowerPoint layout is easy-to-edit so you can change the font size, font type, color, and shape conveniently. In addition to this, the PowerPoint layout is Google Slides compatible, so you can share it with your audience and give them access to edit it. Therefore, download and save this well-researched 3 months big data analysis strategy roadmap sample in different formats like PDF, PNG, and JPG to smoothly execute your business plan.
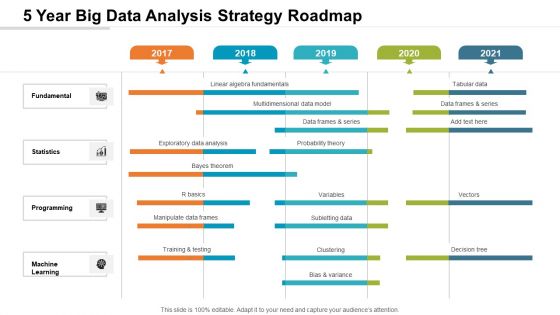
5 Year Big Data Analysis Strategy Roadmap Brochure
We present our 5 year big data analysis strategy roadmap brochure. This PowerPoint layout is easy-to-edit so you can change the font size, font type, color, and shape conveniently. In addition to this, the PowerPoint layout is Google Slides compatible, so you can share it with your audience and give them access to edit it. Therefore, download and save this well-researched 5 year big data analysis strategy roadmap brochure in different formats like PDF, PNG, and JPG to smoothly execute your business plan.
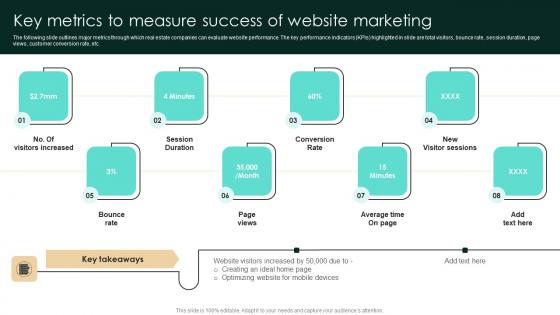
Key Metrics To Measure Success Of Website Marketing Strategic Real Estate Themes Pdf
The following slide outlines major metrics through which real estate companies can evaluate website performance. The key performance indicators KPIs highlighted in slide are total visitors, bounce rate, session duration, page views, customer conversion rate, etc. Presenting this PowerPoint presentation, titled Key Metrics To Measure Success Of Website Marketing Strategic Real Estate Themes Pdf with topics curated by our researchers after extensive research. This editable presentation is available for immediate download and provides attractive features when used. Download now and captivate your audience. Presenting this Key Metrics To Measure Success Of Website Marketing Strategic Real Estate Themes Pdf Our researchers have carefully researched and created these slides with all aspects taken into consideration. This is a completely customizable Key Metrics To Measure Success Of Website Marketing Strategic Real Estate Themes Pdf that is available for immediate downloading. Download now and make an impact on your audience. Highlight the attractive features available with our PPTs. The following slide outlines major metrics through which real estate companies can evaluate website performance. The key performance indicators KPIs highlighted in slide are total visitors, bounce rate, session duration, page views, customer conversion rate, etc.
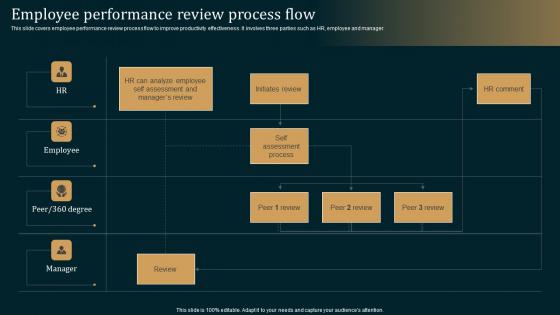
Employee Performance Review Employee Performance Improvement Strategies Infographics Pdf
This slide covers employee performance review process flow to improve productivity effectiveness. It involves three parties such as HR, employee and manager. If your project calls for a presentation, then Slidegeeks is your go to partner because we have professionally designed, easy to edit templates that are perfect for any presentation. After downloading, you can easily edit Employee Performance Review Employee Performance Improvement Strategies Infographics Pdf and make the changes accordingly. You can rearrange slides or fill them with different images. Check out all the handy templates This slide covers employee performance review process flow to improve productivity effectiveness. It involves three parties such as HR, employee and manager.
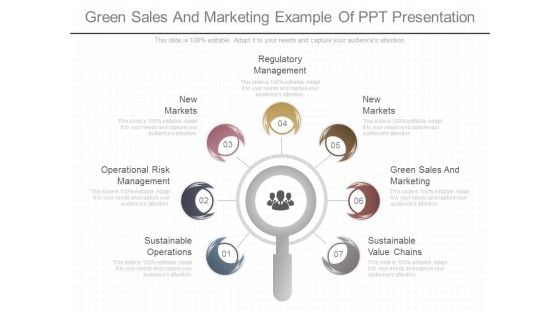
Green Sales And Marketing Example Of Ppt Presentation
This is a green sales and marketing example of ppt presentation. This is a seven stage process. The stages in this process are sustainable operations, operational risk management, markets new, regulatory management, markets markets new, green sales and marketing, sustainable value chains.
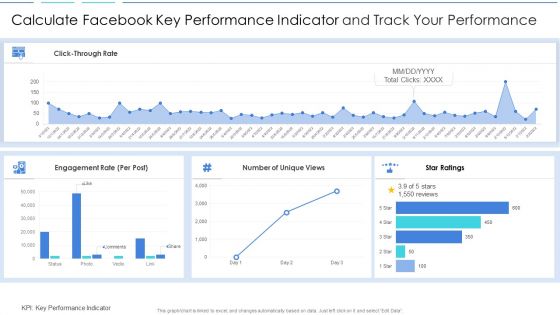
Calculate Facebook Key Performance Indicator And Track Your Performance Information PDF
Showcasing this set of slides titled calculate facebook key performance indicator and track your performance information pdf. The topics addressed in these templates are calculate facebook key performance indicator and track your performance. All the content presented in this PPT design is completely editable. Download it and make adjustments in color, background, font etc. as per your unique business setting.
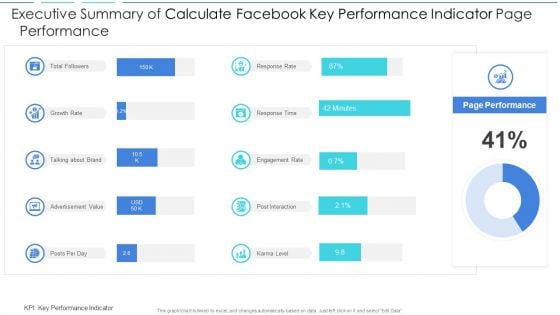
Executive Summary Of Calculate Facebook Key Performance Indicator Page Performance Download PDF
Showcasing this set of slides titled executive summary of calculate facebook key performance indicator page performance download pdf. The topics addressed in these templates are executive summary of calculate facebook key performance indicator page performance. All the content presented in this PPT design is completely editable. Download it and make adjustments in color, background, font etc. as per your unique business setting.
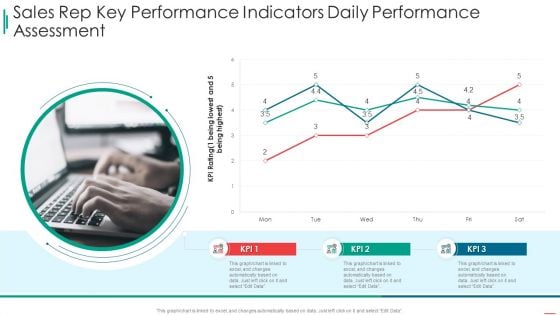
Sales Rep Scorecard Sales Rep Key Performance Indicators Daily Performance Assessment Sample PDF
Deliver and pitch your topic in the best possible manner with this sales rep scorecard sales rep key performance indicators daily performance assessment sample pdf. Use them to share invaluable insights on sales rep key performance indicators daily performance assessment and impress your audience. This template can be altered and modified as per your expectations. So, grab it now.
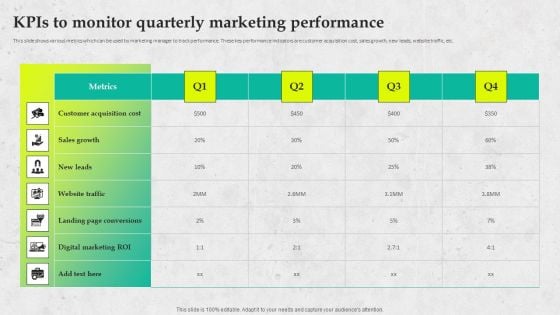
Service Promotion Plan Kpis To Monitor Quarterly Marketing Performance Diagrams PDF
This slide shows various metrics which can be used by marketing manager to track performance. These key performance indicators are customer acquisition cost, sales growth, new leads, website traffic, etc. Make sure to capture your audiences attention in your business displays with our gratis customizable Service Promotion Plan Kpis To Monitor Quarterly Marketing Performance Diagrams PDF. These are great for business strategies, office conferences, capital raising or task suggestions. If you desire to acquire more customers for your tech business and ensure they stay satisfied, create your own sales presentation with these plain slides.
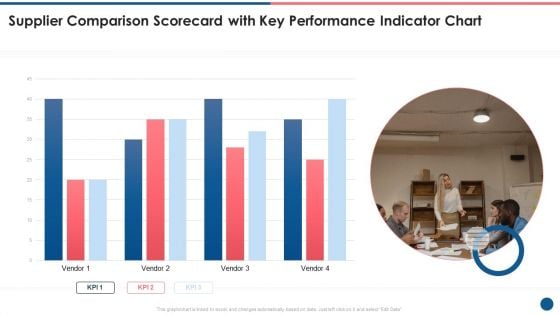
Supplier Scorecard Supplier Comparison Scorecard With Key Performance Indicator Chart Formats PDF
This is a supplier scorecard supplier comparison scorecard with key performance indicator chart formats pdf template with various stages. Focus and dispense information on one stages using this creative set, that comes with editable features. It contains large content boxes to add your information on topics like supplier comparison scorecard, key performance, indicator chart. You can also showcase facts, figures, and other relevant content using this PPT layout. Grab it now.
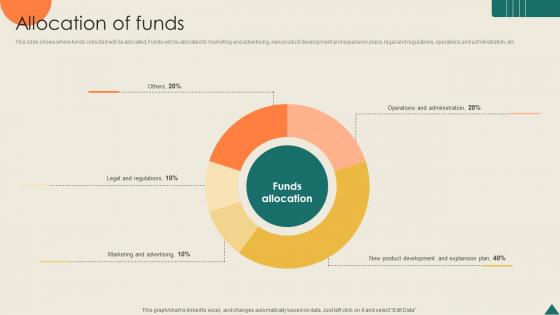
Allocation Of Funds Financial Analytics Platform Investor Elevator Pitch Deck
This slide shows where funds collected will be allocated. Funds will be allocated to marketing and advertising, new product development and expansion plans, legal and regulations, operations and administration, etc. The Allocation Of Funds Financial Analytics Platform Investor Elevator Pitch Deck is a compilation of the most recent design trends as a series of slides. It is suitable for any subject or industry presentation, containing attractive visuals and photo spots for businesses to clearly express their messages. This template contains a variety of slides for the user to input data, such as structures to contrast two elements, bullet points, and slides for written information. Slidegeeks is prepared to create an impression. This slide shows where funds collected will be allocated. Funds will be allocated to marketing and advertising, new product development and expansion plans, legal and regulations, operations and administration, etc.
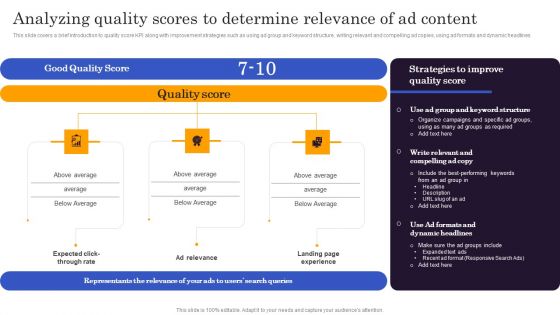
Marketers Guide To Data Analysis Optimization Analyzing Quality Scores To Determine Relevance Of Ad Content Diagrams PDF
This slide covers a brief introduction to quality score KPI along with improvement strategies such as using ad group and keyword structure, writing relevant and compelling ad copies, using ad formats and dynamic headlines. If you are looking for a format to display your unique thoughts, then the professionally designed Marketers Guide To Data Analysis Optimization Analyzing Quality Scores To Determine Relevance Of Ad Content Diagrams PDF is the one for you. You can use it as a Google Slides template or a PowerPoint template. Incorporate impressive visuals, symbols, images, and other charts. Modify or reorganize the text boxes as you desire. Experiment with shade schemes and font pairings. Alter, share or cooperate with other people on your work. Download Marketers Guide To Data Analysis Optimization Analyzing Quality Scores To Determine Relevance Of Ad Content Diagrams PDF and find out how to give a successful presentation. Present a perfect display to your team and make your presentation unforgettable.
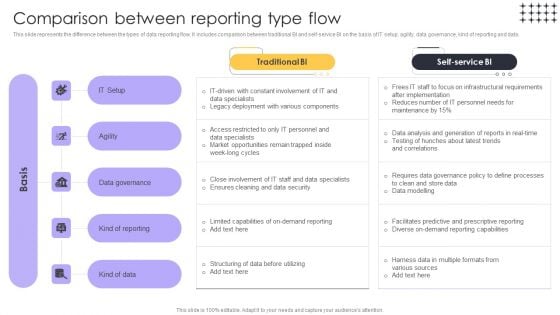
Tools For HR Business Analytics Comparison Between Reporting Type Flow Inspiration PDF
This slide represents the difference between the types of data reporting flow. It includes comparison between traditional BI and self-service BI on the basis of IT setup, agility, data governance, kind of reporting and data. If you are looking for a format to display your unique thoughts, then the professionally designed Tools For HR Business Analytics Comparison Between Reporting Type Flow Inspiration PDF is the one for you. You can use it as a Google Slides template or a PowerPoint template. Incorporate impressive visuals, symbols, images, and other charts. Modify or reorganize the text boxes as you desire. Experiment with shade schemes and font pairings. Alter, share or cooperate with other people on your work. Download Tools For HR Business Analytics Comparison Between Reporting Type Flow Inspiration PDF and find out how to give a successful presentation. Present a perfect display to your team and make your presentation unforgettable.
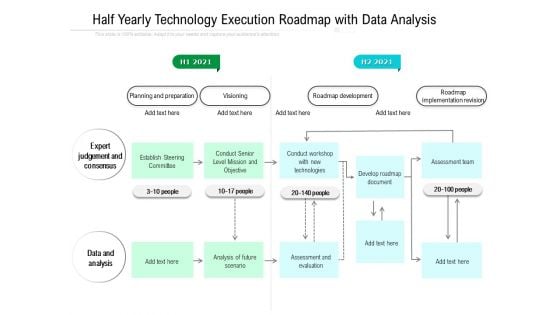
Half Yearly Technology Execution Roadmap With Data Analysis Mockup Elements
We present our half yearly technology execution roadmap with data analysis mockup elements. This PowerPoint layout is easy-to-edit so you can change the font size, font type, color, and shape conveniently. In addition to this, the PowerPoint layout is Google Slides compatible, so you can share it with your audience and give them access to edit it. Therefore, download and save this well-researched half yearly technology execution roadmap with data analysis mockup elements in different formats like PDF, PNG, and JPG to smoothly execute your business plan.
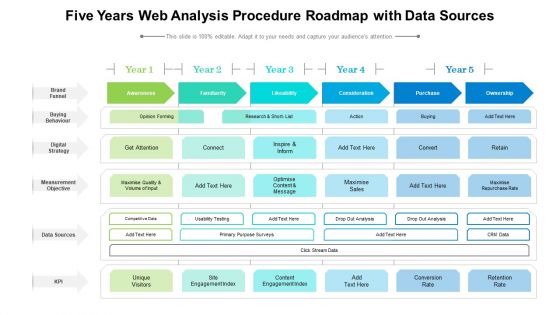
Five Years Web Analysis Procedure Roadmap With Data Designs
We present our five years web analysis procedure roadmap with data designs. This PowerPoint layout is easy to edit so you can change the font size, font type, color, and shape conveniently. In addition to this, the PowerPoint layout is Google Slides compatible, so you can share it with your audience and give them access to edit it. Therefore, download and save this well researched five years web analysis procedure roadmap with data designs in different formats like PDF, PNG, and JPG to smoothly execute your business plan.
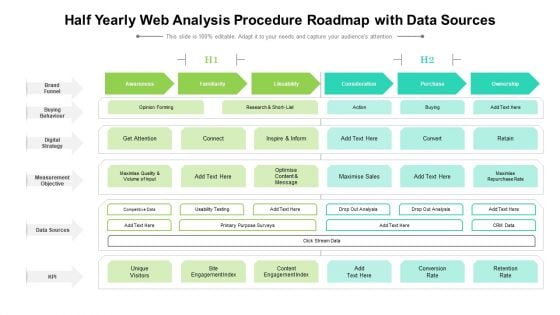
Half Yearly Web Analysis Procedure Roadmap With Data Sources Elements
We present our half yearly web analysis procedure roadmap with data sources elements. This PowerPoint layout is easy to edit so you can change the font size, font type, color, and shape conveniently. In addition to this, the PowerPoint layout is Google Slides compatible, so you can share it with your audience and give them access to edit it. Therefore, download and save this well researched half yearly web analysis procedure roadmap with data sources elements in different formats like PDF, PNG, and JPG to smoothly execute your business plan.
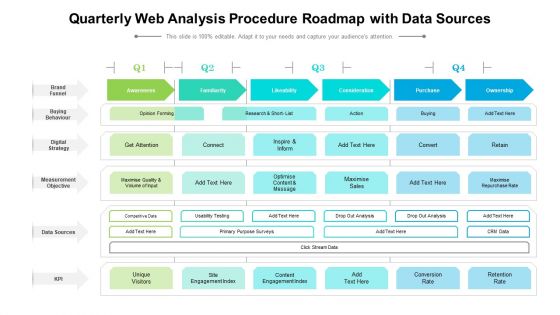
Quarterly Web Analysis Procedure Roadmap With Data Sources Guidelines
We present our quarterly web analysis procedure roadmap with data sources guidelines. This PowerPoint layout is easy to edit so you can change the font size, font type, color, and shape conveniently. In addition to this, the PowerPoint layout is Google Slides compatible, so you can share it with your audience and give them access to edit it. Therefore, download and save this well researched quarterly web analysis procedure roadmap with data sources guidelines in different formats like PDF, PNG, and JPG to smoothly execute your business plan.
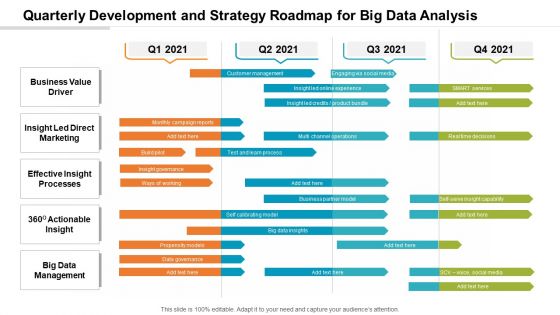
Quarterly Development And Strategy Roadmap For Big Data Analysis Designs
We present our quarterly development and strategy roadmap for big data analysis designs. This PowerPoint layout is easy-to-edit so you can change the font size, font type, color, and shape conveniently. In addition to this, the PowerPoint layout is Google Slides compatible, so you can share it with your audience and give them access to edit it. Therefore, download and save this well-researched quarterly development and strategy roadmap for big data analysis designs in different formats like PDF, PNG, and JPG to smoothly execute your business plan.
Phase Endpoint Report Of New Drug In Clinical Trial Medical Research Phases For Clinical Tests Designs PDF
The Phase Endpoint Report Of New Drug In Clinical Trial Medical Research Phases For Clinical Tests Designs PDF is a compilation of the most recent design trends as a series of slides. It is suitable for any subject or industry presentation, containing attractive visuals and photo spots for businesses to clearly express their messages. This template contains a variety of slides for the user to input data, such as structures to contrast two elements, bullet points, and slides for written information. Slidegeeks is prepared to create an impression.
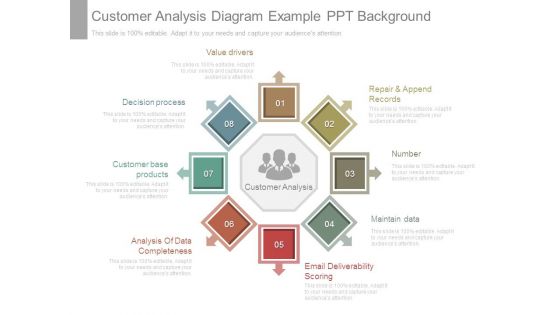
Customer Analysis Diagram Example Ppt Background
This is a customer analysis diagram example ppt background. This is a eight stage process. The stages in this process are repair and append records, number, maintain data, email deliverability scoring, analysis of data completeness, customer base products, decision process, value drivers, customer analysis.
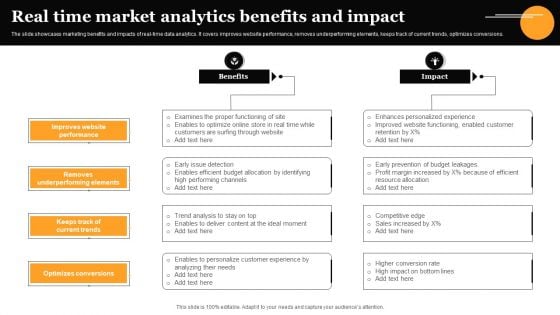
Real Time Market Analytics Benefits And Impact Infographics PDF
The slide showcases marketing benefits and impacts of real-time data analytics. It covers improves website performance, removes underperforming elements, keeps track of current trends, optimizes conversions. Presenting Real Time Market Analytics Benefits And Impact Infographics PDF to dispense important information. This template comprises four stages. It also presents valuable insights into the topics including Improves Website Performance, Removes Underperforming Elements, Optimizes Conversions. This is a completely customizable PowerPoint theme that can be put to use immediately. So, download it and address the topic impactfully.

Introducing CRM Framework Within Organization CRM Data Analysis Period Ppt Ideas Themes PDF
Presenting this set of slides with name introducing crm framework within organization crm data analysis period ppt ideas themes pdf. The topics discussed in these slides are entities by rep, completed activities, biz notes month, phone calls last 3 months, activity last 3 months, sales last 3 months, profit last 3 months. This is a completely editable PowerPoint presentation and is available for immediate download. Download now and impress your audience.
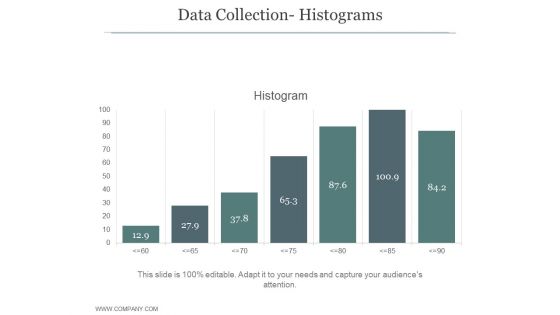
Data Collection Histograms Ppt PowerPoint Presentation Diagrams
This is a data collection histograms ppt powerpoint presentation diagrams. This is a seven stage process. The stages in this process are business, strategy, growth strategy, marketing, histogram, finance.
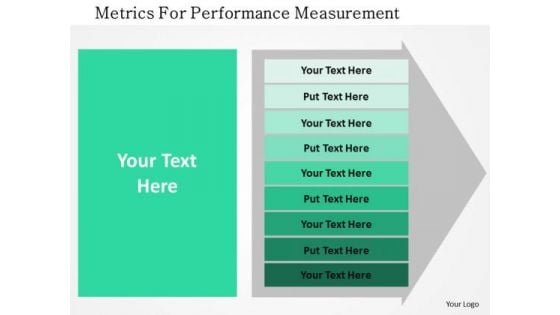
Business Diagram Metrics For Performance Measurement Presentation Template
This diagram slide has been designed with graphic of matrix. You may use this matrix for performance management. Download this diagram to make interactive presentations.
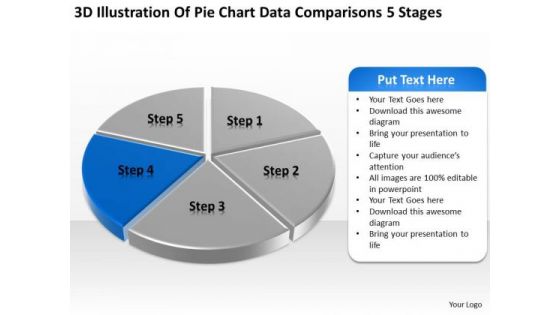
Pie Chart Data Comparisons 5 Stages How To Develop Business Plan PowerPoint Templates
We present our pie chart data comparisons 5 stages how to develop business plan PowerPoint templates.Present our Marketing PowerPoint Templates because You can Be the star of the show with our PowerPoint Templates and Slides. Rock the stage with your ideas. Download and present our Finance PowerPoint Templates because Timeline crunches are a fact of life. Meet all deadlines using our PowerPoint Templates and Slides. Use our Business PowerPoint Templates because You can Be the puppeteer with our PowerPoint Templates and Slides as your strings. Lead your team through the steps of your script. Download and present our Sales PowerPoint Templates because Our PowerPoint Templates and Slides are a sure bet. Gauranteed to win against all odds. Download our Success PowerPoint Templates because Our PowerPoint Templates and Slides will provide weight to your words. They will bring out the depth of your thought process.Use these PowerPoint slides for presentations relating to Analysis, Analyzing, Brands, Business, Chart, Colorful, Commerce, Compare, Comparison, Data, Economical, Finance, Financial, Grow, Growth, Market, Market Share, Marketing, Measure, Pen, Pie, Pie Chart, Presentation, Profit, Revenue, Sales, Sales Chat, Sales Increase, Share, Statistical, Success, Successful. The prominent colors used in the PowerPoint template are Blue, Gray, White. Motivate your team to excellent performances. Nurture their abilities through our Pie Chart Data Comparisons 5 Stages How To Develop Business Plan PowerPoint Templates.
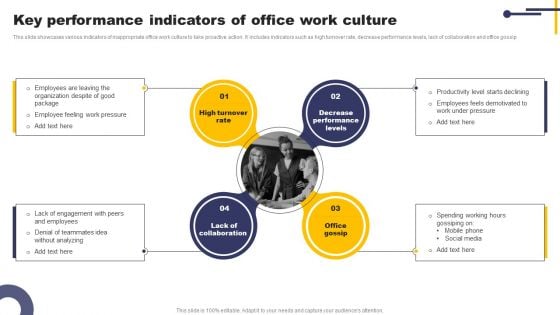
Key Performance Indicators Of Office Work Culture Inspiration PDF
This slide showcases various indicators of inappropriate office work culture to take proactive action. It includes indicators such as high turnover rate, decrease performance levels, lack of collaboration and office gossip. Presenting Key Performance Indicators Of Office Work Culture Inspiration PDF to dispense important information. This template comprises four stages. It also presents valuable insights into the topics including High Turnover Rate, Decrease Performance Levels, Office Gossip. This is a completely customizable PowerPoint theme that can be put to use immediately. So, download it and address the topic impactfully.
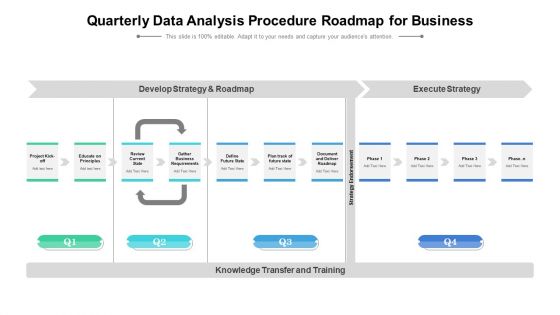
Quarterly Data Analysis Procedure Roadmap For Business Elements
Presenting our innovatively structured quarterly data analysis procedure roadmap for business elements Template. Showcase your roadmap process in different formats like PDF, PNG, and JPG by clicking the download button below. This PPT design is available in both Standard Screen and Widescreen aspect ratios. It can also be easily personalized and presented with modified font size, font type, color, and shapes to measure your progress in a clear way.
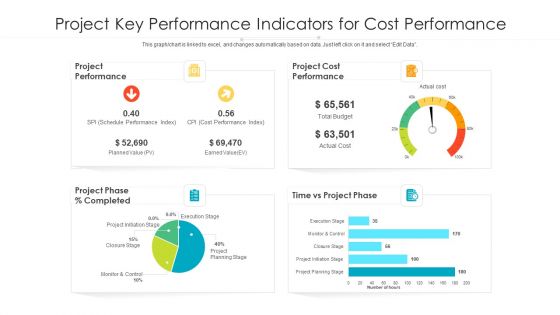
Project Key Performance Indicators For Cost Performance Ppt PowerPoint Presentation File Visuals PDF
Pitch your topic with ease and precision using this project key performance indicators for cost performance ppt powerpoint presentation file rules pdf. This layout presents information on project performance, project cost performance, schedule performance, closure stage. It is also available for immediate download and adjustment. So, changes can be made in the color, design, graphics or any other component to create a unique layout.

Key Trends Of Global Cosmetic Industry Successful Launch Ppt Template
The following slide outlines various trends in global beauty and cosmetic industry that are leading to market growth and expansion. It showcases elements such as male grooming, awareness and hormones, beauty subscription services and diversity. Retrieve professionally designed Key Trends Of Global Cosmetic Industry Successful Launch Ppt Template to effectively convey your message and captivate your listeners. Save time by selecting pre-made slideshows that are appropriate for various topics, from business to educational purposes. These themes come in many different styles, from creative to corporate, and all of them are easily adjustable and can be edited quickly. Access them as PowerPoint templates or as Google Slides themes. You do not have to go on a hunt for the perfect presentation because Slidegeeks got you covered from everywhere. The following slide outlines various trends in global beauty and cosmetic industry that are leading to market growth and expansion. It showcases elements such as male grooming, awareness and hormones, beauty subscription services and diversity.
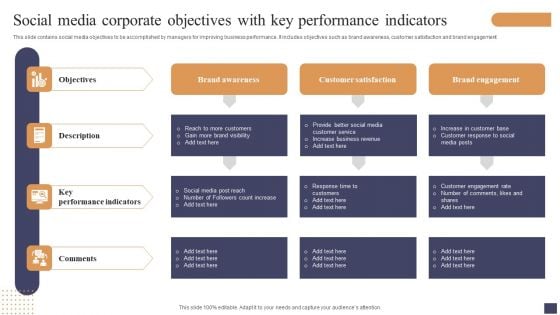
Social Media Corporate Objectives With Key Performance Indicators Pictures PDF
This slide contains social media objectives to be accomplished by managers for improving business performance. It includes objectives such as brand awareness, customer satisfaction and brand engagement. Presenting Social Media Corporate Objectives With Key Performance Indicators Pictures PDF to dispense important information. This template comprises four stages. It also presents valuable insights into the topics including Objectives, Description, Key Performance Indicators . This is a completely customizable PowerPoint theme that can be put to use immediately. So, download it and address the topic impactfully.
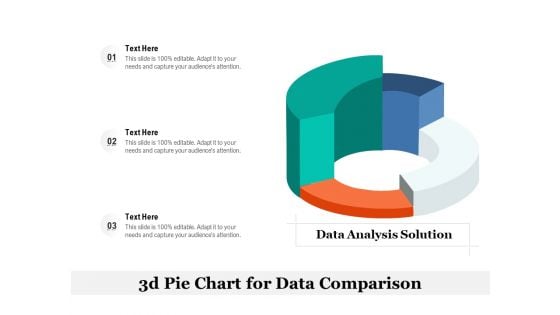
3D Pie Chart For Data Comparison Ppt Infographic Template Vector PDF
Presenting 3d pie chart for data comparison ppt infographic template vector pdf. to dispense important information. This template comprises three stages. It also presents valuable insights into the topics including data analysis solution, 3d pie chart for data comparison. This is a completely customizable PowerPoint theme that can be put to use immediately. So, download it and address the topic impactfully.
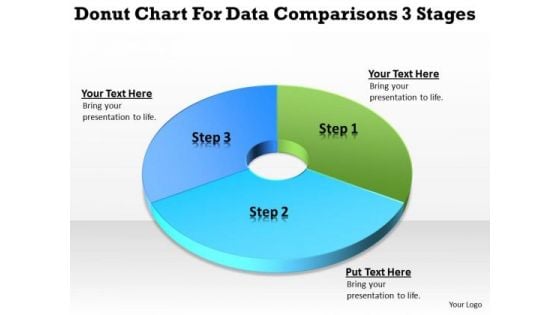
Donut Chart For Data Comparisons 3 Stages Business Planning PowerPoint Slides
We present our donut chart for data comparisons 3 stages business planning PowerPoint Slides.Present our Business PowerPoint Templates because It will Strengthen your hand with your thoughts. They have all the aces you need to win the day. Use our Finance PowerPoint Templates because You will get more than you ever bargained for. Use our Circle Charts PowerPoint Templates because It will Give impetus to the hopes of your colleagues. Our PowerPoint Templates and Slides will aid you in winning their trust. Present our Shapes PowerPoint Templates because You can Raise a toast with our PowerPoint Templates and Slides. Spread good cheer amongst your audience. Download our Process and Flows PowerPoint Templates because Our PowerPoint Templates and Slides help you meet the demand of the Market. Just browse and pick the slides that appeal to your intuitive senses.Use these PowerPoint slides for presentations relating to chart, donut, market, isolated, diminishing, rate, downtrend, business, three-dimensional, success, presentation, diagram, circle, uptrend, percentage, graphic, finance, data, stock, holdings, report, marketing, analyzing, trading, graph, illustration, pie, sale, up, money, design, currency, growth, descriptive, representing, painting, moving, progress, part, increases, background, investment, index, financial, multi, counter, portion, exchange. The prominent colors used in the PowerPoint template are Blue , Blue light, Green. Upgrade your presentation with our Donut Chart For Data Comparisons 3 Stages Business Planning PowerPoint Slides. Download without worries with our money back guaranteee.
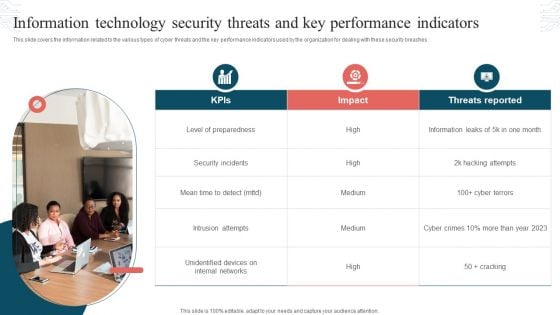
Information Technology Security Threats And Key Performance Indicators Formats PDF
This slide covers the information related to the various types of cyber threats and the key performance indicators used by the organization for dealing with these security breaches. Presenting Information Technology Security Threats And Key Performance Indicators Formats PDF to dispense important information. This template comprises three stages. It also presents valuable insights into the topics including Threats Reported, Security Incidents, Intrusion Attempts. This is a completely customizable PowerPoint theme that can be put to use immediately. So, download it and address the topic impactfully.
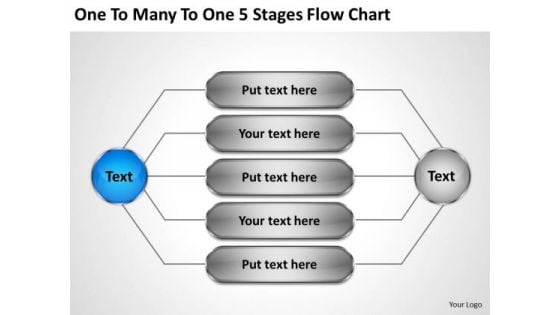
Total Marketing Concepts Many 5 Stages Flow Chart Business Strategy Plan Template
We present our total marketing concepts many 5 stages flow chart business strategy plan template.Use our Business PowerPoint Templates because You are well armed with penetrative ideas. Our PowerPoint Templates and Slides will provide the gunpowder you need. Use our Marketing PowerPoint Templates because Our PowerPoint Templates and Slides provide you with a vast range of viable options. Select the appropriate ones and just fill in your text. Present our Circle Charts PowerPoint Templates because our PowerPoint Templates and Slides will give your ideas the shape. Use our Communication PowerPoint Templates because These PowerPoint Templates and Slides will give the updraft to your ideas. See them soar to great heights with ease. Use our Process and Flows PowerPoint Templates because Our PowerPoint Templates and Slides are focused like a searchlight beam. They highlight your ideas for your target audience.Use these PowerPoint slides for presentations relating to chart, options, flow, arrow, diagram, circular, isolated, sequence, numbers, square, choose, statement, corporate, order, business, sequential, vector, consecutive, presentation, template, circle, data, description, cog, report, marketing, work-flow, illustration, connection, strategy, registry, catalog, segments, web, text, banner, five, progress, information, demonstration, navigation, 4, structure, button, goals, communication. The prominent colors used in the PowerPoint template are Blue, Gray, Black. Exhibit high fibre with our Total Marketing Concepts Many 5 Stages Flow Chart Business Strategy Plan Template. They display your fearless character.
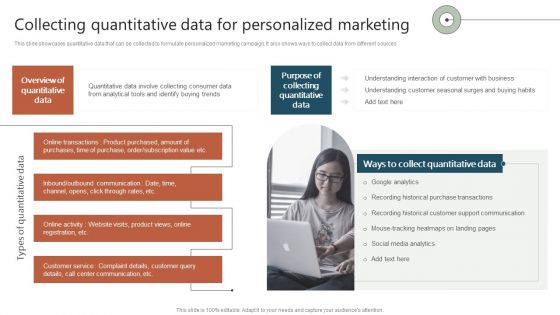
Collecting Quantitative Data For Personalized Marketing Ppt Ideas Sample PDF
This slide showcases quantitative data that can be collected to formulate personalized marketing campaign. It also shows ways to collect data from different sources. Retrieve professionally designed Collecting Quantitative Data For Personalized Marketing Ppt Ideas Sample PDF to effectively convey your message and captivate your listeners. Save time by selecting pre made slideshows that are appropriate for various topics, from business to educational purposes. These themes come in many different styles, from creative to corporate, and all of them are easily adjustable and can be edited quickly. Access them as PowerPoint templates or as Google Slides themes. You do not have to go on a hunt for the perfect presentation because Slidegeeks got you covered from everywhere.
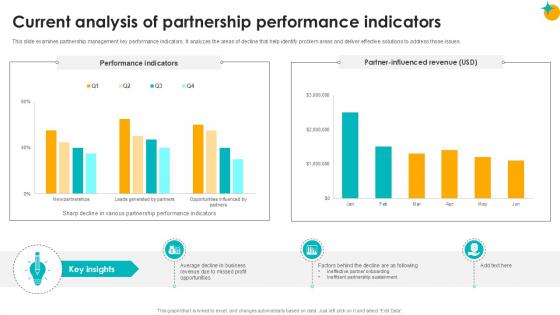
Current Analysis Of Partnership Performance Partner Relationship Ppt Template
This slide examines partnership management key performance indicators. It analyzes the areas of decline that help identify problem areas and deliver effective solutions to address those issues. Create an editable Current Analysis Of Partnership Performance Partner Relationship Ppt Template that communicates your idea and engages your audience. Whether you are presenting a business or an educational presentation, pre-designed presentation templates help save time. Current Analysis Of Partnership Performance Partner Relationship Ppt Template is highly customizable and very easy to edit, covering many different styles from creative to business presentations. Slidegeeks has creative team members who have crafted amazing templates. So, go and get them without any delay. This slide examines partnership management key performance indicators. It analyzes the areas of decline that help identify problem areas and deliver effective solutions to address those issues.
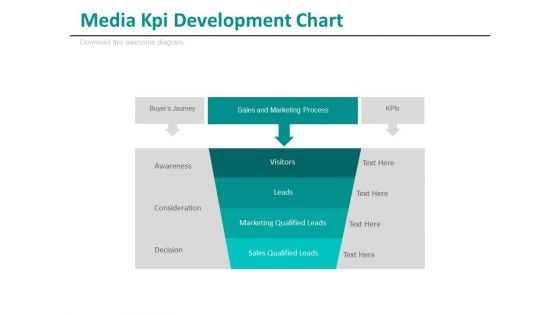
Media Kpi Development Chart Ppt Slides
This is a media KPI development chart ppt slides. This is a one stage process. The stages in this process are business, media, success.
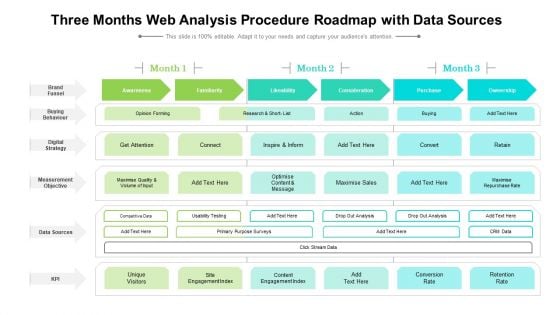
Three Months Web Analysis Procedure Roadmap With Data Sources Guidelines
Presenting our jaw dropping three months web analysis procedure roadmap with data sources guidelines. You can alternate the color, font size, font type, and shapes of this PPT layout according to your strategic process. This PPT presentation is compatible with Google Slides and is available in both standard screen and widescreen aspect ratios. You can also download this well researched PowerPoint template design in different formats like PDF, JPG, and PNG. So utilize this visually appealing design by clicking the download button given below.
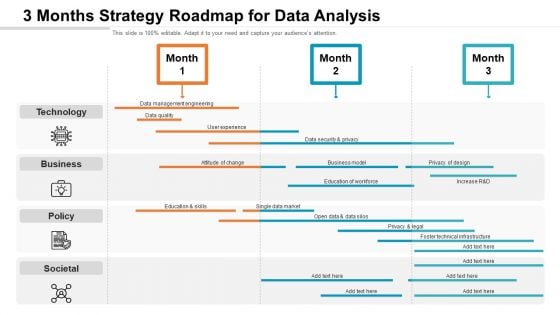
3 Months Strategy Roadmap For Data Analysis Pictures
Presenting the 3 months strategy roadmap for data analysis pictures. The template includes a roadmap that can be used to initiate a strategic plan. Not only this, the PowerPoint slideshow is completely editable and you can effortlessly modify the font size, font type, and shapes according to your needs. This PPT slide can be easily reached in standard screen and widescreen aspect ratios. The set is also available in various formats like PDF, PNG, and JPG. So download and use it multiple times as per your knowledge.
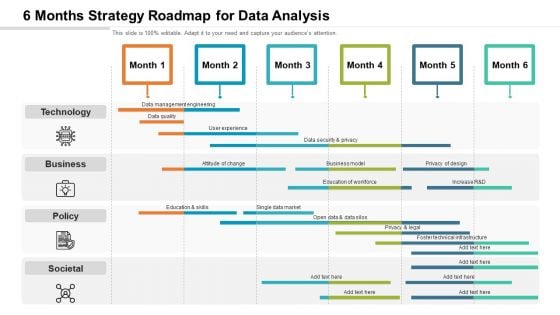
6 Months Strategy Roadmap For Data Analysis Demonstration
Presenting the 6 months strategy roadmap for data analysis demonstration. The template includes a roadmap that can be used to initiate a strategic plan. Not only this, the PowerPoint slideshow is completely editable and you can effortlessly modify the font size, font type, and shapes according to your needs. This PPT slide can be easily reached in standard screen and widescreen aspect ratios. The set is also available in various formats like PDF, PNG, and JPG. So download and use it multiple times as per your knowledge.
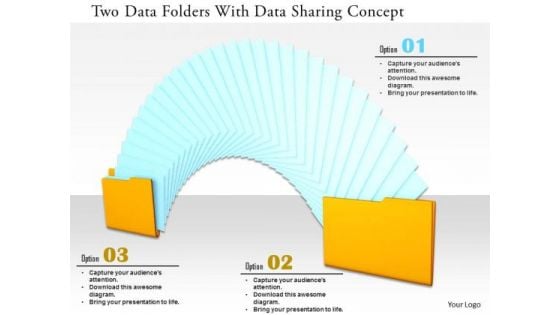
Stock Photo Two Data Folders With Data Sharing Concept PowerPoint Slide
This power point image template has been designed with graphic of two data folders. This PPT contains the concept of data sharing. This PPT can be used for data and technology related presentations.

Consumption Metrics Sharing Metrics Ppt Example
This is a consumption metrics sharing metrics ppt example. This is a four stage process. The stages in this process are circle charts, business, marketing.
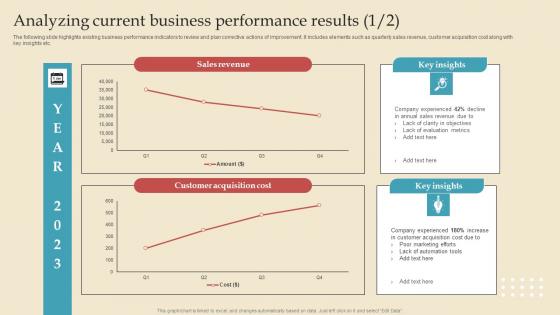
Analyzing Current Describing Business Performance Administration Goals Microsoft Pdf
The following slide highlights existing business performance indicators to review and plan corrective actions of improvement. It includes elements such as quarterly sales revenue, customer acquisition cost along with key insights etc. This modern and well arranged Analyzing Current Describing Business Performance Administration Goals Microsoft Pdf provides lots of creative possibilities. It is very simple to customize and edit with the Powerpoint Software. Just drag and drop your pictures into the shapes. All facets of this template can be edited with Powerpoint, no extra software is necessary. Add your own material, put your images in the places assigned for them, adjust the colors, and then you can show your slides to the world, with an animated slide included. The following slide highlights existing business performance indicators to review and plan corrective actions of improvement. It includes elements such as quarterly sales revenue, customer acquisition cost along with key insights etc.
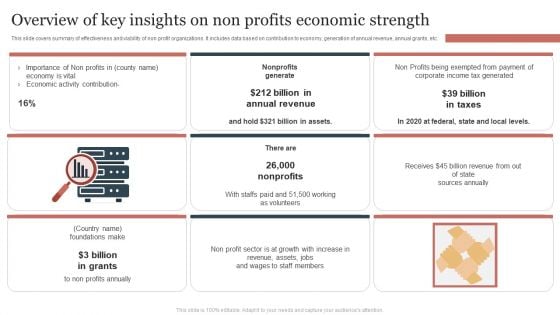
Overview Of Key Insights On Non Profits Economic Strength Summary PDF
This slide covers summary of effectiveness and viability of non profit organizations. It includes data based on contribution to economy, generation of annual revenue, annual grants, etc. Presenting Overview Of Key Insights On Non Profits Economic Strength Summary PDF to dispense important information. This template comprises threestages. It also presents valuable insights into the topics including Annual Revenue, Billion In Taxes, Non Profits. This is a completely customizable PowerPoint theme that can be put to use immediately. So, download it and address the topic impactfully.
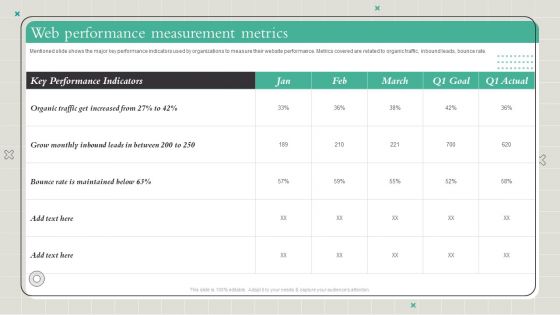
Playbook To Formulate Efficient Web Performance Measurement Metrics Diagrams PDF
Mentioned slide shows the major key performance indicators used by organizations to measure their website performance. Metrics covered are related to organic traffic, inbound leads, bounce rate. Slidegeeks has constructed Playbook To Formulate Efficient Web Performance Measurement Metrics Diagrams PDF after conducting extensive research and examination. These presentation templates are constantly being generated and modified based on user preferences and critiques from editors. Here, you will find the most attractive templates for a range of purposes while taking into account ratings and remarks from users regarding the content. This is an excellent jumping-off point to explore our content and will give new users an insight into our top-notch PowerPoint Templates.
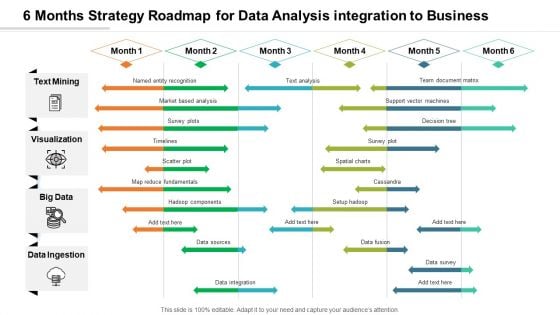
6 Months Strategy Roadmap For Data Analysis Integration To Business Diagrams
Introducing our 6 months strategy roadmap for data analysis integration to business diagrams. This PPT presentation is Google Slides compatible, therefore, you can share it easily with the collaborators for measuring the progress. Also, the presentation is available in both standard screen and widescreen aspect ratios. So edit the template design by modifying the font size, font type, color, and shapes as per your requirements. As this PPT design is fully editable it can be presented in PDF, JPG and PNG formats.
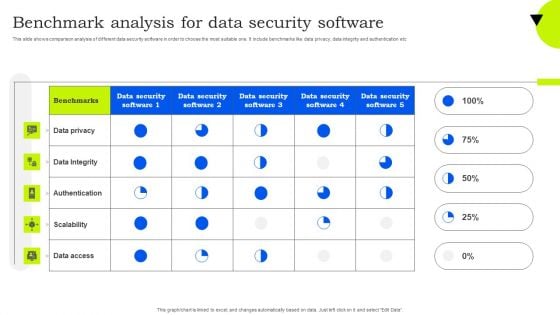
Benchmark Analysis For Data Security Software Mockup PDF
This slide shows comparison analysis of different data security software in order to choose the most suitable one. It include benchmarks like data privacy, data integrity and authentication etc. Showcasing this set of slides titled Benchmark Analysis For Data Security Software Mockup PDF. The topics addressed in these templates are Data Privacy, Data Integrity, Authentication. All the content presented in this PPT design is completely editable. Download it and make adjustments in color, background, font etc. as per your unique business setting.
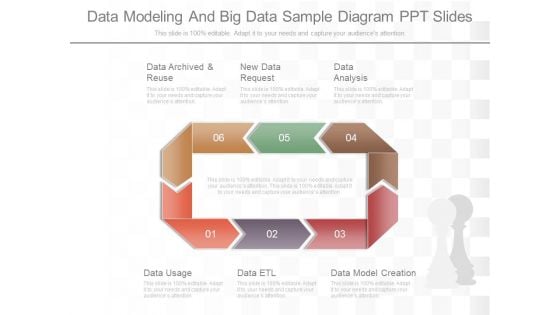
Data Modeling And Big Data Sample Diagram Ppt Slides
This is a data modeling and big data sample diagram ppt slides. This is a six stage process. The stages in this process are data archived and reuse, new data request, data analysis, data usage, data etl, data model creation.
Cloud Performance Tracking Enhancing Workload Efficiency Through Cloud Architecture Brochure Pdf
This slide covers the Key performance indicators for tracking performance of the cloud such as violations break down, sources, rules and severity This modern and well arranged Cloud Performance Tracking Enhancing Workload Efficiency Through Cloud Architecture Brochure Pdf provides lots of creative possibilities. It is very simple to customize and edit with the Powerpoint Software. Just drag and drop your pictures into the shapes. All facets of this template can be edited with Powerpoint, no extra software is necessary. Add your own material, put your images in the places assigned for them, adjust the colors, and then you can show your slides to the world, with an animated slide included. This slide covers the Key performance indicators for tracking performance of the cloud such as violations break down, sources, rules and severity
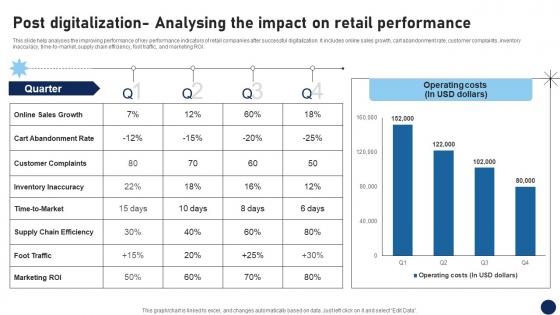
Post Digitalization Analysing The Impact On Retail Performance DT SS V
This slide help analyses the improving performance of key performance indicators of retail companies after successful digitalization. It includes online sales growth, cart abandonment rate, customer complaints, inventory inaccuracy, time-to-market, supply chain efficiency, foot traffic, and marketing ROI. This modern and well-arranged Post Digitalization Analysing The Impact On Retail Performance DT SS V provides lots of creative possibilities. It is very simple to customize and edit with the Powerpoint Software. Just drag and drop your pictures into the shapes. All facets of this template can be edited with Powerpoint, no extra software is necessary. Add your own material, put your images in the places assigned for them, adjust the colors, and then you can show your slides to the world, with an animated slide included. This slide help analyses the improving performance of key performance indicators of retail companies after successful digitalization. It includes online sales growth, cart abandonment rate, customer complaints, inventory inaccuracy, time-to-market, supply chain efficiency, foot traffic, and marketing ROI.
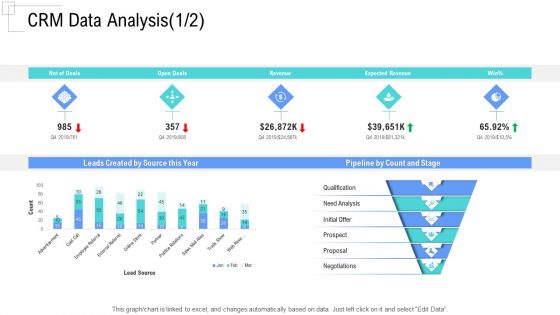
Managing Customer Experience CRM Data Analysis Revenue Designs PDF
This graph or chart is linked to excel, and changes automatically based on data. Just left click on it and select Edit Data.Deliver an awe-inspiring pitch with this creative managing customer experience crm data analysis revenue designs pdf bundle. Topics like leads created by source this year, pipeline by count and stage, qualification, need analysis, initial offer can be discussed with this completely editable template. It is available for immediate download depending on the needs and requirements of the user.
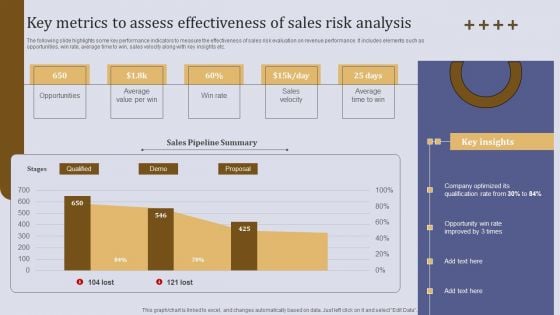
Key Metrics To Assess Effectiveness Of Sales Risk Analysis Ppt Outline Design Ideas PDF
The following slide highlights some key performance indicators to measure the effectiveness of sales risk evaluation on revenue performance. It includes elements such as opportunities, win rate, average time to win, sales velocity along with key insights etc. Retrieve professionally designed Key Metrics To Assess Effectiveness Of Sales Risk Analysis Ppt Outline Design Ideas PDF to effectively convey your message and captivate your listeners. Save time by selecting pre made slideshows that are appropriate for various topics, from business to educational purposes. These themes come in many different styles, from creative to corporate, and all of them are easily adjustable and can be edited quickly. Access them as PowerPoint templates or as Google Slides themes. You do not have to go on a hunt for the perfect presentation because Slidegeeks got you covered from everywhere.
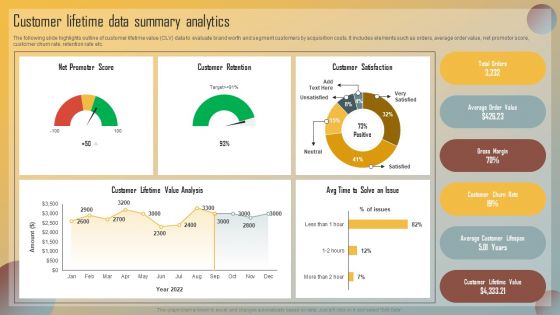
Guide For Marketing Analytics To Improve Decisions Customer Lifetime Data Summary Analytics Structure PDF
The following slide highlights outline of customer lifetime value CLV data to evaluate brand worth and segment customers by acquisition costs. It includes elements such as orders, average order value, net promotor score, customer churn rate, retention rate etc. Find a pre designed and impeccable Guide For Marketing Analytics To Improve Decisions Customer Lifetime Data Summary Analytics Structure PDF. The templates can ace your presentation without additional effort. You can download these easy to edit presentation templates to make your presentation stand out from others. So, what are you waiting for Download the template from Slidegeeks today and give a unique touch to your presentation.
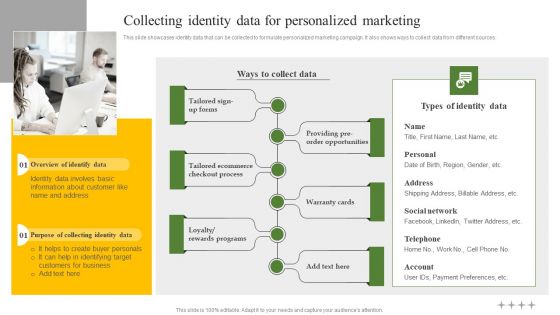
Collecting Identity Data For Personalized Marketing Ppt Professional Elements PDF
This slide showcases identity data that can be collected to formulate personalized marketing campaign. It also shows ways to collect data from different sources. Are you searching for a Collecting Identity Data For Personalized Marketing Ppt Professional Elements PDF that is uncluttered, straightforward, and original Its easy to edit, and you can change the colors to suit your personal or business branding. For a presentation that expresses how much effort you have put in, this template is ideal With all of its features, including tables, diagrams, statistics, and lists, its perfect for a business plan presentation. Make your ideas more appealing with these professional slides. Download Collecting Identity Data For Personalized Marketing Ppt Professional Elements PDF from Slidegeeks today.
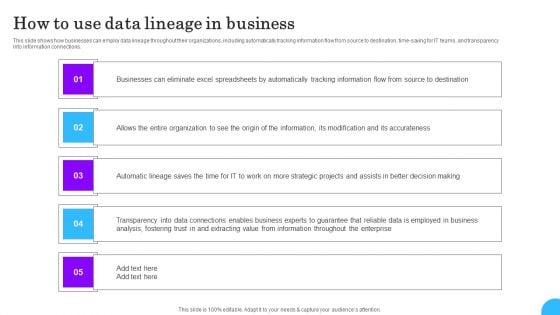
Comprehensive Analysis Of Different Data Lineage Classification How To Use Data Lineage In Business Diagrams PDF
This slide shows how businesses can employ data lineage throughout their organizations, including automatically tracking information flow from source to destination, time saving for IT teams, and transparency into information connections. Presenting this PowerPoint presentation, titled Comprehensive Analysis Of Different Data Lineage Classification How To Use Data Lineage In Business Diagrams PDF, with topics curated by our researchers after extensive research. This editable presentation is available for immediate download and provides attractive features when used. Download now and captivate your audience. Presenting this Comprehensive Analysis Of Different Data Lineage Classification How To Use Data Lineage In Business Diagrams PDF. Our researchers have carefully researched and created these slides with all aspects taken into consideration. This is a completely customizable Comprehensive Analysis Of Different Data Lineage Classification How To Use Data Lineage In Business Diagrams PDF that is available for immediate downloading. Download now and make an impact on your audience. Highlight the attractive features available with our PPTs.
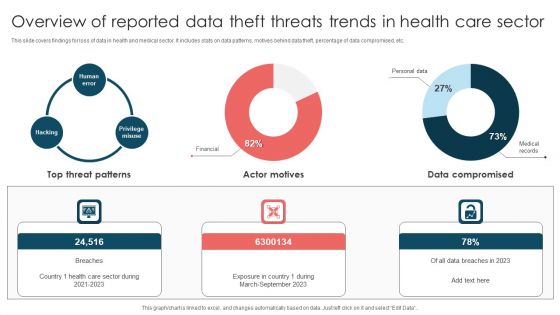
Overview Of Reported Data Theft Threats Trends In Health Care Sector Introduction PDF
This slide covers findings for loss of data in health and medical sector. It includes stats on data patterns, motives behind data theft, percentage of data compromised, etc. Pitch your topic with ease and precision using this Overview Of Reported Data Theft Threats Trends In Health Care Sector Introduction PDF. This layout presents information on Top Threat Patterns, Exposure Country, March To September 2023. It is also available for immediate download and adjustment. So, changes can be made in the color, design, graphics or any other component to create a unique layout.
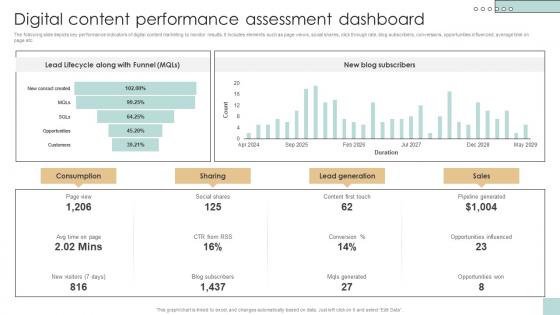
Digital Content Performance Assessment Developing And Creating Digital Content Strategy SS V
The following slide depicts key performance indicators of digital content marketing to monitor results. It includes elements such as page views, social shares, click through rate, blog subscribers, conversions, opportunities influenced, average time on page etc. If your project calls for a presentation, then Slidegeeks is your go-to partner because we have professionally designed, easy-to-edit templates that are perfect for any presentation. After downloading, you can easily edit Digital Content Performance Assessment Developing And Creating Digital Content Strategy SS V and make the changes accordingly. You can rearrange slides or fill them with different images. Check out all the handy templates The following slide depicts key performance indicators of digital content marketing to monitor results. It includes elements such as page views, social shares, click through rate, blog subscribers, conversions, opportunities influenced, average time on page etc.
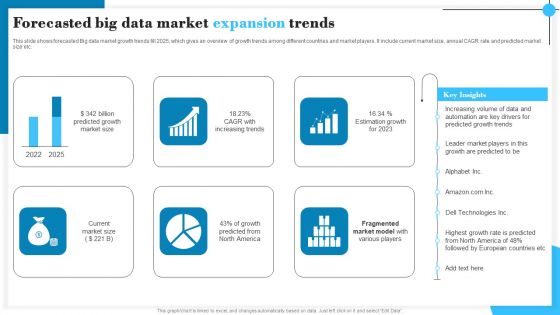
Forecasted Big Data Market Expansion Trends Download PDF
This slide shows forecasted Big data market growth trends till 2025, which gives an overview of growth trends among different countries and market players. It include current market size, annual CAGR rate and predicted market size etc. Pitch your topic with ease and precision using this Forecasted Big Data Market Expansion Trends Download PDF. This layout presents information on Billion Predicted Growth, Increasing Trends, Estimation Growth. It is also available for immediate download and adjustment. So, changes can be made in the color, design, graphics or any other component to create a unique layout.
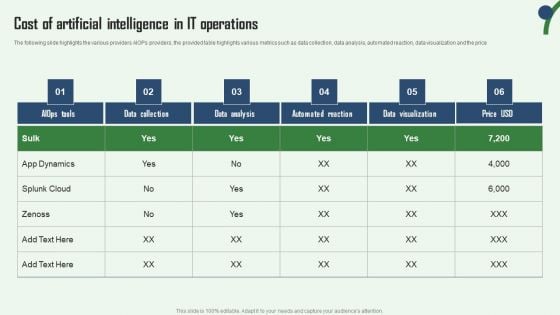
Cost Of Artificial Intelligence In IT Operations Aiops Integration Summary Report Themes PDF
The following slide highlights the various providers AIOPs providers, the provided table highlights various metrics such as data collection, data analysis, automated reaction, data visualization and the price. Formulating a presentation can take up a lot of effort and time, so the content and message should always be the primary focus. The visuals of the PowerPoint can enhance the presenters message, so our Cost Of Artificial Intelligence In IT Operations Aiops Integration Summary Report Themes PDF was created to help save time. Instead of worrying about the design, the presenter can concentrate on the message while our designers work on creating the ideal templates for whatever situation is needed. Slidegeeks has experts for everything from amazing designs to valuable content, we have put everything into Cost Of Artificial Intelligence In IT Operations Aiops Integration Summary Report Themes PDF.

Various Stages Data Extraction Process Flow Chart Ppt PowerPoint Presentation Pictures Show PDF
Persuade your audience using this various stages data extraction process flow chart ppt powerpoint presentation pictures show pdf. This PPT design covers five stages, thus making it a great tool to use. It also caters to a variety of topics including interpretation evaluation, data mining, transformation, preprocessing, selection, target data, preprocessed data, transformed data, patterns, knowledge. Download this PPT design now to present a convincing pitch that not only emphasizes the topic but also showcases your presentation skills.
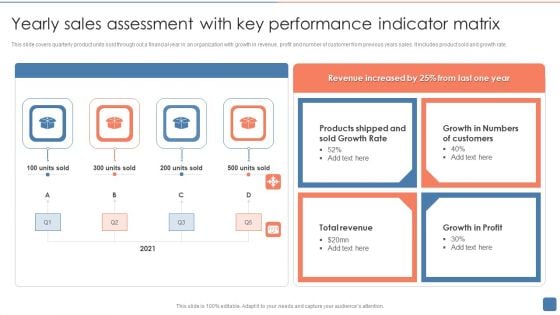
Yearly Sales Assessment With Key Performance Indicator Matrix Introduction PDF
This slide covers quarterly product units sold through out a financial year in an organization with growth in revenue, profit and number of customer from previous years sales. It includes product sold and growth rate. Presenting Yearly Sales Assessment With Key Performance Indicator Matrix Introduction PDF to dispense important information. This template comprises four stages. It also presents valuable insights into the topics including Sold Growth Rate, Customers, Growth In Profit. This is a completely customizable PowerPoint theme that can be put to use immediately. So, download it and address the topic impactfully.
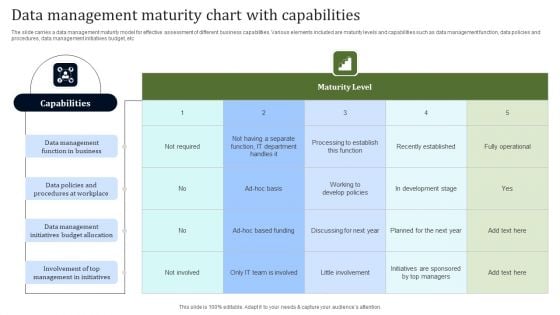
Data Management Maturity Chart With Capabilities Topics PDF
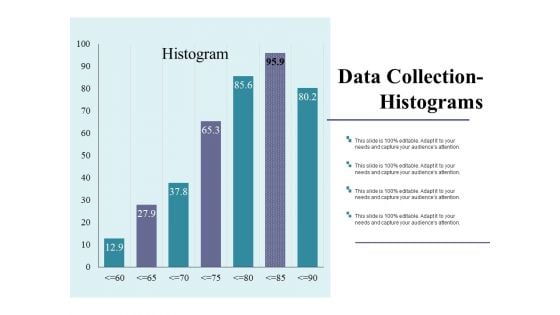
Data Collection Histograms Ppt PowerPoint Presentation Outline Show
This is a data collection histograms ppt powerpoint presentation outline show. This is a seven stage process. The stages in this process are business, marketing, strategy, finance, analysis.
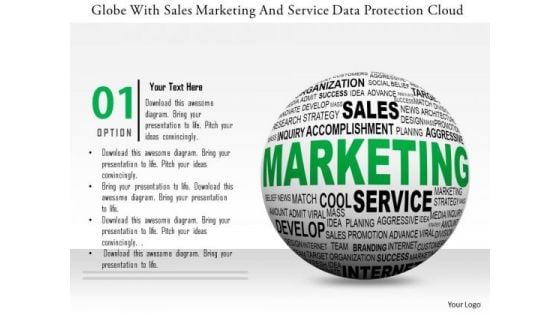
Stock Photo Globe With Sales Marketing And Service Data Protection Cloud PowerPoint Slide
This power point template has been designed with graphic of globe and cloud. This image template contains the concept of global sales and marketing service with cloud technology. Use this image template for global business related presentations.
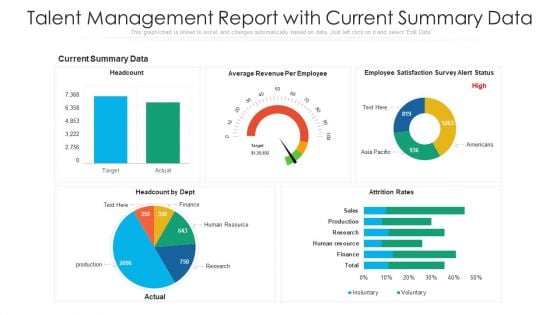
Talent Management Report With Current Summary Data Ppt Gallery Example Topics PDF
Showcasing this set of slides titled talent management report with current summary data ppt gallery example topics pdf. The topics addressed in these templates are human resource, research, production. All the content presented in this PPT design is completely editable. Download it and make adjustments in color, background, font etc. as per your unique business setting.
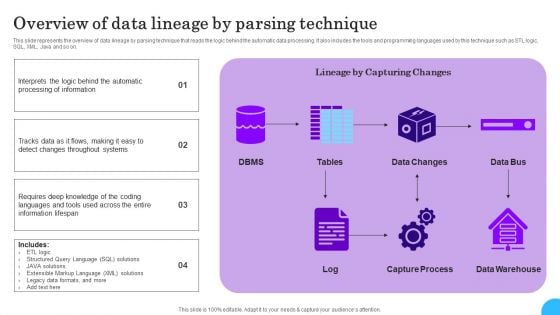
Comprehensive Analysis Of Different Data Lineage Classification Overview Of Data Lineage By Parsing Diagrams PDF
This slide represents the overview of data lineage by parsing technique that reads the logic behind the automatic data processing. It also includes the tools and programming languages used by this technique such as STL logic, SQL, XML, Java and so on. Slidegeeks is one of the best resources for PowerPoint templates. You can download easily and regulate Comprehensive Analysis Of Different Data Lineage Classification Overview Of Data Lineage By Parsing Diagrams PDF for your personal presentations from our wonderful collection. A few clicks is all it takes to discover and get the most relevant and appropriate templates. Use our Templates to add a unique zing and appeal to your presentation and meetings. All the slides are easy to edit and you can use them even for advertisement purposes.
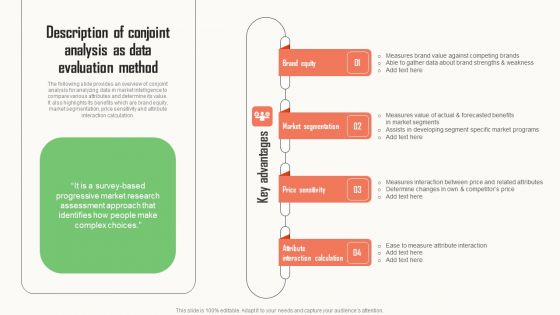
Strategic Market Insight Implementation Guide Description Of Conjoint Analysis As Data Evaluation Method Graphics PDF
The following slide provides an overview of conjoint analysis for analyzing data in market intelligence to compare various attributes and determine its value. It also highlights its benefits which are brand equity, market segmentation, price sensitivity and attribute interaction calculation. Whether you have daily or monthly meetings, a brilliant presentation is necessary. Strategic Market Insight Implementation Guide Description Of Conjoint Analysis As Data Evaluation Method Graphics PDF can be your best option for delivering a presentation. Represent everything in detail using Strategic Market Insight Implementation Guide Description Of Conjoint Analysis As Data Evaluation Method Graphics PDF and make yourself stand out in meetings. The template is versatile and follows a structure that will cater to your requirements. All the templates prepared by Slidegeeks are easy to download and edit. Our research experts have taken care of the corporate themes as well. So, give it a try and see the results.
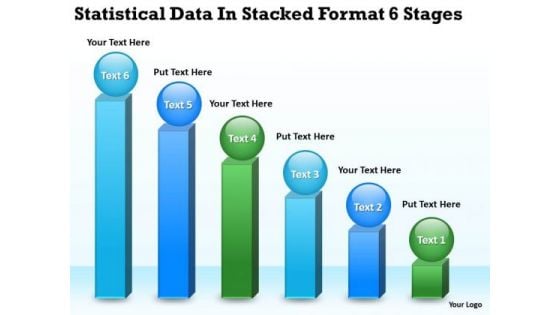
Data In Stacked Format 6 Stages Small Business Plan Template PowerPoint Slides
We present our data in stacked format 6 stages small business plan template PowerPoint Slides.Download and present our Finance PowerPoint Templates because Our PowerPoint Templates and Slides provide you with a vast range of viable options. Select the appropriate ones and just fill in your text. Download our Marketing PowerPoint Templates because Our PowerPoint Templates and Slides will bullet point your ideas. See them fall into place one by one. Present our Spheres PowerPoint Templates because You can Create a matrix with our PowerPoint Templates and Slides. Feel the strength of your ideas click into place. Download and present our Business PowerPoint Templates because our PowerPoint Templates and Slides are the string of your bow. Fire of your ideas and conquer the podium. Present our Boxes PowerPoint Templates because Our PowerPoint Templates and Slides are aesthetically designed to attract attention. We gaurantee that they will grab all the eyeballs you need.Use these PowerPoint slides for presentations relating to Accounting, bar, business, chart, data, diagram, dimension, economy, education, finance, financial, flow, graph, graphic, grow, increase, information, investment, learning, management, market, money, performance, piece, process, profit, report, stack, statistic, success, think, transaction, trend, work. The prominent colors used in the PowerPoint template are Blue, Green, Black. Unite your team with our Data In Stacked Format 6 Stages Small Business Plan Template PowerPoint Slides. Download without worries with our money back guaranteee.
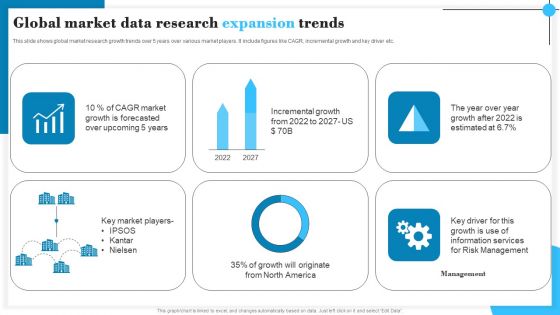
Global Market Data Research Expansion Trends Graphics PDF
This slide shows global market research growth trends over 5 years over various market players. It include figures like CAGR, incremental growth and key driver etc. Pitch your topic with ease and precision using this Global Market Data Research Expansion Trends Graphics PDF. This layout presents information on CAGR Market, Incremental Growth, Management. It is also available for immediate download and adjustment. So, changes can be made in the color, design, graphics or any other component to create a unique layout.
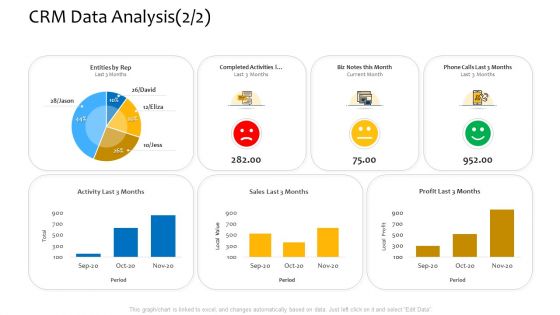
Customer Relationship Management Procedure CRM Data Analysis Activities Rules PDF
Deliver an awe inspiring pitch with this creative customer relationship management procedure CRM data analysis activities rules pdf bundle. Topics like CRM data analysis, completed activities, local profit can be discussed with this completely editable template. It is available for immediate download depending on the needs and requirements of the user.
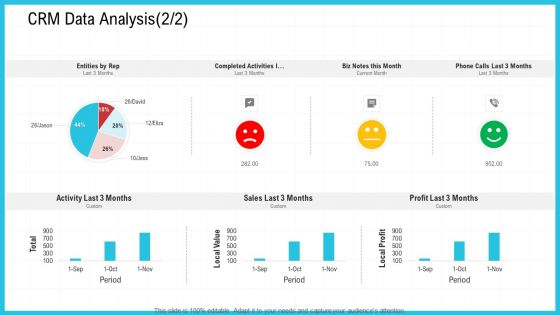
CRM Data Analysis Value Ppt Ideas Visual Aids PDF
Deliver an awe inspiring pitch with this creative crm data analysis value ppt ideas visual aids pdf bundle. Topics like crm data analysis can be discussed with this completely editable template. It is available for immediate download depending on the needs and requirements of the user.
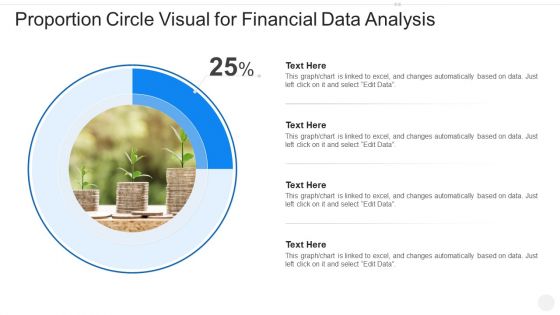
Proportion Circle Visual For Financial Data Analysis Guidelines PDF
Showcasing this set of slides titled proportion circle visual for financial data analysis guidelines pdf. The topics addressed in these templates are proportion circle visual for financial data analysis. All the content presented in this PPT design is completely editable. Download it and make adjustments in color, background, font etc. as per your unique business setting.
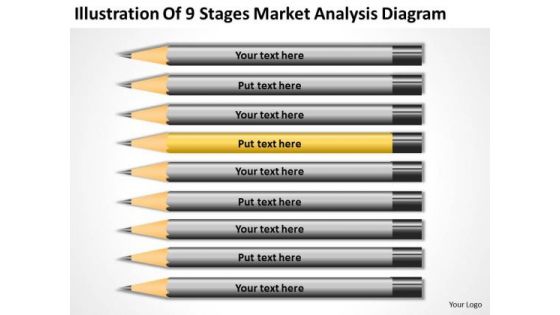
Illustration Of 9 Stages Market Analysis Diagram Business Plan PowerPoint Templates
We present our illustration of 9 stages market analysis diagram business plan PowerPoint templates.Download and present our Communication PowerPoint Templates because Our PowerPoint Templates and Slides will let you Hit the target. Go the full distance with ease and elan. Present our Marketing PowerPoint Templates because Our PowerPoint Templates and Slides will weave a web of your great ideas. They are gauranteed to attract even the most critical of your colleagues. Download and present our Business PowerPoint Templates because Our PowerPoint Templates and Slides help you meet the demand of the Market. Just browse and pick the slides that appeal to your intuitive senses. Present our Shapes PowerPoint Templates because Timeline crunches are a fact of life. Meet all deadlines using our PowerPoint Templates and Slides. Present our Process and Flows PowerPoint Templates because Our PowerPoint Templates and Slides will let you Clearly mark the path for others to follow.Use these PowerPoint slides for presentations relating to Market, sales, statistics, economy, target, achievement, corporate, business, success, presentation, diagram, finance, data, stock, analysis, flowchart, drawing, report, calculation, graph, illustration, economic, chart, money, pie-chart, planning, design, growth, pencil, company, competition, progress, investment, analyze, office, banking, financial, cash, exchange. The prominent colors used in the PowerPoint template are Yellow, Gray, Black. Fetch up with our Illustration Of 9 Stages Market Analysis Diagram Business Plan PowerPoint Templates. You will be applauded wherever you go.
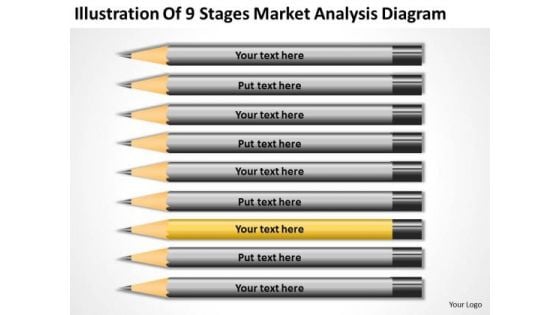
Illustration Of 9 Stages Market Analysis Diagram Ppt Business Plan Companies PowerPoint Slides
We present our illustration of 9 stages market analysis diagram ppt business plan companies PowerPoint Slides.Present our Communication PowerPoint Templates because Our PowerPoint Templates and Slides will definately Enhance the stature of your presentation. Adorn the beauty of your thoughts with their colourful backgrounds. Present our Marketing PowerPoint Templates because Our PowerPoint Templates and Slides offer you the needful to organise your thoughts. Use them to list out your views in a logical sequence. Download and present our Business PowerPoint Templates because Our PowerPoint Templates and Slides are aesthetically designed to attract attention. We gaurantee that they will grab all the eyeballs you need. Present our Shapes PowerPoint Templates because It is Aesthetically crafted by artistic young minds. Our PowerPoint Templates and Slides are designed to display your dexterity. Download our Process and Flows PowerPoint Templates because Our PowerPoint Templates and Slides offer you the widest possible range of options.Use these PowerPoint slides for presentations relating to Market, sales, statistics, economy, target, achievement, corporate, business, success, presentation, diagram, finance, data, stock, analysis, flowchart, drawing, report, calculation, graph, illustration, economic, chart, money, pie-chart, planning, design, growth, pencil, company, competition, progress, investment, analyze, office, banking, financial, cash, exchange. The prominent colors used in the PowerPoint template are Yellow, Gray, Black. Present like a genius. Our Illustration Of 9 Stages Market Analysis Diagram Ppt Business Plan Companies PowerPoint Slides help you play the part.
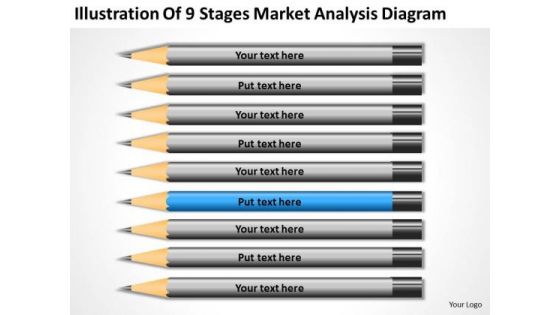
Illustration Of 9 Stages Market Analysis Diagram Ppt Business Plan Tools PowerPoint Templates
We present our illustration of 9 stages market analysis diagram ppt business plan tools PowerPoint templates.Use our Communication PowerPoint Templates because Our PowerPoint Templates and Slides are specially created by a professional team with vast experience. They diligently strive to come up with the right vehicle for your brilliant Ideas. Use our Marketing PowerPoint Templates because Our PowerPoint Templates and Slides will let you Hit the target. Go the full distance with ease and elan. Use our Business PowerPoint Templates because Our PowerPoint Templates and Slides will let you Leave a lasting impression to your audiences. They possess an inherent longstanding recall factor. Present our Shapes PowerPoint Templates because our PowerPoint Templates and Slides are the string of your bow. Fire of your ideas and conquer the podium. Present our Process and Flows PowerPoint Templates because You aspire to touch the sky with glory. Let our PowerPoint Templates and Slides provide the fuel for your ascent.Use these PowerPoint slides for presentations relating to Market, sales, statistics, economy, target, achievement, corporate, business, success, presentation, diagram, finance, data, stock, analysis, flowchart, drawing, report, calculation, graph, illustration, economic, chart, money, pie-chart, planning, design, growth, pencil, company, competition, progress, investment, analyze, office, banking, financial, cash, exchange. The prominent colors used in the PowerPoint template are Blue, Gray, Black. Your ideas deserve the best accessories. Our Illustration Of 9 Stages Market Analysis Diagram Ppt Business Plan Tools PowerPoint Templates are a shining example.
Illustration Of 9 Stages Market Analysis Diagram Ppt Personal Business Plan PowerPoint Templates
We present our illustration of 9 stages market analysis diagram ppt personal business plan PowerPoint templates.Download and present our Communication PowerPoint Templates because Our PowerPoint Templates and Slides will let you Clearly mark the path for others to follow. Use our Marketing PowerPoint Templates because You can Bait your audience with our PowerPoint Templates and Slides. They will bite the hook of your ideas in large numbers. Use our Business PowerPoint Templates because Our PowerPoint Templates and Slides provide you with a vast range of viable options. Select the appropriate ones and just fill in your text. Download our Shapes PowerPoint Templates because You can Hit the nail on the head with our PowerPoint Templates and Slides. Embed your ideas in the minds of your audience. Download our Process and Flows PowerPoint Templates because Our PowerPoint Templates and Slides are conceived by a dedicated team. Use them and give form to your wondrous ideas.Use these PowerPoint slides for presentations relating to Market, sales, statistics, economy, target, achievement, corporate, business, success, presentation, diagram, finance, data, stock, analysis, flowchart, drawing, report, calculation, graph, illustration, economic, chart, money, pie-chart, planning, design, growth, pencil, company, competition, progress, investment, analyze, office, banking, financial, cash, exchange. The prominent colors used in the PowerPoint template are Blue, Gray, Black. Allow your thoughts to flow with our Illustration Of 9 Stages Market Analysis Diagram Ppt Personal Business Plan PowerPoint Templates. They will develop your creative aptitude.
Illustration Of 9 Stages Market Analysis Diagram Ppt Business Plan Formats PowerPoint Templates
We present our illustration of 9 stages market analysis diagram ppt business plan formats PowerPoint templates.Download and present our Communication PowerPoint Templates because Our PowerPoint Templates and Slides are aesthetically designed to attract attention. We gaurantee that they will grab all the eyeballs you need. Download and present our Marketing PowerPoint Templates because It will mark the footprints of your journey. Illustrate how they will lead you to your desired destination. Download and present our Business PowerPoint Templates because Our PowerPoint Templates and Slides will fulfill your every need. Use them and effectively satisfy the desires of your audience. Present our Shapes PowerPoint Templates because Our PowerPoint Templates and Slides will let you Illuminate the road ahead to Pinpoint the important landmarks along the way. Download our Process and Flows PowerPoint Templates because It will mark the footprints of your journey. Illustrate how they will lead you to your desired destination.Use these PowerPoint slides for presentations relating to Market, sales, statistics, economy, target, achievement, corporate, business, success, presentation, diagram, finance, data, stock, analysis, flowchart, drawing, report, calculation, graph, illustration, economic, chart, money, pie-chart, planning, design, growth, pencil, company, competition, progress, investment, analyze, office, banking, financial, cash, exchange. The prominent colors used in the PowerPoint template are Green, Gray, Black. Our Illustration Of 9 Stages Market Analysis Diagram Ppt Business Plan Formats PowerPoint Templates will corroborate your thoughts. Add to the authenticity of your ideas.
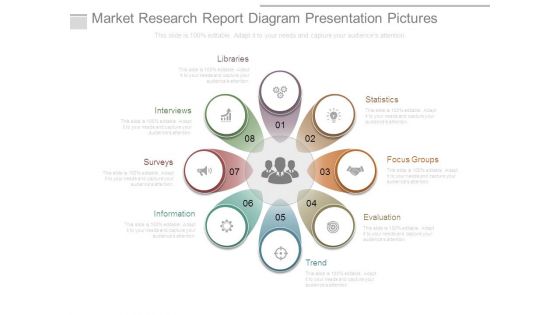
Market Research Report Diagram Presentation Pictures
This is a market research report diagram presentation pictures. This is a eight stage process. The stages in this process are libraries, interviews, surveys, information, trend, evaluation, focus groups, statistics.
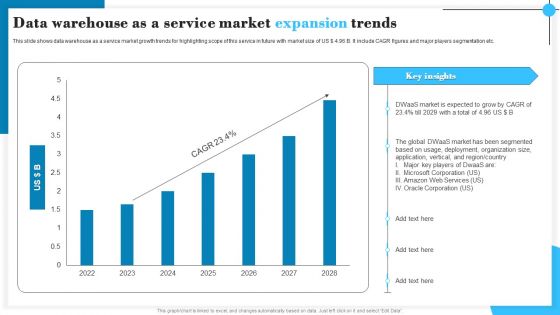
Data Warehouse As A Service Market Expansion Trends Sample PDF
This slide shows data warehouse as a service market growth trends for highlighting scope of this service in future with market size of US 4.96 B. It include CAGR figures and major players segmentation etc. Showcasing this set of slides titled Data Warehouse As A Service Market Expansion Trends Sample PDF. The topics addressed in these templates are Market Is Expected, Organization Size, Deployment. All the content presented in this PPT design is completely editable. Download it and make adjustments in color, background, font etc. as per your unique business setting.
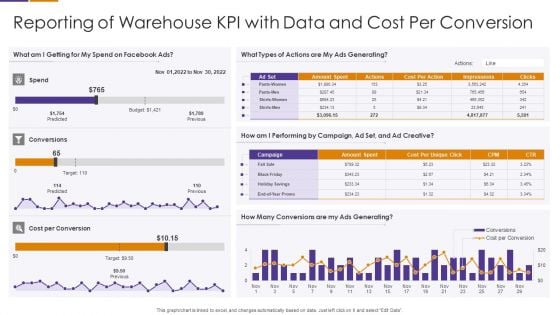
Reporting Of Warehouse KPI With Data And Cost Per Conversion Formats PDF
Pitch your topic with ease and precision using this Reporting Of Warehouse KPI With Data And Cost Per Conversion Formats PDF This layout presents information on Cost Per Conversion, Conversions Are My Ads Generating, Performing By Campaign It is also available for immediate download and adjustment. So, changes can be made in the color, design, graphics or any other component to create a unique layout.
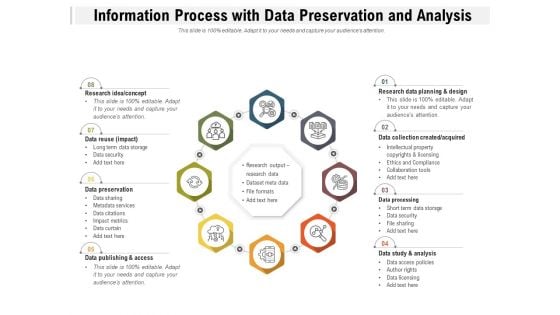
Information Process With Data Preservation And Analysis Ppt PowerPoint Presentation Styles Graphics Tutorials PDF
Presenting information process with data preservation and analysis ppt powerpoint presentation styles graphics tutorials pdf to dispense important information. This template comprises eight stages. It also presents valuable insights into the topics including research idea, concept, data reuse, data preservation, data publishing and access, research data planning and design, data collection created, acquired, data processing, data study and analysis. This is a completely customizable PowerPoint theme that can be put to use immediately. So, download it and address the topic impactfully.
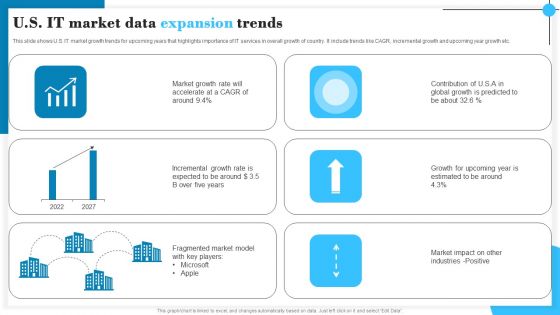
U S IT Market Data Expansion Trends Pictures PDF
This slide shows U.S. IT market growth trends for upcoming years that highlights importance of IT services in overall growth of country. It include trends like CAGR, incremental growth and upcoming year growth etc. Showcasing this set of slides titled U S IT Market Data Expansion Trends Pictures PDF. The topics addressed in these templates are Market Growth, Contribution, Incremental Growth. All the content presented in this PPT design is completely editable. Download it and make adjustments in color, background, font etc. as per your unique business setting.

Managing Customer Experience CRM Data Analysis Sales Pictures PDF
This graph or chart is linked to excel, and changes automatically based on data. Just left click on it and select Edit Data.Deliver and pitch your topic in the best possible manner with this managing customer experience crm data analysis sales pictures pdf. Use them to share invaluable insights on entities by rep, completed activities l, biz notes this month, phone calls last 3 months, activity last 3 months and impress your audience. This template can be altered and modified as per your expectations. So, grab it now.
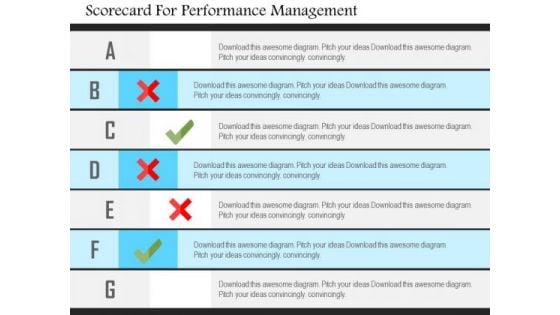
Business Diagram Scorecard For Performance Management Presentation Template
This business diagram is designed with graphics of scorecard. You may use this business slide to present performance management. This diagram provides an effective way of displaying information you can edit text, color, shade and style as per you need.
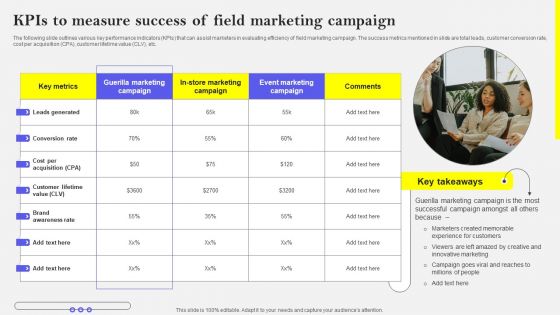
Kpis To Measure Success Of Field Marketing Campaign Themes PDF
The following slide outlines various key performance indicators KPIs that can assist marketers in evaluating efficiency of field marketing campaign. The success metrics mentioned in slide are total leads, customer conversion rate, cost per acquisition CPA, customer lifetime value CLV, etc. Explore a selection of the finest Kpis To Measure Success Of Field Marketing Campaign Themes PDF here. With a plethora of professionally designed and pre-made slide templates, you can quickly and easily find the right one for your upcoming presentation. You can use our Kpis To Measure Success Of Field Marketing Campaign Themes PDF to effectively convey your message to a wider audience. Slidegeeks has done a lot of research before preparing these presentation templates. The content can be personalized and the slides are highly editable. Grab templates today from Slidegeeks.
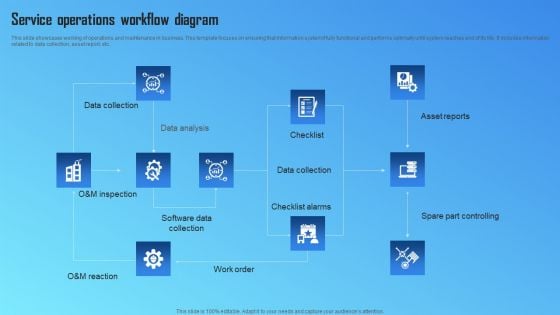
Service Operations Workflow Diagram Designs PDF
This slide showcases working of operations and maintenance in business. This template focuses on ensuring that information system if fully functional and performs optimally until system reaches end of its life. It includes information related to data collection, asset report, etc. Showcasing this set of slides titled Service Operations Workflow Diagram Designs PDF. The topics addressed in these templates are Data Collection, Data Analysis, Software Data Collection. All the content presented in this PPT design is completely editable. Download it and make adjustments in color, background, font etc. as per your unique business setting.
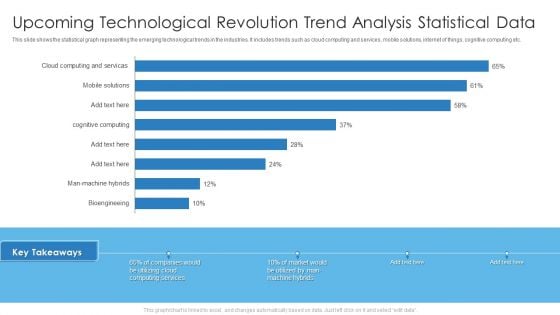
Upcoming Technological Revolution Trend Analysis Statistical Data Professional PDF
This slide shows the statistical graph representing the emerging technological trends in the industries. It includes trends such as cloud computing and services, mobile solutions, internet of things, cognitive computing etc. Deliver an awe inspiring pitch with this creative Upcoming Technological Revolution Trend Analysis Statistical Data Professional PDF bundle. Topics like Upcoming Technological Revolution, Trend Analysis Statistical Data can be discussed with this completely editable template. It is available for immediate download depending on the needs and requirements of the user.
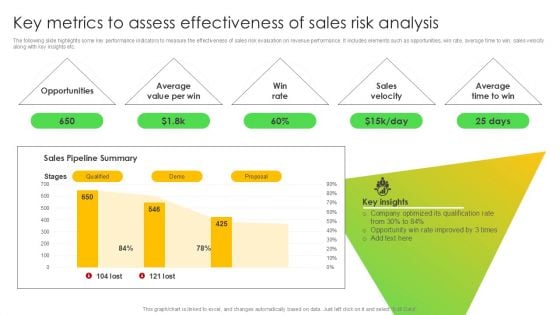
Key Metrics To Assess Effectiveness Of Sales Risk Analysis Topics PDF
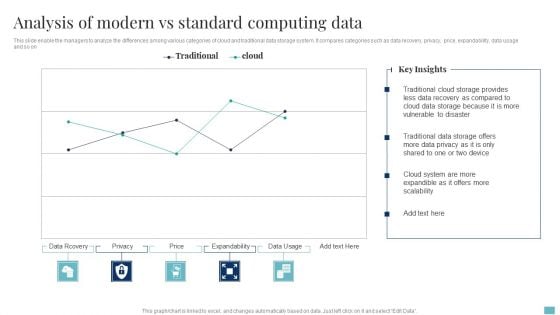
Analysis Of Modern Vs Standard Computing Data Formats PDF
Showcasing this set of slides titled Analysis Of Modern Vs Standard Computing Data Formats PDF. The topics addressed in these templates are Data Recovery, Cloud System, Device. All the content presented in this PPT design is completely editable. Download it and make adjustments in color, background, font etc. as per your unique business setting.
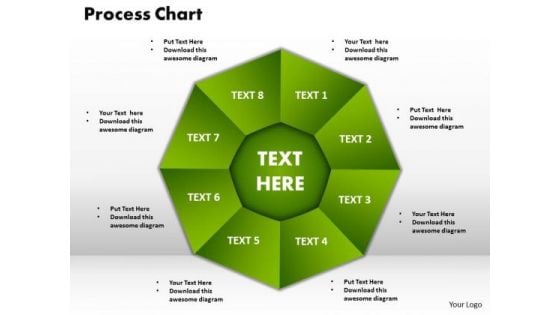
PowerPoint Slide Designs Process Chart Company Ppt Slides
PowerPoint Slide Designs process chart Company PPT Slides-This Process Chart can be used as data flow diagram to show the flow of the data as it moves from beginning process to end result.-3d, art, business, chart, circle, concept, connection, cycle, development, diagram, direction, element, environment, finance, financial, flow, graphic, group, investment, isolated, market,, movement, organization, passive income, perspective, presentation, process chart, recycle, report, sign, step, success, symbol, teamwork-PowerPoint Slide Designs process chart Company PPT Slides Excite emotions with our PowerPoint Slide Designs Process Chart Company Ppt Slides. Give them a real feel for your thoughts.
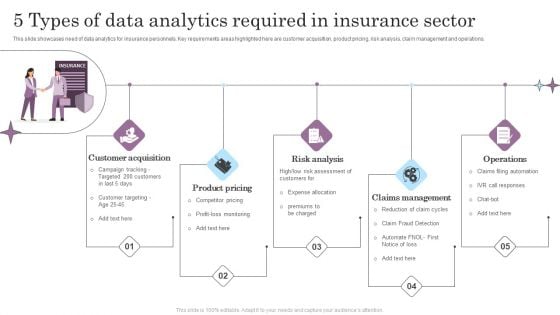
5 Types Of Data Analytics Required In Insurance Sector Background PDF
This slide showcases need of data analytics for insurance personnels. Key requirements areas highlighted here are customer acquisition, product pricing, risk analysis, claim management and operations. Presenting 5 Types Of Data Analytics Required In Insurance Sector Background PDF to dispense important information. This template comprises five stages. It also presents valuable insights into the topics including Risk Analysis, Product Pricing, Customer Acquisition. This is a completely customizable PowerPoint theme that can be put to use immediately. So, download it and address the topic impactfully.
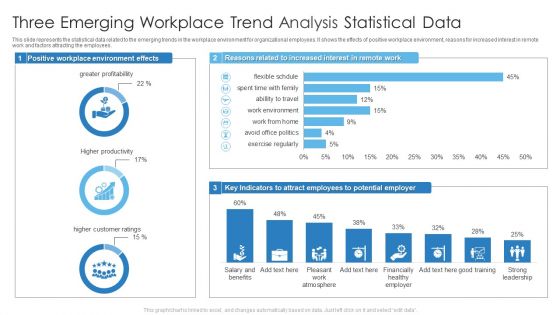
Three Emerging Workplace Trend Analysis Statistical Data Guidelines PDF
This slide represents the statistical data related to the emerging trends in the workplace environment for organizational employees. It shows the effects of positive workplace environment, reasons for increased interest in remote work and factors attracting the employees. Deliver an awe inspiring pitch with this creative Three Emerging Workplace Trend Analysis Statistical Data Guidelines PDF bundle. Topics like Three Emerging Workplace, Trend Analysis Statistical Data can be discussed with this completely editable template. It is available for immediate download depending on the needs and requirements of the user.
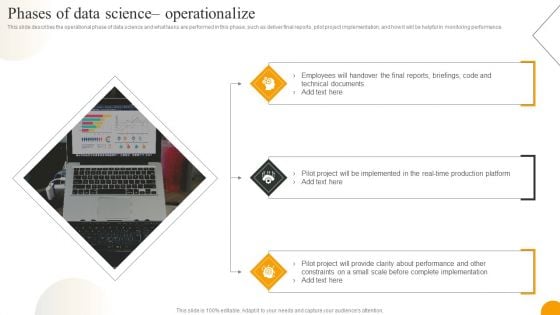
Using Data Science Technologies For Business Transformation Phases Of Data Science Operationalize Formats PDF
This slide represents the model planning phase in data science and shows its tools, such as SQL Analysis Service, R, and SAS or ACCESS. Present like a pro with Using Data Science Technologies For Business Transformation Phases Of Data Science Operationalize Formats PDF Create beautiful presentations together with your team, using our easy to use presentation slides. Share your ideas in real time and make changes on the fly by downloading our templates. So whether you are in the office, on the go, or in a remote location, you can stay in sync with your team and present your ideas with confidence. With Slidegeeks presentation got a whole lot easier. Grab these presentations today.
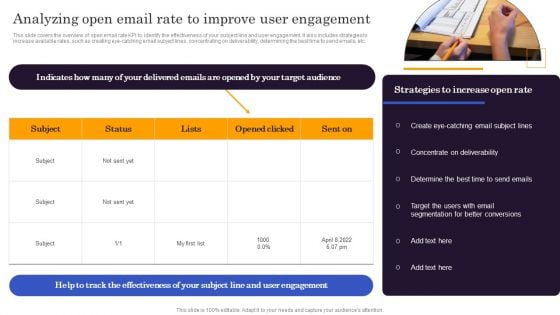
Marketers Guide To Data Analysis Optimization Analyzing Open Email Rate To Improve User Engagement Sample PDF
This slide covers the overview of open email rate KPI to identify the effectiveness of your subject line and user engagement. It also includes strategies to increase available rates, such as creating eye-catching email subject lines, concentrating on deliverability, determining the best time to send emails, etc. Whether you have daily or monthly meetings, a brilliant presentation is necessary. Marketers Guide To Data Analysis Optimization Analyzing Open Email Rate To Improve User Engagement Sample PDF can be your best option for delivering a presentation. Represent everything in detail using Marketers Guide To Data Analysis Optimization Analyzing Open Email Rate To Improve User Engagement Sample PDF and make yourself stand out in meetings. The template is versatile and follows a structure that will cater to your requirements. All the templates prepared by Slidegeeks are easy to download and edit. Our research experts have taken care of the corporate themes as well. So, give it a try and see the results.
Point Picture With Focus Consumer Ppt PowerPoint Presentation Portfolio Background PDF
Presenting point picture with focus consumer ppt powerpoint presentation portfolio background pdf to dispense important information. This template comprises three stages. It also presents valuable insights into the topics including point picture with focus consumer. This is a completely customizable PowerPoint theme that can be put to use immediately. So, download it and address the topic impactfully.

Target Point Picture With Business Group Ppt PowerPoint Presentation Infographic Template Show PDF
Presenting target point picture with business group ppt powerpoint presentation infographic template show pdf to dispense important information. This template comprises two stages. It also presents valuable insights into the topics including target point picture with business group. This is a completely customizable PowerPoint theme that can be put to use immediately. So, download it and address the topic impactfully.

Candidate Resume Screening For Job Interview Ppt PowerPoint Presentation Infographic Template Vector PDF
Presenting candidate resume screening for job interview ppt powerpoint presentation infographic template vector pdf to dispense important information. This template comprises three stages. It also presents valuable insights into the topics including candidate resume screening for job interview. This is a completely customizable PowerPoint theme that can be put to use immediately. So, download it and address the topic impactfully.

Picture Of Computer Virus Detection And Scanning Ppt PowerPoint Presentation Gallery Show PDF
Presenting picture of computer virus detection and scanning ppt powerpoint presentation gallery show pdf to dispense important information. This template comprises three stages. It also presents valuable insights into the topics including picture of computer virus detection and scanning. This is a completely customizable PowerPoint theme that can be put to use immediately. So, download it and address the topic impactfully.
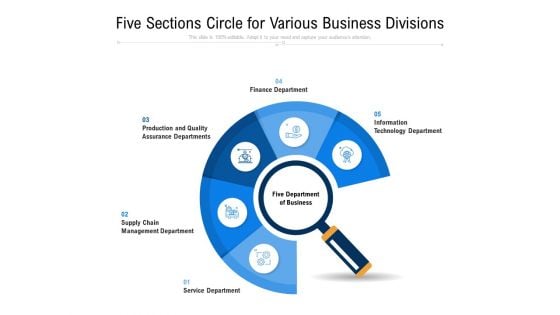
Five Sections Circle For Various Business Divisions Ppt PowerPoint Presentation File Templates PDF
Presenting five sections circle for various business divisions ppt powerpoint presentation file templates pdf to dispense important information. This template comprises five stages. It also presents valuable insights into the topics including finance, management, technology. This is a completely customizable PowerPoint theme that can be put to use immediately. So, download it and address the topic impactfully.
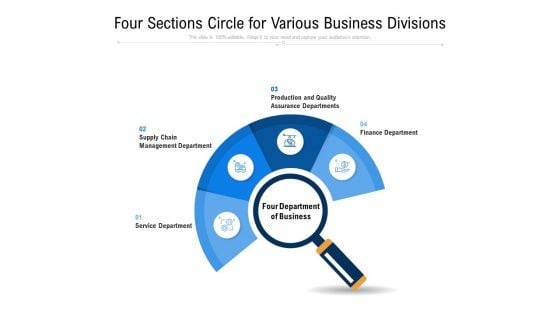
Four Sections Circle For Various Business Divisions Ppt PowerPoint Presentation File Topics PDF
Presenting four sections circle for various business divisions ppt powerpoint presentation file topics pdf to dispense important information. This template comprises four stages. It also presents valuable insights into the topics including management, service, business. This is a completely customizable PowerPoint theme that can be put to use immediately. So, download it and address the topic impactfully.

 Home
Home