Dashboard Icon
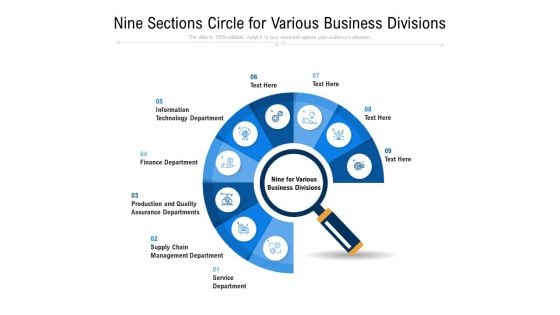
Nine Sections Circle For Various Business Divisions Ppt PowerPoint Presentation Gallery Brochure PDF
Presenting nine sections circle for various business divisions ppt powerpoint presentation gallery brochure pdf to dispense important information. This template comprises nine stages. It also presents valuable insights into the topics including management, service, business. This is a completely customizable PowerPoint theme that can be put to use immediately. So, download it and address the topic impactfully.
Vector Showing Financial Risk Mitigation Procedure Ppt PowerPoint Presentation Infographic Template Gridlines PDF
Presenting vector showing financial risk mitigation procedure ppt powerpoint presentation infographic template gridlines pdf to dispense important information. This template comprises three stages. It also presents valuable insights into the topics including vector showing financial risk mitigation procedure. This is a completely customizable PowerPoint theme that can be put to use immediately. So, download it and address the topic impactfully.
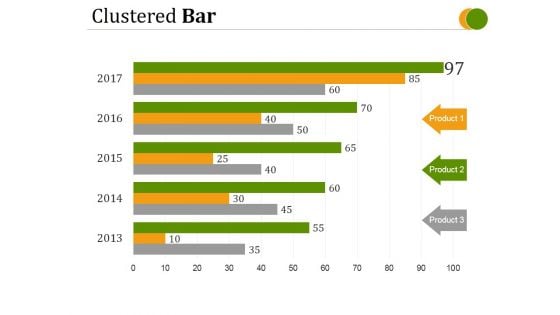
Clustered Bar Ppt PowerPoint Presentation Good
This is a clustered bar ppt powerpoint presentation good. This is a five stage process. The stages in this process are product, circular, business, marketing, bar graph.
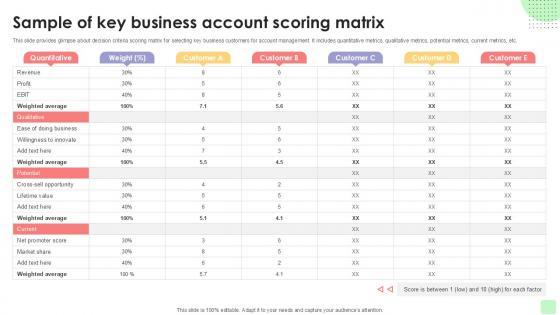
Sample Of Key Business Account Detailed Business Account PPT Presentation Strategy SS V
This slide provides glimpse about decision criteria scoring matrix for selecting key business customers for account management. It includes quantitative metrics, qualitative metrics, potential metrics, current metrics, etc. Step up your game with our enchanting Sample Of Key Business Account Detailed Business Account PPT Presentation Strategy SS V deck, guaranteed to leave a lasting impression on your audience. Crafted with a perfect balance of simplicity, and innovation, our deck empowers you to alter it to your specific needs. You can also change the color theme of the slide to mold it to your companys specific needs. Save time with our ready-made design, compatible with Microsoft versions and Google Slides. Additionally, its available for download in various formats including JPG, JPEG, and PNG. Outshine your competitors with our fully editable and customized deck. This slide provides glimpse about decision criteria scoring matrix for selecting key business customers for account management. It includes quantitative metrics, qualitative metrics, potential metrics, current metrics, etc.
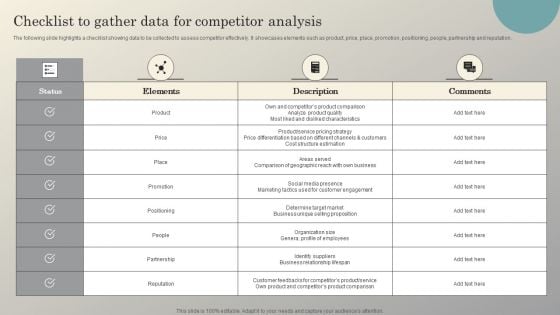
Steps To Conduct Competitor Analysis Checklist To Gather Data For Competitor Analysis Themes PDF
The following slide highlights a checklist showing data to be collected to assess competitor effectively. It showcases elements such as product, price, place, promotion, positioning, people, partnership and reputation. Explore a selection of the finest Steps To Conduct Competitor Analysis Checklist To Gather Data For Competitor Analysis Themes PDF here. With a plethora of professionally designed and pre-made slide templates, you can quickly and easily find the right one for your upcoming presentation. You can use our Steps To Conduct Competitor Analysis Checklist To Gather Data For Competitor Analysis Themes PDF to effectively convey your message to a wider audience. Slidegeeks has done a lot of research before preparing these presentation templates. The content can be personalized and the slides are highly editable. Grab templates today from Slidegeeks.
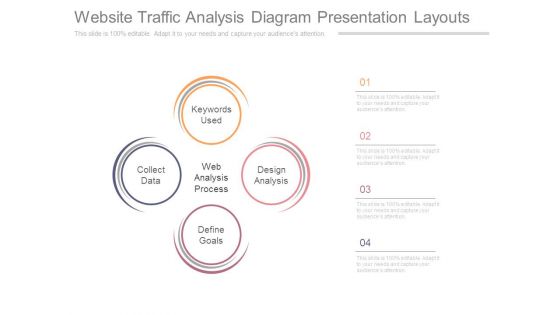
Website Traffic Analysis Diagram Presentation Layouts
This is a website traffic analysis diagram presentation layouts. This is a four stage process. The stages in this process are keywords used, design analysis, define goals, collect data, web analysis process.
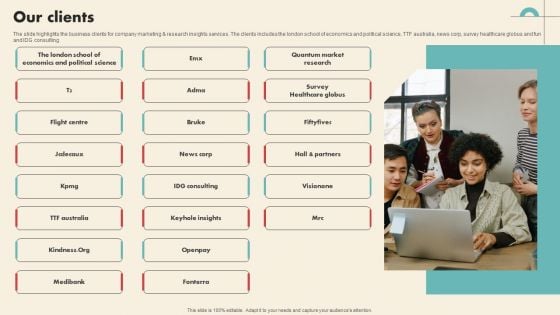
Data Driven Marketing Solutions Firm Company Profile Our Clients Themes PDF
The slide highlights the business clients for company marketing and research insights services. The clients includes the london school of economics and political science, TTF australia, news corp, survey healthcare globus and fun and IDG consulting Retrieve professionally designed Data Driven Marketing Solutions Firm Company Profile Our Clients Themes PDF to effectively convey your message and captivate your listeners. Save time by selecting pre made slideshows that are appropriate for various topics, from business to educational purposes. These themes come in many different styles, from creative to corporate, and all of them are easily adjustable and can be edited quickly. Access them as PowerPoint templates or as Google Slides themes. You do not have to go on a hunt for the perfect presentation because Slidegeeks got you covered from everywhere.
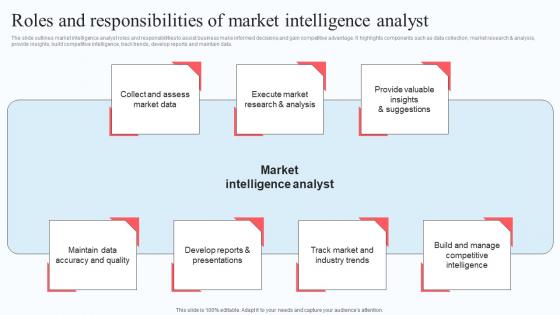
Roles And Responsibilities Of Market Execution Of Strategic Intelligence Mockup PDF
The slide outlines market intelligence analyst roles and responsibilities to assist business make informed decisions and gain competitive advantage. It highlights components such as data collection, market research and analysis, provide insights, build competitive intelligence, track trends, develop reports and maintain data. If you are looking for a format to display your unique thoughts, then the professionally designed Roles And Responsibilities Of Market Execution Of Strategic Intelligence Mockup PDF is the one for you. You can use it as a Google Slides template or a PowerPoint template. Incorporate impressive visuals, symbols, images, and other charts. Modify or reorganize the text boxes as you desire. Experiment with shade schemes and font pairings. Alter, share or cooperate with other people on your work. Download Roles And Responsibilities Of Market Execution Of Strategic Intelligence Mockup PDF and find out how to give a successful presentation. Present a perfect display to your team and make your presentation unforgettable. The slide outlines market intelligence analyst roles and responsibilities to assist business make informed decisions and gain competitive advantage. It highlights components such as data collection, market research and analysis, provide insights, build competitive intelligence, track trends, develop reports and maintain data.

Marketers Guide To Data Analysis And Optimization Ppt PowerPoint Presentation Complete Deck With Slides
With well-researched insights and carefully constructed design, this Marketers Guide To Data Analysis And Optimization Ppt PowerPoint Presentation Complete Deck With Slides is all that you need for your next business meeting with clients and win them over. Add your data to graphs, charts, and tables that are already ready to display it with stunning visuals and help your audience recall your work. With this PPT Complete Deck, you will be able to display your knowledge of the subject as well as your skills as a communicator. Share your ideas and make an impact on the audience with this PowerPoint Layout and ensure that you are known as a presentation professional. Download this PPT Template Bundle to create the most interesting presentation anyone has ever seen.
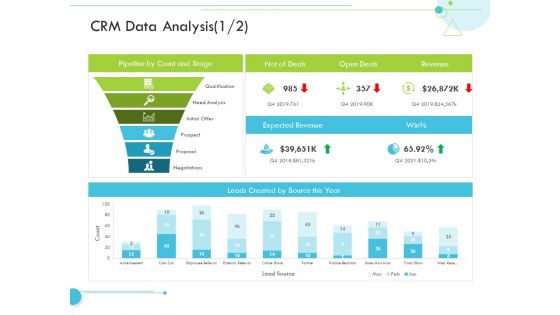
CRM Data Analysis Revenue Customer Relationship Management CRM Infographics PDF
Deliver an awe inspiring pitch with this creative crm data analysis revenue customer relationship management crm infographics pdf bundle. Topics like expected revenue, source can be discussed with this completely editable template. It is available for immediate download depending on the needs and requirements of the user.
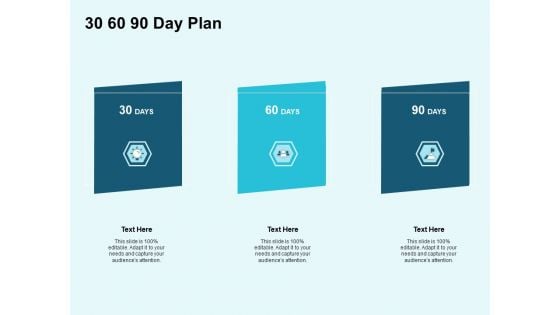
Star Performer 30 60 90 Day Plan Ppt Infographic Template Gridlines PDF
Presenting this set of slides with name star performer 30 60 90 day plan ppt infographic template gridlines pdf. This is a three stage process. The stages in this process are 30 60 90 days plan. This is a completely editable PowerPoint presentation and is available for immediate download. Download now and impress your audience.
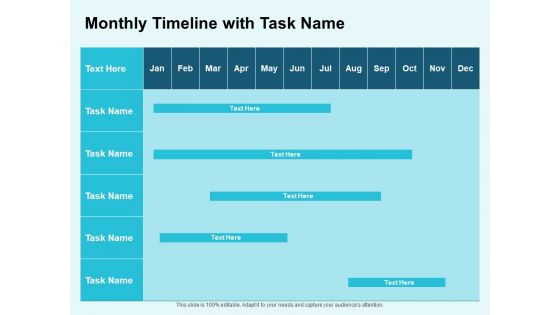
Star Performer Monthly Timeline With Task Name Ppt Infographic Template Mockup PDF
Presenting this set of slides with name star performer monthly timeline with task name ppt infographic template mockup pdf. The topics discussed in these slides are monthly timeline with task name. This is a completely editable PowerPoint presentation and is available for immediate download. Download now and impress your audience.
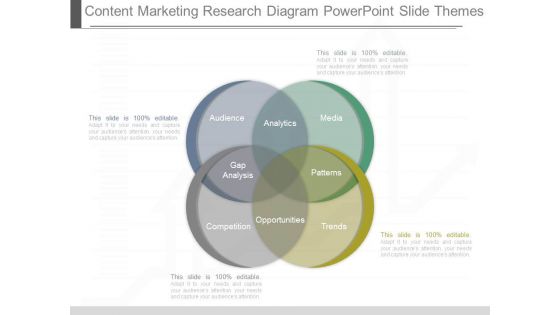
Content Marketing Research Diagram Powerpoint Slide Themes
This is a content marketing research diagram powerpoint slide themes. This is a four stage process. The stages in this process are audience, analytics, media, gap analysis, patterns, competition, opportunities, trends.
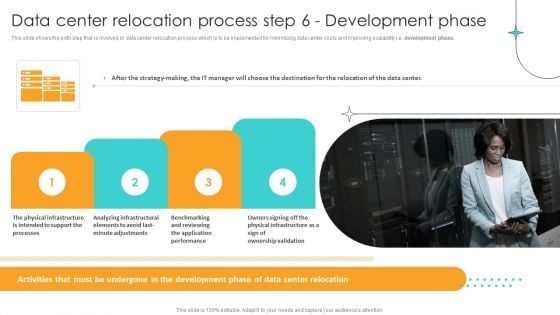
Cost Saving Benefits Of Implementing Data Center Data Center Relocation Process Step 6 Development Phase Infographics PDF
This slide shows the sixth step that is involved in data center relocation process which is to be implemented for minimizing data center costs and improving scalability i.e. development phase. Crafting an eye catching presentation has never been more straightforward. Let your presentation shine with this tasteful yet straightforward Cost Saving Benefits Of Implementing Data Center Data Center Relocation Process Step 6 Development Phase Infographics PDF template. It offers a minimalistic and classy look that is great for making a statement. The colors have been employed intelligently to add a bit of playfulness while still remaining professional. Construct the ideal Cost Saving Benefits Of Implementing Data Center Data Center Relocation Process Step 6 Development Phase Infographics PDF that effortlessly grabs the attention of your audience Begin now and be certain to wow your customers.
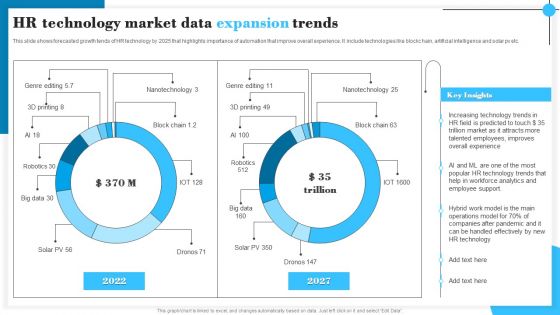
HR Technology Market Data Expansion Trends Information PDF
This slide shows forecasted growth tends of HR technology by 2025 that highlights importance of automation that improve overall experience. It include technologies like blockc hain, artificial intelligence and solar pv etc. Pitch your topic with ease and precision using this HR Technology Market Data Expansion Trends Information PDF. This layout presents information on Increasing Technology, Talented Employees, Employee Support. It is also available for immediate download and adjustment. So, changes can be made in the color, design, graphics or any other component to create a unique layout.
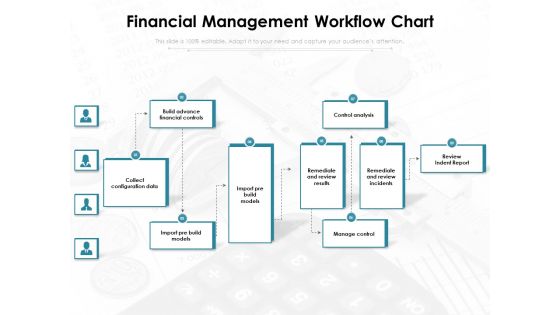
Financial Management Workflow Chart Ppt PowerPoint Presentation Infographics Mockup PDF
Presenting this set of slides with name financial management workflow chart ppt powerpoint presentation infographics mockup pdf. This is a nine stage process. The stages in this process are build advance financial controls, control analysis review, indent report remediate and review incidents, remediate and review results, import pre build models, import pre build models, collect configuration data, manage control. This is a completely editable PowerPoint presentation and is available for immediate download. Download now and impress your audience.
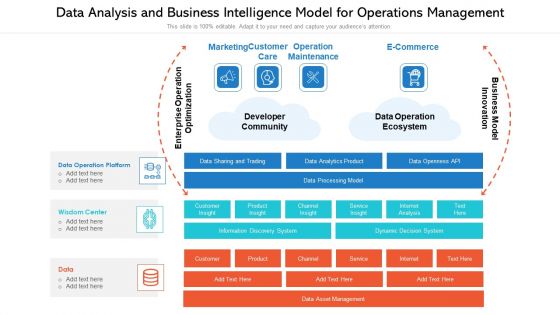
Data Analysis And Business Intelligence Model For Operations Management Ppt PowerPoint Presentation Rules PDF
Presenting data analysis and business intelligence model for operations management ppt powerpoint presentation rules pdf to dispense important information. This template comprises three stages. It also presents valuable insights into the topics including developer community, operation maintenance, data operation ecosystem . This is a completely customizable PowerPoint theme that can be put to use immediately. So, download it and address the topic impactfully.
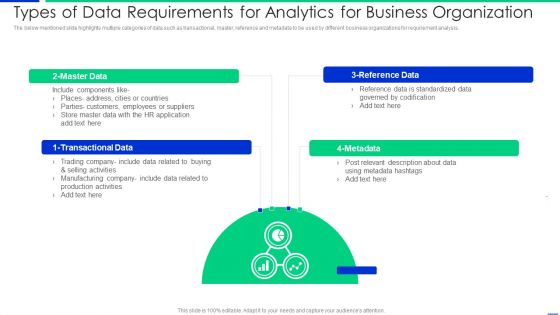
Types Of Data Requirements For Analytics For Business Organization Microsoft PDF
The below mentioned slide highlights multiple categories of data such as transactional, master, reference and metadata to be used by different business organizations for requirement analysis. Presenting types of data requirements for analytics for business organization microsoft pdf to dispense important information. This template comprises four stages. It also presents valuable insights into the topics including data, suppliers, application. This is a completely customizable PowerPoint theme that can be put to use immediately. So, download it and address the topic impactfully.

Types Of Search Engines With Human Powered And Hybrid Ppt PowerPoint Presentation Infographics Objects PDF
Presenting types of search engines with human powered and hybrid ppt powerpoint presentation infographics objects pdf to dispense important information. This template comprises one stages. It also presents valuable insights into the topics including crawler based search engines, human powered directories, hybrid search engines, meta search engines. This is a completely customizable PowerPoint theme that can be put to use immediately. So, download it and address the topic impactfully.
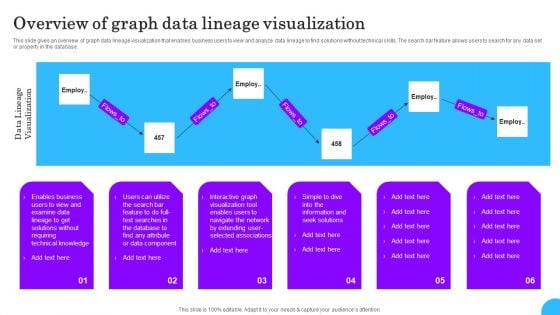
Comprehensive Analysis Of Different Data Lineage Classification Overview Graph Data Lineage Visualization Diagrams PDF
This slide gives an overview of graph data lineage visualization that enables business users to view and analyze data lineage to find solutions without technical skills. The search bar feature allows users to search for any data set or property in the database. Create an editable Comprehensive Analysis Of Different Data Lineage Classification Overview Graph Data Lineage Visualization Diagrams PDF that communicates your idea and engages your audience. Whether you are presenting a business or an educational presentation, pre designed presentation templates help save time. Comprehensive Analysis Of Different Data Lineage Classification Overview Graph Data Lineage Visualization Diagrams PDF is highly customizable and very easy to edit, covering many different styles from creative to business presentations. Slidegeeks has creative team members who have crafted amazing templates. So, go and get them without any delay.
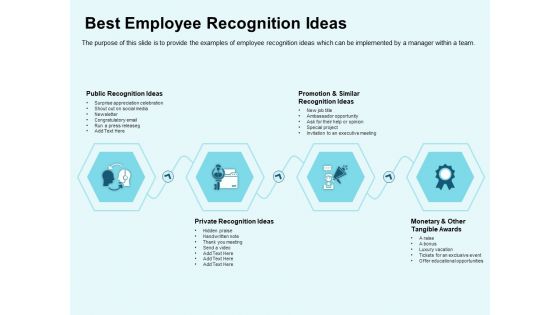
Star Performer Best Employee Recognition Ideas Ppt Infographics Clipart Images PDF
Presenting this set of slides with name star performer best employee recognition ideas ppt infographics clipart images pdf. This is a four stage process. The stages in this process are public recognition ideas, private recognition ideas, promotion and similar recognition ideas, monetary and other tangible awards. This is a completely editable PowerPoint presentation and is available for immediate download. Download now and impress your audience.
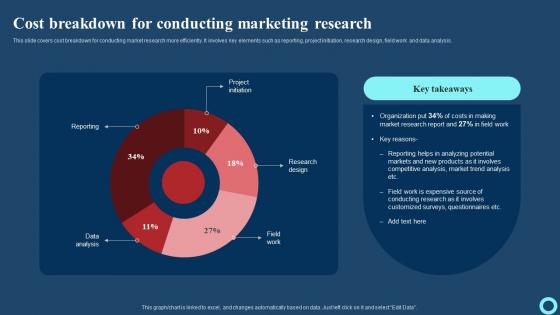
Cost Breakdown For Conducting Marketing Research Effective Strategies To Enhance Graphics Pdf
This slide covers cost breakdown for conducting market research more efficiently. It involves key elements such as reporting, project initiation, research design, field work and data analysis. Take your projects to the next level with our ultimate collection of Cost Breakdown For Conducting Marketing Research Effective Strategies To Enhance Graphics Pdf Slidegeeks has designed a range of layouts that are perfect for representing task or activity duration, keeping track of all your deadlines at a glance. Tailor these designs to your exact needs and give them a truly corporate look with your own brand colors they well make your projects stand out from the rest. This slide covers cost breakdown for conducting market research more efficiently. It involves key elements such as reporting, project initiation, research design, field work and data analysis.
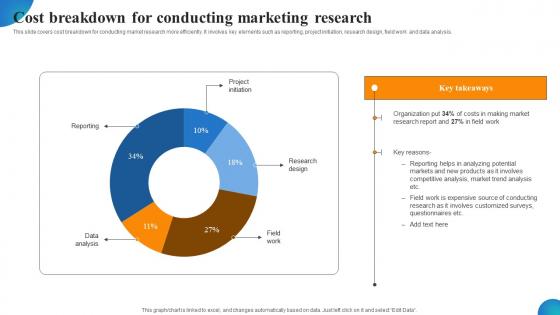
Cost Breakdown For Conducting Marketing Research MDSS For Enhanced Summary Pdf
This slide covers cost breakdown for conducting market research more efficiently. It involves key elements such as reporting, project initiation, research design, field work and data analysis. Want to ace your presentation in front of a live audience Our Cost Breakdown For Conducting Marketing Research MDSS For Enhanced Summary Pdf can help you do that by engaging all the users towards you. Slidegeeks experts have put their efforts and expertise into creating these impeccable powerpoint presentations so that you can communicate your ideas clearly. Moreover, all the templates are customizable, and easy-to-edit and downloadable. Use these for both personal and commercial use. This slide covers cost breakdown for conducting market research more efficiently. It involves key elements such as reporting, project initiation, research design, field work and data analysis.
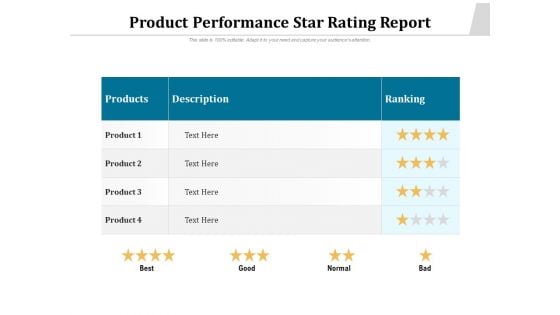
Product Performance Star Rating Report Ppt PowerPoint Presentation Portfolio Visual Aids PDF
Pitch your topic with ease and precision using this product performance star rating report ppt powerpoint presentation portfolio visual aids pdf. This layout presents information on products, description, ranking, best, good, normal, bad. It is also available for immediate download and adjustment. So, changes can be made in the color, design, graphics or any other component to create a unique layout.
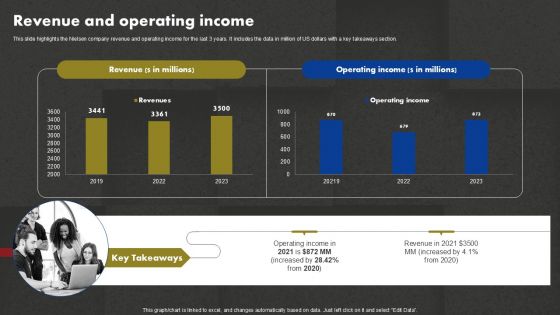
Data And Customer Analysis Company Outline Revenue And Operating Income Diagrams PDF

Technologies To Ensure Data Protection And Privacy Background PDF
The following slide showcases some technologies to administer organizational data privacy and security concerns. It includes elements such as data encryption, change management and auditing, user and behavior analytics UEBA, backup and recovery etc. Presenting Technologies To Ensure Data Protection And Privacy Background PDF to dispense important information. This template comprises four stages. It also presents valuable insights into the topics including Data Encryption, Change Management And Auditing, Backup And Recovery. This is a completely customizable PowerPoint theme that can be put to use immediately. So, download it and address the topic impactfully.
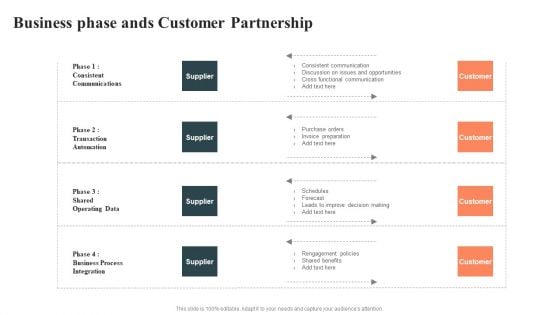
Business Phase Ands Customer Partnership Formats PDF
Pitch your topic with ease and precision using this Business Phase Ands Customer Partnership Formats PDF. This layout presents information on Supplier, Cross Functional Communication, Operating Data. It is also available for immediate download and adjustment. So, changes can be made in the color, design, graphics or any other component to create a unique layout.
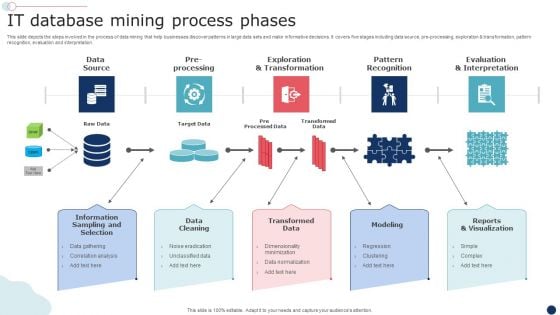
IT Database Mining Process Phases Demonstration PDF
Showcasing this set of slides titled IT Database Mining Process Phases Demonstration PDF. The topics addressed in these templates are Data Source, Exploration Transformation, Pattern Recognition. All the content presented in this PPT design is completely editable. Download it and make adjustments in color, background, font etc. as per your unique business setting.
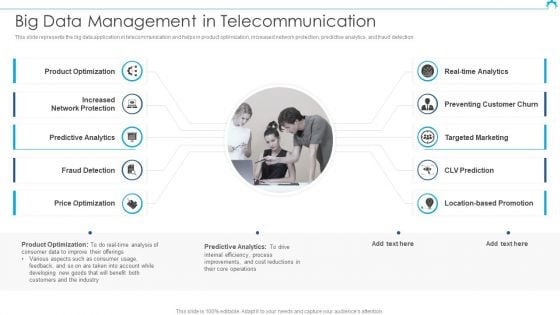
Big Data Architect Big Data Management In Telecommunication Themes PDF
This slide represents the big data application in telecommunication and helps in product optimization, increased network protection, predictive analytics, and fraud detection.This is a Big Data Architect Big Data Management In Telecommunication Themes PDF template with various stages. Focus and dispense information on two stages using this creative set, that comes with editable features. It contains large content boxes to add your information on topics like Product Optimization, Preventing Customer, Targeted Marketing. You can also showcase facts, figures, and other relevant content using this PPT layout. Grab it now.
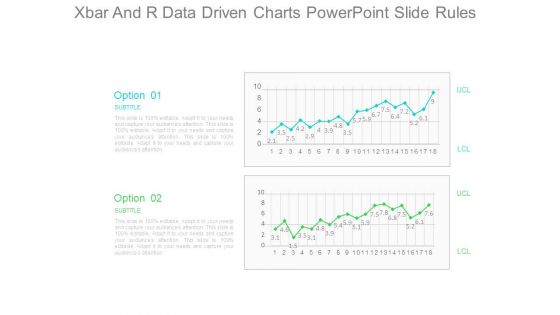
Xbar And R Data Driven Charts Powerpoint Slide Rules
This is a xbar and r data driven charts powerpoint slide rules. This is a two stage process. The stages in this process are option, subtitle, lcl, ucl.
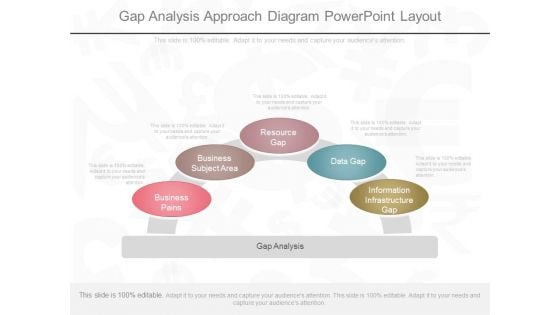
Gap Analysis Approach Diagram Powerpoint Layout
This is a gap analysis approach diagram powerpoint layout. This is a five stage process. The stages in this process are information infrastructure gap, data gap, resource gap, business subject area, business pains.
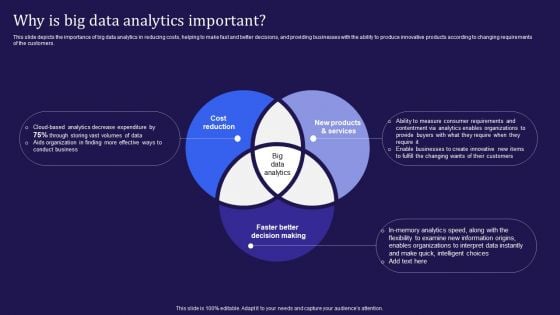
Big Data Analytics Lifecycle Why Is Big Data Analytics Important Ppt Summary Example Topics PDF
This slide depicts the importance of big data analytics in reducing costs, helping to make fast and better decisions, and providing businesses with the ability to produce innovative products according to changing requirements of the customers. Do you have an important presentation coming up Are you looking for something that will make your presentation stand out from the rest Look no further than Big Data Analytics Lifecycle Why Is Big Data Analytics Important Ppt Summary Example Topics PDF. With our professional designs, you can trust that your presentation will pop and make delivering it a smooth process. And with Slidegeeks, you can trust that your presentation will be unique and memorable. So why wait Grab Big Data Analytics Lifecycle Why Is Big Data Analytics Important Ppt Summary Example Topics PDF today and make your presentation stand out from the rest.
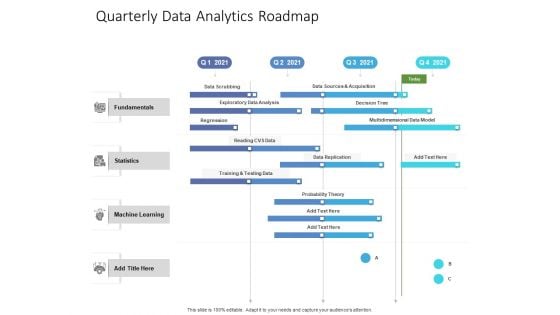
Quarterly Data Analytics Roadmap Pictures
Introducing our quarterly data analytics roadmap pictures. This PPT presentation is Google Slides compatible, therefore, you can share it easily with the collaborators for measuring the progress. Also, the presentation is available in both standard screen and widescreen aspect ratios. So edit the template design by modifying the font size, font type, color, and shapes as per your requirements. As this PPT design is fully editable it can be presented in PDF, JPG and PNG formats.
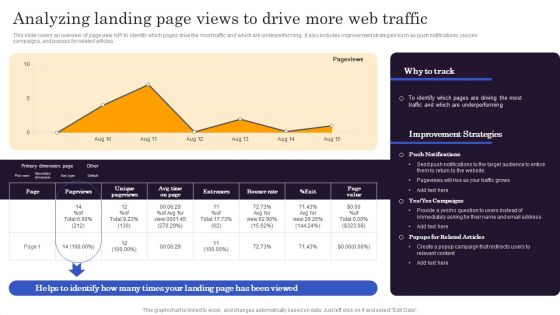
Marketers Guide To Data Analysis Optimization Analyzing Landing Page Views To Drive More Web Traffic Rules PDF
This slide covers an overview of page view KPI to identify which pages drive the most traffic and which are underperforming. It also includes improvement strategies such as push notifications, yes yes campaigns, and popups for related articles. Do you have an important presentation coming up Are you looking for something that will make your presentation stand out from the rest Look no further than Marketers Guide To Data Analysis Optimization Analyzing Landing Page Views To Drive More Web Traffic Rules PDF. With our professional designs, you can trust that your presentation will pop and make delivering it a smooth process. And with Slidegeeks, you can trust that your presentation will be unique and memorable. So why wait Grab Marketers Guide To Data Analysis Optimization Analyzing Landing Page Views To Drive More Web Traffic Rules PDF today and make your presentation stand out from the rest.
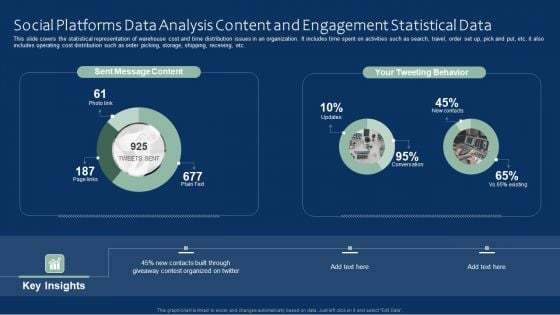
Social Platforms Data Analysis Content And Engagement Statistical Data Microsoft PDF
This slide covers the statistical representation of warehouse cost and time distribution issues in an organization. It includes time spent on activities such as search, travel, order set up, pick and put, etc. it also includes operating cost distribution such as order picking, storage, shipping, receiving, etc. Showcasing this set of slides titled Social Platforms Data Analysis Content And Engagement Statistical Data Microsoft PDF. The topics addressed in these templates are Social Platforms Data, Analysis Content, Engagement Statistical Data. All the content presented in this PPT design is completely editable. Download it and make adjustments in color, background, font etc. as per your unique business setting.
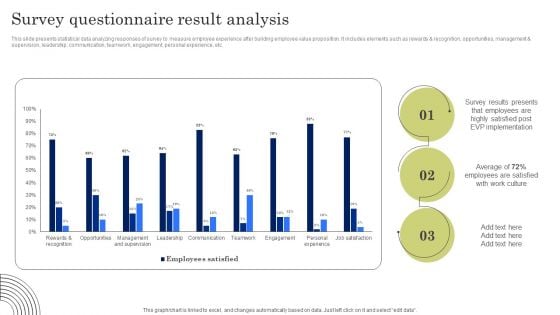
Survey Questionnaire Result Analysis Themes PDF
This slide presents statistical data analyzing responses of survey to measure employee experience after building employee value proposition. It includes elements such as rewards and recognition, opportunities, management and supervision, leadership, communication, teamwork, engagement, personal experience, etc. Boost your pitch with our creative Survey Questionnaire Result Analysis Themes PDF. Deliver an awe-inspiring pitch that will mesmerize everyone. Using these presentation templates you will surely catch everyones attention. You can browse the ppts collection on our website. We have researchers who are experts at creating the right content for the templates. So you do not have to invest time in any additional work. Just grab the template now and use them.
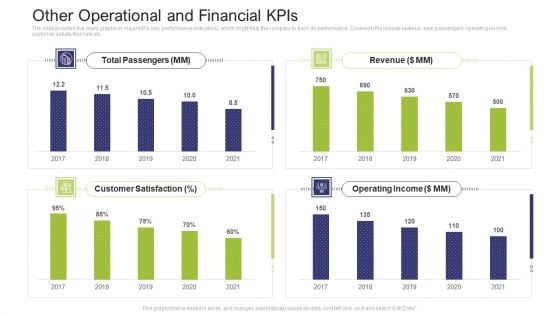
Other Operational And Financial Kpis Inspiration PDF
The slide provides five years graphs of major KPIs key performance indicators, which might help the company to track its performance. Covered KPIs include revenue, total passengers, operating income, customer satisfaction rate etc.Deliver an awe-inspiring pitch with this creative other operational and financial KPIs inspiration pdf. bundle. Topics like total passengers, operating income, revenue, 2017 to 2021 can be discussed with this completely editable template. It is available for immediate download depending on the needs and requirements of the user.
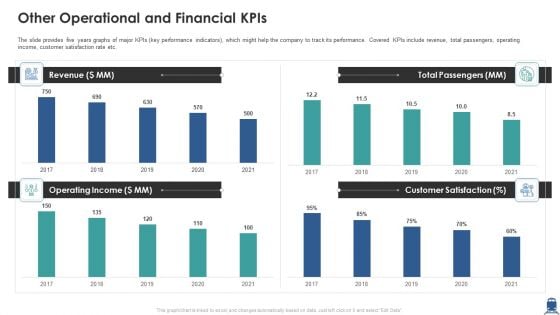
Other Operational And Financial Kpis Information PDF
The slide provides five years graphs of major KPIs key performance indicators, which might help the company to track its performance. Covered KPIs include revenue, total passengers, operating income, customer satisfaction rate etc. Deliver an awe inspiring pitch with this creative other operational and financial kpis information pdf bundle. Topics like revenue, operating income, customer satisfaction can be discussed with this completely editable template. It is available for immediate download depending on the needs and requirements of the user.
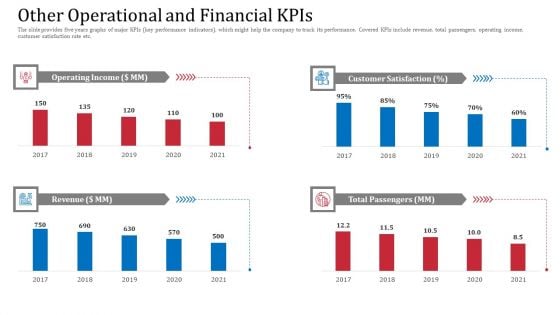
Other Operational And Financial Kpis Demonstration PDF
The slide provides five years graphs of major KPIs key performance indicators, which might help the company to track its performance. Covered KPIs include revenue, total passengers, operating income, customer satisfaction rate etc.Deliver and pitch your topic in the best possible manner with this other operational and financial kpis demonstration pdf. Use them to share invaluable insights on customer satisfaction, operating income, total passengers and impress your audience. This template can be altered and modified as per your expectations. So, grab it now.
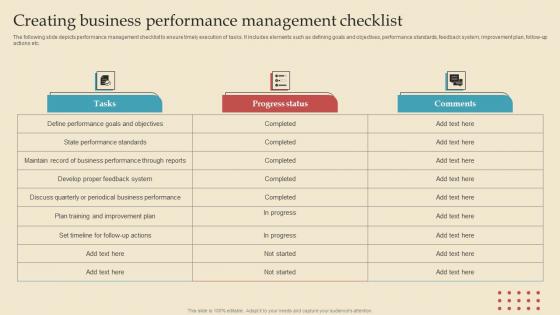
Creating Business Performance Describing Business Performance Administration Goals Infographics Pdf
The following slide depicts performance management checklist to ensure timely execution of tasks. It includes elements such as defining goals and objectives, performance standards, feedback system, improvement plan, follow up actions etc. Retrieve professionally designed Creating Business Performance Describing Business Performance Administration Goals Infographics Pdf to effectively convey your message and captivate your listeners. Save time by selecting pre made slideshows that are appropriate for various topics, from business to educational purposes. These themes come in many different styles, from creative to corporate, and all of them are easily adjustable and can be edited quickly. Access them as PowerPoint templates or as Google Slides themes. You do not have to go on a hunt for the perfect presentation because Slidegeeks got you covered from everywhere. The following slide depicts performance management checklist to ensure timely execution of tasks. It includes elements such as defining goals and objectives, performance standards, feedback system, improvement plan, follow up actions etc.
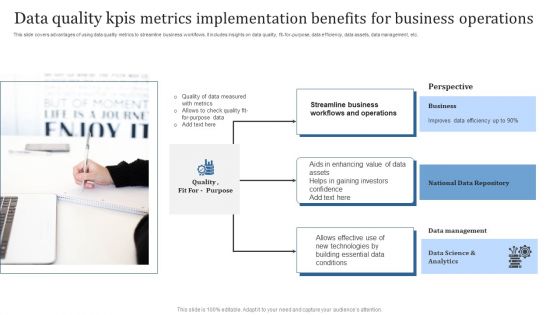
Data Quality Kpis Metrics Implementation Benefits For Business Operations Formats PDF
This slide covers advantages of using data quality metrics to streamline business workflows. It includes insights on data quality, fit-for-purpose, data efficiency, data assets, data management, etc. Presenting Data Quality Kpis Metrics Implementation Benefits For Business Operations Formats PDF to dispense important information. This template comprises Three stages. It also presents valuable insights into the topics including Business, National Data Repository, Data Management. This is a completely customizable PowerPoint theme that can be put to use immediately. So, download it and address the topic impactfully.
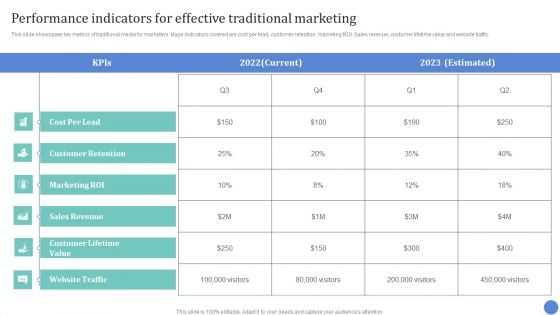
Conventional Media Channels Performance Indicators For Effective Traditional Marketing Themes PDF
This slide showcases key metrics of traditional media for marketers. Major indicators covered are cost per lead, customer retention, marketing ROI. Sales revenue, customer lifetime value and website traffic. From laying roadmaps to briefing everything in detail, our templates are perfect for you. You can set the stage with your presentation slides. All you have to do is download these easy to edit and customizable templates. Conventional Media Channels Performance Indicators For Effective Traditional Marketing Themes PDF will help you deliver an outstanding performance that everyone would remember and praise you for. Do download this presentation today.
In Depth Implementation Guide For Healthcare Analytics Ppt Example Data Analytics CD V
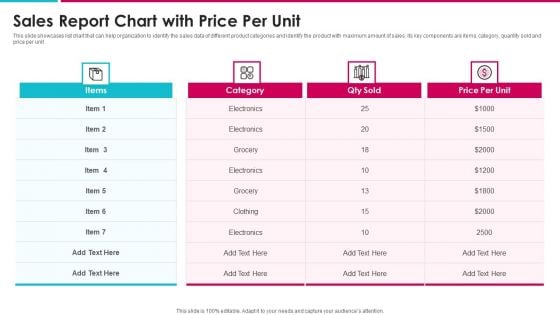
Sales Report Chart With Price Per Unit Information PDF
This slide showcases list chart that can help organization to identify the sales data of different product categories and identify the product with maximum amount of sales. Its key components are items, category, quantity sold and price per unit Showcasing this set of slides titled sales report chart with price per unit information pdf. The topics addressed in these templates are sales report chart with price per unit. All the content presented in this PPT design is completely editable. Download it and make adjustments in color, background, font etc. as per your unique business setting.
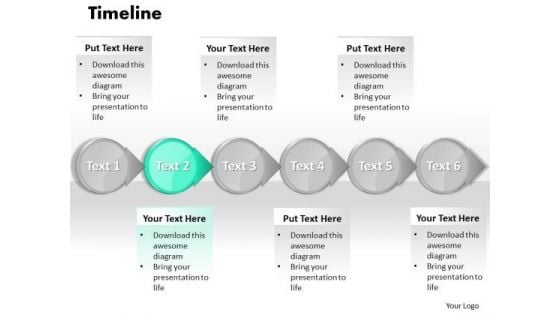
Ppt PowerPoint Slide Numbers A Procedure Or Timeline 2007 Templates
PPT powerpoint slide numbers a procedure or timeline 2007 Templates-This image represents the concept of structured analysis technique that employs a set of visual representations of the data that moves through the organization. This template is specifically designed to highlight you points. Organize your thoughts and illuminate your ideas accordingly-PPT powerpoint slide numbers a procedure or timeline 2007 Templates-Account, Arrow, Arrows, Away, Box, Business, Chart, Choice, Choose, Concept, Concepts, Consultation, Corporate, Design, Diagram, Direction, Elements, Flow, Follow, Follows, Future, Group, Grow, Increase, Lines, Many, Month, Move, Past, Period, Phase, Project, Report, Rise, Row, Step, Success, Text, Time, Timeline, Today, Up, Way, Ways, Work, Year Close deals with our Ppt PowerPoint Slide Numbers A Procedure Or Timeline 2007 Templates. Download without worries with our money back guaranteee.
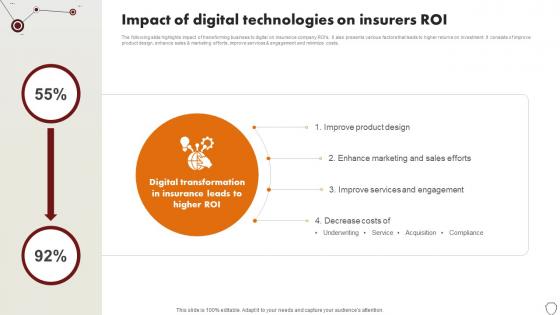
Technology Trends In Online Insurance Impact Of Digital Technologies On Insurers Roi
The following slide highlights impact of transforming business to digital on insurance company ROIs. It also presents various factors that leads to higher returns on investment. It consists of improve product design, enhance sales and marketing efforts, improve services and engagement and minimize costs. Are you searching for a Technology Trends In Online Insurance Impact Of Digital Technologies On Insurers Roi that is uncluttered, straightforward, and original Its easy to edit, and you can change the colors to suit your personal or business branding. For a presentation that expresses how much effort you have put in, this template is ideal With all of its features, including tables, diagrams, statistics, and lists, its perfect for a business plan presentation. Make your ideas more appealing with these professional slides. Download Technology Trends In Online Insurance Impact Of Digital Technologies On Insurers Roi from Slidegeeks today. The following slide highlights impact of transforming business to digital on insurance company ROIs. It also presents various factors that leads to higher returns on investment. It consists of improve product design, enhance sales and marketing efforts, improve services and engagement and minimize costs.
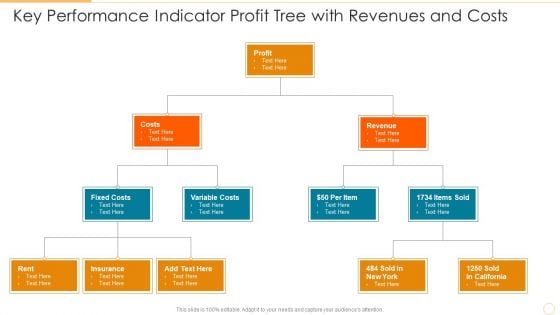
Key Performance Indicator Profit Tree With Revenues And Costs Template PDF
Presenting key performance indicator profit tree with revenues and costs template pdf to dispense important information. This template comprises three stages. It also presents valuable insights into the topics including costs, profit, revenue. This is a completely customizable PowerPoint theme that can be put to use immediately. So, download it and address the topic impactfully.
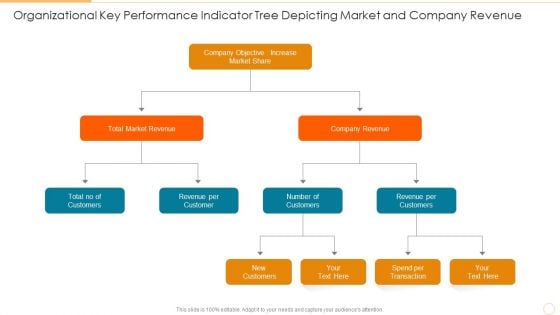
Organizational Key Performance Indicator Tree Depicting Market And Company Revenue Graphics PDF
Presenting organizational key performance indicator tree depicting market and company revenue graphics pdf to dispense important information. This template comprises three stages. It also presents valuable insights into the topics including total market revenue, company revenue, increase market share. This is a completely customizable PowerPoint theme that can be put to use immediately. So, download it and address the topic impactfully.
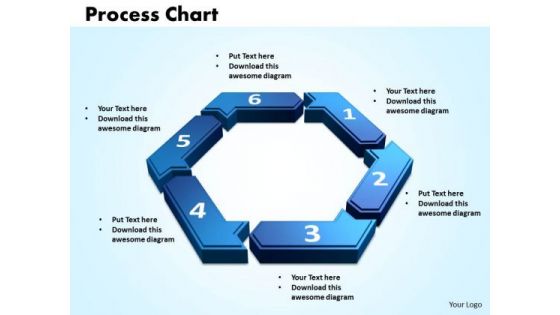
PowerPoint Designs Process Chart Strategy Ppt Slide
PowerPoint Designs process Chart Strategy PPT Slide-This Process Chart can be used as data flow diagram to show the flow of the data as it moves from beginning process to end result.-3d, arrow, art, business, chart, circle, concept, connection, cycle, development, diagram, direction, element, environment, finance, financial, flow, graphic, group, investment, isolated, market,, movement, organization, passive income, perspective, presentation, process chart, recycle, report, sign, step, success, symbol, teamwork-PowerPoint Designs process Chart Strategy PPT Slide Our PowerPoint Designs Process Chart Strategy Ppt Slide have a glossy look. Your thoughts will also acquire a sheen.
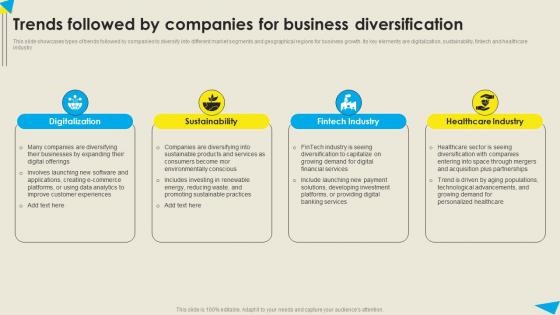
Trends Followed By Companies For Business Strategic Diversification Plan Professional PDF
This slide showcases types of trends followed by companies to diversify into different market segments and geographical regions for business growth. Its key elements are digitalization, sustainability, fintech and healthcare industry. Whether you have daily or monthly meetings, a brilliant presentation is necessary. Trends Followed By Companies For Business Strategic Diversification Plan Professional PDF can be your best option for delivering a presentation. Represent everything in detail using Trends Followed By Companies For Business Strategic Diversification Plan Professional PDF and make yourself stand out in meetings. The template is versatile and follows a structure that will cater to your requirements. All the templates prepared by Slidegeeks are easy to download and edit. Our research experts have taken care of the corporate themes as well. So, give it a try and see the results. This slide showcases types of trends followed by companies to diversify into different market segments and geographical regions for business growth. Its key elements are digitalization, sustainability, fintech and healthcare industry.
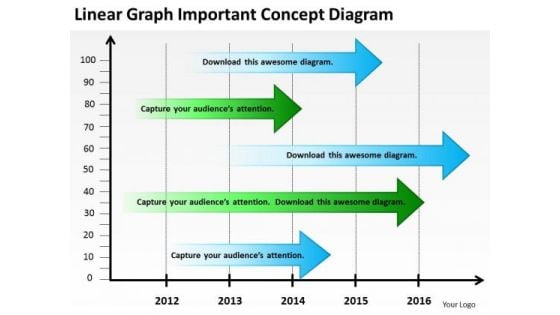
Graph Important Concept Diagram Business Plan Template PowerPoint Templates
We present our graph important concept diagram business plan template PowerPoint templates.Use our Arrows PowerPoint Templates because Watching this your Audience will Grab their eyeballs, they wont even blink. Present our Finance PowerPoint Templates because Our PowerPoint Templates and Slides will Activate the energies of your audience. Get their creative juices flowing with your words. Download our Marketing PowerPoint Templates because Our PowerPoint Templates and Slides are topically designed to provide an attractive backdrop to any subject. Use our Signs PowerPoint Templates because Our PowerPoint Templates and Slides are specially created by a professional team with vast experience. They diligently strive to come up with the right vehicle for your brilliant Ideas. Use our Business PowerPoint Templates because It will get your audience in sync.Use these PowerPoint slides for presentations relating to chart, bar, data, pie, percent, forecasting, economy, white, achievement, future, business, arrow, sign, line, symbol, diagram, styles, finance, stock, report, marketing, gray, analyzing, shape, abstract, graph, modern, economic, up, money, solution, design, making, growth, moving, grid, progress, artistic, profit, inspiration, background, investment, successful, financial, concepts, structure, ideas. The prominent colors used in the PowerPoint template are Blue, Green, Black. Advertise yourbelief in your ability. Our Graph Important Concept Diagram Business Plan Template PowerPoint Templates will help back up your boast.
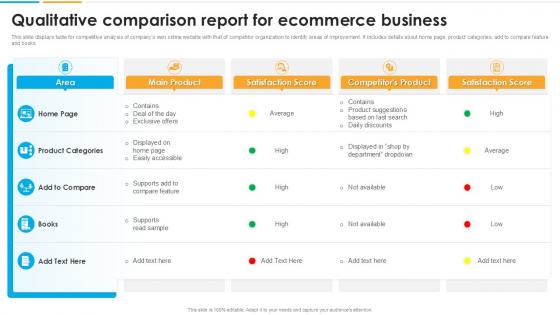
Qualitative Comparison Report For Ecommerce Business
From laying roadmaps to briefing everything in detail, our templates are perfect for you. You can set the stage with your presentation slides. All you have to do is download these easy-to-edit and customizable templates. Qualitative Comparison Report For Ecommerce Business will help you deliver an outstanding performance that everyone would remember and praise you for. Do download this presentation today. This template focuses on presenting a qualitative comparison of different aspects of e-commerce businesses, such as customer experience, product offerings, and marketing strategies. It includes detailed comparison charts and narrative sections to support business analysis. Useful for stakeholders, strategists, and marketers to identify competitive advantages and areas for improvement.
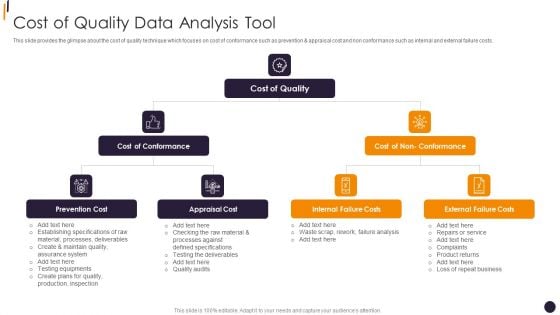
PMP Tools Cost Of Quality Data Analysis Tool Infographics PDF
This slide provides the glimpse about the cost of quality technique which focuses on cost of conformance such as prevention and appraisal cost and non conformance such as internal and external failure costs.Presenting PMP Tools Cost Of Quality Data Analysis Tool Infographics PDF to provide visual cues and insights. Share and navigate important information on six stages that need your due attention. This template can be used to pitch topics like Cost Of Conformance, Appraisal Cost, Prevention Cost In addtion, this PPT design contains high resolution images, graphics, etc, that are easily editable and available for immediate download.
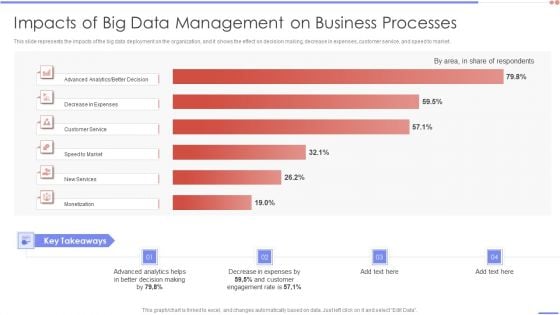
Data Analytics Management Impacts Of Big Data Management On Business Processes Sample PDF
This slide represents the impacts of the big data deployment on the organization, and it shows the effect on decision making, decrease in expenses, customer service, and speed to market.Deliver and pitch your topic in the best possible manner with this Data Analytics Management Impacts Of Big Data Management On Business Processes Sample PDF. Use them to share invaluable insights on Advanced Analytics, Decrease Expenses, Customer Service and impress your audience. This template can be altered and modified as per your expectations. So, grab it now.
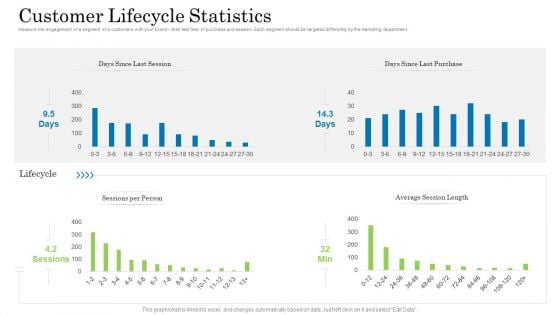
Customer Behavioral Data And Analytics Customer Lifecycle Statistics Elements PDF
Measure the engagement of a segment of a customers with your brand their last time of purchase and session. Each segment should be targeted differently by the marketing department. Deliver an awe inspiring pitch with this creative customer behavioral data and analytics customer lifecycle statistics elements pdf bundle. Topics like days since last session, days since last purchase, sessions per person, average session length can be discussed with this completely editable template. It is available for immediate download depending on the needs and requirements of the user.
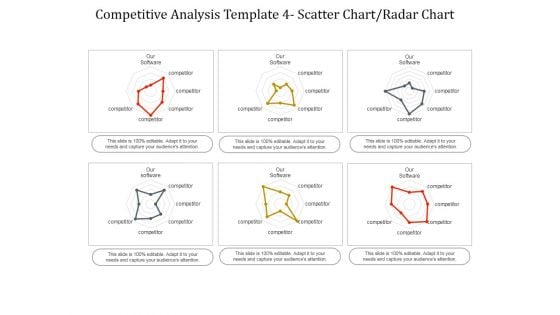
Competitive Analysis Scatter Chart Radar Chart Ppt PowerPoint Presentation Infographics
This is a competitive analysis scatter chart radar chart ppt powerpoint presentation infographics. This is a eight stage process. The stages in this process are users interface, data import, example, pricing, support, update, tutorials, easy to use.
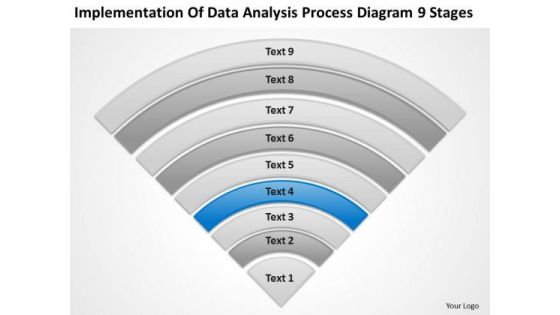
Data Analysis Process Diagram 9 Stages Develop Business Plan PowerPoint Slides
We present our data analysis process diagram 9 stages develop business plan PowerPoint Slides.Present our Process and Flows PowerPoint Templates because You should Press the right buttons with our PowerPoint Templates and Slides. They will take your ideas down the perfect channel. Download and present our Flow Charts PowerPoint Templates because Our PowerPoint Templates and Slides are created with admirable insight. Use them and give your group a sense of your logical mind. Use our Business PowerPoint Templates because Our PowerPoint Templates and Slides provide you with a vast range of viable options. Select the appropriate ones and just fill in your text. Download our Shapes PowerPoint Templates because Our PowerPoint Templates and Slides offer you the widest possible range of options. Download and present our Triangles PowerPoint Templates because Our PowerPoint Templates and Slides will let you Hit the target. Go the full distance with ease and elan.Use these PowerPoint slides for presentations relating to Saturation, strip, saturated, line, spectrum, pantone, bright, diagram, circle, sampler, guide, element, paint, scale,shape, ten, multicolored, palette, illustration, spectral, guidance, chart, collection, abstraction, selection, choice, visible, variation, painter, contrast, ,gradient, pattern, chooser, analyzer. The prominent colors used in the PowerPoint template are Blue, White, Gray. Brake for no one with our Data Analysis Process Diagram 9 Stages Develop Business Plan PowerPoint Slides. You will come out on top.
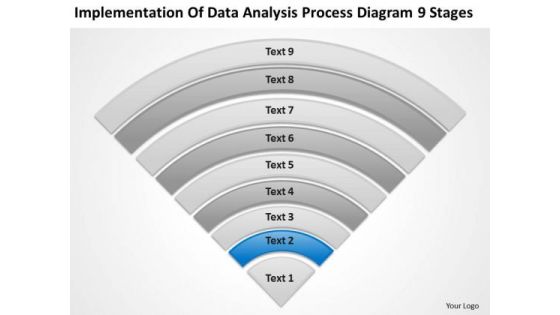
Data Analysis Process Diagram 9 Stages Ppt Business Plan PowerPoint Slide
We present our data analysis process diagram 9 stages ppt business plan PowerPoint Slide.Download our Process and Flows PowerPoint Templates because Our PowerPoint Templates and Slides will help you be quick off the draw. Just enter your specific text and see your points hit home. Use our Flow Charts PowerPoint Templates because Our PowerPoint Templates and Slides will definately Enhance the stature of your presentation. Adorn the beauty of your thoughts with their colourful backgrounds. Download and present our Business PowerPoint Templates because Our PowerPoint Templates and Slides will let Your superior ideas hit the target always and everytime. Present our Triangles PowerPoint Templates because Our PowerPoint Templates and Slides will embellish your thoughts. See them provide the desired motivation to your team. Download and present our Shapes PowerPoint Templates because You can Rise to the occasion with our PowerPoint Templates and Slides. You will bring your audience on their feet in no time.Use these PowerPoint slides for presentations relating to Saturation, strip, saturated, line, spectrum, pantone, bright, diagram, circle, sampler, guide, element, paint, scale,shape, ten, multicolored, palette, illustration, spectral, guidance, chart, collection, abstraction, selection, choice, visible, variation, painter, contrast, ,gradient, pattern, chooser, analyzer. The prominent colors used in the PowerPoint template are Gray, White, Blue. Put your best foot forward with our Data Analysis Process Diagram 9 Stages Ppt Business Plan PowerPoint Slide. You will appear that much better.

Implementation Timeline Of Product Analytics In Organisation Product Analytics Implementation Data Analytics V
This slide illustrates a weekly timeline of activities undertaken while implementing product analytics in businesses to streamline operations. It covers activities under four heads choose simple use case, implement data governance, democratize product analytics and build expe4rimentataion culture Retrieve professionally designed Implementation Timeline Of Product Analytics In Organisation Product Analytics Implementation Data Analytics V to effectively convey your message and captivate your listeners. Save time by selecting pre-made slideshows that are appropriate for various topics, from business to educational purposes. These themes come in many different styles, from creative to corporate, and all of them are easily adjustable and can be edited quickly. Access them as PowerPoint templates or as Google Slides themes. You do not have to go on a hunt for the perfect presentation because Slidegeeks got you covered from everywhere. This slide illustrates a weekly timeline of activities undertaken while implementing product analytics in businesses to streamline operations. It covers activities under four heads choose simple use case, implement data governance, democratize product analytics and build expe4rimentataion culture
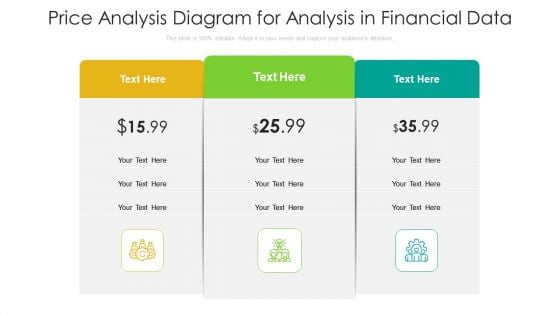
Price Analysis Diagram For Analysis In Financial Data Ppt Infographics Summary PDF
Showcasing this set of slides titled price analysis diagram for analysis in financial data ppt infographics summary pdf. The topics addressed in these templates are price analysis diagram for analysis in financial data. All the content presented in this PPT design is completely editable. Download it and make adjustments in color, background, font etc. as per your unique business setting.
Consumer Complaint Assessment Report With Stars Ppt PowerPoint Presentation Infographics Background Images PDF
Presenting this set of slides with name consumer complaint assessment report with stars ppt powerpoint presentation infographics background images pdf. This is a one stage process. The stage in this process is consumer complaint assessment report with stars. This is a completely editable PowerPoint presentation and is available for immediate download. Download now and impress your audience.

Multi Cloud Infrastructure Management Data Protection Multi Cloud Data Encryption Themes PDF
This slide covers data protection and encryption framework in multi-cloud with multi layer protection and data management. Find highly impressive Multi Cloud Infrastructure Management Data Protection Multi Cloud Data Encryption Themes PDF on Slidegeeks to deliver a meaningful presentation. You can save an ample amount of time using these presentation templates. No need to worry to prepare everything from scratch because Slidegeeks experts have already done a huge research and work for you. You need to download Multi Cloud Infrastructure Management Data Protection Multi Cloud Data Encryption Themes PDF for your upcoming presentation. All the presentation templates are 100 percent editable and you can change the color and personalize the content accordingly. Download now.
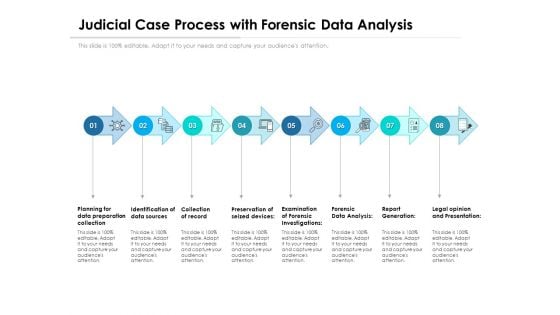
Judicial Case Process With Forensic Data Analysis Ppt PowerPoint Presentation Gallery Deck PDF
Presenting judicial case process with forensic data analysis ppt powerpoint presentation gallery deck pdf to dispense important information. This template comprises eight stages. It also presents valuable insights into the topics including data sources, planning, data preparation. This is a completely customizable PowerPoint theme that can be put to use immediately. So, download it and address the topic impactfully.
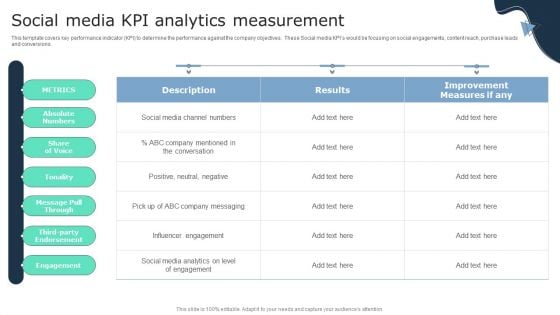
Social Media Kpi Analytics Measurement Business Social Strategy Guide Infographics PDF
This template covers key performance indicator KPI to determine the performance against the company objectives. These Social media KPIs would be focusing on social engagements, content reach, purchase leads and conversions. If you are looking for a format to display your unique thoughts, then the professionally designed Social Media Kpi Analytics Measurement Business Social Strategy Guide Infographics PDF is the one for you. You can use it as a Google Slides template or a PowerPoint template. Incorporate impressive visuals, symbols, images, and other charts. Modify or reorganize the text boxes as you desire. Experiment with shade schemes and font pairings. Alter, share or cooperate with other people on your work. Download Social Media Kpi Analytics Measurement Business Social Strategy Guide Infographics PDF and find out how to give a successful presentation. Present a perfect display to your team and make your presentation unforgettable.
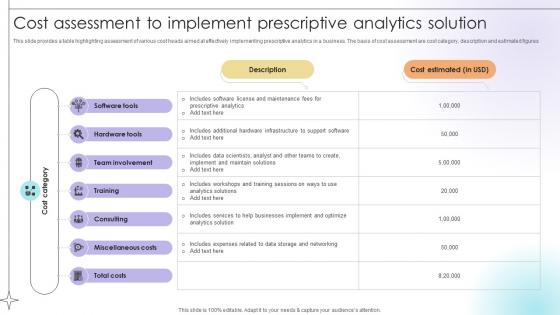
Cost Assessment To Implement Prescriptive Analytics Solution Data Analytics SS V
This slide provides a table highlighting assessment of various cost heads aimed at effectively implementing prescriptive analytics in a business. The basis of cost assessment are cost category, description and estimated figures.Retrieve professionally designed Cost Assessment To Implement Prescriptive Analytics Solution Data Analytics SS V to effectively convey your message and captivate your listeners. Save time by selecting pre-made slideshows that are appropriate for various topics, from business to educational purposes. These themes come in many different styles, from creative to corporate, and all of them are easily adjustable and can be edited quickly. Access them as PowerPoint templates or as Google Slides themes. You do not have to go on a hunt for the perfect presentation because Slidegeeks got you covered from everywhere. This slide provides a table highlighting assessment of various cost heads aimed at effectively implementing prescriptive analytics in a business. The basis of cost assessment are cost category, description and estimated figures.
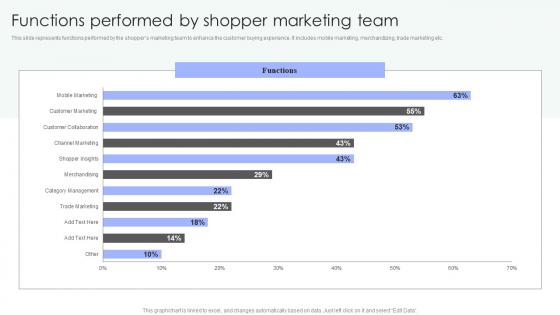
Shopper Marketing Strategy To Enhance Functions Performed By Shopper Marketing Infographics Pdf
This slide represents functions performed by the shoppers marketing team to enhance the customer buying experience. It includes mobile marketing, merchandizing, trade marketing etc. If your project calls for a presentation, then Slidegeeks is your go-to partner because we have professionally designed, easy-to-edit templates that are perfect for any presentation. After downloading, you can easily edit Shopper Marketing Strategy To Enhance Functions Performed By Shopper Marketing Infographics Pdf and make the changes accordingly. You can rearrange slides or fill them with different images. Check out all the handy templates This slide represents functions performed by the shoppers marketing team to enhance the customer buying experience. It includes mobile marketing, merchandizing, trade marketing etc.
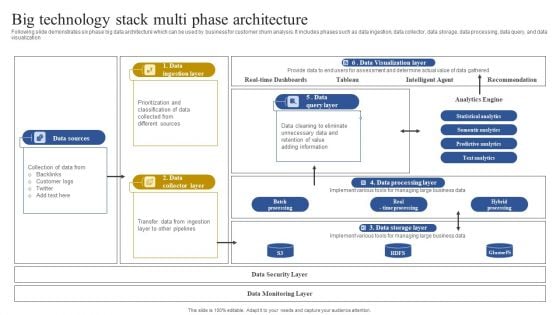
Big Technology Stack Multi Phase Architecture Graphics PDF
Showcasing this set of slides titled Big Technology Stack Multi Phase Architecture Graphics PDF. The topics addressed in these templates are Data Sources, Data Ingestion Layer, Data Query Layer. All the content presented in this PPT design is completely editable. Download it and make adjustments in color, background, font etc. as per your unique business setting.
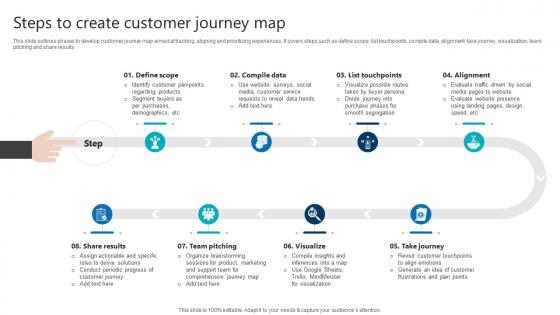
Steps To Create Customer Journey Map Product Analytics Implementation Data Analytics V
This slide outlines phases to develop customer journey map aimed at tracking, aligning and prioritizing experiences. It covers steps such as define scope, list touchpoints, compile data, alignment, take journey, visualization, team pitching and share results Welcome to our selection of the Steps To Create Customer Journey Map Product Analytics Implementation Data Analytics V. These are designed to help you showcase your creativity and bring your sphere to life. Planning and Innovation are essential for any business that is just starting out. This collection contains the designs that you need for your everyday presentations. All of our PowerPoints are 100 percent editable, so you can customize them to suit your needs. This multi-purpose template can be used in various situations. Grab these presentation templates today. This slide outlines phases to develop customer journey map aimed at tracking, aligning and prioritizing experiences. It covers steps such as define scope, list touchpoints, compile data, alignment, take journey, visualization, team pitching and share results

User Manual With Magnifying Glass Ppt Powerpoint Presentation Diagram Ppt
This is a user manual with magnifying glass ppt powerpoint presentation diagram ppt. This is a three stage process. The stages in this process are advice, guidance, counsel.
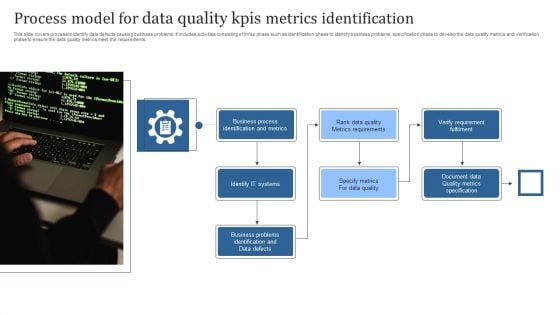
Process Model For Data Quality Kpis Metrics Identification Brochure PDF
This slide covers process to identify data defects causing business problems. It includes activities consisting of three phase such as identification phase to identify business problems, specification phase to develop the data quality metrics and verification phase to ensure the data quality metrics meet the requirements. Persuade your audience using this Process Model For Data Quality Kpis Metrics Identification Brochure PDF. This PPT design covers Seven stages, thus making it a great tool to use. It also caters to a variety of topics including Business Process, Identification And Metrics, Verify Requirement Fulfilment. Download this PPT design now to present a convincing pitch that not only emphasizes the topic but also showcases your presentation skills.
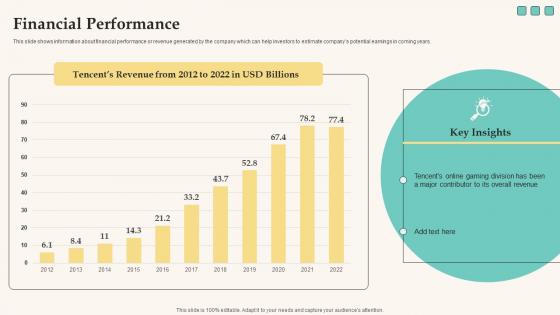
Financial Performance Elevator Pitch Deck For Funding Tech Company Infographics Pdf
This slide shows information about financial performance or revenue generated by the company which can help investors to estimate companys potential earnings in coming years. From laying roadmaps to briefing everything in detail, our templates are perfect for you. You can set the stage with your presentation slides. All you have to do is download these easy-to-edit and customizable templates. Financial Performance Elevator Pitch Deck For Funding Tech Company Infographics Pdf will help you deliver an outstanding performance that everyone would remember and praise you for. Do download this presentation today. This slide shows information about financial performance or revenue generated by the company which can help investors to estimate companys potential earnings in coming years.
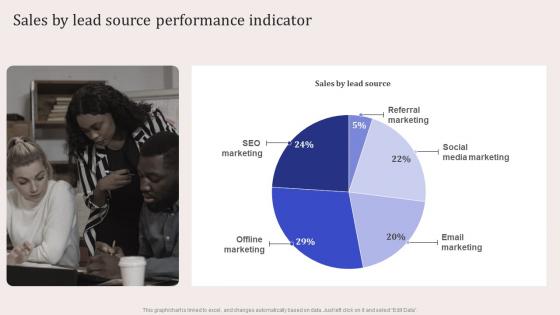
Sales By Lead Source Performance Indicator Virtual Event Promotion To Capture Infographics Pdf
The Sales By Lead Source Performance Indicator Virtual Event Promotion To Capture Infographics Pdf is a compilation of the most recent design trends as a series of slides. It is suitable for any subject or industry presentation, containing attractive visuals and photo spots for businesses to clearly express their messages. This template contains a variety of slides for the user to input data, such as structures to contrast two elements, bullet points, and slides for written information. Slidegeeks is prepared to create an impression. Our Sales By Lead Source Performance Indicator Virtual Event Promotion To Capture Infographics Pdf are topically designed to provide an attractive backdrop to any subject. Use them to look like a presentation pro.
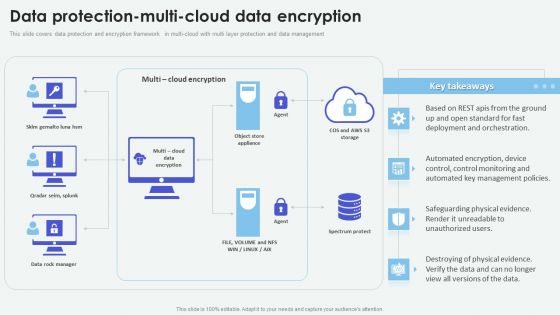
Cloud Based Computing Analysis Data Protection Multi Cloud Data Encryption Background PDF
This slide covers data protection and encryption framework in multi-cloud with multi layer protection and data management. Whether you have daily or monthly meetings, a brilliant presentation is necessary. Cloud Based Computing Analysis Data Protection Multi Cloud Data Encryption Background PDF can be your best option for delivering a presentation. Represent everything in detail using Cloud Based Computing Analysis Data Protection Multi Cloud Data Encryption Background PDF and make yourself stand out in meetings. The template is versatile and follows a structure that will cater to your requirements. All the templates prepared by Slidegeeks are easy to download and edit. Our research experts have taken care of the corporate themes as well. So, give it a try and see the results.
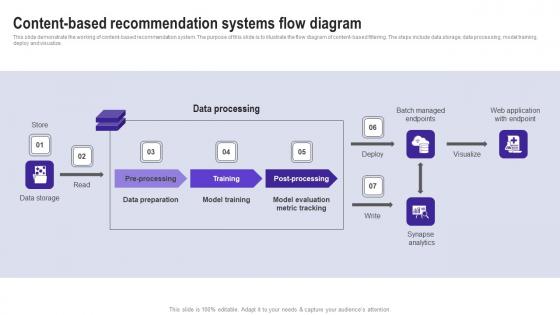
Content Based Recommendation Systems Flow Diagram Use Cases Of Filtering Methods Mockup Pdf
This slide demonstrate the working of content based recommendation system. The purpose of this slide is to illustrate the flow diagram of content based filtering. The steps include data storage, data processing, model training, deploy and visualize. Are you in need of a template that can accommodate all of your creative concepts This one is crafted professionally and can be altered to fit any style. Use it with Google Slides or PowerPoint. Include striking photographs, symbols, depictions, and other visuals. Fill, move around, or remove text boxes as desired. Test out color palettes and font mixtures. Edit and save your work, or work with colleagues. Download Content Based Recommendation Systems Flow Diagram Use Cases Of Filtering Methods Mockup Pdf and observe how to make your presentation outstanding. Give an impeccable presentation to your group and make your presentation unforgettable. This slide demonstrate the working of content based recommendation system. The purpose of this slide is to illustrate the flow diagram of content based filtering. The steps include data storage, data processing, model training, deploy and visualize.
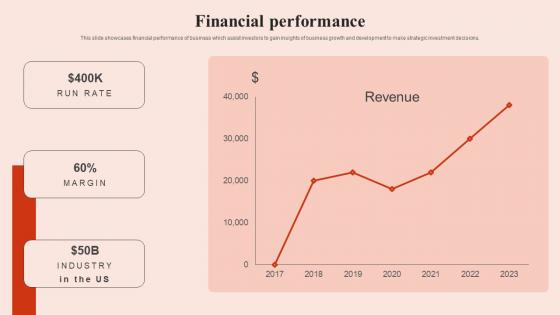
Financial Performance Beauty Brands And Retailers Company Fund Raising Infographics Pdf
This slide showcases financial performance of business which assist investors to gain insights of business growth and development to make strategic investment decisions. Boost your pitch with our creative Financial Performance Beauty Brands And Retailers Company Fund Raising Infographics Pdf. Deliver an awe-inspiring pitch that will mesmerize everyone. Using these presentation templates you will surely catch everyones attention. You can browse the ppts collection on our website. We have researchers who are experts at creating the right content for the templates. So you do not have to invest time in any additional work. Just grab the template now and use them. This slide showcases financial performance of business which assist investors to gain insights of business growth and development to make strategic investment decisions.
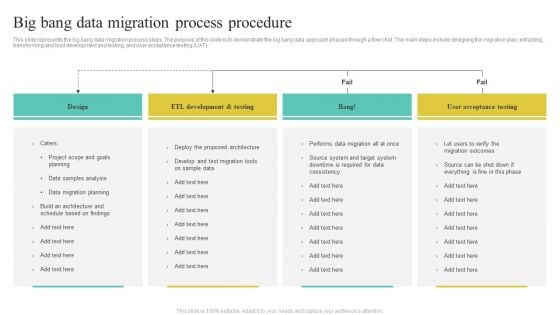
Big Bang Data Migration Process Procedure Diagrams PDF
This slide represents the big bang data migration process steps. The purpose of this slide is to demonstrate the big bang data approach phases through a flow chat. The main steps include designing the migration plan, extracting, transforming and load development and testing, and user acceptance testing UAT.
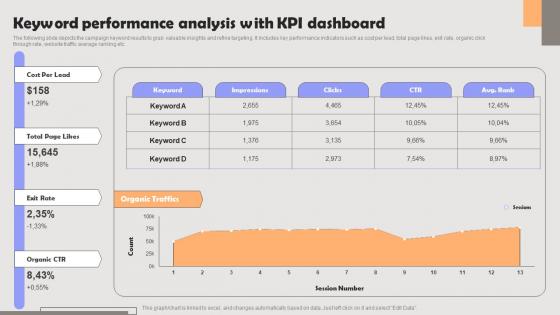
Improving PPC Campaign Results Keyword Performance Analysis With KPI Sample Pdf
The following slide depicts the campaign keyword results to grab valuable insights and refine targeting. It includes key performance indicators such as cost per lead, total page likes, exit rate, organic click through rate, website traffic average ranking etc. This Improving PPC Campaign Results Keyword Performance Analysis With KPI Sample Pdf is perfect for any presentation, be it in front of clients or colleagues. It is a versatile and stylish solution for organizing your meetings. The Improving PPC Campaign Results Keyword Performance Analysis With KPI Sample Pdf features a modern design for your presentation meetings. The adjustable and customizable slides provide unlimited possibilities for acing up your presentation. Slidegeeks has done all the homework before launching the product for you. So, do not wait, grab the presentation templates today The following slide depicts the campaign keyword results to grab valuable insights and refine targeting. It includes key performance indicators such as cost per lead, total page likes, exit rate, organic click through rate, website traffic average ranking etc.

Digital Content Performance Assessment Top Of The Funnel Digital Content Strategy SS V
The following slide depicts key performance indicators of digital content marketing to monitor results. It includes elements such as page views, social shares, click through rate, blog subscribers, conversions, opportunities influenced, average time on page etc. Find highly impressive Digital Content Performance Assessment Top Of The Funnel Digital Content Strategy SS V on Slidegeeks to deliver a meaningful presentation. You can save an ample amount of time using these presentation templates. No need to worry to prepare everything from scratch because Slidegeeks experts have already done a huge research and work for you. You need to download Digital Content Performance Assessment Top Of The Funnel Digital Content Strategy SS V for your upcoming presentation. All the presentation templates are 100 percent editable and you can change the color and personalize the content accordingly. Download now The following slide depicts key performance indicators of digital content marketing to monitor results. It includes elements such as page views, social shares, click through rate, blog subscribers, conversions, opportunities influenced, average time on page etc.
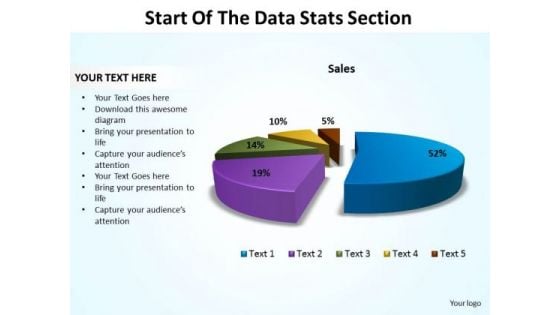
Business Marketing PowerPoint Templates Business Start Of The Data Stats Section Ppt Slides
Business Marketing PowerPoint Templates Business start of the data stats section PPT Slides-This Pie Chart is a simple template that provides a graphical, time-phased overview of a continuing sequence of stages, tasks, or events in a circular flow. You can divide a Pie Chart into segments for illustrating proportion-Business Marketing PowerPoint Templates Business start of the data stats section PPT Slides-This ppt can be used for concepts relating to-3d, Allocate, Allocation, Business, Chart, Circle, Data, Diagram, Divide, Division, Expensive, Financial, Graph Etc. Destroy failure with our Business Marketing PowerPoint Templates Business Start Of The Data Stats Section Ppt Slides. You will come out on top.
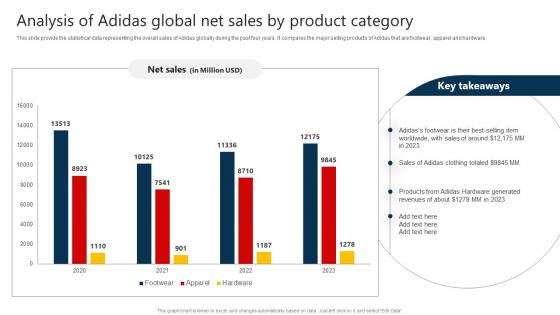
The Marketing Mix Of Analysis Of Adidas Global Net Sales By Product Category Strategy SS V
This slide provide the statistical data representing the overall sales of Adidas globally during the past four years. It compares the major selling products of Adidas that are footwear, apparel and hardware. The The Marketing Mix Of Analysis Of Adidas Global Net Sales By Product Category Strategy SS V is a compilation of the most recent design trends as a series of slides. It is suitable for any subject or industry presentation, containing attractive visuals and photo spots for businesses to clearly express their messages. This template contains a variety of slides for the user to input data, such as structures to contrast two elements, bullet points, and slides for written information. Slidegeeks is prepared to create an impression. This slide provide the statistical data representing the overall sales of Adidas globally during the past four years. It compares the major selling products of Adidas that are footwear, apparel and hardware.
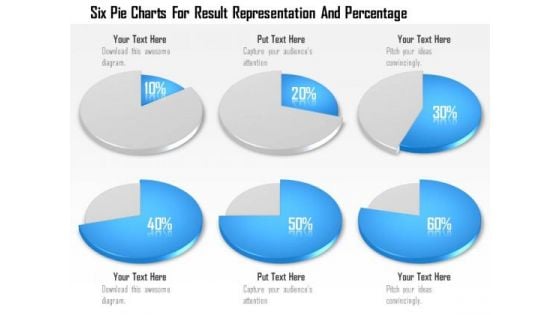
Business Diagram Six Pie Charts For Result Representation And Percentage Presentation Template
Display the concept of result analysis in your business presentation. This PPT slide contains the graphic of six pie charts. Use this PPT slide for your business and marketing data related presentations.
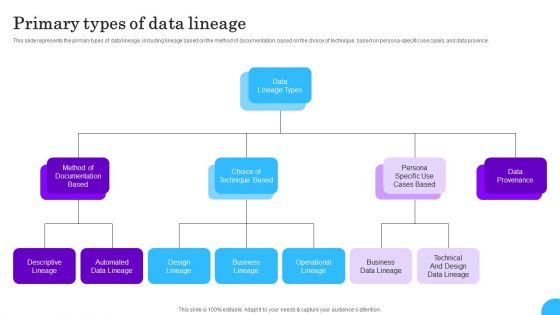
Comprehensive Analysis Of Different Data Lineage Classification Primary Types Of Data Lineage Designs PDF
This slide represents the primary types of data lineage, including lineage based on the method of documentation, based on the choice of technique, based on persona specific use cases, and data province. From laying roadmaps to briefing everything in detail, our templates are perfect for you. You can set the stage with your presentation slides. All you have to do is download these easy to edit and customizable templates. Comprehensive Analysis Of Different Data Lineage Classification Primary Types Of Data Lineage Designs PDF will help you deliver an outstanding performance that everyone would remember and praise you for. Do download this presentation today.
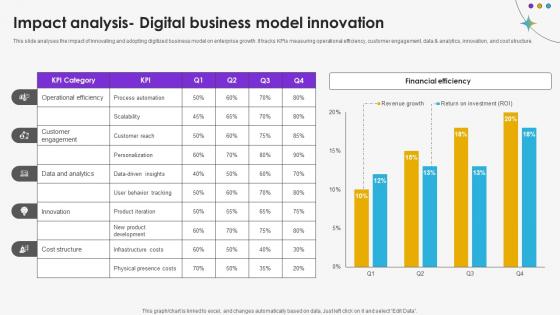
Impact Analysis Digital Business Model Innovation DT SS V
This slide analyses the impact of innovating and adopting digitized business model on enterprise growth. It tracks KPIs measuring operational efficiency, customer engagement, data and analytics, innovation, and cost structure.Do you have an important presentation coming up Are you looking for something that will make your presentation stand out from the rest Look no further than Impact Analysis Digital Business Model Innovation DT SS V. With our professional designs, you can trust that your presentation will pop and make delivering it a smooth process. And with Slidegeeks, you can trust that your presentation will be unique and memorable. So why wait Grab Impact Analysis Digital Business Model Innovation DT SS V today and make your presentation stand out from the rest. This slide analyses the impact of innovating and adopting digitized business model on enterprise growth. It tracks KPIs measuring operational efficiency, customer engagement, data and analytics, innovation, and cost structure.
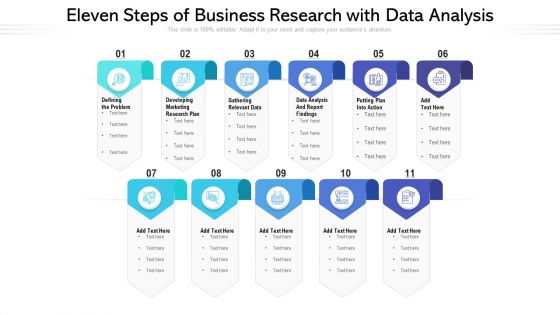
Eleven Steps Of Business Research With Data Analysis Ppt PowerPoint Presentation File Structure PDF
Presenting eleven steps of business research with data analysis ppt powerpoint presentation file structure pdf to dispense important information. This template comprises eleven stages. It also presents valuable insights into the topics including marketing, data analysis, developing. This is a completely customizable PowerPoint theme that can be put to use immediately. So, download it and address the topic impactfully.
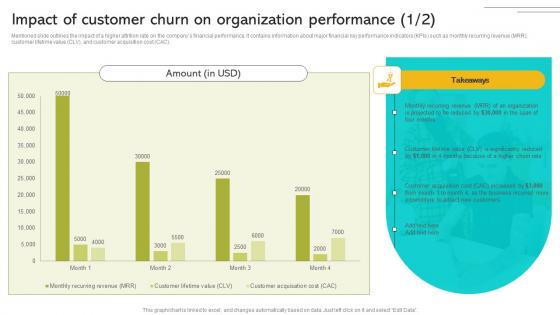
Implementing Strategies To Enhance Impact Of Customer Churn On Organization Performance Infographics PDF
Mentioned slide outlines the impact of a higher attrition rate on the companys financial performance. It contains information about major financial key performance indicators KPIs such as monthly recurring revenue MRR, customer lifetime value CLV, and customer acquisition cost CAC. Make sure to capture your audiences attention in your business displays with our gratis customizable Implementing Strategies To Enhance Impact Of Customer Churn On Organization Performance Infographics PDF These are great for business strategies, office conferences, capital raising or task suggestions. If you desire to acquire more customers for your tech business and ensure they stay satisfied, create your own sales presentation with these plain slides. Mentioned slide outlines the impact of a higher attrition rate on the companys financial performance. It contains information about major financial key performance indicators KPIs such as monthly recurring revenue MRR, customer lifetime value CLV, and customer acquisition cost CAC.
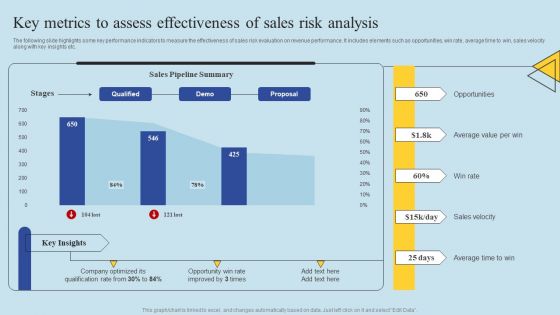
Determining Risks In Sales Administration Procedure Key Metrics To Assess Effectiveness Of Sales Pictures PDF
The following slide highlights some key performance indicators to measure the effectiveness of sales risk evaluation on revenue performance. It includes elements such as opportunities, win rate, average time to win, sales velocity along with key insights etc. This Determining Risks In Sales Administration Procedure Key Metrics To Assess Effectiveness Of Sales Pictures PDF from Slidegeeks makes it easy to present information on your topic with precision. It provides customization options, so you can make changes to the colors, design, graphics, or any other component to create a unique layout. It is also available for immediate download, so you can begin using it right away. Slidegeeks has done good research to ensure that you have everything you need to make your presentation stand out. Make a name out there for a brilliant performance.
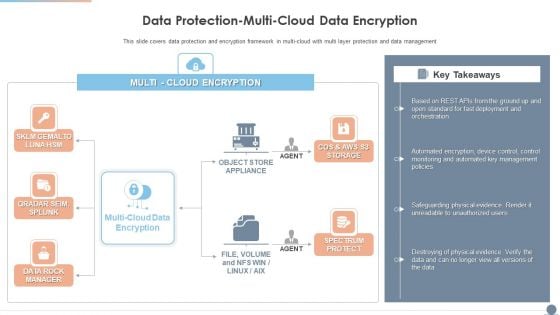
Multi Cloud Complexity Management Data Protection Multi Cloud Data Encryption Themes PDF
This slide covers data protection and encryption framework in multi cloud with multi layer protection and data management. Deliver an awe inspiring pitch with this creative Multi Cloud Complexity Management Data Protection Multi Cloud Data Encryption Themes PDF bundle. Topics like Automated Key Management, Spectrum Protect, Cloud Data Encryption can be discussed with this completely editable template. It is available for immediate download depending on the needs and requirements of the user.
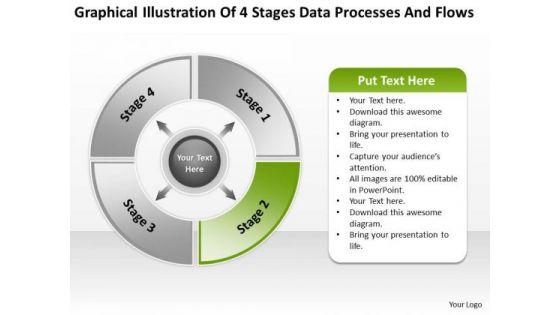
4 Stages Data Processes And Flows Ppt Business Plan For Small PowerPoint Slides
We present our 4 stages data processes and flows ppt business plan for small PowerPoint Slides.Present our Arrows PowerPoint Templates because you can Set pulses racing with our PowerPoint Templates and Slides. They will raise the expectations of your team. Use our Business PowerPoint Templates because Our PowerPoint Templates and Slides will embellish your thoughts. See them provide the desired motivation to your team. Use our Process and Flows PowerPoint Templates because Our PowerPoint Templates and Slides will let Your superior ideas hit the target always and everytime. Download our Marketing PowerPoint Templates because Our PowerPoint Templates and Slides come in all colours, shades and hues. They help highlight every nuance of your views. Download and present our Circle Charts PowerPoint Templates because These PowerPoint Templates and Slides will give the updraft to your ideas. See them soar to great heights with ease.Use these PowerPoint slides for presentations relating to Chart, vector, graph, website, network, statistics, item, junction, corporate, business, plan, presentation, template, diagram, circle, brochure, data, process,report, marketing, different, abstract, management, modern, four, illustration, connection, sphere, options, structure, arrows, communication. The prominent colors used in the PowerPoint template are Green, Gray, White. Your presentations will become famous with our 4 Stages Data Processes And Flows Ppt Business Plan For Small PowerPoint Slides. Dont waste time struggling with PowerPoint. Let us do it for you.
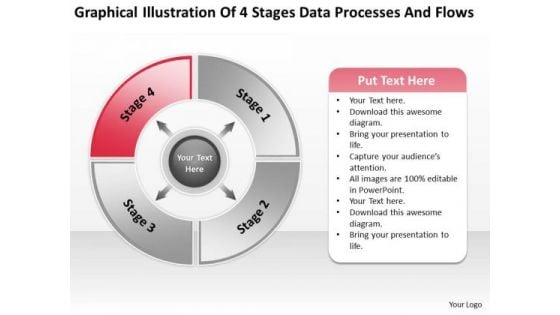
4 Stages Data Processes And Flows Ppt How To Write Up Business Plan PowerPoint Slides
We present our 4 stages data processes and flows ppt how to write up business plan PowerPoint Slides.Use our Arrows PowerPoint Templates because You can Inspire your team with our PowerPoint Templates and Slides. Let the force of your ideas flow into their minds. Present our Business PowerPoint Templates because It will let you Set new benchmarks with our PowerPoint Templates and Slides. They will keep your prospects well above par. Download our Process and Flows PowerPoint Templates because Our PowerPoint Templates and Slides will definately Enhance the stature of your presentation. Adorn the beauty of your thoughts with their colourful backgrounds. Download our Marketing PowerPoint Templates because Our PowerPoint Templates and Slides are a sure bet. Gauranteed to win against all odds. Download our Circle Charts PowerPoint Templates because Our PowerPoint Templates and Slides are aesthetically designed to attract attention. We gaurantee that they will grab all the eyeballs you need.Use these PowerPoint slides for presentations relating to Chart, vector, graph, website, network, statistics, item, junction, corporate, business, plan, presentation, template, diagram, circle, brochure, data, process,report, marketing, different, abstract, management, modern, four, illustration, connection, sphere, options, structure, arrows, communication. The prominent colors used in the PowerPoint template are Red, Gray, White. Compile targets with our 4 Stages Data Processes And Flows Ppt How To Write Up Business Plan PowerPoint Slides. Download without worries with our money back guaranteee.
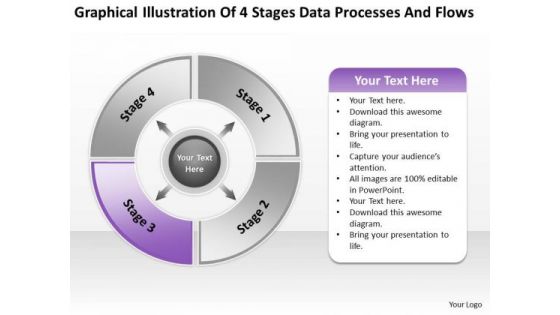
4 Stages Data Processes And Flows Ppt What Is Business Plan Template PowerPoint Slides
We present our 4 stages data processes and flows ppt what is business plan template PowerPoint Slides.Download our Arrows PowerPoint Templates because You can Hit the nail on the head with our PowerPoint Templates and Slides. Embed your ideas in the minds of your audience. Download and present our Business PowerPoint Templates because Our PowerPoint Templates and Slides are truly out of this world. Even the MIB duo has been keeping tabs on our team. Download and present our Process and Flows PowerPoint Templates because You have a driving passion to excel in your field. Our PowerPoint Templates and Slides will prove ideal vehicles for your ideas. Download our Marketing PowerPoint Templates because you should Whip up a frenzy with our PowerPoint Templates and Slides. They will fuel the excitement of your team. Download and present our Circle Charts PowerPoint Templates because Our PowerPoint Templates and Slides will let you Illuminate the road ahead to Pinpoint the important landmarks along the way.Use these PowerPoint slides for presentations relating to Chart, vector, graph, website, network, statistics, item, junction, corporate, business, plan, presentation, template, diagram, circle, brochure, data, process,report, marketing, different, abstract, management, modern, four, illustration, connection, sphere, options, structure, arrows, communication. The prominent colors used in the PowerPoint template are Purple, Gray, White. Drown doubts with our 4 Stages Data Processes And Flows Ppt What Is Business Plan Template PowerPoint Slides. You will come out on top.
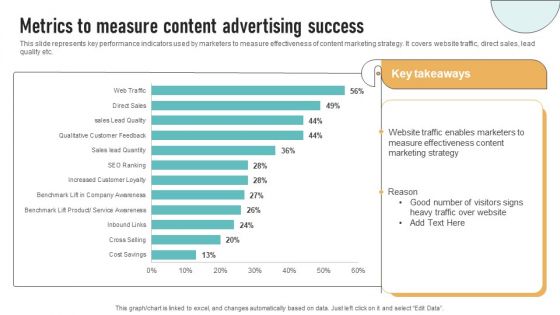
Metrics To Measure Content Advertising Success Demonstration PDF
This slide represents key performance indicators used by marketers to measure effectiveness of content marketing strategy. It covers website traffic, direct sales, lead quality etc. The Metrics To Measure Content Advertising Success Demonstration PDF is a compilation of the most recent design trends as a series of slides. It is suitable for any subject or industry presentation, containing attractive visuals and photo spots for businesses to clearly express their messages. This template contains a variety of slides for the user to input data, such as structures to contrast two elements, bullet points, and slides for written information. Slidegeeks is prepared to create an impression.
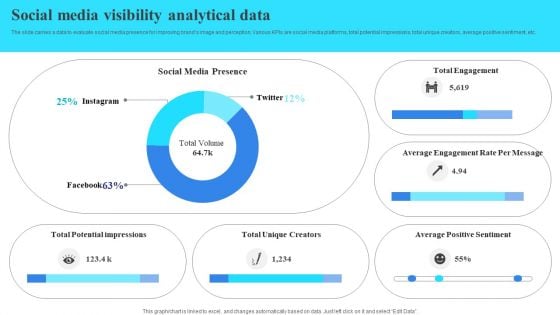
Social Media Visibility Analytical Data Inspiration PDF
The slide carries a data to evaluate social media presence for improving brands image and perception. Various KPIs are social media platforms, total potential impressions, total unique creators, average positive sentiment, etc. Showcasing this set of slides titled Social Media Visibility Analytical Data Inspiration PDF. The topics addressed in these templates are Presence, Creators, Total Engagement. All the content presented in this PPT design is completely editable. Download it and make adjustments in color, background, font etc. as per your unique business setting.
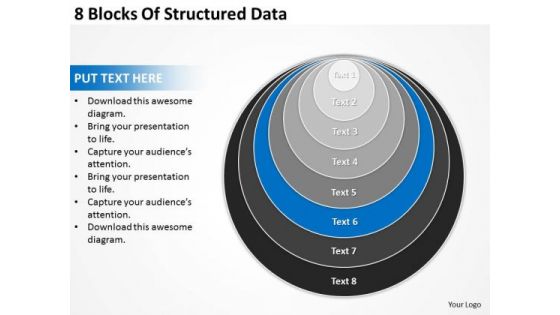
8 Blocks Of Structured Data Business Plan For Bakery PowerPoint Slides
We present our 8 blocks of structured data business plan for bakery PowerPoint Slides.Download and present our Business PowerPoint Templates because It will Raise the bar of your Thoughts. They are programmed to take you to the next level. Download our Venn Diagrams PowerPoint Templates because You can Hit the nail on the head with our PowerPoint Templates and Slides. Embed your ideas in the minds of your audience. Download our Layers PowerPoint Templates because You should Throw the gauntlet with our PowerPoint Templates and Slides. They are created to take up any challenge. Present our Circle Charts PowerPoint Templates because They will Put the wind in your sails. Skim smoothly over the choppy waters of the market. Download our Shapes PowerPoint Templates because You can Stir your ideas in the cauldron of our PowerPoint Templates and Slides. Cast a magic spell on your audience.Use these PowerPoint slides for presentations relating to diagram, process, business, graphic, design, ideas, model, data, chart, project, schema, corporate, implementation, tag, plan, engineering, concept, vector, success, symbol, stack, circle, guide, work flow, development, shape, team, management, cycle, steps, illustration, system, strategy, objects, phase, professional, organization, implement, background, image, detail, structure, product. The prominent colors used in the PowerPoint template are Blue, Black, Gray. Walk your team through your plans using our 8 Blocks Of Structured Data Business Plan For Bakery PowerPoint Slides. See them getting energized.
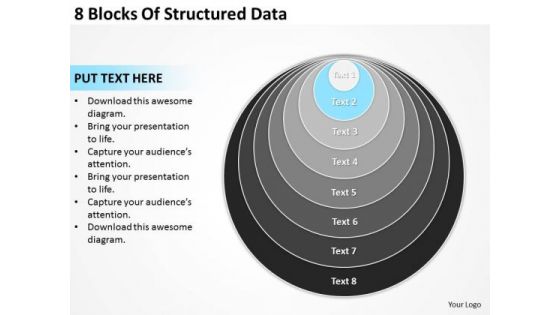
8 Blocks Of Structured Data Business Plan Format Template PowerPoint Templates
We present our 8 blocks of structured data business plan format template PowerPoint templates.Use our Business PowerPoint Templates because It can be used to Set your controls for the heart of the sun. Our PowerPoint Templates and Slides will be the propellant to get you there. Download our Venn Diagrams PowerPoint Templates because You have gained great respect for your brilliant ideas. Use our PowerPoint Templates and Slides to strengthen and enhance your reputation. Download our Layers PowerPoint Templates because You can Zap them with our PowerPoint Templates and Slides. See them reel under the impact. Present our Circle Charts PowerPoint Templates because It can Conjure up grand ideas with our magical PowerPoint Templates and Slides. Leave everyone awestruck by the end of your presentation. Download and present our Shapes PowerPoint Templates because Our PowerPoint Templates and Slides help you meet the demand of the Market. Just browse and pick the slides that appeal to your intuitive senses.Use these PowerPoint slides for presentations relating to diagram, process, business, graphic, design, ideas, model, data, chart, project, schema, corporate, implementation, tag, plan, engineering, concept, vector, success, symbol, stack, circle, guide, work flow, development, shape, team, management, cycle, steps, illustration, system, strategy, objects, phase, professional, organization, implement, background, image, detail, structure, product. The prominent colors used in the PowerPoint template are Blue light, Gray, Black. Our 8 Blocks Of Structured Data Business Plan Format Template PowerPoint Templates afford a distinct approach. Your thoughts will acquire a different character.
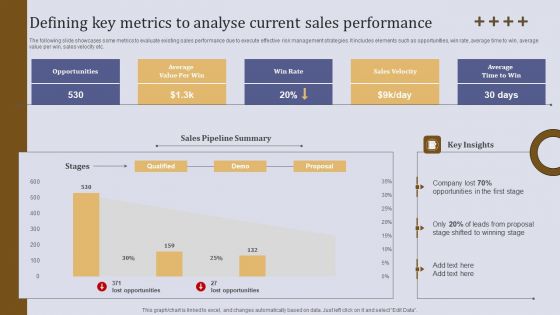
Defining Key Metrics To Analyse Current Sales Performance Ppt Infographics Ideas PDF
The following slide showcases some metrics to evaluate existing sales performance due to execute effective risk management strategies. It includes elements such as opportunities, win rate, average time to win, average value per win, sales velocity etc. Welcome to our selection of the Defining Key Metrics To Analyse Current Sales Performance Ppt Infographics Ideas PDF. These are designed to help you showcase your creativity and bring your sphere to life. Planning and Innovation are essential for any business that is just starting out. This collection contains the designs that you need for your everyday presentations. All of our PowerPoints are 100 percent editable, so you can customize them to suit your needs. This multi purpose template can be used in various situations. Grab these presentation templates today.
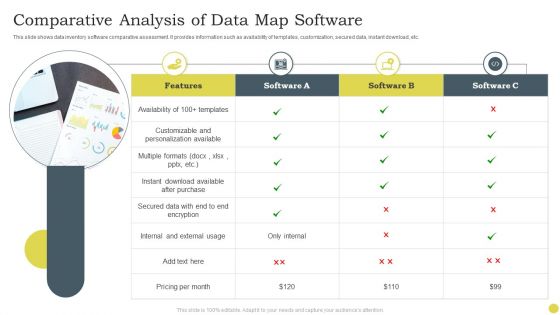
Comparative Analysis Of Data Map Software Ppt PowerPoint Presentation File Objects PDF
This slide shows data inventory software comparative assessment. It provides information such as availability of templates, customization, secured data, instant download, etc. Presenting Comparative Analysis Of Data Map Software Ppt PowerPoint Presentation File Objects PDF to dispense important information. This template comprises four stages. It also presents valuable insights into the topics including Multiple Formats, Secured Data, External Usage. This is a completely customizable PowerPoint theme that can be put to use immediately. So, download it and address the topic impactfully.
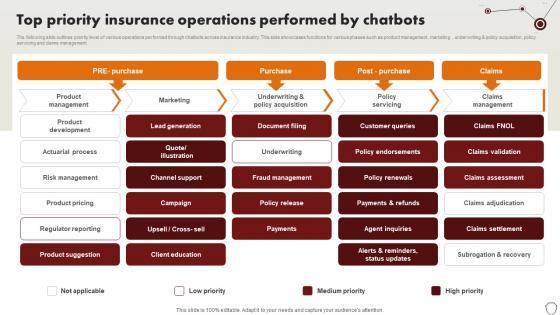
Technology Trends In Online Insurance Top Priority Insurance Operations Performed By Chatbots
The following slide outlines priority level of various operations performed through chatbots across insurance industry. This slide showcases functions for various phases such as product management, marketing , underwriting and policy acquisition, policy servicing and claims management. Retrieve professionally designed Technology Trends In Online Insurance Top Priority Insurance Operations Performed By Chatbots to effectively convey your message and captivate your listeners. Save time by selecting pre-made slideshows that are appropriate for various topics, from business to educational purposes. These themes come in many different styles, from creative to corporate, and all of them are easily adjustable and can be edited quickly. Access them as PowerPoint templates or as Google Slides themes. You do not have to go on a hunt for the perfect presentation because Slidegeeks got you covered from everywhere. The following slide outlines priority level of various operations performed through chatbots across insurance industry. This slide showcases functions for various phases such as product management, marketing , underwriting and policy acquisition, policy servicing and claims management.

Industry Report Of Packaged Food Products Part 2 Ppt PowerPoint Presentation Complete Deck With Slides
This Industry Report Of Packaged Food Products Part 2 Ppt PowerPoint Presentation Complete Deck With Slides is designed to help you retain your audiences attention. This content-ready PowerPoint Template enables you to take your audience on a journey and share information in a way that is easier to recall. It helps you highlight the crucial parts of your work so that the audience does not get saddled with information download. This one hundred eleven slide PPT Deck comes prepared with the graphs and charts you could need to showcase your information through visuals. You only need to enter your own data in them. Download this editable PowerPoint Theme and walk into that meeting with confidence.

Product Analytics Training Plan For Employees Product Analytics Implementation Data Analytics V
This slide outlines training plan aimed at helping employees learn the basics of product analytics to streamline its usage in the business enterprises. It covers details on training module, mode of training, training time slots with trainer name.Whether you have daily or monthly meetings, a brilliant presentation is necessary. Product Analytics Training Plan For Employees Product Analytics Implementation Data Analytics V can be your best option for delivering a presentation. Represent everything in detail using Product Analytics Training Plan For Employees Product Analytics Implementation Data Analytics V and make yourself stand out in meetings. The template is versatile and follows a structure that will cater to your requirements. All the templates prepared by Slidegeeks are easy to download and edit. Our research experts have taken care of the corporate themes as well. So, give it a try and see the results. This slide outlines training plan aimed at helping employees learn the basics of product analytics to streamline its usage in the business enterprises. It covers details on training module, mode of training, training time slots with trainer name.
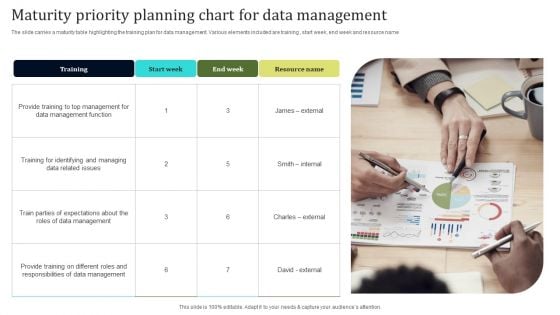
Maturity Priority Planning Chart For Data Management Graphics PDF
The slide carries a maturity table highlighting the training plan for data management. Various elements included are training , start week, end week and resource name Presenting Maturity Priority Planning Chart For Data Management Graphics PDF to dispense important information. This template comprises one stages. It also presents valuable insights into the topics including Data Management, Resource, Maturity Priority Planning. This is a completely customizable PowerPoint theme that can be put to use immediately. So, download it and address the topic impactfully.
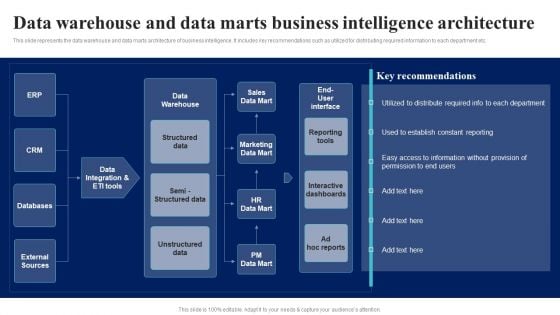
BI Implementation To Enhance Hiring Process Data Warehouse And Data Marts Business Intelligence Architecture Themes PDF
This slide represents the data warehouse and data marts architecture of business intelligence. It includes key recommendations such as utilized for distributing required information to each department etc.Crafting an eye-catching presentation has never been more straightforward. Let your presentation shine with this tasteful yet straightforward BI Implementation To Enhance Hiring Process Data Warehouse And Data Marts Business Intelligence Architecture Themes PDF template. It offers a minimalistic and classy look that is great for making a statement. The colors have been employed intelligently to add a bit of playfulness while still remaining professional. Construct the ideal BI Implementation To Enhance Hiring Process Data Warehouse And Data Marts Business Intelligence Architecture Themes PDF that effortlessly grabs the attention of your audience Begin now and be certain to wow your customers.
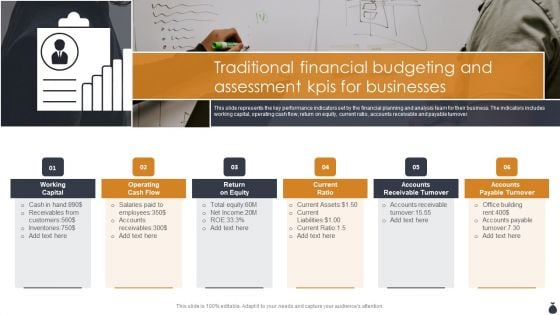
Traditional Financial Budgeting And Assessment Kpis For Businesses Infographics PDF
This slide represents the key performance indicators set by the financial planning and analysis team for their business. The indicators includes working capital, operating cash flow, return on equity, current ratio, accounts receivable and payable turnover. Presenting Traditional Financial Budgeting And Assessment Kpis For Businesses Infographics PDF to dispense important information. This template comprises six stages. It also presents valuable insights into the topics including Working Capital, Operating Cash Flow, Current Ratio. This is a completely customizable PowerPoint theme that can be put to use immediately. So, download it and address the topic impactfully.
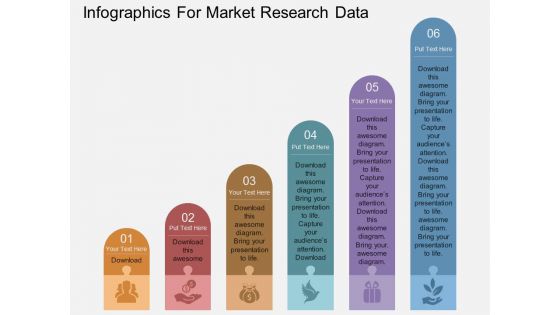
Infographics For Market Research Data Powerpoint Template
Our professionally designed business diagram is as an effective tool for communicating market research and planning. It contains infographic template design. Convey your views with this diagram slide. It will amplify the strength of your logic.
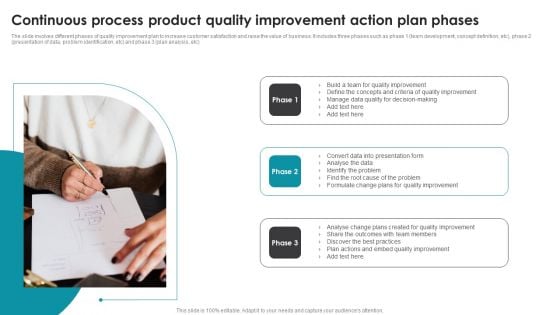
Continuous Process Product Quality Improvement Action Plan Phases Introduction PDF
The slide involves different phases of quality improvement plan to increase customer satisfaction and raise the value of business. It includes three phases such as phase 1 team development, concept definition, etc, phase 2 presentation of data, problem identification, etc and phase 3 plan analysis, etc.
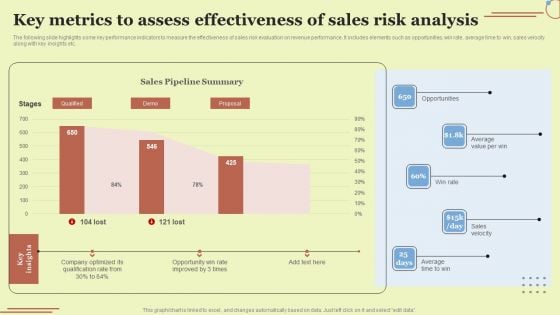
Key Metrics To Assess Effectiveness Of Sales Risk Analysis Download PDF
The following slide highlights some key performance indicators to measure the effectiveness of sales risk evaluation on revenue performance. It includes elements such as opportunities, win rate, average time to win, sales velocity along with key insights etc. Get a simple yet stunning designed Key Metrics To Assess Effectiveness Of Sales Risk Analysis Download PDF. It is the best one to establish the tone in your meetings. It is an excellent way to make your presentations highly effective. So, download this PPT today from Slidegeeks and see the positive impacts. Our easy to edit Key Metrics To Assess Effectiveness Of Sales Risk Analysis Download PDF can be your go to option for all upcoming conferences and meetings. So, what are you waiting for Grab this template today.
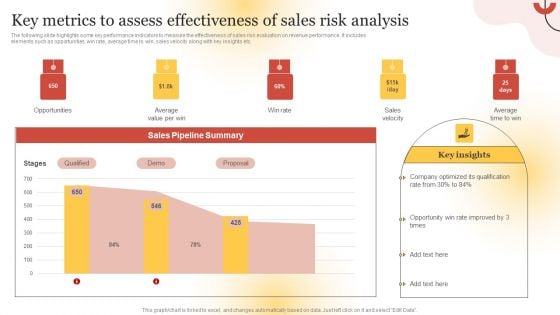
Executing Sales Risk Reduction Plan Key Metrics To Assess Effectiveness Of Sales Risk Analysis Background PDF
The following slide highlights some key performance indicators to measure the effectiveness of sales risk evaluation on revenue performance. It includes elements such as opportunities, win rate, average time to win, sales velocity along with key insights etc. Get a simple yet stunning designed Executing Sales Risk Reduction Plan Key Metrics To Assess Effectiveness Of Sales Risk Analysis Background PDF. It is the best one to establish the tone in your meetings. It is an excellent way to make your presentations highly effective. So, download this PPT today from Slidegeeks and see the positive impacts. Our easy to edit Executing Sales Risk Reduction Plan Key Metrics To Assess Effectiveness Of Sales Risk Analysis Background PDF can be your go to option for all upcoming conferences and meetings. So, what are you waiting for Grab this template today.
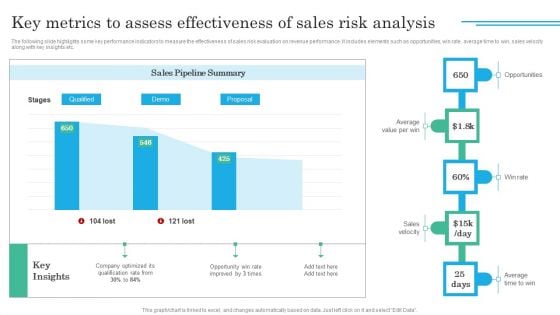
Implementing Sales Volatility Management Techniques Key Metrics To Assess Effectiveness Of Sales Designs PDF
The following slide highlights some key performance indicators to measure the effectiveness of sales risk evaluation on revenue performance. It includes elements such as opportunities, win rate, average time to win, sales velocity along with key insights etc. Do you have an important presentation coming up Are you looking for something that will make your presentation stand out from the rest Look no further than Implementing Sales Volatility Management Techniques Key Metrics To Assess Effectiveness Of Sales Designs PDF. With our professional designs, you can trust that your presentation will pop and make delivering it a smooth process. And with Slidegeeks, you can trust that your presentation will be unique and memorable. So why wait Grab Implementing Sales Volatility Management Techniques Key Metrics To Assess Effectiveness Of Sales Designs PDF today and make your presentation stand out from the rest.
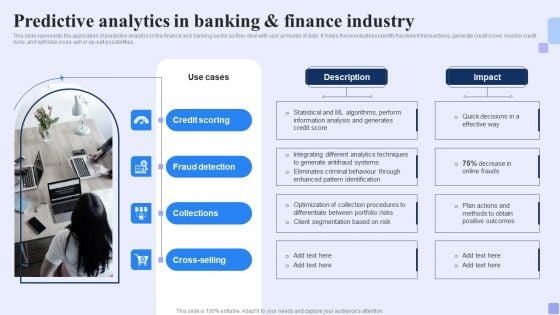
Predictive Analytics In Banking And Finance Industry Forward Looking Analysis IT Diagrams PDF
This slide represents the application of predictive analytics in the finance and banking sector as they deal with vast amounts of data. It helps these industries identify fraudulent transactions, generate credit score, monitor credit risks, and optimize cross-sell or up-sell possibilities.Coming up with a presentation necessitates that the majority of the effort goes into the content and the message you intend to convey. The visuals of a PowerPoint presentation can only be effective if it supplements and supports the story that is being told. Keeping this in mind our experts created Predictive Analytics In Banking And Finance Industry Forward Looking Analysis IT Diagrams PDF to reduce the time that goes into designing the presentation. This way, you can concentrate on the message while our designers take care of providing you with the right template for the situation.
5 Focus Area Stages For Data Enrichment Ai Dynamics Ppt Pictures Graphics Tutorials PDF
Presenting 5 focus area stages for data enrichment ai dynamics ppt pictures graphics tutorials pdf to dispense important information. This template comprises five stages. It also presents valuable insights into the topics including 5 focus area stages for data enrichment ai dynamics. This is a completely customizable PowerPoint theme that can be put to use immediately. So, download it and address the topic impactfully.
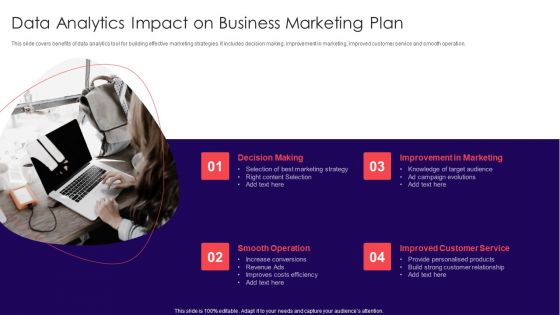
Data Analytics Impact On Business Marketing Plan Mockup PDF
This slide covers benefits of data analytics tool for building effective marketing strategies. It includes decision making, improvement in marketing, improved customer service and smooth operation. Presenting Data Analytics Impact On Business Marketing Plan Mockup PDF to dispense important information. This template comprises four stages. It also presents valuable insights into the topics including Decision Making, Improvement In Marketing, Improved Customer Service. This is a completely customizable PowerPoint theme that can be put to use immediately. So, download it and address the topic impactfully.
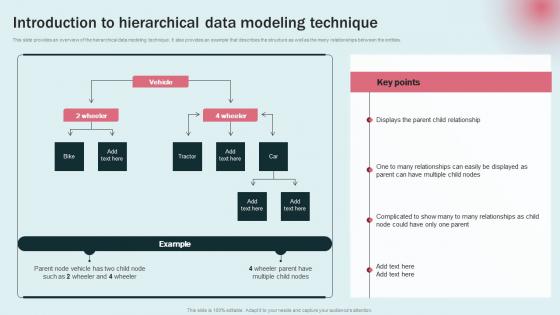
Introduction To Hierarchical Data Modeling Approaches For Modern Analytics Portrait Pdf
This slide provides an overview of the hierarchical data modeling technique. It also provides an example that describes the structure as well as the many relationships between the entities. Formulating a presentation can take up a lot of effort and time, so the content and message should always be the primary focus. The visuals of the PowerPoint can enhance the presenters message, so our Introduction To Hierarchical Data Modeling Approaches For Modern Analytics Portrait Pdf was created to help save time. Instead of worrying about the design, the presenter can concentrate on the message while our designers work on creating the ideal templates for whatever situation is needed. Slidegeeks has experts for everything from amazing designs to valuable content, we have put everything into Introduction To Hierarchical Data Modeling Approaches For Modern Analytics Portrait Pdf This slide provides an overview of the hierarchical data modeling technique. It also provides an example that describes the structure as well as the many relationships between the entities.
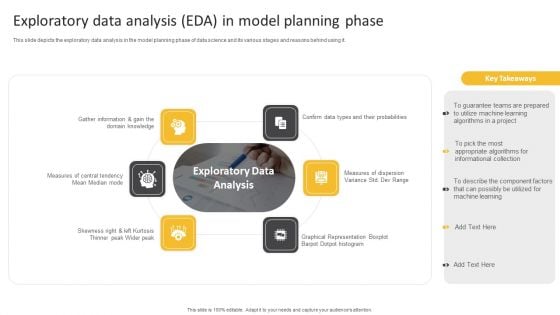
Information Science Exploratory Data Analysis EDA In Model Planning Phase Ppt PowerPoint Presentation Infographics Graphics Pictures PDF
This slide depicts the exploratory data analysis in the model planning phase of data science and its various stages and reasons behind using it.This is a Information Science Exploratory Data Analysis EDA In Model Planning Phase Ppt PowerPoint Presentation Infographics Graphics Pictures PDF template with various stages. Focus and dispense information on six stages using this creative set, that comes with editable features. It contains large content boxes to add your information on topics like Measures Dispersion, Graphical Representation, Skewness Right. You can also showcase facts, figures, and other relevant content using this PPT layout. Grab it now.
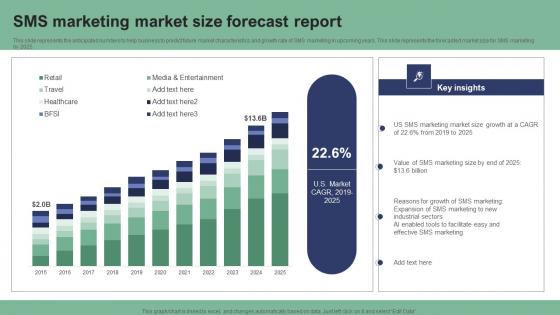
SMS Marketing Market Size Forecast Report Text Message Marketing Strategies Summary Pdf
This slide represents the anticipated numbers to help business to predict future market characteristics and growth rate of SMS marketing in upcoming years. This slide represents the forecasted market size for SMS marketing by 2025. Do you have to make sure that everyone on your team knows about any specific topic I yes, then you should give SMS Marketing Market Size Forecast Report Text Message Marketing Strategies Summary Pdf a try. Our experts have put a lot of knowledge and effort into creating this impeccable SMS Marketing Market Size Forecast Report Text Message Marketing Strategies Summary Pdf. You can use this template for your upcoming presentations, as the slides are perfect to represent even the tiniest detail. You can download these templates from the Slidegeeks website and these are easy to edit. So grab these today. This slide represents the anticipated numbers to help business to predict future market characteristics and growth rate of SMS marketing in upcoming years. This slide represents the forecasted market size for SMS marketing by 2025.
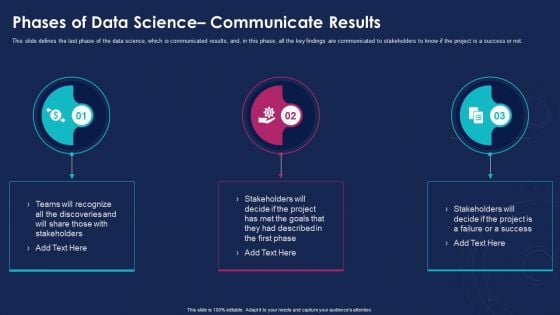
Data Analytics IT Phases Of Data Science Communicate Results Ppt Gallery Slideshow PDF
This slide defines the last phase of the data science, which is communicated results, and, in this phase, all the key findings are communicated to stakeholders to know if the project is a success or not. Presenting data analytics it phases of data science communicate results ppt gallery slideshow pdf to provide visual cues and insights. Share and navigate important information on three stages that need your due attention. This template can be used to pitch topics like phases of data science communicate results. In addtion, this PPT design contains high resolution images, graphics, etc, that are easily editable and available for immediate download.
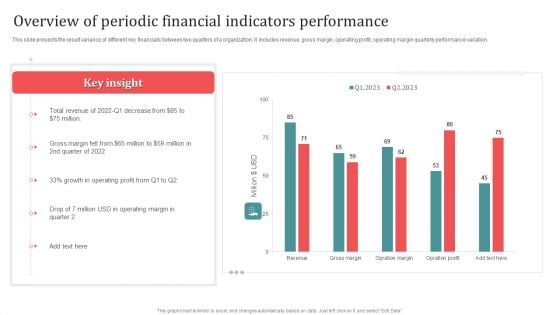
Overview Of Periodic Financial Indicators Performance Designs PDF
This slide presents the result variance of different key financials between two quarters of a organization. It includes revenue, gross margin, operating profit, operating margin quarterly performance variation. Showcasing this set of slides titled Overview Of Periodic Financial Indicators Performance Designs PDF. The topics addressed in these templates are Overview Of Periodic, Financial Indicators Performance. All the content presented in this PPT design is completely editable. Download it and make adjustments in color, background, font etc. as per your unique business setting.
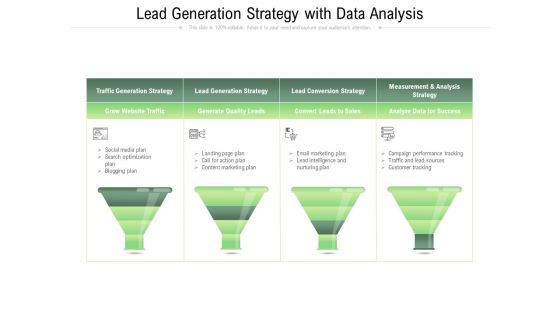
Lead Generation Strategy With Data Analysis Ppt PowerPoint Presentation Gallery Example PDF
Presenting lead generation strategy with data analysis ppt powerpoint presentation gallery example pdf to dispense important information. This template comprises four stages. It also presents valuable insights into the topics including grow, website, traffic. This is a completely customizable PowerPoint theme that can be put to use immediately. So, download it and address the topic impactfully.

Big Data Architect Big Data Architecture Layers Diagrams PDF
This slide describes the layers of big data architecture that include the big data source layer, management storage layer, analysis layer, and consumption layer. This is a Big Data Architect Big Data Architecture Layers Diagrams PDF template with various stages. Focus and dispense information on four stages using this creative set, that comes with editable features. It contains large content boxes to add your information on topics like Data Warehouses, Retrieve Business, Analysis Layer. You can also showcase facts, figures, and other relevant content using this PPT layout. Grab it now.
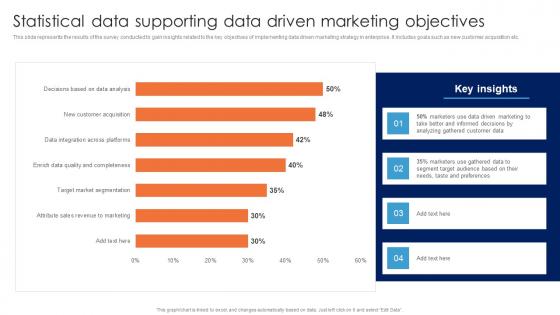
Statistical Data Supporting Data Driven Marketing Objectives Guide For Data Driven Advertising Elements Pdf
This slide represents the results of the survey conducted to gain insights related to the key objectives of implementing data driven marketing strategy in enterprise. It includes goals such as new customer acquisition etc.The Statistical Data Supporting Data Driven Marketing Objectives Guide For Data Driven Advertising Elements Pdf is a compilation of the most recent design trends as a series of slides. It is suitable for any subject or industry presentation, containing attractive visuals and photo spots for businesses to clearly express their messages. This template contains a variety of slides for the user to input data, such as structures to contrast two elements, bullet points, and slides for written information. Slidegeeks is prepared to create an impression. This slide represents the results of the survey conducted to gain insights related to the key objectives of implementing data driven marketing strategy in enterprise. It includes goals such as new customer acquisition etc.
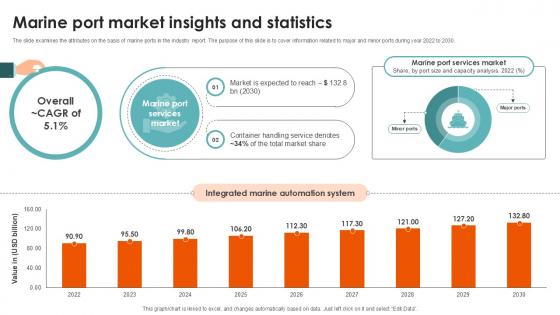
Marine Port Market Insights Port Terminal Industry Ppt Sample
The slide examines the attributes on the basis of marine ports in the industry report. The purpose of this slide is to cover information related to major and minor ports during year 2022 to 2030. The Marine Port Market Insights Port Terminal Industry Ppt Sample is a compilation of the most recent design trends as a series of slides. It is suitable for any subject or industry presentation, containing attractive visuals and photo spots for businesses to clearly express their messages. This template contains a variety of slides for the user to input data, such as structures to contrast two elements, bullet points, and slides for written information. Slidegeeks is prepared to create an impression. The slide examines the attributes on the basis of marine ports in the industry report. The purpose of this slide is to cover information related to major and minor ports during year 2022 to 2030.
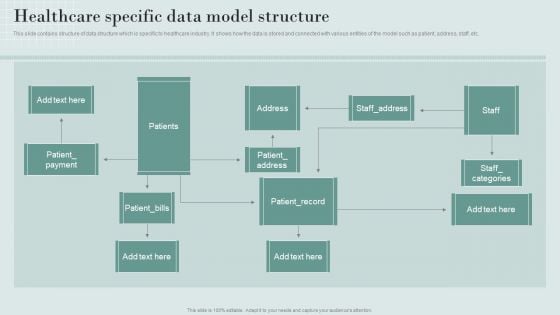
Data Structure IT Healthcare Specific Data Model Structure Brochure PDF
If you are looking for a format to display your unique thoughts, then the professionally designed Data Structure IT Healthcare Specific Data Model Structure Brochure PDF is the one for you. You can use it as a Google Slides template or a PowerPoint template. Incorporate impressive visuals, symbols, images, and other charts. Modify or reorganize the text boxes as you desire. Experiment with shade schemes and font pairings. Alter, share or cooperate with other people on your work. Download Data Structure IT Healthcare Specific Data Model Structure Brochure PDF and find out how to give a successful presentation. Present a perfect display to your team and make your presentation unforgettable.
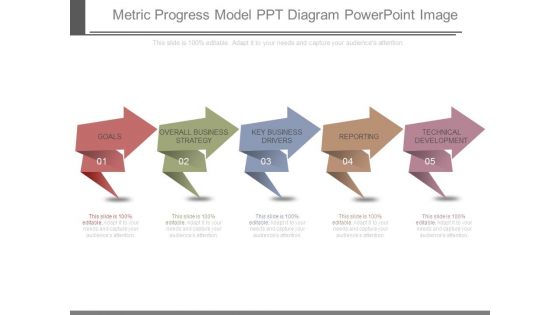
Metric Progress Model Ppt Diagram Powerpoint Image
This is a metric progress model ppt diagram powerpoint image. This is a five stage process. The stages in this process are goals, overall business strategy, key business drivers, reporting, technical development.
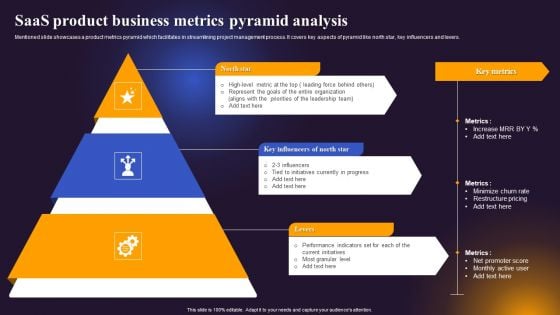
Saas Product Business Metrics Pyramid Analysis Portrait PDF
Mentioned slide showcases a product metrics pyramid which facilitates in streamlining project management process. It covers key aspects of pyramid like north star, key influencers and levers. Presenting Saas Product Business Metrics Pyramid Analysis Portrait PDF to dispense important information. This template comprises three stages. It also presents valuable insights into the topics including North Star, Key Influencers North Star, Levers. This is a completely customizable PowerPoint theme that can be put to use immediately. So, download it and address the topic impactfully.
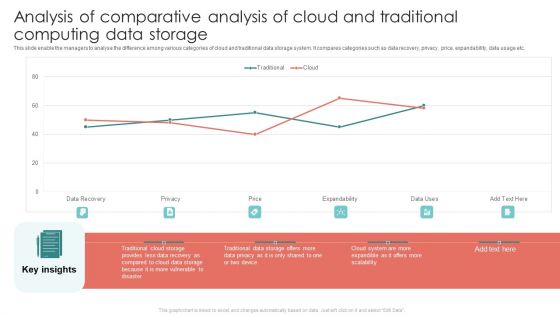
Analysis Of Comparative Analysis Of Cloud And Traditional Computing Data Storage Guidelines PDF
This slide enable the managers to analyse the difference among various categories of cloud and traditional data storage system. It compares categories such as data recovery, privacy, price, expandability, data usage etc. Showcasing this set of slides titled Analysis Of Comparative Analysis Of Cloud And Traditional Computing Data Storage Guidelines PDF. The topics addressed in these templates are Provides Less, Because Vulnerable, Expandability. All the content presented in this PPT design is completely editable. Download it and make adjustments in color, background, font etc. as per your unique business setting.
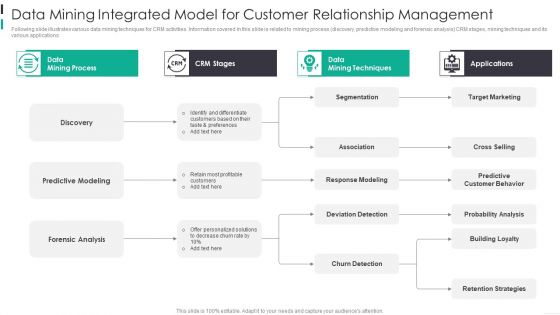
Data Mining Integrated Model For Customer Relationship Management Themes PDF
Following slide illustrates various data mining techniques for CRM activities. Information covered in this slide is related to mining process discovery, predictive modeling and forensic analysis CRM stages, mining techniques and its various applications. Showcasing this set of slides titled Data Mining Integrated Model For Customer Relationship Management Themes PDF The topics addressed in these templates are Predictive Modeling, Forensic Analysis, Response Modeling All the content presented in this PPT design is completely editable. Download it and make adjustments in color, background, font etc. as per your unique business setting.
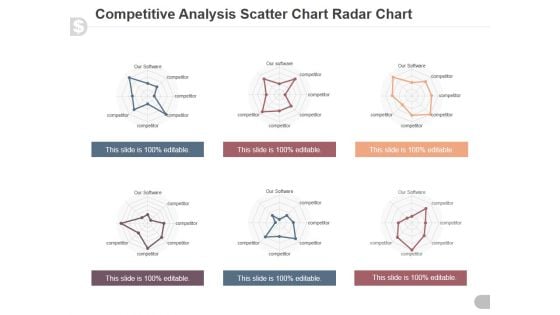
Competitive Analysis Scatter Chart Radar Chart Ppt PowerPoint Presentation Model
This is a competitive analysis scatter chart radar chart ppt powerpoint presentation model. This is a eight stage process. The stages in this process are users interface, data import, example, pricing, support, update, tutorials, easy to use.
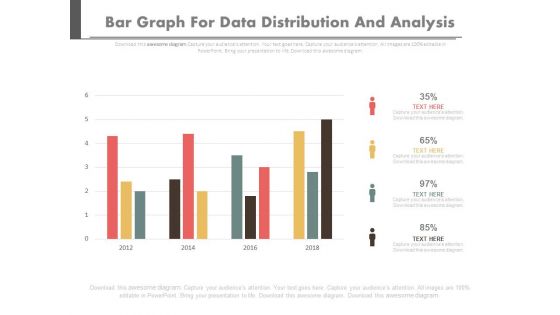
Bar Graph For Data Distribution And Analysis Powerpoint Slides
This PowerPoint template has been designed with bar graph. This PowerPoint diagram is useful for data distribution and analysis This diagram slide can be used to make impressive presentations.
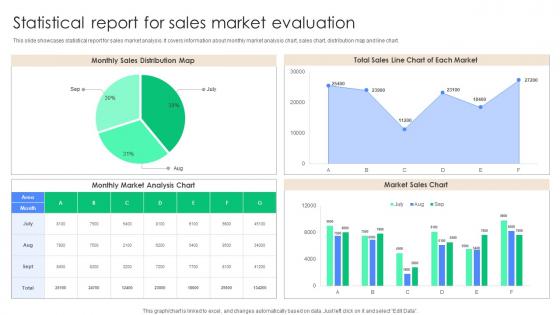
Statistical Report For Sales Market Evaluation Clipart Pdf
This slide showcases statistical report for sales market analysis. It covers information about monthly market analysis chart, sales chart, distribution map and line chart. Showcasing this set of slides titled Statistical Report For Sales Market Evaluation Clipart Pdf. The topics addressed in these templates are Monthly Market Analysis Chart, Market Sales Chart, Sales Chart Each Market. All the content presented in this PPT design is completely editable. Download it and make adjustments in color, background, font etc. as per your unique business setting. This slide showcases statistical report for sales market analysis. It covers information about monthly market analysis chart, sales chart, distribution map and line chart.
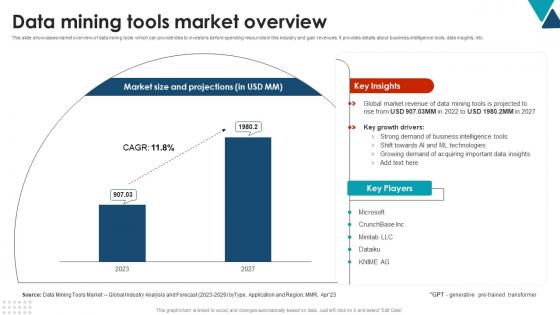
Data Mining Tools Market Overview Using Data Mining Tools To Optimize Processes AI SS V
This slide showcases market overview of data mining tools which can provide idea to investors before spending resources in this industry and gain revenues. It provides details about business intelligence tools, data insights, etc. The Data Mining Tools Market Overview Using Data Mining Tools To Optimize Processes AI SS V is a compilation of the most recent design trends as a series of slides. It is suitable for any subject or industry presentation, containing attractive visuals and photo spots for businesses to clearly express their messages. This template contains a variety of slides for the user to input data, such as structures to contrast two elements, bullet points, and slides for written information. Slidegeeks is prepared to create an impression. This slide showcases market overview of data mining tools which can provide idea to investors before spending resources in this industry and gain revenues. It provides details about business intelligence tools, data insights, etc.
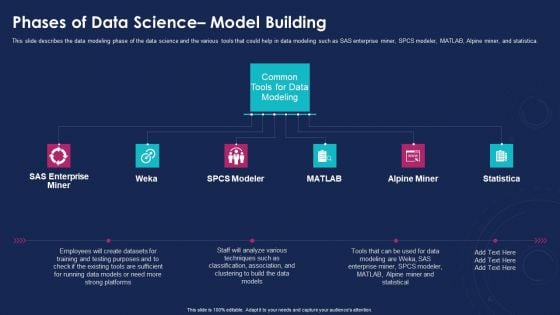
Data Analytics IT Phases Of Data Science Model Building Graphics PDF
This slide describes the data modeling phase of the data science and the various tools that could help in data modeling such as SAS enterprise miner, SPCS modeler, MATLAB, Alpine miner, and statistica. Presenting data analytics it phases of data science model building graphics pdf to provide visual cues and insights. Share and navigate important information on six stages that need your due attention. This template can be used to pitch topics like alpine miner, matlab, spcs modeler, weka, sas enterprise miner. In addtion, this PPT design contains high resolution images, graphics, etc, that are easily editable and available for immediate download.
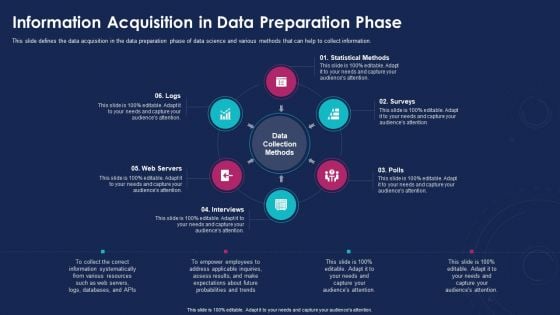
Data Analytics IT Information Acquisition In Data Preparation Phase Ppt Styles Aids PDF
This slide defines the data acquisition in the data preparation phase of data science and various methods that can help to collect information. Presenting data analytics it information acquisition in data preparation phase ppt styles aids pdf to provide visual cues and insights. Share and navigate important information on six stages that need your due attention. This template can be used to pitch topics like logs, web servers, interviews, polls, surveys. In addtion, this PPT design contains high resolution images, graphics, etc, that are easily editable and available for immediate download.
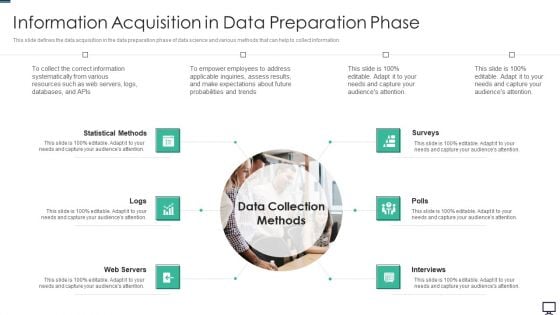
Data Analytics Information Acquisition In Data Preparation Phase Ppt Ideas Designs PDF
This slide defines the data acquisition in the data preparation phase of data science and various methods that can help to collect information. Presenting data analytics information acquisition in data preparation phase ppt ideas designs pdf to provide visual cues and insights. Share and navigate important information on six stages that need your due attention. This template can be used to pitch topics like statistical methods, web servers, interviews, surveys. In addtion, this PPT design contains high resolution images, graphics, etc, that are easily editable and available for immediate download.
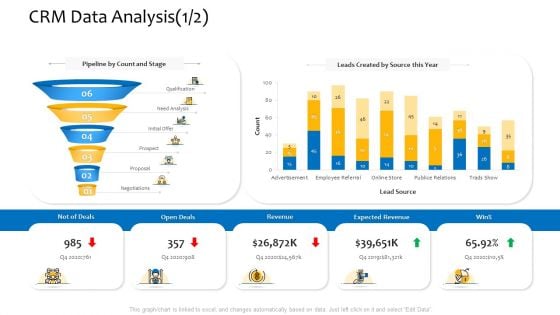
Customer Relationship Management Procedure CRM Data Analysis Need Analysis Brochure PDF
Deliver and pitch your topic in the best possible manner with this customer relationship management procedure CRM data analysis need analysis brochure pdf. Use them to share invaluable insights on pipeline by count and stage, need analysis, leads created by source this year, expected revenue, negotiations and impress your audience. This template can be altered and modified as per your expectations. So, grab it now.
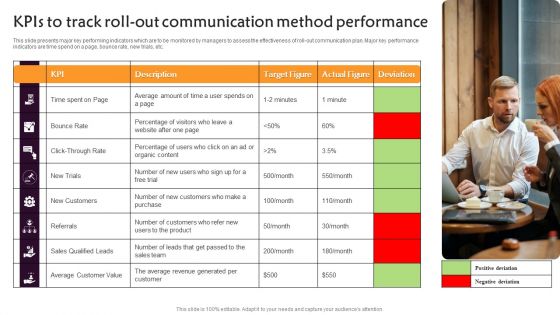
Kpis To Track Roll Out Communication Method Performance Demonstration PDF
This slide presents major key performing indicators which are to be monitored by managers to assess the effectiveness of roll-out communication plan. Major key performance indicators are time spend on a page, bounce rate, new trials, etc. Presenting Kpis To Track Roll Out Communication Method Performance Demonstration PDF to dispense important information. This template comprises one stages. It also presents valuable insights into the topics including Bounce Rate, New Trials, Referrals. This is a completely customizable PowerPoint theme that can be put to use immediately. So, download it and address the topic impactfully.
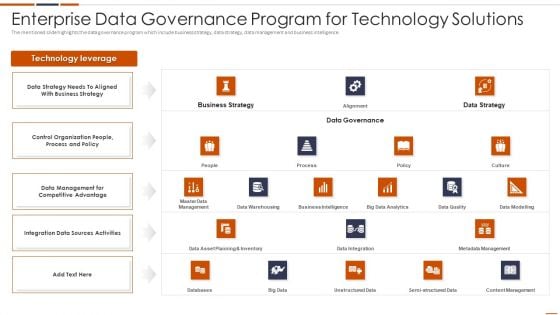
Enterprise Data Governance Program For Technology Solutions Themes PDF
The mentioned slide highlights the data governance program which include business strategy, data strategy, data management and business intelligence.Pitch your topic with ease and precision using this Enterprise Data Governance Program For Technology Solutions Themes PDF This layout presents information on Business Intelligence, Management For Competitive Advantage, Business Strategy It is also available for immediate download and adjustment. So, changes can be made in the color, design, graphics or any other component to create a unique layout.
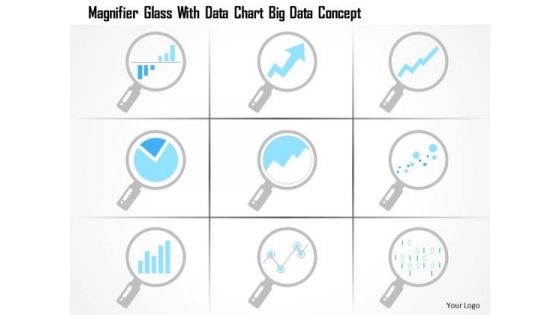
Business Diagram Magnifier Glass With Data Chart Big Data Concept Ppt Slide
This technology diagram has been designed with graphic of magnifier glass and big data chart. This diagram slide depicts the concept of data search. Use this diagram for your data search and focus related topics.
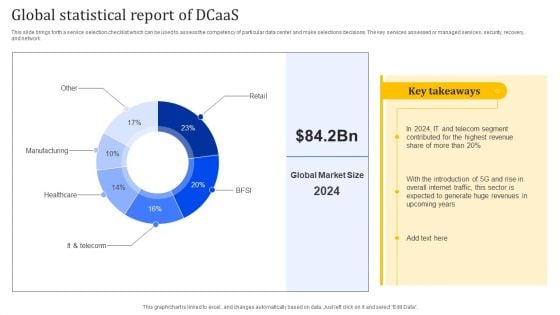
Global Statistical Report Of Dcaas Portrait PDF
This slide brings forth a service selection checklist which can be used to assess the competency of particular data center and make selections decisions. The key services assessed or managed services, security, recovery, and network. Showcasing this set of slides titled Global Statistical Report Of Dcaas Portrait PDF. The topics addressed in these templates are Manufacturing, Healthcare, Global Statistical. All the content presented in this PPT design is completely editable. Download it and make adjustments in color, background, font etc. as per your unique business setting.
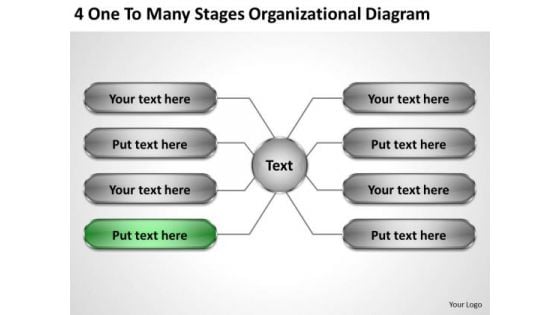
Sales Concepts 4 One To Many Stages Organizational Diagram Ppt Business Strategy Development
We present our sales concepts 4 one to many stages organizational diagram ppt business strategy development.Download our Business PowerPoint Templates because You are an avid believer in ethical practices. Highlight the benefits that accrue with our PowerPoint Templates and Slides. Download and present our Marketing PowerPoint Templates because our bewitching PowerPoint Templates and Slides will delight your audience with the magic of your words. Present our Finance PowerPoint Templates because You can Stir your ideas in the cauldron of our PowerPoint Templates and Slides. Cast a magic spell on your audience. Download and present our Circle Charts PowerPoint Templates because our PowerPoint Templates and Slides are the string of your bow. Fire of your ideas and conquer the podium. Download and present our Process and Flows PowerPoint Templates because You aspire to touch the sky with glory. Let our PowerPoint Templates and Slides provide the fuel for your ascent.Use these PowerPoint slides for presentations relating to diagram, process, plan, parts, vector, graph, business, boxes, wheel, network, statistics, item, junction, corporate, arrow, presentation, template, circle, brochure, data, report, marketing, different, management, multicolored, modern, illustration, three, pie, connection, chart, sphere, options, strategy, catalog, spherical, segments, schematic, tab, company, banner, menu, information, note, navigation, structure, communication. The prominent colors used in the PowerPoint template are Green, Gray, Black. Give your thoughts an artistic backing. Add on the craftsmanship of our Sales Concepts 4 One To Many Stages Organizational Diagram Ppt Business Strategy Development.
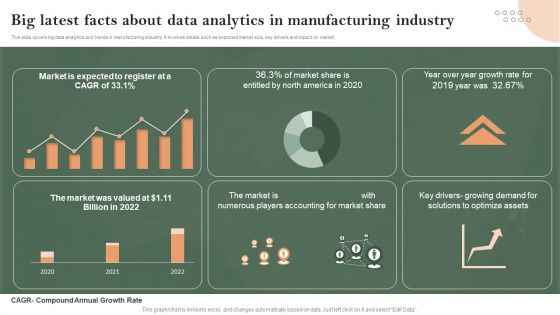
Big Latest Facts About Data Analytics In Manufacturing Industry Infographics PDF
This slide covers big data analytics and trends in manufacturing industry. It involves details such as expected market size, key drivers and impact on market. Pitch your topic with ease and precision using this Big Latest Facts About Data Analytics In Manufacturing Industry Infographics PDF. This layout presents information on Big Latest Facts, About Data Analytics, Manufacturing Industry. It is also available for immediate download and adjustment. So, changes can be made in the color, design, graphics or any other component to create a unique layout.
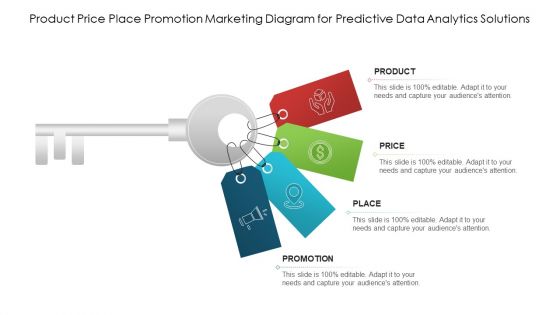
Product Price Place Promotion Marketing Diagram For Predictive Data Analytics Solutions Designs PDF
Presenting product price place promotion marketing diagram for predictive data analytics solutions designs pdf to dispense important information. This template comprises four stages. It also presents valuable insights into the topics including price, product, promotion. This is a completely customizable PowerPoint theme that can be put to use immediately. So, download it and address the topic impactfully.

Enterprise KPIS Diagram PowerPoint Topics
Presenting this set of slides with name enterprise kpis diagram powerpoint topics. This is a five stage process. The stages in this process are industry, financials, people, efficiency, corporate. This is a completely editable PowerPoint presentation and is available for immediate download. Download now and impress your audience.
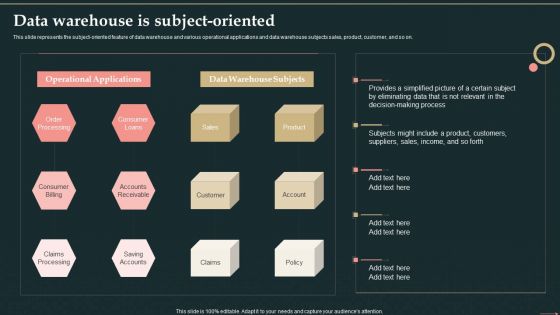
Management Information System Data Warehouse Is Subject Oriented Themes PDF
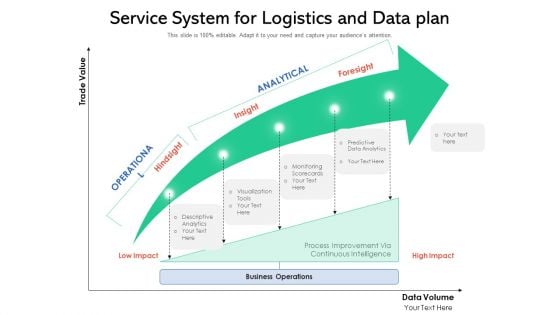
Service System For Logistics And Data Plan Ppt Pictures Graphic Images PDF
Presenting service system for logistics and data plan ppt pictures graphic images pdf to dispense important information. This template comprises one stage. It also presents valuable insights into the topics including business operations, monitoring, predictive data analytics. This is a completely customizable PowerPoint theme that can be put to use immediately. So, download it and address the topic impactfully.
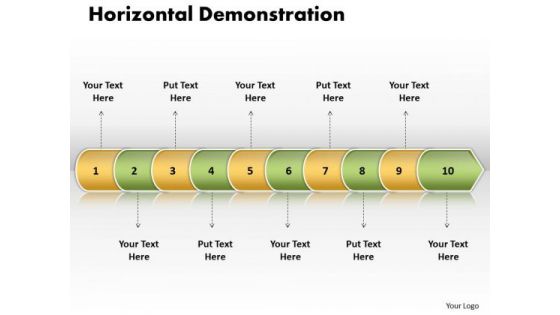
Ppt Linear Arrow 10 Phase Diagram PowerPoint Templates
PPT linear arrow 10 phase diagram PowerPoint Templates-Use this PowerPoint diagram to define basic work and data flow and quality management processes to increase efficiency of your business.-PPT linear arrow 10 phase diagram PowerPoint Templates-Arrow, Background, Collection, Completed, Concept, Confirmation, Design, Flow, Graph, Graphic, Illustration, Indication, Indicator, Information, Instruction, Interface, Internet, Layout, Measurement, Order, Phase, Pointer, Process, Progress, Reflection, Scale, Shape, Sign Start a company with our Ppt Linear Arrow 10 Phase Diagram PowerPoint Templates. Just download, type and present.
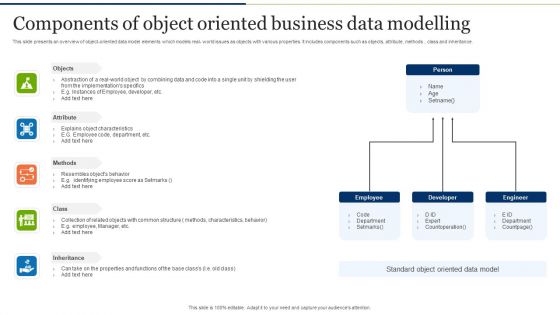
Components Of Object Oriented Business Data Modelling Themes PDF
Showcasing this set of slides titled Components Of Object Oriented Business Data Modelling Themes PDF. The topics addressed in these templates are Oriented Business, Data Modelling. All the content presented in this PPT design is completely editable. Download it and make adjustments in color, background, font etc. as per your unique business setting.
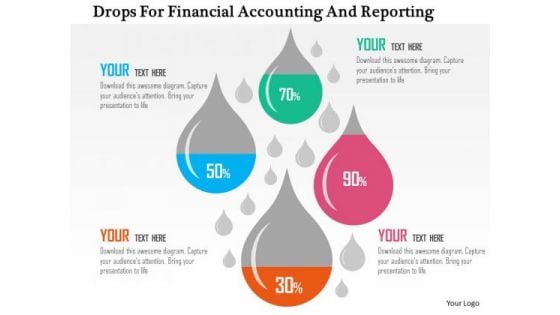
Business Diagram Drops For Financial Accounting And Reporting Presentation Template
This business diagram has been designed with drops displaying financial ratios. Download this diagram to depict financial and accounting ratios. Use this slide to build quality presentations for your viewers.
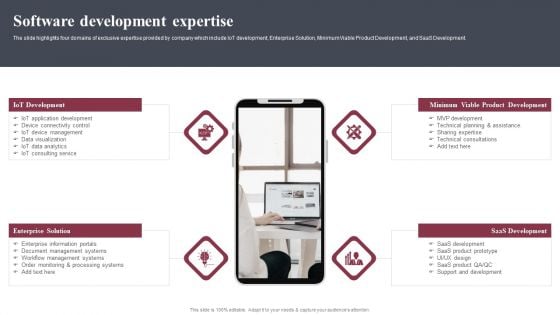
Business Software Development Company Profile Software Development Expertise Themes PDF
The slide highlights four domains of exclusive expertise provided by company which include IoT development, Enterprise Solution, Minimum Viable Product Development, and SaaS Development. Presenting Business Software Development Company Profile Software Development Expertise Themes PDF to provide visual cues and insights. Share and navigate important information on four stages that need your due attention. This template can be used to pitch topics like IoT Development, Enterprise Solution, Minimum Viable, Product Development. In addtion, this PPT design contains high resolution images, graphics, etc, that are easily editable and available for immediate download.
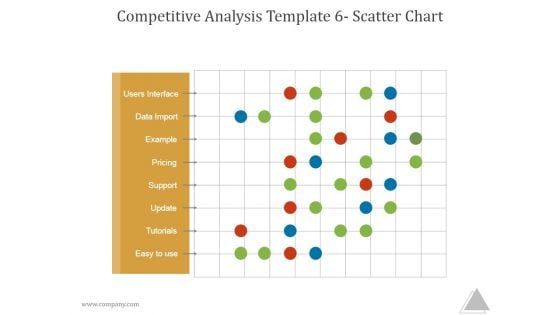
Competitive Analysis Template 6 Scatter Chart Ppt PowerPoint Presentation Shapes
This is a competitive analysis template 6 scatter chart ppt powerpoint presentation shapes. This is a one stage process. The stages in this process are users interface, data import, example, pricing, support update, tutorials, easy to use.
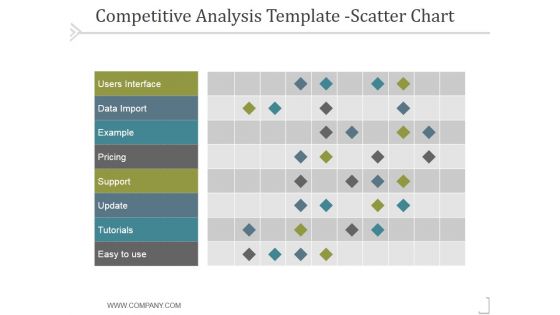
Competitive Analysis Scatter Chart Template 2 Ppt PowerPoint Presentation Files
This is a competitive analysis scatter chart template 2 ppt powerpoint presentation files. This is a nine stage process. The stages in this process are users interface, data import, example, pricing, support, update.
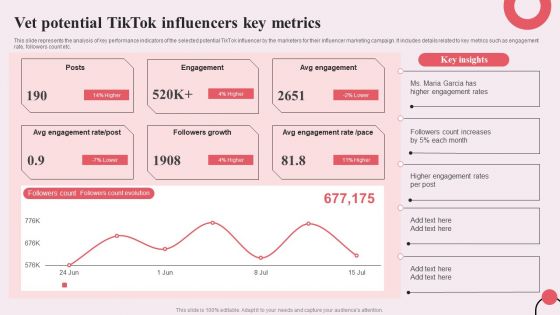
Tiktok Digital Marketing Campaign Vet Potential Tiktok Influencers Key Metrics Download PDF
This slide represents the analysis of key performance indicators of the selected potential TikTok influencer by the marketers for their influencer marketing campaign. It includes details related to key metrics such as engagement rate, followers count etc. Do you have to make sure that everyone on your team knows about any specific topic I yes, then you should give Tiktok Digital Marketing Campaign Vet Potential Tiktok Influencers Key Metrics Download PDF a try. Our experts have put a lot of knowledge and effort into creating this impeccable Tiktok Digital Marketing Campaign Vet Potential Tiktok Influencers Key Metrics Download PDF. You can use this template for your upcoming presentations, as the slides are perfect to represent even the tiniest detail. You can download these templates from the Slidegeeks website and these are easy to edit. So grab these today
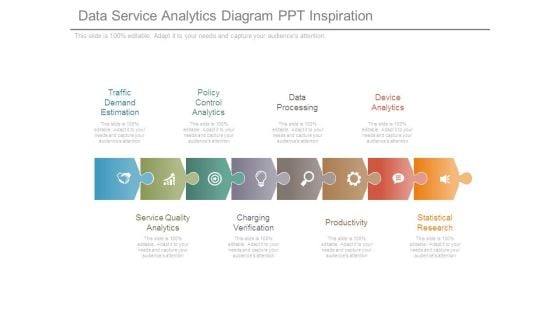
Data Service Analytics Diagram Ppt Inspiration
This is a data service analytics diagram ppt inspiration. This is a eight stage process. The stages in this process are traffic demand estimation, policy control analytics, data processing, device analytics, service quality analytics, charging verification, productivity, statistical research.
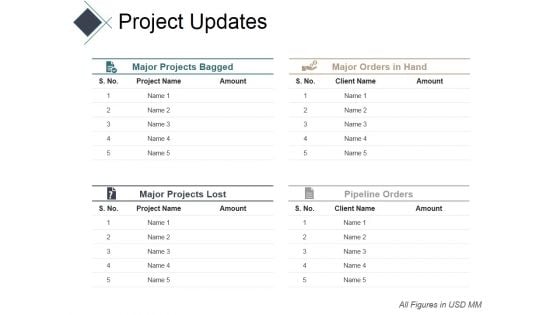
Project Updates Ppt PowerPoint Presentation Ideas Diagrams
This is a project updates ppt powerpoint presentation ideas diagrams. This is a four stage process. The stages in this process are major projects bagged, major orders in hand, major projects lost, pipeline orders.

Analysing Business Monthly Sales Revenue Report Strategic Approaches To Corporate Financial
This slide showcases the sales revenue report in order to monitor, analyze and track monthly sales trends. Key reasons for the decline include new competitors in the market, unable to adopt new technology, and production haltered. Boost your pitch with our creative Analysing Business Monthly Sales Revenue Report Strategic Approaches To Corporate Financial. Deliver an awe-inspiring pitch that will mesmerize everyone. Using these presentation templates you will surely catch everyones attention. You can browse the ppts collection on our website. We have researchers who are experts at creating the right content for the templates. So you do not have to invest time in any additional work. Just grab the template now and use them. This slide showcases the sales revenue report in order to monitor, analyze and track monthly sales trends. Key reasons for the decline include new competitors in the market, unable to adopt new technology, and production haltered.
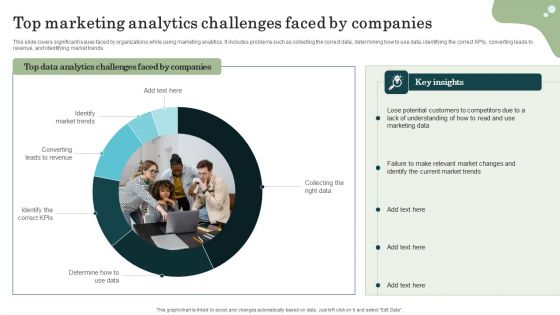
Marketing Success Metrics Top Marketing Analytics Challenges Faced By Inspiration PDF
This slide covers significant issues faced by organizations while using marketing analytics. It includes problems such as collecting the correct data, determining how to use data, identifying the correct KPIs, converting leads to revenue, and identifying market trends. Boost your pitch with our creative Marketing Success Metrics Top Marketing Analytics Challenges Faced By Inspiration PDF. Deliver an awe-inspiring pitch that will mesmerize everyone. Using these presentation templates you will surely catch everyones attention. You can browse the ppts collection on our website. We have researchers who are experts at creating the right content for the templates. So you dont have to invest time in any additional work. Just grab the template now and use them.
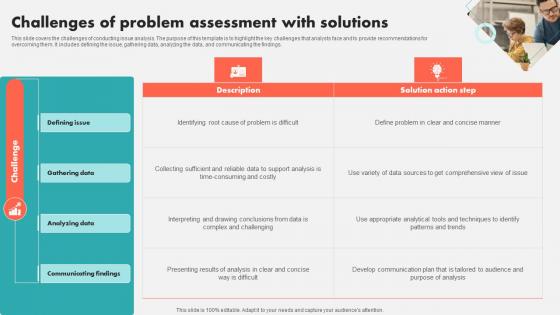
Challenges Of Problem Assessment With Solutions Diagrams Pdf
This slide covers the challenges of conducting issue analysis. The purpose of this template is to highlight the key challenges that analysts face and to provide recommendations for overcoming them. It includes defining the issue, gathering data, analyzing the data, and communicating the findings.Pitch your topic with ease and precision using this Challenges Of Problem Assessment With Solutions Diagrams Pdf This layout presents information on Communicating Findings, Analyzing Data, Gathering Data It is also available for immediate download and adjustment. So, changes can be made in the color, design, graphics or any other component to create a unique layout. This slide covers the challenges of conducting issue analysis. The purpose of this template is to highlight the key challenges that analysts face and to provide recommendations for overcoming them. It includes defining the issue, gathering data, analyzing the data, and communicating the findings.
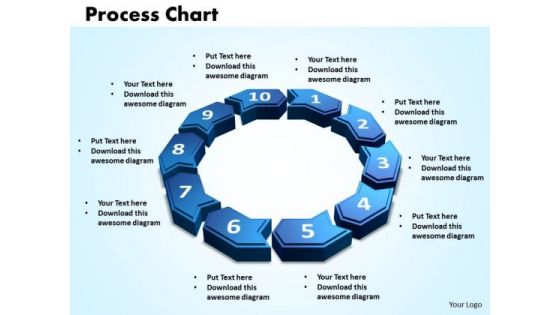
PowerPoint Slides Process Charts Success Ppt Presentation
PowerPoint Slides process charts Success PPT Presentation-More than one sector can be presented with this power point slides. This PPT presentation can be used to present the data of a complete year to the audience-Chart, circle, circular, circulation, concept, connection, continuity, correlate, course, cycle, cyclic, diagram, direction, duplicate, flow, four, iterate, manage, method, presentation, procedure, process, recycle, refresh, relate, repeat, repetition, report, review, ring, rotation, round, sequence, simple, stage, step, strategy, success, system, work flow-PowerPoint Slides process charts Success PPT Presentation Get a close look at our excellent PowerPoint Slides Process Charts Success Ppt Presentation. Just ask your mouse to 'go fetch 'em'.
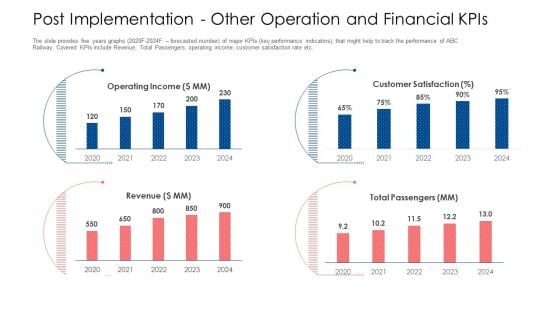
Post Implementation Other Operation And Financial Kpis Ppt Infographic Template PDF
The slide provides five years graphs 2020F-2024F forecasted number of major KPIs key performance indicators, that might help to track the performance of ABC Railway. Covered KPIs include Revenue, Total Passengers, operating income, customer satisfaction rate etc. Deliver an awe inspiring pitch with this creative post implementation other operation and financial kpis ppt infographic template pdf bundle. Topics like operating income, revenue, customer satisfaction can be discussed with this completely editable template. It is available for immediate download depending on the needs and requirements of the user.
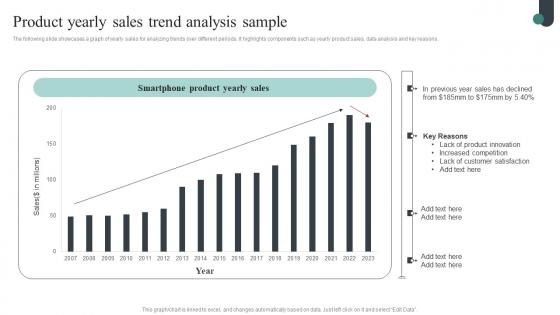
Competitive Intelligence Guide To Determine Market Product Yearly Sales Trend Download Pdf
The following slide showcases a graph of yearly sales for analyzing trends over different periods. It highlights components such as yearly product sales, data analysis and key reasons. This modern and well-arranged Competitive Intelligence Guide To Determine Market Product Yearly Sales Trend Download Pdf provides lots of creative possibilities. It is very simple to customize and edit with the Powerpoint Software. Just drag and drop your pictures into the shapes. All facets of this template can be edited with Powerpoint no extra software is necessary. Add your own material, put your images in the places assigned for them, adjust the colors, and then you can show your slides to the world, with an animated slide included. The following slide showcases a graph of yearly sales for analyzing trends over different periods. It highlights components such as yearly product sales, data analysis and key reasons.
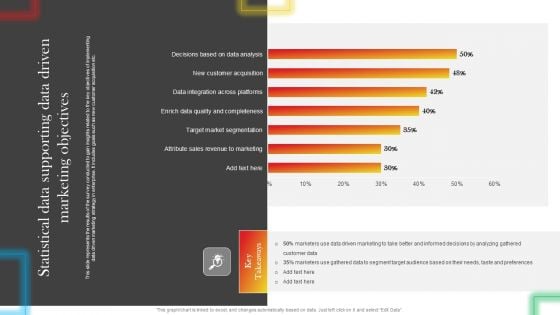
Statistical Data Supporting Data Driven Marketing Objectives Summary PDF
This slide represents the results of the survey conducted to gain insights related to the key objectives of implementing data driven marketing strategy in enterprise. It includes goals such as new customer acquisition etc. Are you in need of a template that can accommodate all of your creative concepts This one is crafted professionally and can be altered to fit any style. Use it with Google Slides or PowerPoint. Include striking photographs, symbols, depictions, and other visuals. Fill, move around, or remove text boxes as desired. Test out color palettes and font mixtures. Edit and save your work, or work with colleagues. Download Statistical Data Supporting Data Driven Marketing Objectives Summary PDF and observe how to make your presentation outstanding. Give an impeccable presentation to your group and make your presentation unforgettable.
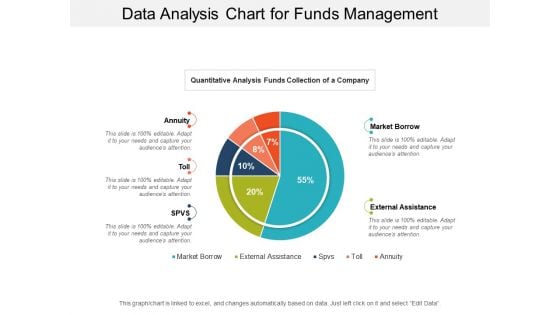
Data Analysis Chart For Funds Management Ppt PowerPoint Presentation Infographic Template Files
This is a data analysis chart for funds management ppt powerpoint presentation infographic template files. This is a five stage process. The stages in this process are financial analysis, quantitative, statistical modelling.
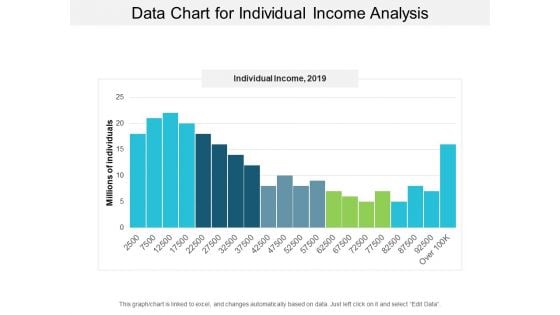
Data Chart For Individual Income Analysis Ppt PowerPoint Presentation Layouts Visual Aids
This is a data chart for individual income analysis ppt powerpoint presentation layouts visual aids. This is a five stage process. The stages in this process are financial analysis, quantitative, statistical modelling.
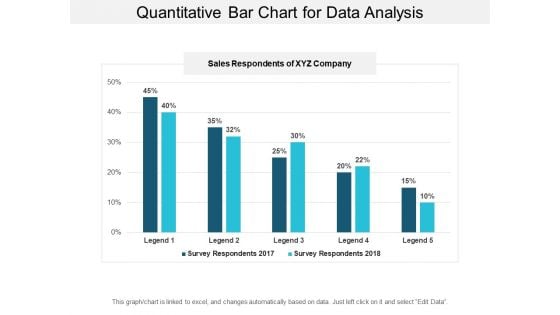
Quantitative Bar Chart For Data Analysis Ppt PowerPoint Presentation Model Graphic Tips
This is a quantitative bar chart for data analysis ppt powerpoint presentation model graphic tips. This is a two stage process. The stages in this process are financial analysis, quantitative, statistical modelling.
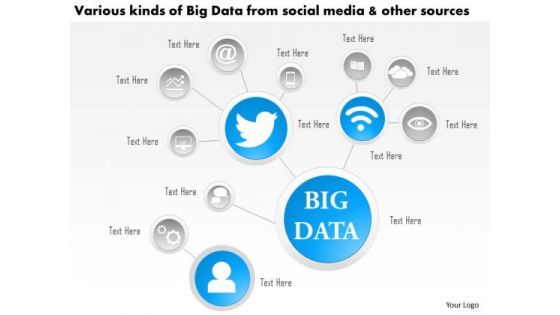
Business Diagram Various Kinds Of Big Data From Social Media And Other Sources Ppt Slide
This technology diagram contains the concept of big data analysis. This slide depicts various kinds of social media and other sources. Use this diagram for mobile and communication related presentations.
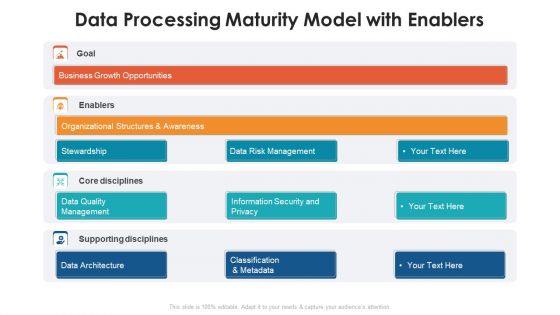
Data Processing Maturity Model With Enablers Themes PDF
Showcasing this set of slides titled data processing maturity model with enablers themes pdf. The topics addressed in these templates are goal, awareness, management. All the content presented in this PPT design is completely editable. Download it and make adjustments in color, background, font etc. as per your unique business setting.
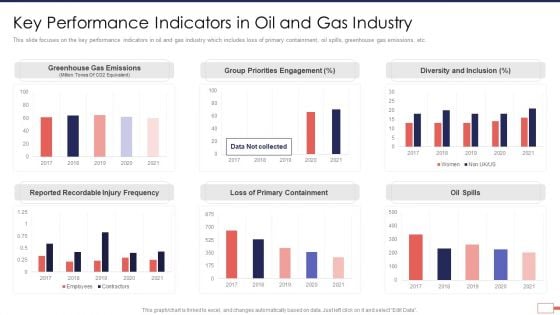
Iot Digital Twin Technology Post Covid Expenditure Management Key Performance Indicators Background PDF
This slide focuses on the key performance indicators in oil and gas industry which includes loss of primary containment, oil spills, greenhouse gas emissions, etc. Deliver an awe inspiring pitch with this creative iot digital twin technology post covid expenditure management key performance indicators background pdf bundle. Topics like key performance indicators in oil and gas industry can be discussed with this completely editable template. It is available for immediate download depending on the needs and requirements of the user.
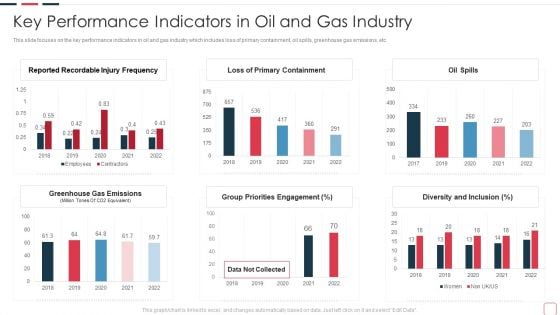
Price Benefit Internet Things Digital Twins Execution After Covid Key Performance Indicators In Oil Slides PDF
This slide focuses on the key performance indicators in oil and gas industry which includes loss of primary containment, oil spills, greenhouse gas emissions, etc. Deliver an awe inspiring pitch with this creative price benefit internet things digital twins execution after covid key performance indicators in oil slides pdf bundle. Topics like key performance indicators in oil and gas industry can be discussed with this completely editable template. It is available for immediate download depending on the needs and requirements of the user.
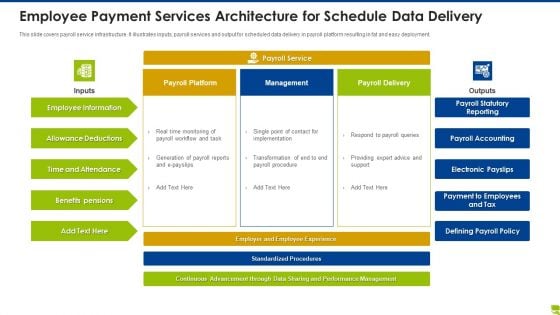
Employee Payment Services Architecture For Schedule Data Delivery Themes PDF
This slide covers payroll service infrastructure. It illustrates inputs, payroll services and output for scheduled data delivery in payroll platform resulting in fat and easy deployment. Showcasing this set of slides titled employee payment services architecture for schedule data delivery themes pdf. The topics addressed in these templates are employee information, allowance deductions, time and attendance, benefits pensions. All the content presented in this PPT design is completely editable. Download it and make adjustments in color, background, font etc. as per your unique business setting.
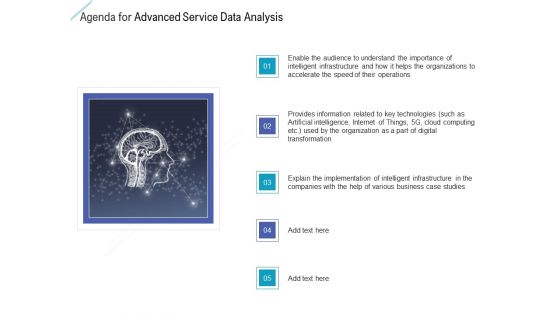
Agenda For Advanced Service Data Analysis Introduction PDF
This is a agenda for advanced service data analysis introduction pdf template with various stages. Focus and dispense information on five stages using this creative set, that comes with editable features. It contains large content boxes to add your information on topics like agenda for advanced service data analysis. You can also showcase facts, figures, and other relevant content using this PPT layout. Grab it now.
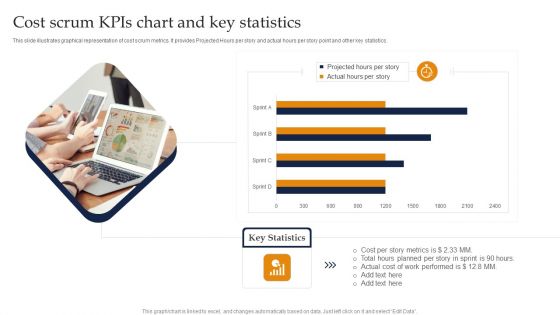
Cost Scrum Kpis Chart And Key Statistics Ppt Layouts Example Introduction PDF
This slide illustrates graphical representation of cost scrum metrics. It provides Projected Hours per story and actual hours per story point and other key statistics. Pitch your topic with ease and precision using this Cost Scrum Kpis Chart And Key Statistics Ppt Layouts Example Introduction PDF. This layout presents information on Projected Hours, Cost Per Story, Metrics, Actual Cost. It is also available for immediate download and adjustment. So, changes can be made in the color, design, graphics or any other component to create a unique layout.
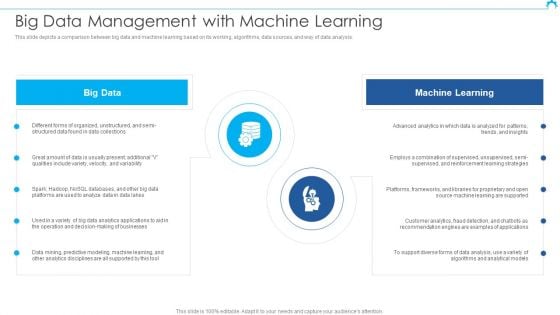
Big Data Architect Big Data Management With Machine Learning Diagrams PDF
This slide depicts a comparison between big data and machine learning based on its working, algorithms, data sources, and way of data analysis.Deliver an awe inspiring pitch with this creative Big Data Architect Big Data Management With Machine Learning Diagrams PDF bundle. Topics like Different Forms, Organized Unstructured, Found Collections can be discussed with this completely editable template. It is available for immediate download depending on the needs and requirements of the user.
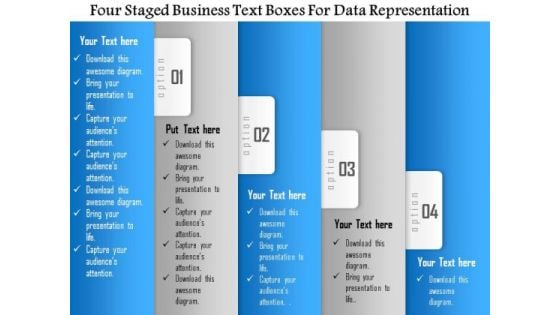
Business Diagram Four Staged Business Text Boxes For Data Representation Presentation Template
Four staged business text boxes are used to design this Power Point template slide. This PPT slide contains the concept of data representation. Use this PPT slide for your business and sales data analysis related topics in any presentation.
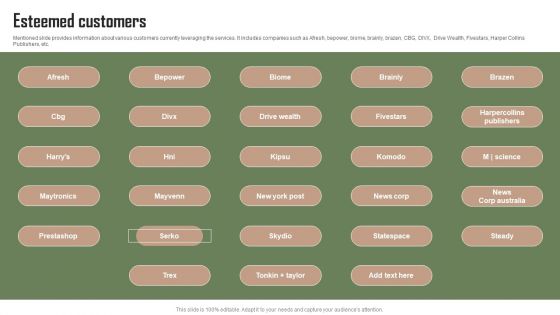
Data Automation Solution Investor Funding Presentation Esteemed Customers Themes PDF
Mentioned slide provides information about various customers currently leveraging the services. It includes companies such as Afresh, bepower, biome, brainly, brazen, CBG, DIVX, Drive Wealth, Fivestars, Harper Collins Publishers, etc. Do you have to make sure that everyone on your team knows about any specific topic I yes, then you should give Data Automation Solution Investor Funding Presentation Esteemed Customers Themes PDF a try. Our experts have put a lot of knowledge and effort into creating this impeccable Data Automation Solution Investor Funding Presentation Esteemed Customers Themes PDF. You can use this template for your upcoming presentations, as the slides are perfect to represent even the tiniest detail. You can download these templates from the Slidegeeks website and these are easy to edit. So grab these today.
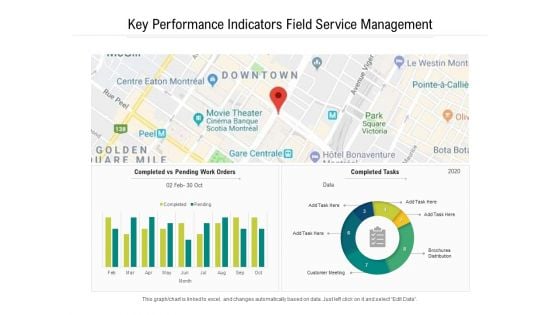
Key Performance Indicators Field Service Management Ppt PowerPoint Presentation Gallery Rules PDF
Presenting this set of slides with name key performance indicators field service management ppt powerpoint presentation gallery rules pdf. The topics discussed in these slide is key performance indicators field service management. This is a completely editable PowerPoint presentation and is available for immediate download. Download now and impress your audience.
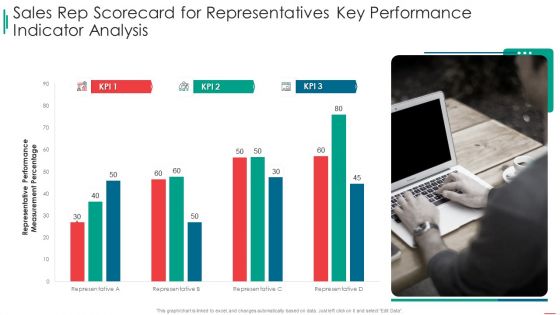
Sales Rep Scorecard Sales Rep Scorecard For Representatives Key Performance Indicator Analysis Portrait PDF
Deliver an awe inspiring pitch with this creative sales rep scorecard sales rep scorecard for representatives key performance indicator analysis portrait pdf bundle. Topics like sales rep scorecard for representatives key performance indicator analysis can be discussed with this completely editable template. It is available for immediate download depending on the needs and requirements of the user.
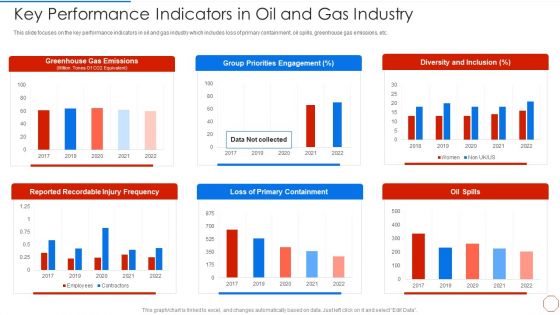
Minimizing Operational Cost Through Iot Virtual Twins Implementation Key Performance Indicators Slides PDF
Deliver and pitch your topic in the best possible manner with this minimizing operational cost through iot virtual twins implementation key performance indicators slides pdf. Use them to share invaluable insights on key performance indicators in oil and gas industry and impress your audience. This template can be altered and modified as per your expectations. So, grab it now.
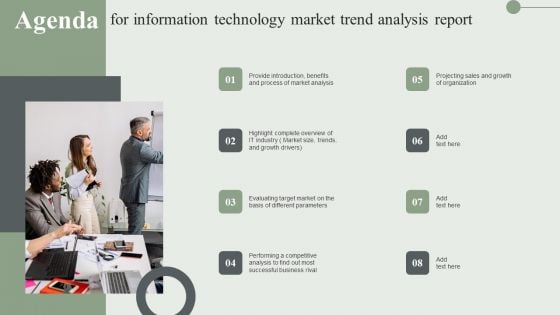
Agenda For Information Technology Market Trend Analysis Report Ppt PowerPoint Presentation File Diagrams PDF
Retrieve professionally designed Agenda For Information Technology Market Trend Analysis Report Ppt PowerPoint Presentation File Diagrams PDF to effectively convey your message and captivate your listeners. Save time by selecting pre made slideshows that are appropriate for various topics, from business to educational purposes. These themes come in many different styles, from creative to corporate, and all of them are easily adjustable and can be edited quickly. Access them as PowerPoint templates or as Google Slides themes. You do not have to go on a hunt for the perfect presentation because Slidegeeks got you covered from everywhere.
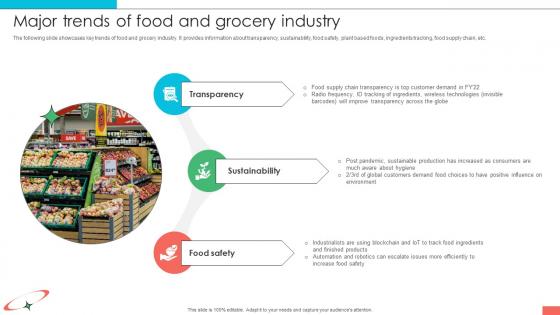
Marketing Strategies For Effective Major Trends Of Food And Grocery Industry
The following slide showcases key trends of food and grocery industry. It provides information about transparency, sustainability, food safety, plant based foods, ingredients tracking, food supply chain, etc. Are you searching for a Marketing Strategies For Effective Major Trends Of Food And Grocery Industry that is uncluttered, straightforward, and original Its easy to edit, and you can change the colors to suit your personal or business branding. For a presentation that expresses how much effort you have put in, this template is ideal With all of its features, including tables, diagrams, statistics, and lists, its perfect for a business plan presentation. Make your ideas more appealing with these professional slides. Download Marketing Strategies For Effective Major Trends Of Food And Grocery Industry from Slidegeeks today. The following slide showcases key trends of food and grocery industry. It provides information about transparency, sustainability, food safety, plant based foods, ingredients tracking, food supply chain, etc.
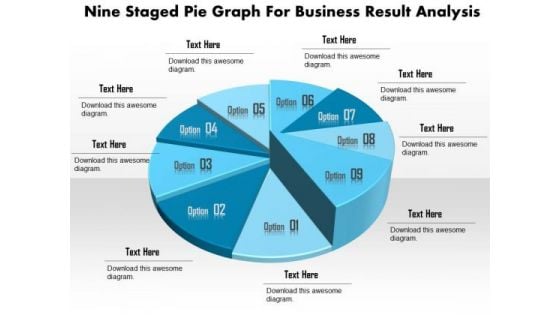
Business Diagram Nine Staged Pie Graph For Business Result Analysis Presentation Template
This business slide displays nine staged pie chart. This diagram is a data visualization tool that gives you a simple way to present statistical information. This slide helps your audience examine and interpret the data you present.
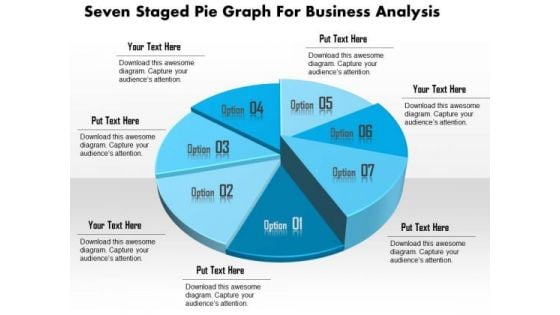
Business Diagram Seven Staged Pie Graph For Business Analysis Presentation Template
This business slide displays seven staged pie chart. This diagram is a data visualization tool that gives you a simple way to present statistical information. This slide helps your audience examine and interpret the data you present.
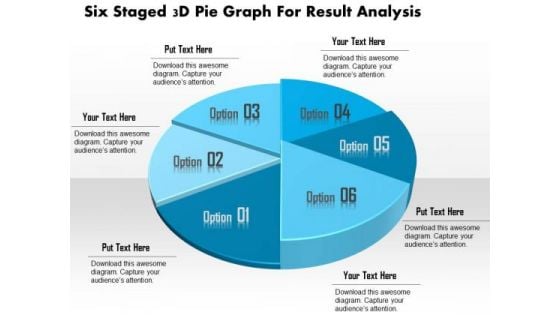
Business Diagram Six Staged 3d Pie Graph For Result Analysis Presentation Template
This business slide displays six staged pie chart. This diagram is a data visualization tool that gives you a simple way to present statistical information. This slide helps your audience examine and interpret the data you present.
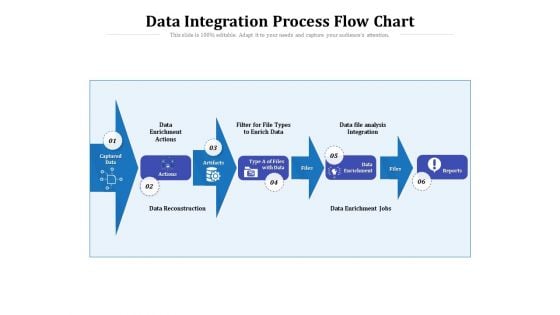
Data Integration Process Flow Chart Ppt PowerPoint Presentation File Templates PDF
Presenting this set of slides with name data integration process flow chart ppt powerpoint presentation file templates pdf. This is a six stage process. The stages in this process are actions, integration, analysis. This is a completely editable PowerPoint presentation and is available for immediate download. Download now and impress your audience.

 Home
Home