Dashboard Icon
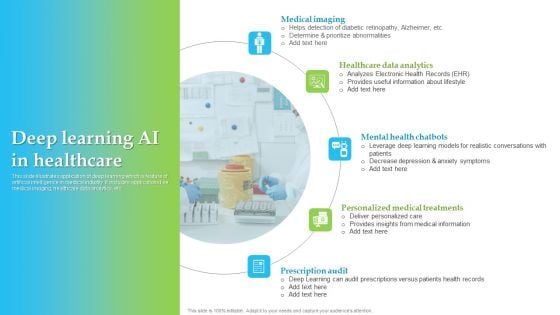
Deep Learning AI In Healthcare Themes PDF
This slide illustrates application of deep learning which is feature of artificial intelligence in medical industry. It includes applications like medical imaging, healthcare data analytics, etc. Pitch your topic with ease and precision using this Deep Learning AI In Healthcare Themes PDF. This layout presents information on Medical Imaging, Healthcare Data Analytics, Mental Health Chatbots. It is also available for immediate download and adjustment. So, changes can be made in the color, design, graphics or any other component to create a unique layout.
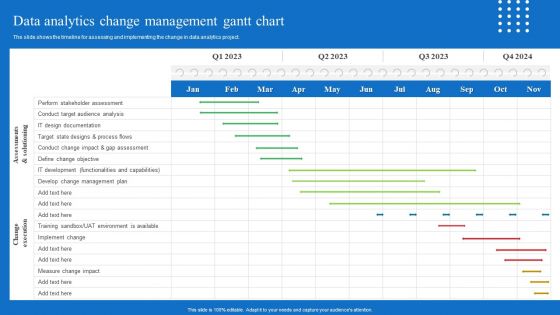
Toolkit For Data Science And Analytics Transition Data Analytics Change Management Gantt Chart Portrait PDF
The slide shows the timeline for assessing and implementing the change in data analytics project. Get a simple yet stunning designed Toolkit For Data Science And Analytics Transition Data Analytics Change Management Gantt Chart Portrait PDF It is the best one to establish the tone in your meetings. It is an excellent way to make your presentations highly effective. So, download this PPT today from Slidegeeks and see the positive impacts. Our easy to edit Toolkit For Data Science And Analytics Transition Data Analytics Change Management Gantt Chart Portrait PDF can be your go to option for all upcoming conferences and meetings. So, what are you waiting for Grab this template today.
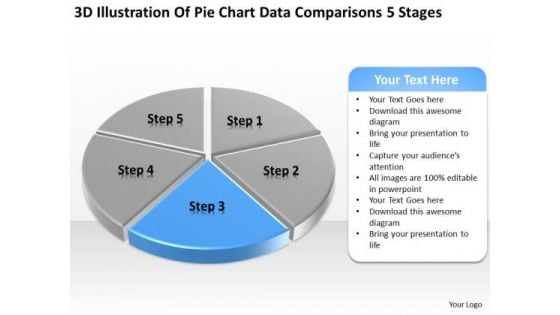
Pie Chart Data Comparisons 5 Stages Business Plan Templates PowerPoint Slides
We present our pie chart data comparisons 5 stages business plan templates PowerPoint Slides.Present our Marketing PowerPoint Templates because Our PowerPoint Templates and Slides are Clear and concise. Use them and dispel any doubts your team may have. Present our Finance PowerPoint Templates because You can Create a matrix with our PowerPoint Templates and Slides. Feel the strength of your ideas click into place. Download our Business PowerPoint Templates because You can Inspire your team with our PowerPoint Templates and Slides. Let the force of your ideas flow into their minds. Present our Sales PowerPoint Templates because Our PowerPoint Templates and Slides are aesthetically designed to attract attention. We gaurantee that they will grab all the eyeballs you need. Present our Success PowerPoint Templates because Our PowerPoint Templates and Slides are specially created by a professional team with vast experience. They diligently strive to come up with the right vehicle for your brilliant Ideas. Use these PowerPoint slides for presentations relating to Analysis, Analyzing, Brands, Business, Chart, Colorful, Commerce, Compare, Comparison, Data, Economical, Finance, Financial, Grow, Growth, Market, Market Share, Marketing, Measure, Pen, Pie, Pie Chart, Presentation, Profit, Revenue, Sales, Sales Chat, Sales Increase, Share, Statistical, Success, Successful. The prominent colors used in the PowerPoint template are Blue, Gray, White. Start a company with our Pie Chart Data Comparisons 5 Stages Business Plan Templates PowerPoint Slides. Just download, type and present.
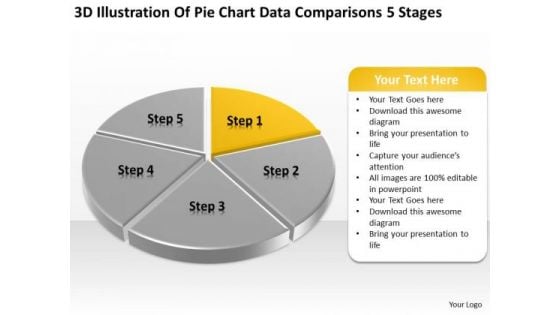
Pie Chart Data Comparisons 5 Stages Examples Small Business Plans PowerPoint Slides
We present our pie chart data comparisons 5 stages examples small business plans PowerPoint Slides.Download our Marketing PowerPoint Templates because you can Set pulses racing with our PowerPoint Templates and Slides. They will raise the expectations of your team. Present our Finance PowerPoint Templates because Our PowerPoint Templates and Slides are the chords of your song. String them along and provide the lilt to your views. Download and present our Business PowerPoint Templates because It will Raise the bar of your Thoughts. They are programmed to take you to the next level. Download our Sales PowerPoint Templates because Our PowerPoint Templates and Slides will fulfill your every need. Use them and effectively satisfy the desires of your audience. Present our Success PowerPoint Templates because You can Be the puppeteer with our PowerPoint Templates and Slides as your strings. Lead your team through the steps of your script.Use these PowerPoint slides for presentations relating to Analysis, Analyzing, Brands, Business, Chart, Colorful, Commerce, Compare, Comparison, Data, Economical, Finance, Financial, Grow, Growth, Market, Market Share, Marketing, Measure, Pen, Pie, Pie Chart, Presentation, Profit, Revenue, Sales, Sales Chat, Sales Increase, Share, Statistical, Success, Successful. The prominent colors used in the PowerPoint template are Yellow, Gray, White. Ambiguity can be exasperating. Give definite answers with our Pie Chart Data Comparisons 5 Stages Examples Small Business Plans PowerPoint Slides.
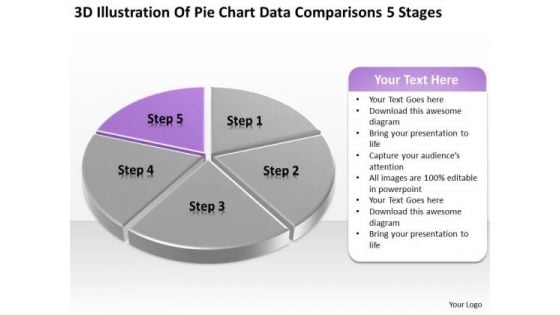
Pie Chart Data Comparisons 5 Stages Ppt Designing Business Plan PowerPoint Templates
We present our pie chart data comparisons 5 stages ppt designing business plan PowerPoint templates.Use our Marketing PowerPoint Templates because Our PowerPoint Templates and Slides are innately eco-friendly. Their high recall value negate the need for paper handouts. Download our Finance PowerPoint Templates because Our PowerPoint Templates and Slides are truly out of this world. Even the MIB duo has been keeping tabs on our team. Use our Business PowerPoint Templates because You should Bet on your luck with our PowerPoint Templates and Slides. Be assured that you will hit the jackpot. Present our Sales PowerPoint Templates because Our PowerPoint Templates and Slides are created with admirable insight. Use them and give your group a sense of your logical mind. Present our Success PowerPoint Templates because Our PowerPoint Templates and Slides are focused like a searchlight beam. They highlight your ideas for your target audience.Use these PowerPoint slides for presentations relating to Analysis, Analyzing, Brands, Business, Chart, Colorful, Commerce, Compare, Comparison, Data, Economical, Finance, Financial, Grow, Growth, Market, Market Share, Marketing, Measure, Pen, Pie, Pie Chart, Presentation, Profit, Revenue, Sales, Sales Chat, Sales Increase, Share, Statistical, Success, Successful. The prominent colors used in the PowerPoint template are Purple, Gray, White. Make instructive presentations with our Pie Chart Data Comparisons 5 Stages Ppt Designing Business Plan PowerPoint Templates. Dont waste time struggling with PowerPoint. Let us do it for you.

Market Trends Selling Template Powerpoint Themes
This is a market trends selling template powerpoint themes. This is a five stage process. The stages in this process are customer acquisition, customer win back, customer development, fix it improve it make changes, sell the improved product.
Data Reference Diagram Ppt PowerPoint Presentation Complete Deck With Slides
Boost your confidence and team morale with this well structured Data Reference Diagram Ppt PowerPoint Presentation Complete Deck With Slides. This prefabricated set gives a voice to your presentation because of its well researched content and graphics. Our experts have added all the components very carefully, thus helping you deliver great presentations with a single click. Not only that, it contains a set of Twelve slides that are designed using the right visuals, graphics, etc. Various topics can be discussed, and effective brainstorming sessions can be conducted using the wide variety of slides added in this complete deck. Apart from this, our PPT design contains clear instructions to help you restructure your presentations and create multiple variations. The color, format, design anything can be modified as deemed fit by the user. Not only this, it is available for immediate download. So, grab it now.

Global Cubesat Market Analysis Report IoT In Orbit Unleashing The Power IoT SS V
This slide showcases information about the global market size of miniature satellites also known as CubeSat. It showcases global market size, types of CubeSat market share by size, and the largest growing geographic area. From laying roadmaps to briefing everything in detail, our templates are perfect for you. You can set the stage with your presentation slides. All you have to do is download these easy-to-edit and customizable templates. Global Cubesat Market Analysis Report IoT In Orbit Unleashing The Power IoT SS V will help you deliver an outstanding performance that everyone would remember and praise you for. Do download this presentation today. This slide showcases information about the global market size of miniature satellites also known as CubeSat. It showcases global market size, types of CubeSat market share by size, and the largest growing geographic area.
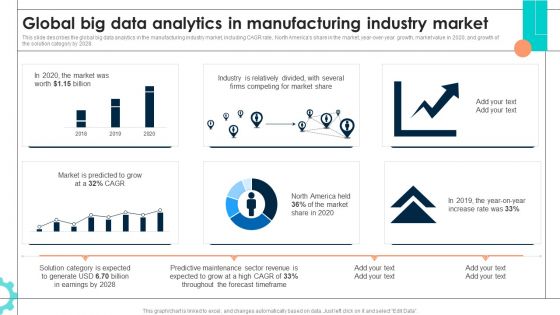
Intelligent Manufacturing Global Big Data Analytics In Manufacturing Industry Market Structure PDF
This slide describes the global big data analytics in the manufacturing industry market, including CAGR rate, North Americas share in the market, year-over-year growth, market value in 2020, and growth of the solution category by 2028. Formulating a presentation can take up a lot of effort and time, so the content and message should always be the primary focus. The visuals of the PowerPoint can enhance the presenters message, so our Intelligent Manufacturing Global Big Data Analytics In Manufacturing Industry Market Structure PDF was created to help save time. Instead of worrying about the design, the presenter can concentrate on the message while our designers work on creating the ideal templates for whatever situation is needed. Slidegeeks has experts for everything from amazing designs to valuable content, we have put everything into Intelligent Manufacturing Global Big Data Analytics In Manufacturing Industry Market Structure PDF
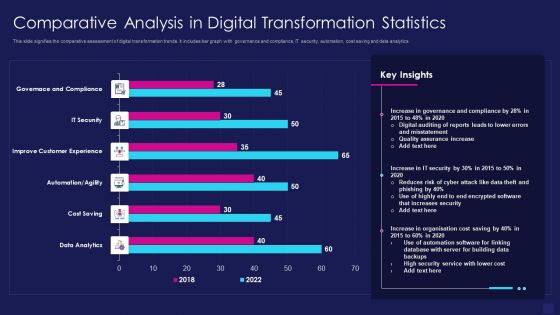
Comparative Analysis In Digital Transformation Statistics Graphics PDF
This slide signifies the comparative assessment of digital transformation trends. It includes bar graph with governance and compliance, IT security, automation, cost saving and data analytics. Showcasing this set of slides titled comparative analysis in digital transformation statistics graphics pdf. The topics addressed in these templates are data analytics, cost saving, improve customer experience. All the content presented in this PPT design is completely editable. Download it and make adjustments in color, background, font etc. as per your unique business setting.
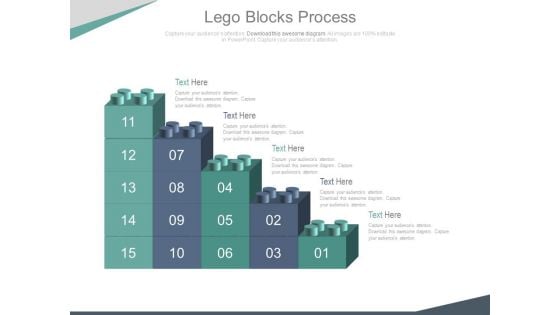
Bar Graph Of Lego Blocks For Data Analysis Powerpoint Slides
This PowerPoint template contains bar graph made of Lego blocks. You may use this slide to display growth process. This diagram provides an effective way of displaying information you can edit text, color, shade and style as per you need.
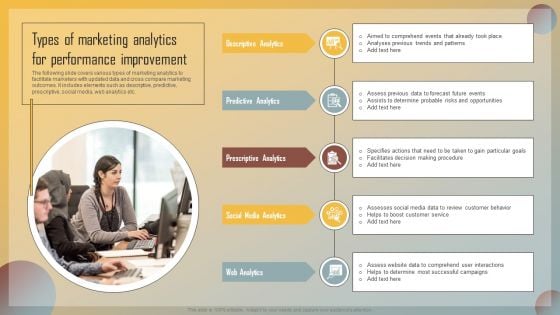
Guide For Marketing Analytics To Improve Decisions Types Of Marketing Analytics For Performance Improvement Demonstration PDF
The following slide covers various types of marketing analytics to facilitate marketers with updated data and cross compare marketing outcomes. It includes elements such as descriptive, predictive, prescriptive, social media, web analytics etc. Retrieve professionally designed Guide For Marketing Analytics To Improve Decisions Types Of Marketing Analytics For Performance Improvement Demonstration PDF to effectively convey your message and captivate your listeners. Save time by selecting pre made slideshows that are appropriate for various topics, from business to educational purposes. These themes come in many different styles, from creative to corporate, and all of them are easily adjustable and can be edited quickly. Access them as PowerPoint templates or as Google Slides themes. You do not have to go on a hunt for the perfect presentation because Slidegeeks got you covered from everywhere.
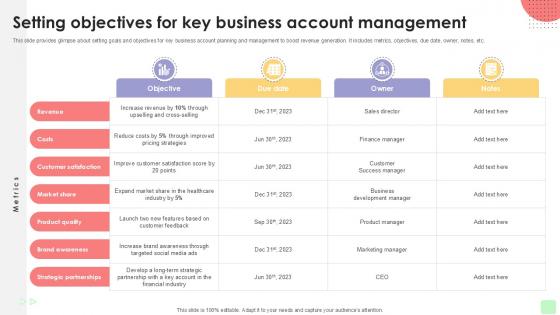
Setting Objectives For Key Business Detailed Business Account PPT Presentation Strategy SS V
This slide provides glimpse about setting goals and objectives for key business account planning and management to boost revenue generation. It includes metrics, objectives, due date, owner, notes, etc. Dont compromise on a template that erodes your messages impact. Introducing our engaging Setting Objectives For Key Business Detailed Business Account PPT Presentation Strategy SS V complete deck, thoughtfully crafted to grab your audiences attention instantly. With this deck, effortlessly download and adjust elements, streamlining the customization process. Whether youre using Microsoft versions or Google Slides, it fits seamlessly into your workflow. Furthermore, its accessible in JPG, JPEG, PNG, and PDF formats, facilitating easy sharing and editing. Not only that you also play with the color theme of your slides making it suitable as per your audiences preference. This slide provides glimpse about setting goals and objectives for key business account planning and management to boost revenue generation. It includes metrics, objectives, due date, owner, notes, etc.

Cost Breakdown For Conducting Marketing Research Formats PDF
This slide covers cost breakdown for conducting market research more efficiently. It involves key elements such as reporting, project initiation, research design, field work and data analysis. If your project calls for a presentation, then Slidegeeks is your go-to partner because we have professionally designed, easy-to-edit templates that are perfect for any presentation. After downloading, you can easily edit Cost Breakdown For Conducting Marketing Research Formats PDF and make the changes accordingly. You can rearrange slides or fill them with different images. Check out all the handy templates
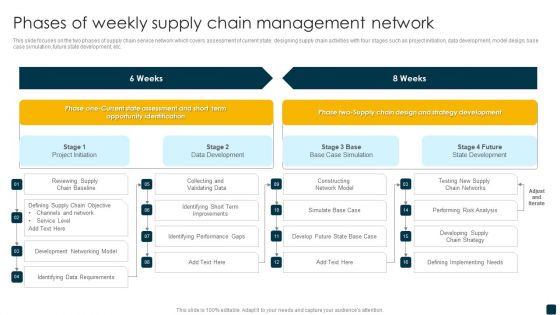
Phases Of Weekly Supply Chain Management Network Template PDF
This slide focuses on the two phases of supply chain service network which covers assessment of current state, designing supply chain activities with four stages such as project initiation, data development, model design, base case simulation, future state development, etc. Pitch your topic with ease and precision using this Phases Of Weekly Supply Chain Management Network Template PDF. This layout presents information on Supply Chain, Development Networking Model, Collecting And Validating Data. It is also available for immediate download and adjustment. So, changes can be made in the color, design, graphics or any other component to create a unique layout.
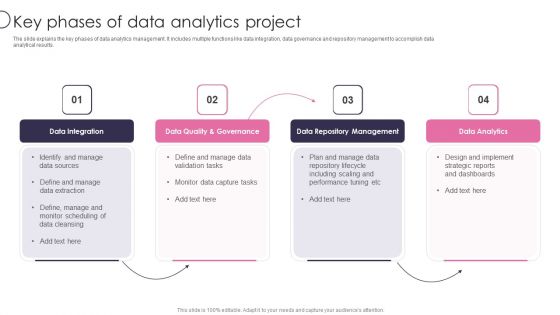
Information Transformation Process Toolkit Key Phases Of Data Analytics Project Summary PDF
The slide explains the key phases of data analytics management. It includes multiple functions like data integration, data governance and repository management to accomplish data analytical results. This is a Information Transformation Process Toolkit Key Phases Of Data Analytics Project Summary PDF template with various stages. Focus and dispense information on four stages using this creative set, that comes with editable features. It contains large content boxes to add your information on topics like Data Integration, Data Repository Management, Data Analytics. You can also showcase facts, figures, and other relevant content using this PPT layout. Grab it now.
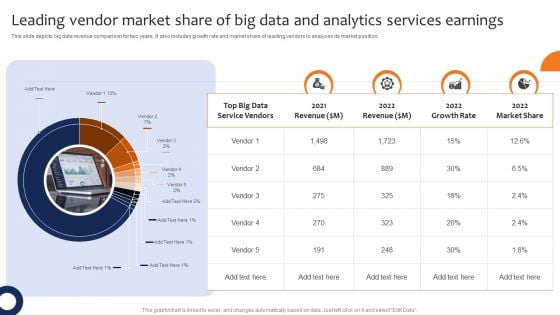
Leading Vendor Market Share Of Big Data And Analytics Services Earnings Professional PDF
This slide depicts big data revenue comparison for two years. It also includes growth rate and market share of leading vendors to analyses its market position. Pitch your topic with ease and precision using this Leading Vendor Market Share Of Big Data And Analytics Services Earnings Professional PDF. This layout presents information on Revenue, Growth Rate, Market Share. It is also available for immediate download and adjustment. So, changes can be made in the color, design, graphics or any other component to create a unique layout.

Telecom Cost Management Reporting Categories Mockup PDF
This slide shows telecom expense reporting that helps to compile and organize data. It includes three types of reporting portal, application programming interface API , key performance indictor reporting. Presenting Telecom Cost Management Reporting Categories Mockup PDF to dispense important information. This template comprises three stages. It also presents valuable insights into the topics including API Reporting, KPI Reporting, Portal Reporting. This is a completely customizable PowerPoint theme that can be put to use immediately. So, download it and address the topic impactfully.
Developing Dual Branding Campaign For Brand Marketing SWOT Analysis Themes PDF
This slide showcases process that can help organization to launch dual branding campaign. Its key steps are goal definition, screening partners and negotiating the contract. The Developing Dual Branding Campaign For Brand Marketing SWOT Analysis Themes PDF is a compilation of the most recent design trends as a series of slides. It is suitable for any subject or industry presentation, containing attractive visuals and photo spots for businesses to clearly express their messages. This template contains a variety of slides for the user to input data, such as structures to contrast two elements, bullet points, and slides for written information. Slidegeeks is prepared to create an impression.
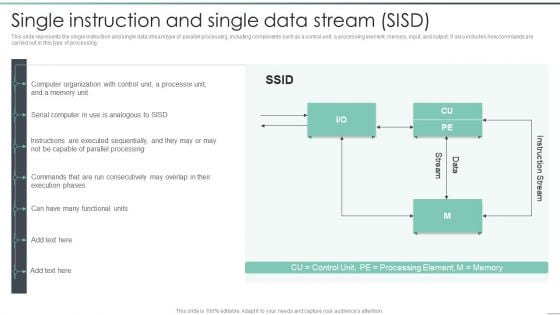
Parallel Computing Processing Single Instruction And Single Data Stream SISD Diagrams PDF
This slide represents the single instruction and single data stream type of parallel processing, including components such as a control unit, a processing element, memory, input, and output. It also includes how commands are carried out in this type of processing. Deliver and pitch your topic in the best possible manner with this Parallel Computing Processing Single Instruction And Single Data Stream SISD Diagrams PDF. Use them to share invaluable insights on Parallel Processing, Execution Phases, Processor Unit and impress your audience. This template can be altered and modified as per your expectations. So, grab it now.
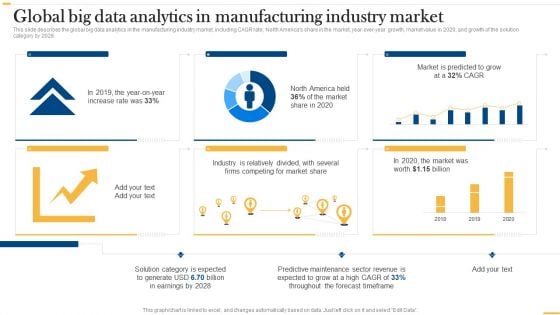
Deploying AI To Enhance Global Big Data Analytics In Manufacturing Industry Market Professional PDF
This slide describes the global big data analytics in the manufacturing industry market, including CAGR rate, North Americas share in the market, year-over-year growth, market value in 2020, and growth of the solution category by 2028. Coming up with a presentation necessitates that the majority of the effort goes into the content and the message you intend to convey. The visuals of a PowerPoint presentation can only be effective if it supplements and supports the story that is being told. Keeping this in mind our experts created Deploying AI To Enhance Global Big Data Analytics In Manufacturing Industry Market Professional PDF to reduce the time that goes into designing the presentation. This way, you can concentrate on the message while our designers take care of providing you with the right template for the situation.
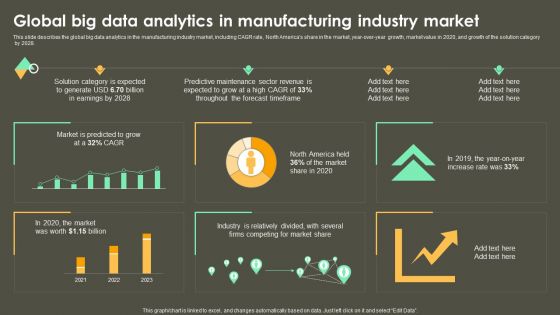
Iot Integration In Manufacturing Global Big Data Analytics In Manufacturing Industry Market Infographics PDF
This slide describes the global big data analytics in the manufacturing industry market, including CAGR rate, North Americas share in the market, year-over-year growth, market value in 2020, and growth of the solution category by 2028. Coming up with a presentation necessitates that the majority of the effort goes into the content and the message you intend to convey. The visuals of a PowerPoint presentation can only be effective if it supplements and supports the story that is being told. Keeping this in mind our experts created Iot Integration In Manufacturing Global Big Data Analytics In Manufacturing Industry Market Infographics PDF to reduce the time that goes into designing the presentation. This way, you can concentrate on the message while our designers take care of providing you with the right template for the situation.

Pie Chart With Increasing Percentage Values Powerpoint Slides
This PowerPoint template has been designed with diagram of pie chart with increasing percentage values. This PPT slide can be used to prepare presentations for profit growth report and also for financial data analysis. You can download finance PowerPoint template to prepare awesome presentations.
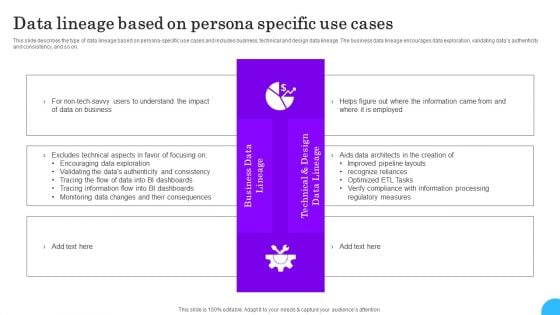
Comprehensive Analysis Of Different Data Lineage Classification Data Lineage Based On Persona Specific Sample PDF
This slide describes the type of data lineage based on persona specific use cases and includes business, technical and design data lineage. The business data lineage encourages data exploration, validating datas authenticity and consistency, and so on. Whether you have daily or monthly meetings, a brilliant presentation is necessary. Comprehensive Analysis Of Different Data Lineage Classification Data Lineage Based On Persona Specific Sample PDF can be your best option for delivering a presentation. Represent everything in detail using Comprehensive Analysis Of Different Data Lineage Classification Data Lineage Based On Persona Specific Sample PDF and make yourself stand out in meetings. The template is versatile and follows a structure that will cater to your requirements. All the templates prepared by Slidegeeks are easy to download and edit. Our research experts have taken care of the corporate themes as well. So, give it a try and see the results.
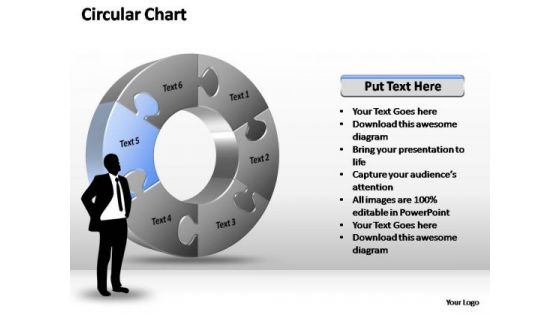
PowerPoint Templates Process Circular Chart Ppt Themes
PowerPoint Templates Process Circular Chart PPT Themes-Represent any circular process, business concept or idea easily with this 3D Business circular Chart.\n-PowerPoint Templates Process Circular Chart PPT Themes Figure out the market with our PowerPoint Templates Process Circular Chart Ppt Themes. Analyse the data accurately for the audience.
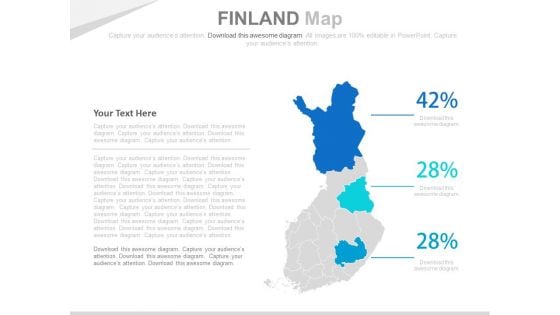
Finland Map With Economic Data Analysis Powerpoint Slides
This PowerPoint template has been designed with Finland Map and areas highlighted. You may use this slide to display financial strategy analysis. This diagram provides an effective way of displaying information you can edit text, color, shade and style as per you need.
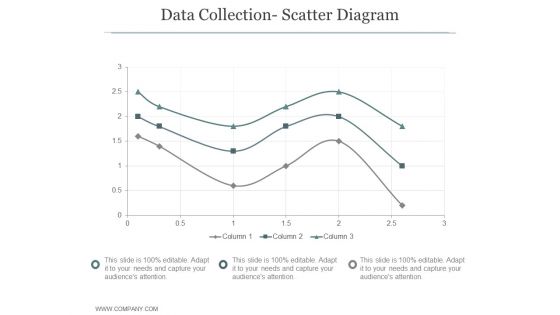
Data Collection Scatter Diagram Ppt PowerPoint Presentation Shapes
This is a data collection scatter diagram ppt powerpoint presentation shapes. This is a three stage process. The stages in this process are business, strategy, growth strategy, marketing, histogram, finance.
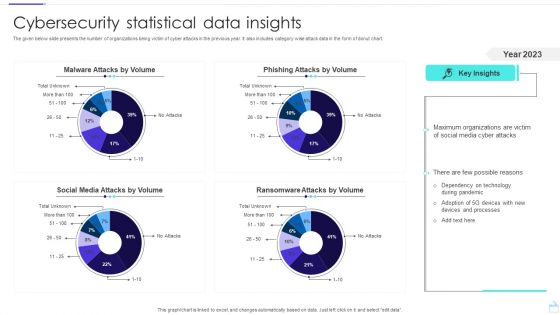
Cybersecurity Statistical Data Insights Sample PDF
The given below slide presents the number of organizations being victim of cyber attacks in the previous year. It also includes category wise attack data in the form of donut chart. Pitch your topic with ease and precision using this Cybersecurity Statistical Data Insights Sample PDF. This layout presents information on Social Media Attacks, Malware Attacks, Phishing Attacks. It is also available for immediate download and adjustment. So, changes can be made in the color, design, graphics or any other component to create a unique layout.
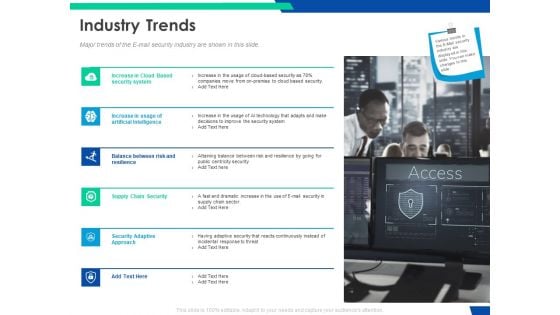
Cloud Based Email Security Market Report Industry Trends Ppt Styles Diagrams PDF
Major trends of the E mail security industry are shown in this slide. This is a cloud based email security market report industry trends ppt styles diagrams pdf template with various stages. Focus and dispense information on six stages using this creative set, that comes with editable features. It contains large content boxes to add your information on topics like security system, artificial intelligence, supply chain security, security adaptive approach. You can also showcase facts, figures, and other relevant content using this PPT layout. Grab it now.
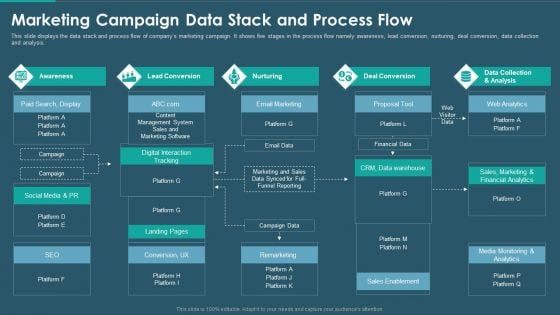
Sales And Promotion Playbook Marketing Campaign Data Stack And Process Flow Diagrams PDF
This slide displays the data stack and process flow of companys marketing campaign. It shows five stages in the process flow namely awareness, lead conversion, nurturing, deal conversion, data collection and analysis. Deliver and pitch your topic in the best possible manner with this sales and promotion playbook marketing campaign data stack and process flow diagrams pdf. Use them to share invaluable insights on deal conversion, data collection, lead conversion, awareness and impress your audience. This template can be altered and modified as per your expectations. So, grab it now.
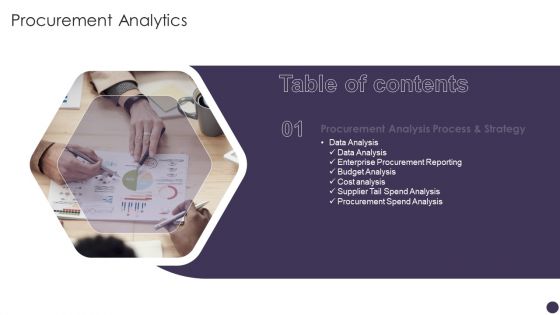
Table Of Contents Procurement Analytics Slide Diagrams PDF
Presenting Table Of Contents Procurement Analytics Slide Diagrams PDF to provide visual cues and insights. Share and navigate important information on one stage that need your due attention. This template can be used to pitch topics like Data Analysis, Enterprise Procurement, Budget Analysis. In addtion, this PPT design contains high resolution images, graphics, etc, that are easily editable and available for immediate download.
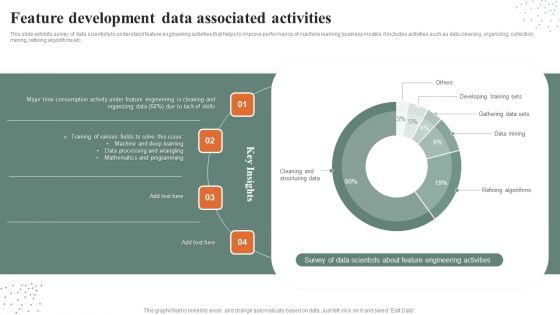
Feature Development Data Associated Activities Guidelines PDF
This slide exhibits survey of data scientists to understand feature engineering activities that helps to improve performance of machine learning business models. It includes activities such as data cleaning, organizing, collection, mining, refining algorithms etc. Pitch your topic with ease and precision using this Feature Development Data Associated Activities Guidelines PDF. This layout presents information on Programming, Developing Training Sets, Gathering Data Sets. It is also available for immediate download and adjustment. So, changes can be made in the color, design, graphics or any other component to create a unique layout.
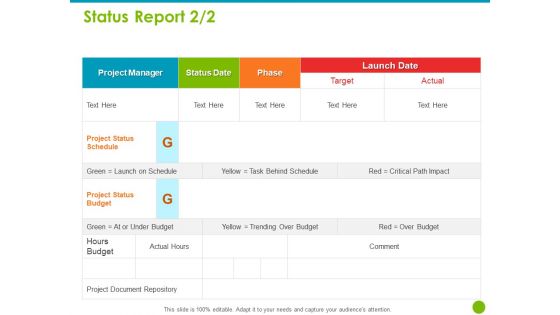
Project Capabilities Status Report Phase Ppt Ideas Inspiration PDF
Presenting this set of slides with name project capabilities status report phase ppt ideas inspiration pdf. The topics discussed in these slides are project manager, status date, phase, launch date. This is a completely editable PowerPoint presentation and is available for immediate download. Download now and impress your audience.
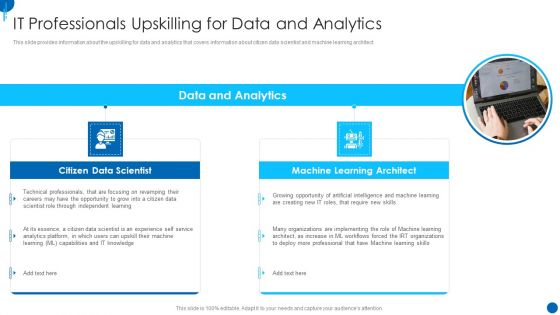
Information Technology Strategy IT Professionals Upskilling For Data And Analytics Diagrams PDF
This slide provides information about the upskilling for data and analytics that covers information about citizen data scientist and machine learning architect. This is a information technology strategy it professionals upskilling for data and analytics diagrams pdf template with various stages. Focus and dispense information on two stages using this creative set, that comes with editable features. It contains large content boxes to add your information on topics like data and analytics, citizen data scientist, machine learning architect. You can also showcase facts, figures, and other relevant content using this PPT layout. Grab it now.
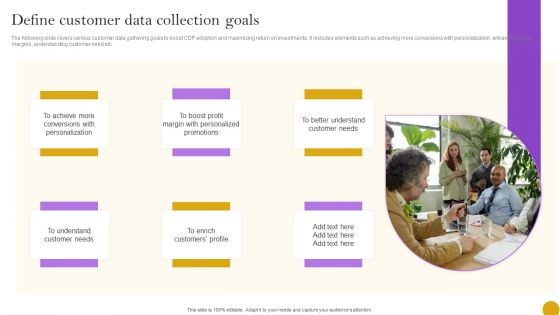
Comprehensive Customer Data Platform Guide Optimizing Promotional Initiatives Define Customer Data Collection Goals Diagrams PDF
The following slide covers various customer data gathering goals to boost CDP adoption and maximizing return on investments. It includes elements such as achieving more conversions with personalization, enhancing profit margins, understanding customer need etc. Retrieve professionally designed Comprehensive Customer Data Platform Guide Optimizing Promotional Initiatives Define Customer Data Collection Goals Diagrams PDF to effectively convey your message and captivate your listeners. Save time by selecting pre made slideshows that are appropriate for various topics, from business to educational purposes. These themes come in many different styles, from creative to corporate, and all of them are easily adjustable and can be edited quickly. Access them as PowerPoint templates or as Google Slides themes. You do not have to go on a hunt for the perfect presentation because Slidegeeks got you covered from everywhere.
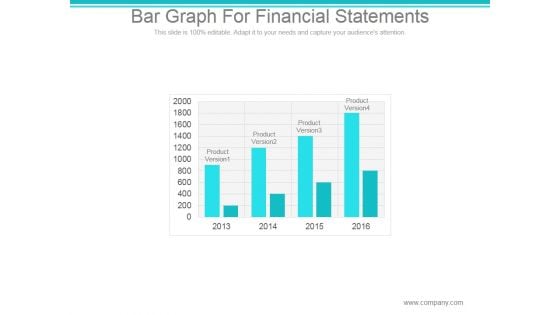
Bar Graph For Financial Statements Ppt PowerPoint Presentation Example
This is a bar graph for financial statements ppt powerpoint presentation example. This is a four stage process. The stages in this process are product version, finance, year.
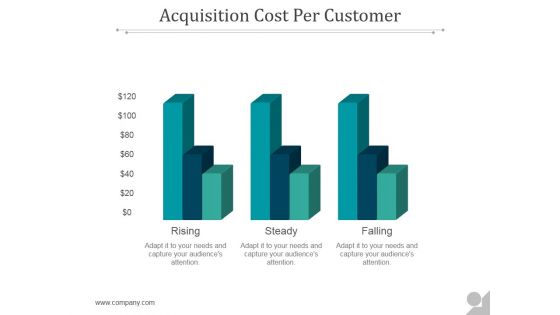
Acquisition Cost Per Customer Ppt PowerPoint Presentation Example 2015
This is a acquisition cost per customer ppt powerpoint presentation example 2015. This is a three stage process. The stages in this process are rising, steady, falling.
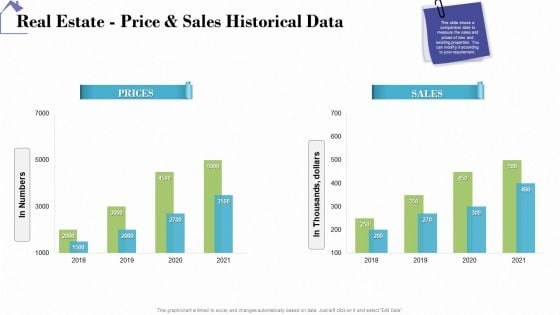
Industry Analysis Of Real Estate And Construction Sector Real Estate Price And Sales Historical Data Diagrams PDF
Deliver and pitch your topic in the best possible manner with this industry analysis of real estate and construction sector real estate price and sales historical data diagrams pdf. Use them to share invaluable insights on prices, sales and impress your audience. This template can be altered and modified as per your expectations. So, grab it now.
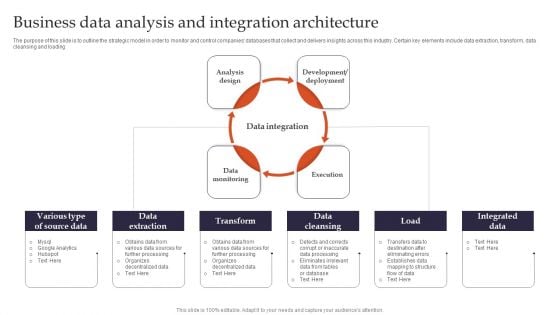
Business Data Analysis And Integration Architecture Brochure PDF
The purpose of this slide is to outline the strategic model in order to monitor and control companies databases that collect and delivers insights across this industry. Certain key elements include data extraction, transform, data cleansing and loading. Presenting Business Data Analysis And Integration Architecture Brochure PDF to dispense important information. This template comprises four stages. It also presents valuable insights into the topics including Analysis Design, Development Or Deployment, Data Monitoring. This is a completely customizable PowerPoint theme that can be put to use immediately. So, download it and address the topic impactfully.
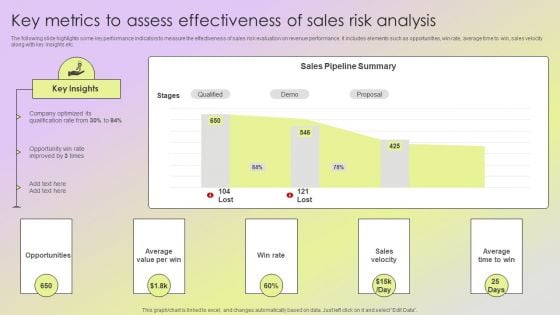
Mitigating Sales Risks With Strategic Action Planning Key Metrics To Assess Effectiveness Of Sales Risk Analysis Rules PDF
The following slide highlights some key performance indicators to measure the effectiveness of sales risk evaluation on revenue performance. It includes elements such as opportunities, win rate, average time to win, sales velocity along with key insights etc. Create an editable Mitigating Sales Risks With Strategic Action Planning Key Metrics To Assess Effectiveness Of Sales Risk Analysis Rules PDF that communicates your idea and engages your audience. Whether youre presenting a business or an educational presentation, pre designed presentation templates help save time. Mitigating Sales Risks With Strategic Action Planning Key Metrics To Assess Effectiveness Of Sales Risk Analysis Rules PDF is highly customizable and very easy to edit, covering many different styles from creative to business presentations. Slidegeeks has creative team members who have crafted amazing templates. So, go and get them without any delay.

Concept Of Mystery Using 5 Puzzles Quote Process Flow Chart PowerPoint Slides
We present our concept of mystery using 5 puzzles quote process flow chart PowerPoint Slides.Use our Puzzles or Jigsaws PowerPoint Templates because,This one depicts the popular chart. Use our Business PowerPoint Templates because, You have had a great year or so business wise. It is time to celebrate the efforts of your team Use our Shapes PowerPoint Templates because,You know the path so show the way. Use our Process and Flows PowerPoint Templates because, This will helps you to explore the minutest detail of each concept and follow the trail to its conclusion. Use our Abstract PowerPoint Templates because,Different personalities, different abilities but formidable together.Use these PowerPoint slides for presentations relating to Abstract, Action, Attach, Box, Business, Center, Chain, Chart, Color, Communication, Concept, Connection, Cube, Cycle, Data, Diagram, Flow, Globe, Horizontal, Idea, Illustration, Information, Interaction, Jigsaw, Join, Link, Pieces, Process, Puzzle, Relation, Relationship, Shape, Success. The prominent colors used in the PowerPoint template are Yellow, Gray, Black Walk your team through your plans using our Concept Of Mystery Using 5 Puzzles Quote Process Flow Chart PowerPoint Slides. See them getting energized.
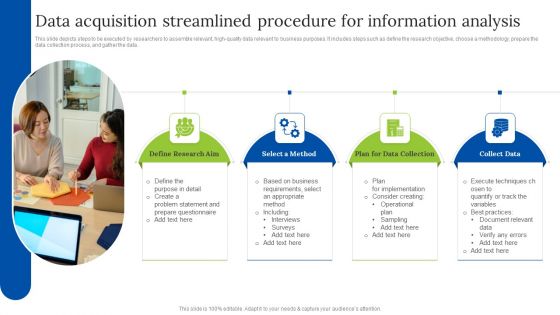
Data Acquisition Streamlined Procedure For Information Analysis Clipart PDF
This slide depicts steps to be executed by researchers to assemble relevant, high-quality data relevant to business purposes. It includes steps such as define the research objective, choose a methodology, prepare the data collection process, and gather the data.Presenting Data Acquisition Streamlined Procedure For Information Analysis Clipart PDF to dispense important information. This template comprises four stages. It also presents valuable insights into the topics including Define Research, Data Collection, Execute Techniques . This is a completely customizable PowerPoint theme that can be put to use immediately. So, download it and address the topic impactfully.
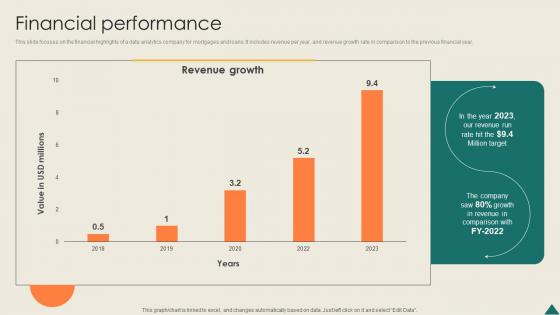
Financial Performance Financial Analytics Platform Investor Elevator Pitch Deck
This slide focuses on the financial highlights of a data analytics company for mortgages and loans. It includes revenue per year, and revenue growth rate in comparison to the previous financial year. Find a pre-designed and impeccable Financial Performance Financial Analytics Platform Investor Elevator Pitch Deck. The templates can ace your presentation without additional effort. You can download these easy-to-edit presentation templates to make your presentation stand out from others. So, what are you waiting for Download the template from Slidegeeks today and give a unique touch to your presentation. This slide focuses on the financial highlights of a data analytics company for mortgages and loans. It includes revenue per year, and revenue growth rate in comparison to the previous financial year.
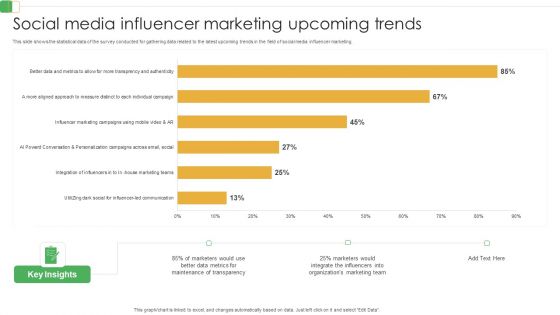
Social Media Influencer Marketing Upcoming Trends Ppt PowerPoint Presentation Diagram Templates PDF
This slide shows the statistical data of the survey conducted for gathering data related to the latest upcoming trends in the field of social media influencer marketing.Showcasing this set of slides titled Social Media Influencer Marketing Upcoming Trends Ppt PowerPoint Presentation Diagram Templates PDF. The topics addressed in these templates are Maintenance Transparency, Better Data Metrics, Integrate Influencers. All the content presented in this PPT design is completely editable. Download it and make adjustments in color, background, font etc. as per your unique business setting.
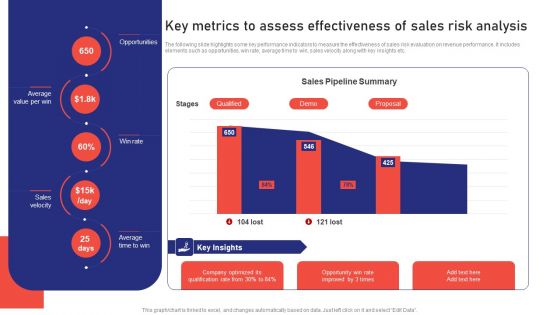
Sales Risk Assessment For Profit Maximization Key Metrics To Assess Effectiveness Of Sales Risk Analysis Ideas PDF
The following slide highlights some key performance indicators to measure the effectiveness of sales risk evaluation on revenue performance. It includes elements such as opportunities, win rate, average time to win, sales velocity along with key insights etc. Get a simple yet stunning designed Sales Risk Assessment For Profit Maximization Key Metrics To Assess Effectiveness Of Sales Risk Analysis Ideas PDF. It is the best one to establish the tone in your meetings. It is an excellent way to make your presentations highly effective. So, download this PPT today from Slidegeeks and see the positive impacts. Our easy to edit Sales Risk Assessment For Profit Maximization Key Metrics To Assess Effectiveness Of Sales Risk Analysis Ideas PDF can be your go to option for all upcoming conferences and meetings. So, what are you waiting for Grab this template today.
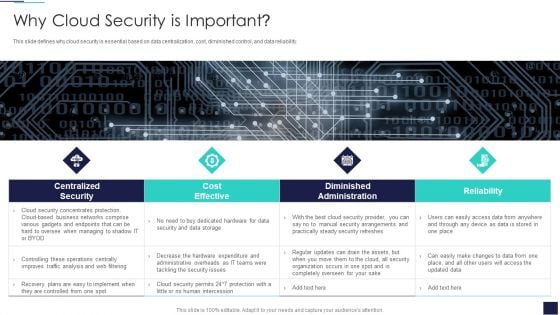
Cloud Information Security Why Cloud Security Is Important Ppt Diagrams PDF
This slide defines why cloud security is essential based on data centralization, cost, diminished control, and data reliability. This is a Cloud Information Security Why Cloud Security Is Important Ppt Diagrams PDF template with various stages. Focus and dispense information on four stages using this creative set, that comes with editable features. It contains large content boxes to add your information on topics like Cost Effective, Diminished Administration, Centralized Security. You can also showcase facts, figures, and other relevant content using this PPT layout. Grab it now.
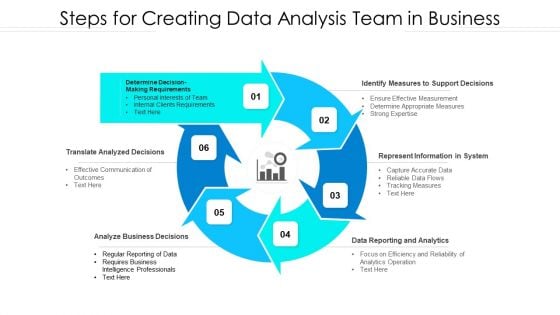
Steps For Creating Data Analysis Team In Business Information PDF
Presenting steps for creating data analysis team in business information pdf. to dispense important information. This template comprises six stages. It also presents valuable insights into the topics including translate analyzed decisions analyze, business decisions, identify measures to support decisions, represent information in system. This is a completely customizable PowerPoint theme that can be put to use immediately. So, download it and address the topic impactfully.
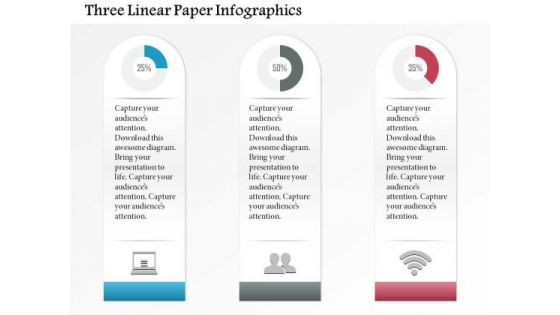
Business Diagram Three Linear Paper Infographics Presentation Template
Three linear paper info graphics has been used to design this power point template slide. This PPT slide contains the concept of data analysis and business data flow. Use this PPT slide for your business and marketing related presentations.
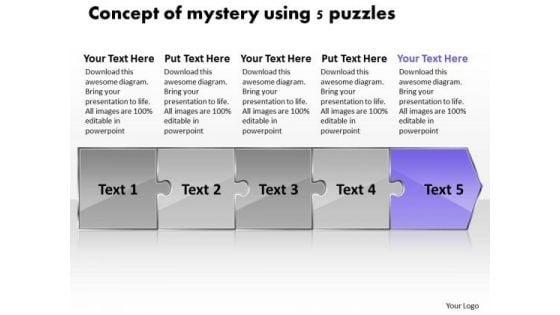
Concept Of Mystery Using 5 Puzzles Tech Support Flow Chart PowerPoint Slides
We present our concept of mystery using 5 puzzles tech support flow chart PowerPoint Slides.Use our Puzzles or Jigsaws PowerPoint Templates because,You have the process in your head, our template design showing will illuminate your thoughts. Use our Business PowerPoint Templates because, A brainwave has occurred to you after review. You know just how to push the graph skyward Use our Shapes PowerPoint Templates because, You have the entire picture in mind. Use our Process and Flows PowerPoint Templates because, The lessons have been analyzed, studied and conclusions drawn. Use our Abstract PowerPoint Templates because,Honesty is the best policy has an ardent follower in you.Use these PowerPoint slides for presentations relating to Abstract, Action, Attach, Box, Business, Center, Chain, Chart, Color, Communication, Concept, Connection, Cube, Cycle, Data, Diagram, Flow, Globe, Horizontal, Idea, Illustration, Information, Interaction, Jigsaw, Join, Link, Pieces, Process, Puzzle, Relation, Relationship, Shape, Success. The prominent colors used in the PowerPoint template are Purple, Gray, Black Let your ideas explode on the scene. Trigger the fuse with our Concept Of Mystery Using 5 Puzzles Tech Support Flow Chart PowerPoint Slides.
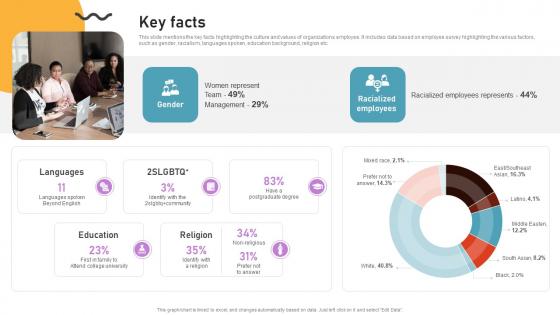
Key Facts Cloud Based Predictive Analytics Software Pitch Deck
This slide mentions the key facts highlighting the culture and values of organizations employee. It includes data based on employee survey highlighting the various factors, such as gender, racialism, languages spoken, education background, religion etc. Find highly impressive Key Facts Cloud Based Predictive Analytics Software Pitch Deck on Slidegeeks to deliver a meaningful presentation. You can save an ample amount of time using these presentation templates. No need to worry to prepare everything from scratch because Slidegeeks experts have already done a huge research and work for you. You need to download Key Facts Cloud Based Predictive Analytics Software Pitch Deck for your upcoming presentation. All the presentation templates are 100 percent editable and you can change the color and personalize the content accordingly. Download now This slide mentions the key facts highlighting the culture and values of organizations employee. It includes data based on employee survey highlighting the various factors, such as gender, racialism, languages spoken, education background, religion etc.
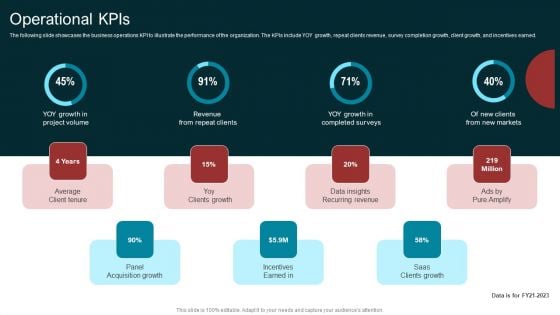
Marketing Agency Company Outline Operational Kpis Themes PDF
The following slide showcases the business operations KPI to illustrate the performance of the organization. The KPIs include YOY growth, repeat clients revenue, survey completion growth, client growth, and incentives earned. Here you can discover an assortment of the finest PowerPoint and Google Slides templates. With these templates, you can create presentations for a variety of purposes while simultaneously providing your audience with an eye catching visual experience. Download Marketing Agency Company Outline Operational Kpis Themes PDF to deliver an impeccable presentation. These templates will make your job of preparing presentations much quicker, yet still, maintain a high level of quality. Slidegeeks has experienced researchers who prepare these templates and write high quality content for you. Later on, you can personalize the content by editing the Marketing Agency Company Outline Operational Kpis Themes PDF.
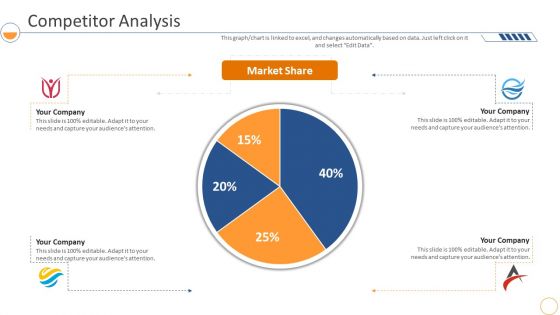
Monthly Company Performance Analysiscompetitor Analysis Market Formats PDF
This graph or chart is linked to excel, and changes automatically based on data. Just left click on it and select Edit Data. Deliver an awe inspiring pitch with this creative monthly company performance analysiscompetitor analysis market formats pdf bundle. Topics like competitor analysis, market share can be discussed with this completely editable template. It is available for immediate download depending on the needs and requirements of the user.
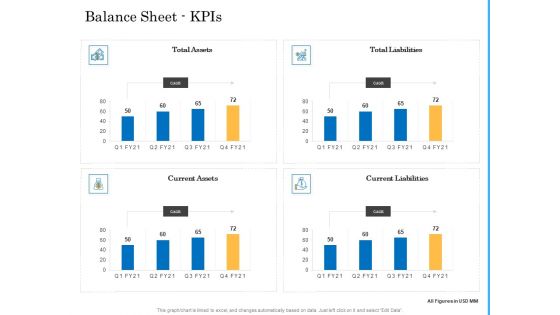
Deal Assessment Audit Process Balance Sheet Kpis Themes PDF
Deliver and pitch your topic in the best possible manner with this deal assessment audit process balance sheet kpis themes pdf. Use them to share invaluable insights on total liabilities, total assets, current assets, current liabilities and impress your audience. This template can be altered and modified as per your expectations. So, grab it now.
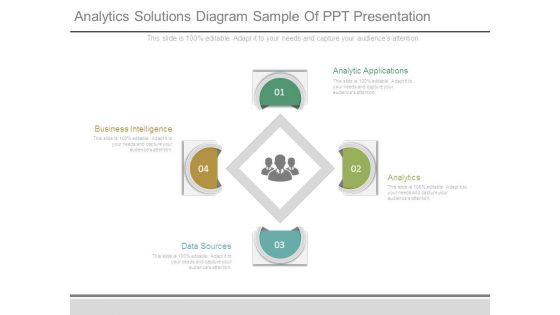
Analytics Solutions Diagram Sample Of Ppt Presentation
This is a analytics solutions diagram sample of ppt presentation. This is a four stage process. The stages in this process are analytic applications, analytics, data sources, business intelligence.
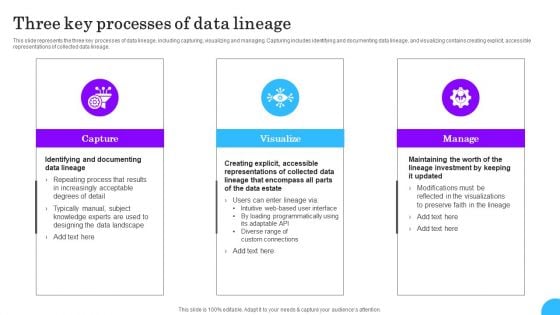
Comprehensive Analysis Of Different Data Lineage Classification Three Key Processes Of Data Lineage Brochure PDF
This slide represents the three key processes of data lineage, including capturing, visualizing and managing. Capturing includes identifying and documenting data lineage, and visualizing contains creating explicit, accessible representations of collected data lineage. If you are looking for a format to display your unique thoughts, then the professionally designed Comprehensive Analysis Of Different Data Lineage Classification Three Key Processes Of Data Lineage Brochure PDF is the one for you. You can use it as a Google Slides template or a PowerPoint template. Incorporate impressive visuals, symbols, images, and other charts. Modify or reorganize the text boxes as you desire. Experiment with shade schemes and font pairings. Alter, share or cooperate with other people on your work. Download Comprehensive Analysis Of Different Data Lineage Classification Three Key Processes Of Data Lineage Brochure PDF and find out how to give a successful presentation. Present a perfect display to your team and make your presentation unforgettable.
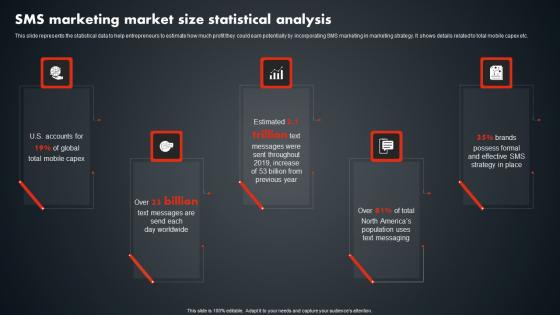
SMS Marketing Market Size Statistical Analysis SMS Promotional Tactics Themes PDF
This slide represents the statistical data to help entrepreneurs to estimate how much profit they could earn potentially by incorporating SMS marketing in marketing strategy. It shows details related to total mobile capex etc. Get a simple yet stunning designed SMS Marketing Market Size Statistical Analysis SMS Promotional Tactics Themes PDF. It is the best one to establish the tone in your meetings. It is an excellent way to make your presentations highly effective. So, download this PPT today from Slidegeeks and see the positive impacts. Our easy-to-edit SMS Marketing Market Size Statistical Analysis SMS Promotional Tactics Themes PDF can be your go-to option for all upcoming conferences and meetings. So, what are you waiting for Grab this template today. This slide represents the statistical data to help entrepreneurs to estimate how much profit they could earn potentially by incorporating SMS marketing in marketing strategy. It shows details related to total mobile capex etc.
Safely Securing Business Machine Readable Data Ppt Ideas Diagrams PDF
Presenting safely securing business machine readable data ppt ideas diagrams pdf to dispense important information. This template comprises three stages. It also presents valuable insights into the topics including safely securing business machine readable data. This is a completely customizable PowerPoint theme that can be put to use immediately. So, download it and address the topic impactfully.
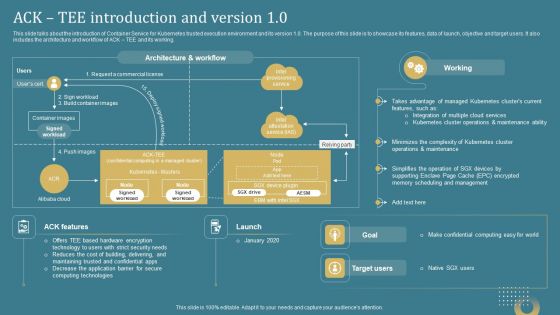
Confidential Computing System Technology Ack Tee Introduction And Version 10 Diagrams PDF
This slide talks about the introduction of Container Service for Kubernetes trusted execution environment and its version 1.0. The purpose of this slide is to showcase its features, data of launch, objective and target users. It also includes the architecture and workflow of ACK TEE and its working. Create an editable Confidential Computing System Technology Ack Tee Introduction And Version 10 Diagrams PDF that communicates your idea and engages your audience. Whether youe presenting a business or an educational presentation, pre-designed presentation templates help save time. Confidential Computing System Technology Ack Tee Introduction And Version 10 Diagrams PDF is highly customizable and very easy to edit, covering many different styles from creative to business presentations. Slidegeeks has creative team members who have crafted amazing templates. So, go and get them without any delay.
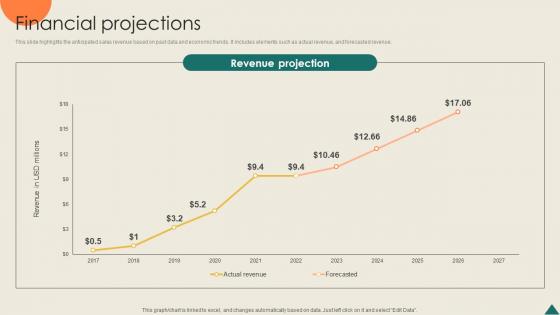
Financial Projections Financial Analytics Platform Investor Elevator Pitch Deck
This slide highlights the anticipated sales revenue based on past data and economic trends. It includes elements such as actual revenue, and forecasted revenue. Boost your pitch with our creative Financial Projections Financial Analytics Platform Investor Elevator Pitch Deck. Deliver an awe-inspiring pitch that will mesmerize everyone. Using these presentation templates you will surely catch everyones attention. You can browse the ppts collection on our website. We have researchers who are experts at creating the right content for the templates. So you do not have to invest time in any additional work. Just grab the template now and use them. This slide highlights the anticipated sales revenue based on past data and economic trends. It includes elements such as actual revenue, and forecasted revenue.
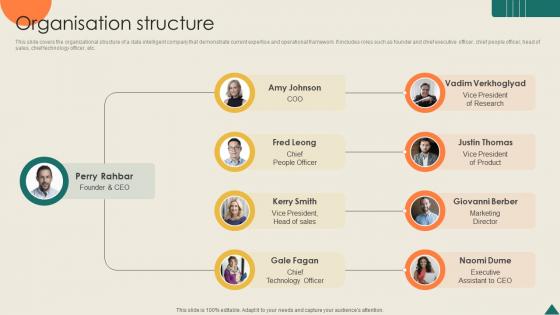
Organisation Structure Financial Analytics Platform Investor Elevator Pitch Deck
This slide covers the organizational structure of a data intelligent company that demonstrate current expertise and operational framework. It includes roles such as founder and chief executive officer, chief people officer, head of sales, chief technology officer, etc. From laying roadmaps to briefing everything in detail, our templates are perfect for you. You can set the stage with your presentation slides. All you have to do is download these easy-to-edit and customizable templates. Organisation Structure Financial Analytics Platform Investor Elevator Pitch Deck will help you deliver an outstanding performance that everyone would remember and praise you for. Do download this presentation today. This slide covers the organizational structure of a data intelligent company that demonstrate current expertise and operational framework. It includes roles such as founder and chief executive officer, chief people officer, head of sales, chief technology officer, etc.
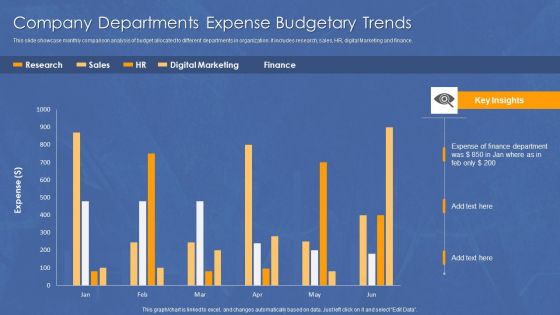
Company Departments Expense Budgetary Trends Diagrams PDF
This slide showcase monthly comparison analysis of budget allocated to different departments in organization. It includes research, sales, HR, digital Marketing and finance. Pitch your topic with ease and precision using this Company Departments Expense Budgetary Trends Diagrams PDF. This layout presents information on Expense, Finance, Department. It is also available for immediate download and adjustment. So, changes can be made in the color, design, graphics or any other component to create a unique layout.
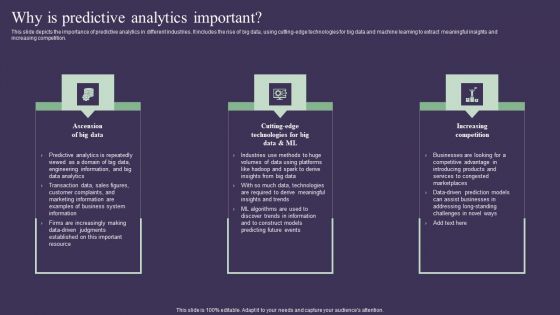
Projection Model Why Is Predictive Analytics Important Diagrams PDF
This slide depicts the importance of predictive analytics in different industries. It includes the rise of big data, using cutting-edge technologies for big data and machine learning to extract meaningful insights and increasing competition. Create an editable Projection Model Why Is Predictive Analytics Important Diagrams PDF that communicates your idea and engages your audience. Whether you are presenting a business or an educational presentation, pre-designed presentation templates help save time. Projection Model Why Is Predictive Analytics Important Diagrams PDF is highly customizable and very easy to edit, covering many different styles from creative to business presentations. Slidegeeks has creative team members who have crafted amazing templates. So, go and get them without any delay.
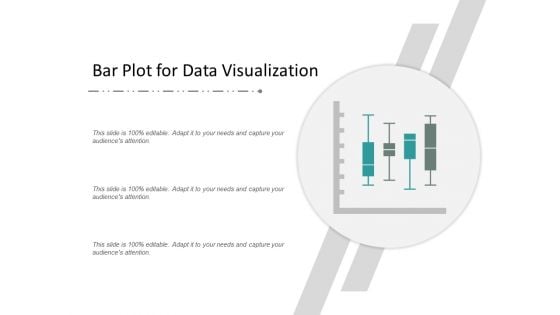
Bar Plot For Data Visualization Ppt Powerpoint Presentation Pictures Guide
This is a bar plot for data visualization ppt powerpoint presentation pictures guide. This is a four stage process. The stages in this process are scatter plot, probability plots, plot diagram.
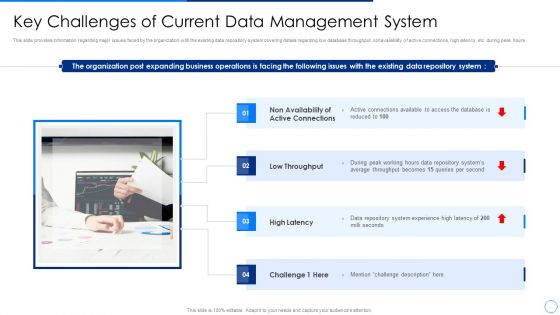
Scale Up Plan For Data Inventory Model Key Challenges Of Current Data Management System Themes PDF
This slide provides information regarding major issues faced by the organization with the existing data repository system covering details regarding low database throughput, nonavailability of active connections, high latency, etc. during peak hours. This is a scale up plan for data inventory model key challenges of current data management system themes pdf template with various stages. Focus and dispense information on four stages using this creative set, that comes with editable features. It contains large content boxes to add your information on topics like non availability of active connections, low throughput, high latency. You can also showcase facts, figures, and other relevant content using this PPT layout. Grab it now.
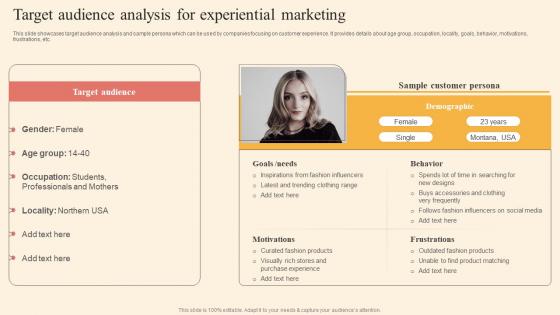
Target Audience Analysis Driving Business Success By Hosting Experiential Diagrams Pdf
This slide showcases target audience analysis and sample persona which can be used by companies focusing on customer experience. It provides details about age group, occupation, locality, goals, behavior, motivations, frustrations, etc. The Target Audience Analysis Driving Business Success By Hosting Experiential Diagrams Pdf is a compilation of the most recent design trends as a series of slides. It is suitable for any subject or industry presentation, containing attractive visuals and photo spots for businesses to clearly express their messages. This template contains a variety of slides for the user to input data, such as structures to contrast two elements, bullet points, and slides for written information. Slidegeeks is prepared to create an impression. This slide showcases target audience analysis and sample persona which can be used by companies focusing on customer experience. It provides details about age group, occupation, locality, goals, behavior, motivations, frustrations, etc.
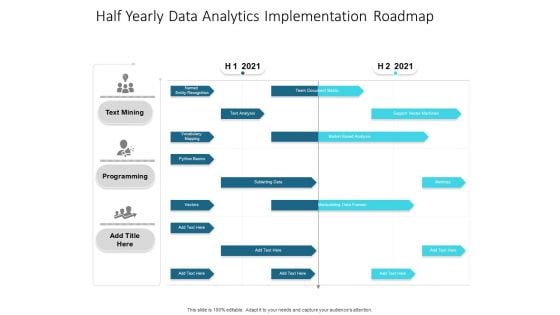
Half Yearly Data Analytics Implementation Roadmap Demonstration
We present our half yearly data analytics implementation roadmap demonstration. This PowerPoint layout is easy-to-edit so you can change the font size, font type, color, and shape conveniently. In addition to this, the PowerPoint layout is Google Slides compatible, so you can share it with your audience and give them access to edit it. Therefore, download and save this well-researched half yearly data analytics implementation roadmap demonstration in different formats like PDF, PNG, and JPG to smoothly execute your business plan.

Quarterly Data Analytics Career Roadmap For Engineering Professional Diagrams
Presenting our innovatively-structured quarterly data analytics career roadmap for engineering professional diagrams Template. Showcase your roadmap process in different formats like PDF, PNG, and JPG by clicking the download button below. This PPT design is available in both Standard Screen and Widescreen aspect ratios. It can also be easily personalized and presented with modified font size, font type, color, and shapes to measure your progress in a clear way.
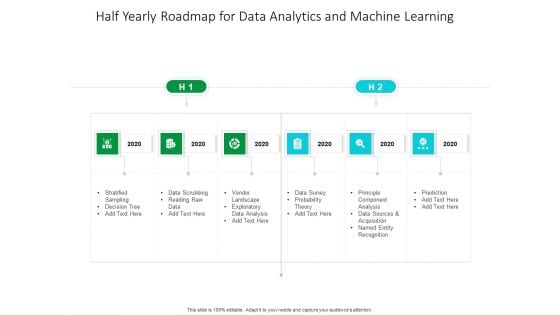
Half Yearly Roadmap For Data Analytics And Machine Learning Diagrams
Introducing our half yearly roadmap for data analytics and machine learning diagrams. This PPT presentation is Google Slides compatible, therefore, you can share it easily with the collaborators for measuring the progress. Also, the presentation is available in both standard screen and widescreen aspect ratios. So edit the template design by modifying the font size, font type, color, and shapes as per your requirements. As this PPT design is fully editable it can be presented in PDF, JPG and PNG formats.
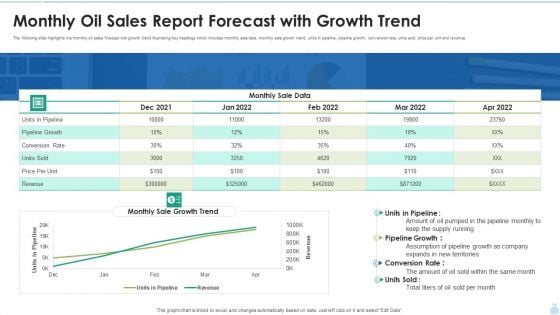
Monthly Oil Sales Report Forecast With Growth Trend Graphics PDF
The following slide highlights the monthly oil sales forecast with growth trend illustrating key headings which includes monthly sale data, monthly sale growth trend, units in pipeline, pipeline growth, conversion rate, units sold, price per unit and revenue. Showcasing this set of slides titled Monthly Oil Sales Report Forecast With Growth Trend Graphics PDF. The topics addressed in these templates are Pipeline Growth, Monthly Sale Data, Conversion Rate. All the content presented in this PPT design is completely editable. Download it and make adjustments in color, background, font etc. as per your unique business setting.
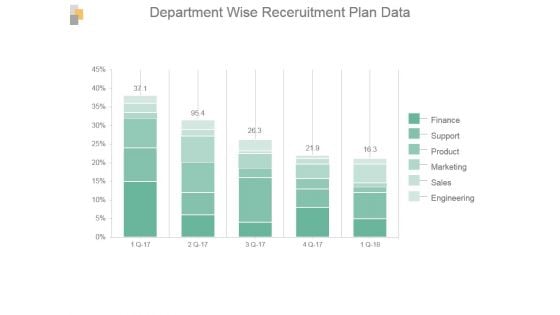
Department Wise Recruitment Plan Data Ppt Infographics
This is a department wise recruitment plan data ppt infographics. This is a five stage process. The stages in this process are finance, support, product, marketing, sales, engineering.
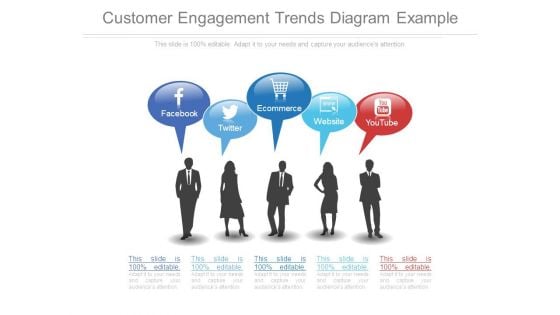
Customer Engagement Trends Diagram Example
This is a customer engagement trends diagram example. This is a five stage process. The stages in this process are facebook, twitter, ecommerce, website, youtube.
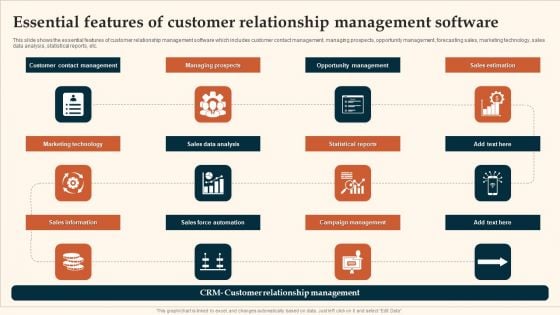
Essential Features Of Customer Relationship Management Software Formats PDF
This slide shows the essential features of customer relationship management software which includes customer contact management, managing prospects, opportunity management, forecasting sales, marketing technology, sales data analysis, statistical reports, etc. Presenting Essential Features Of Customer Relationship Management Software Formats PDF to dispense important information. This template comprises tweleve stages. It also presents valuable insights into the topics including Marketing Technology, Sales Data Analysis, Statistical Reports. This is a completely customizable PowerPoint theme that can be put to use immediately. So, download it and address the topic impactfully.
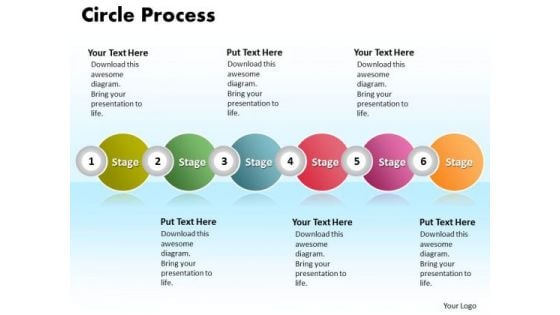
Ppt Circle Procurement Process PowerPoint Presentation 6 Phase Diagram Templates
PPT circle procurement process powerpoint presentation 6 phase diagram Templates-This template offers an excellent background to build up the various stages of your marketing process. Bullet-point your thoughts and ideas to profitably accomplish every step of every stage along the way.-PPT circle procurement process powerpoint presentation 6 phase diagram Templates-Abstract, Business, Chart, Circle, Company, Corporate, Design, Diagram, Different, Graph, Illustration, Information, Item, Junction, Management, Marketing, Menu, Modern, Network, Options, Parts, Pie, Plan, Presentation, Process, Report, Representational, Segments, Sphere, Statistics, Strategy, Structure, Wheel Back up your boast with our Ppt Circle Procurement Process PowerPoint Presentation 6 Phase Diagram Templates. Demonstrate to your audience that you can.
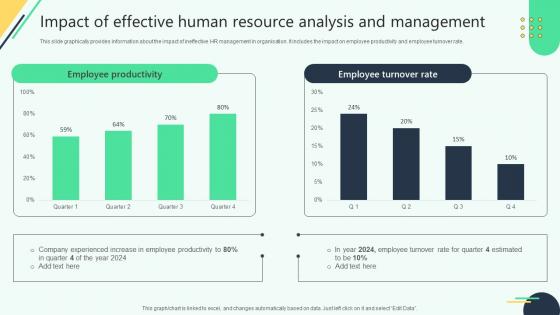
Impact Of Effective Human Resource Analysis And Analysing Hr Data For Effective Decision Making
This slide graphically provides information about the impact of ineffective HR management in organisation. It includes the impact on employee productivity and employee turnover rate. Slidegeeks has constructed Impact Of Effective Human Resource Analysis And Analysing Hr Data For Effective Decision Making after conducting extensive research and examination. These presentation templates are constantly being generated and modified based on user preferences and critiques from editors. Here, you will find the most attractive templates for a range of purposes while taking into account ratings and remarks from users regarding the content. This is an excellent jumping-off point to explore our content and will give new users an insight into our top-notch PowerPoint Templates. This slide graphically provides information about the impact of ineffective HR management in organisation. It includes the impact on employee productivity and employee turnover rate.
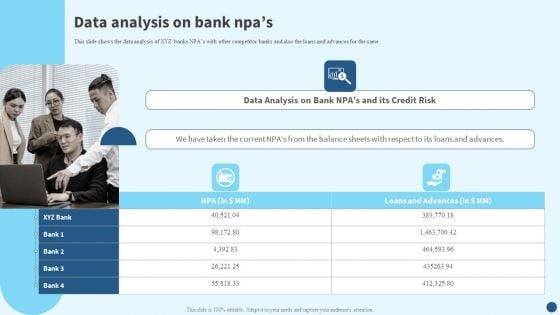
Credit Risk Management Data Analysis On Bank Npas Microsoft PDF
This slide shows the data analysis of XYZ banks NPAs with other competitor banks and also the loans and advances for the same. Whether you have daily or monthly meetings, a brilliant presentation is necessary. Credit Risk Management Data Analysis On Bank Npas Microsoft PDF can be your best option for delivering a presentation. Represent everything in detail using Credit Risk Management Data Analysis On Bank Npas Microsoft PDF and make yourself stand out in meetings. The template is versatile and follows a structure that will cater to your requirements. All the templates prepared by Slidegeeks are easy to download and edit. Our research experts have taken care of the corporate themes as well. So, give it a try and see the results.
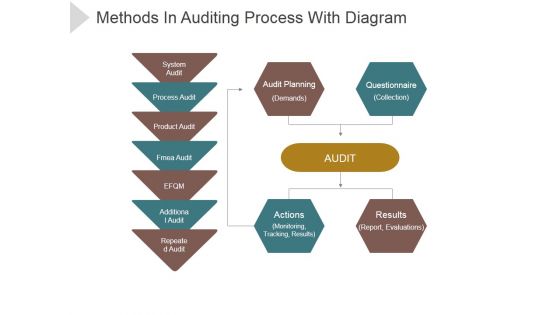
Methods In Auditing Process With Diagram Ppt PowerPoint Presentation Visual Aids
This is a methods in auditing process with diagram ppt powerpoint presentation visual aids. This is a four stage process. The stages in this process are system audit, process audit, product audit, fame audit, additional audit.
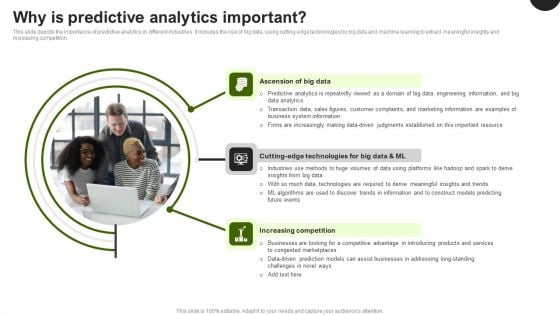
Predictive Analytics In The Age Of Big Data Why Is Predictive Analytics Important Clipart PDF
This slide depicts the importance of predictive analytics in different industries. It includes the rise of big data, using cutting-edge technologies for big data and machine learning to extract meaningful insights and increasing competition. Whether you have daily or monthly meetings, a brilliant presentation is necessary. Predictive Analytics In The Age Of Big Data Why Is Predictive Analytics Important Clipart PDF can be your best option for delivering a presentation. Represent everything in detail using Predictive Analytics In The Age Of Big Data Why Is Predictive Analytics Important Clipart PDF and make yourself stand out in meetings. The template is versatile and follows a structure that will cater to your requirements. All the templates prepared by Slidegeeks are easy to download and edit. Our research experts have taken care of the corporate themes as well. So, give it a try and see the results.
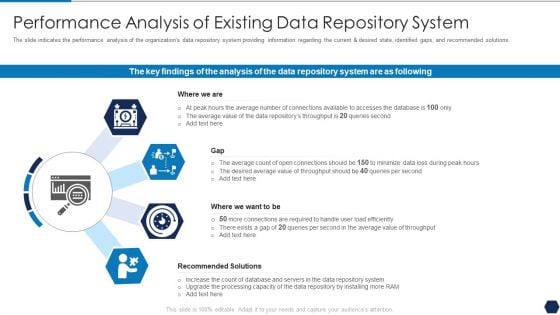
Tactical Plan For Upgrading DBMS Performance Analysis Of Existing Data Repository System Themes PDF
The slide indicates the performance analysis of the organizations data repository system providing information regarding the current and desired state, identified gaps, and recommended solutions. This is a tactical plan for upgrading dbms performance analysis of existing data repository system themes pdf template with various stages. Focus and dispense information on four stages using this creative set, that comes with editable features. It contains large content boxes to add your information on topics like performance analysis of existing data repository system. You can also showcase facts, figures, and other relevant content using this PPT layout. Grab it now.
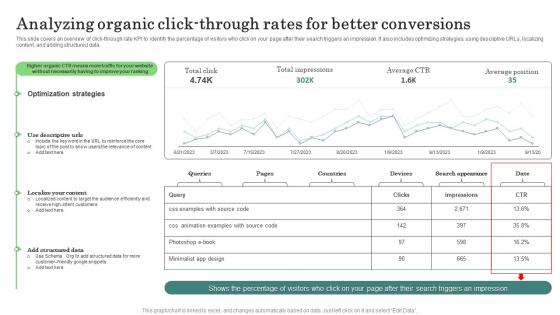
Analyzing Organic Click Through Major Promotional Analytics Future Trends Microsoft Pdf
This slide covers an overview of click through rate KPI to identify the percentage of visitors who click on your page after their search triggers an impression. It also includes optimizing strategies, using descriptive URLs, localizing content, and adding structured data. From laying roadmaps to briefing everything in detail, our templates are perfect for you. You can set the stage with your presentation slides. All you have to do is download these easy to edit and customizable templates. Analyzing Organic Click Through Major Promotional Analytics Future Trends Microsoft Pdf will help you deliver an outstanding performance that everyone would remember and praise you for. Do download this presentation today. This slide covers an overview of click through rate KPI to identify the percentage of visitors who click on your page after their search triggers an impression. It also includes optimizing strategies, using descriptive URLs, localizing content, and adding structured data.
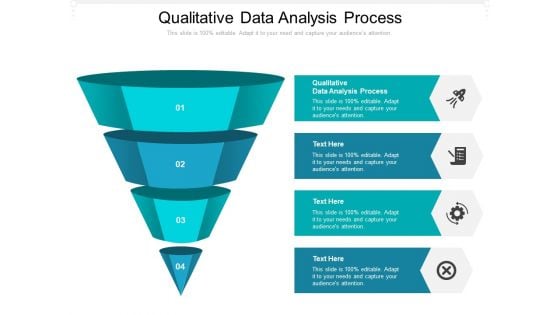
Qualitative Data Analysis Process Ppt PowerPoint Presentation Layouts Themes Cpb Pdf
Presenting this set of slides with name qualitative data analysis process ppt powerpoint presentation layouts themes cpb pdf. This is an editable Powerpoint four stages graphic that deals with topics like qualitative data analysis process to help convey your message better graphically. This product is a premium product available for immediate download and is 100 percent editable in Powerpoint. Download this now and use it in your presentations to impress your audience.
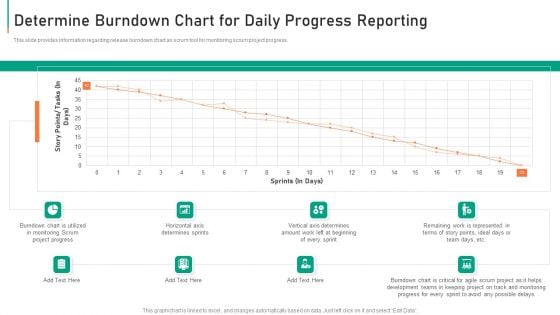
Determine Burndown Chart For Daily Progress Reporting Diagrams PDF
This slide provides information regarding release burndown chart as scrum tool for monitoring scrum project progress. Deliver and pitch your topic in the best possible manner with this determine burndown chart for daily progress reporting diagrams pdf. Use them to share invaluable insights on determine burndown chart for daily progress reporting and impress your audience. This template can be altered and modified as per your expectations. So, grab it now.
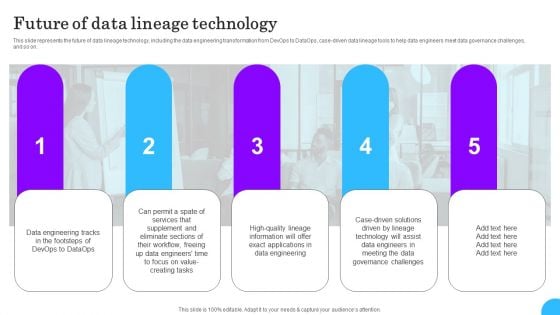
Comprehensive Analysis Of Different Data Lineage Classification Future Of Data Lineage Technology Ideas PDF
This slide represents the future of data lineage technology, including the data engineering transformation from DevOps to DataOps, case-driven data lineage tools to help data engineers meet data governance challenges, and so on. Are you searching for a Comprehensive Analysis Of Different Data Lineage Classification Future Of Data Lineage Technology Ideas PDF that is uncluttered, straightforward, and original Its easy to edit, and you can change the colors to suit your personal or business branding. For a presentation that expresses how much effort you have put in, this template is ideal With all of its features, including tables, diagrams, statistics, and lists, its perfect for a business plan presentation. Make your ideas more appealing with these professional slides. Download Comprehensive Analysis Of Different Data Lineage Classification Future Of Data Lineage Technology Ideas PDF from Slidegeeks today.
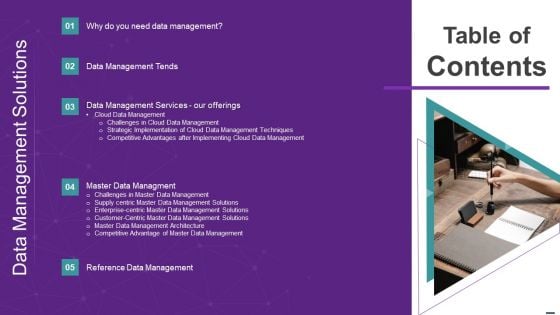
Data Management Solutions Table Of Contents Themes PDF
This is a Data Management Solutions Table Of Contents Themes PDF template with various stages. Focus and dispense information on eleven stages using this creative set, that comes with editable features. It contains large content boxes to add your information on topics like Data Management Tends, Data Management Services, Master Data Managment. You can also showcase facts, figures, and other relevant content using this PPT layout. Grab it now.
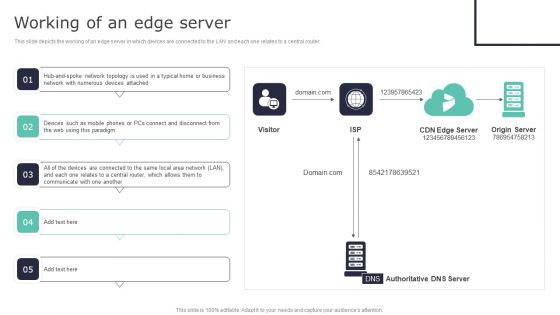
Deploying Content Distribution Network System Working Of An Edge Server Diagrams PDF
This slide depicts the working of an edge server in which devices are connected to the LAN and each one relates to a central router. From laying roadmaps to briefing everything in detail, our templates are perfect for you. You can set the stage with your presentation slides. All you have to do is download these easy-to-edit and customizable templates. Deploying Content Distribution Network System Working Of An Edge Server Diagrams PDF will help you deliver an outstanding performance that everyone would remember and praise you for. Do download this presentation today.
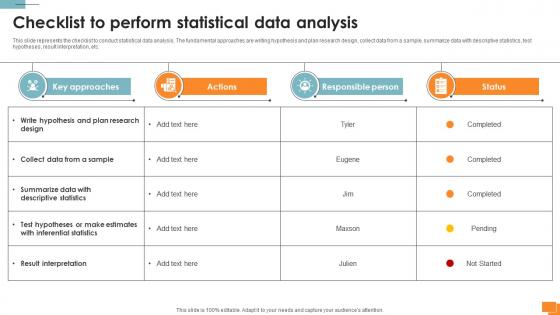
Statistical Tools For Evidence Checklist To Perform Statistical Data Analysis
This slide represents the checklist to conduct statistical data analysis. The fundamental approaches are writing hypothesis and plan research design, collect data from a sample, summarize data with descriptive statistics, test hypotheses, result interpretation, etc. Whether you have daily or monthly meetings, a brilliant presentation is necessary. Statistical Tools For Evidence Checklist To Perform Statistical Data Analysis can be your best option for delivering a presentation. Represent everything in detail using Statistical Tools For Evidence Checklist To Perform Statistical Data Analysis and make yourself stand out in meetings. The template is versatile and follows a structure that will cater to your requirements. All the templates prepared by Slidegeeks are easy to download and edit. Our research experts have taken care of the corporate themes as well. So, give it a try and see the results. This slide represents the checklist to conduct statistical data analysis. The fundamental approaches are writing hypothesis and plan research design, collect data from a sample, summarize data with descriptive statistics, test hypotheses, result interpretation, etc.
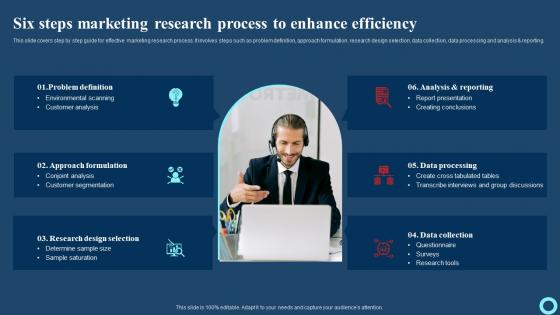
Six Steps Marketing Research Process To Enhance Efficiency Effective Strategies To Enhance Guidelines Pdf
This slide covers step by step guide for effective marketing research process. It involves steps such as problem definition, approach formulation, research design selection, data collection, data processing and analysis and reporting. Are you searching for a Six Steps Marketing Research Process To Enhance Efficiency Effective Strategies To Enhance Guidelines Pdf that is uncluttered, straightforward, and original It is easy to edit, and you can change the colors to suit your personal or business branding. For a presentation that expresses how much effort you have put in, this template is ideal With all of its features, including tables, diagrams, statistics, and lists, it is perfect for a business plan presentation. Make your ideas more appealing with these professional slides. Download Six Steps Marketing Research Process To Enhance Efficiency Effective Strategies To Enhance Guidelines Pdf from Slidegeeks today. This slide covers step by step guide for effective marketing research process. It involves steps such as problem definition, approach formulation, research design selection, data collection, data processing and analysis and reporting.
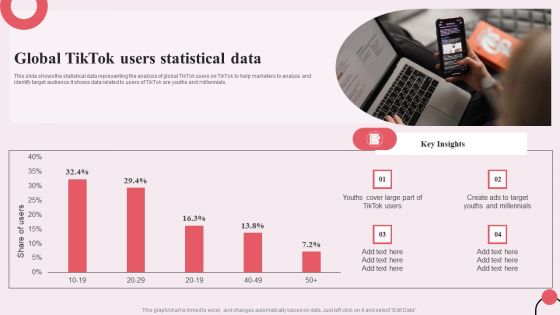
Tiktok Digital Marketing Campaign Global Tiktok Users Statistical Data Information PDF
This slide shows the statistical data representing the analysis of global TikTok users on TikTok to help marketers to analyze and identify target audience.It shows data related to users of TikTok are youths and millennials. Presenting this PowerPoint presentation, titled Tiktok Digital Marketing Campaign Global Tiktok Users Statistical Data Information PDF, with topics curated by our researchers after extensive research. This editable presentation is available for immediate download and provides attractive features when used. Download now and captivate your audience. Presenting this Tiktok Digital Marketing Campaign Global Tiktok Users Statistical Data Information PDF. Our researchers have carefully researched and created these slides with all aspects taken into consideration. This is a completely customizable Tiktok Digital Marketing Campaign Global Tiktok Users Statistical Data Information PDF that is available for immediate downloading. Download now and make an impact on your audience. Highlight the attractive features available with our PPTs.
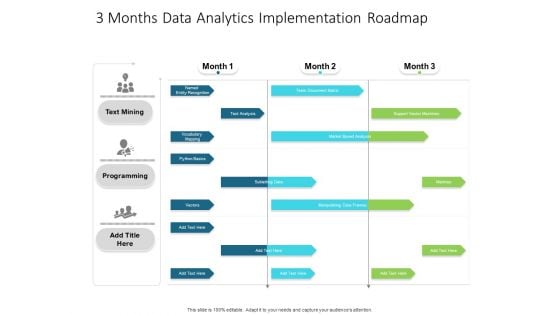
3 Months Data Analytics Implementation Roadmap Elements
Presenting our innovatively-structured 3 months data analytics implementation roadmap elements Template. Showcase your roadmap process in different formats like PDF, PNG, and JPG by clicking the download button below. This PPT design is available in both Standard Screen and Widescreen aspect ratios. It can also be easily personalized and presented with modified font size, font type, color, and shapes to measure your progress in a clear way.

3 Months Data Analytics Roadmap Structure
Introducing our 3 months data analytics roadmap structure. This PPT presentation is Google Slides compatible, therefore, you can share it easily with the collaborators for measuring the progress. Also, the presentation is available in both standard screen and widescreen aspect ratios. So edit the template design by modifying the font size, font type, color, and shapes as per your requirements. As this PPT design is fully editable it can be presented in PDF, JPG and PNG formats.
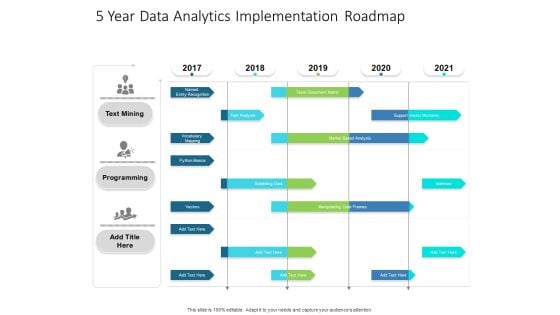
5 Year Data Analytics Implementation Roadmap Topics
Presenting our innovatively-structured 5 year data analytics implementation roadmap topics Template. Showcase your roadmap process in different formats like PDF, PNG, and JPG by clicking the download button below. This PPT design is available in both Standard Screen and Widescreen aspect ratios. It can also be easily personalized and presented with modified font size, font type, color, and shapes to measure your progress in a clear way.

5 Year Data Analytics Roadmap Infographics
Introducing our 5 year data analytics roadmap infographics. This PPT presentation is Google Slides compatible, therefore, you can share it easily with the collaborators for measuring the progress. Also, the presentation is available in both standard screen and widescreen aspect ratios. So edit the template design by modifying the font size, font type, color, and shapes as per your requirements. As this PPT design is fully editable it can be presented in PDF, JPG and PNG formats.
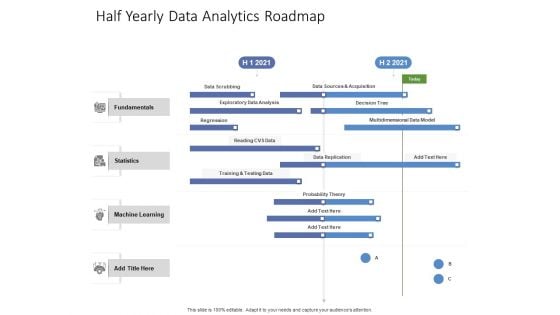
Half Yearly Data Analytics Roadmap Ideas
Presenting our innovatively-structured half yearly data analytics roadmap ideas Template. Showcase your roadmap process in different formats like PDF, PNG, and JPG by clicking the download button below. This PPT design is available in both Standard Screen and Widescreen aspect ratios. It can also be easily personalized and presented with modified font size, font type, color, and shapes to measure your progress in a clear way.
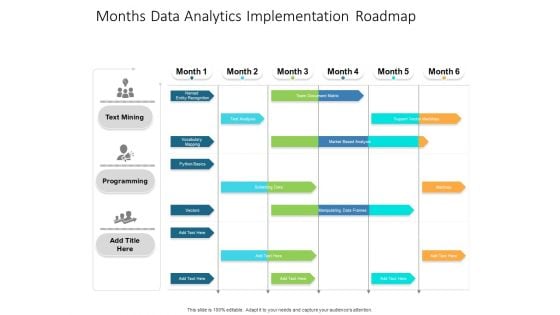
Months Data Analytics Implementation Roadmap Structure
Presenting our jaw-dropping months data analytics implementation roadmap structure. You can alternate the color, font size, font type, and shapes of this PPT layout according to your strategic process. This PPT presentation is compatible with Google Slides and is available in both standard screen and widescreen aspect ratios. You can also download this well-researched PowerPoint template design in different formats like PDF, JPG, and PNG. So utilize this visually-appealing design by clicking the download button given below.
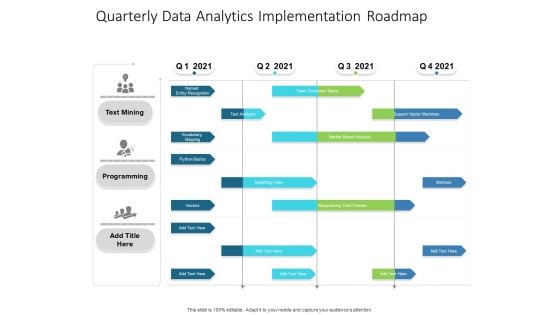
Quarterly Data Analytics Implementation Roadmap Pictures
Presenting our innovatively-structured quarterly data analytics implementation roadmap pictures Template. Showcase your roadmap process in different formats like PDF, PNG, and JPG by clicking the download button below. This PPT design is available in both Standard Screen and Widescreen aspect ratios. It can also be easily personalized and presented with modified font size, font type, color, and shapes to measure your progress in a clear way.
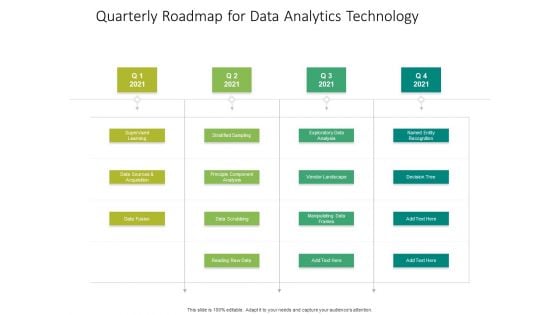
Quarterly Roadmap For Data Analytics Technology Slides
Presenting our jaw-dropping quarterly roadmap for data analytics technology slides. You can alternate the color, font size, font type, and shapes of this PPT layout according to your strategic process. This PPT presentation is compatible with Google Slides and is available in both standard screen and widescreen aspect ratios. You can also download this well-researched PowerPoint template design in different formats like PDF, JPG, and PNG. So utilize this visually-appealing design by clicking the download button given below.
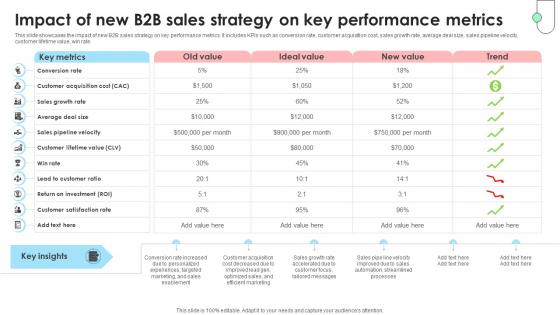
Navigating B2B Sales Impact Of New B2B Sales Strategy On Key SA SS V
This slide showcases the impact of new B2B sales strategy on key performance metrics. It includes KPIs such as conversion rate, customer acquisition cost, sales growth rate, average deal size, sales pipeline velocity, customer lifetime value, win rate. Do you know about Slidesgeeks Navigating B2B Sales Impact Of New B2B Sales Strategy On Key SA SS V These are perfect for delivering any kind od presentation. Using it, create PowerPoint presentations that communicate your ideas and engage audiences. Save time and effort by using our pre-designed presentation templates that are perfect for a wide range of topic. Our vast selection of designs covers a range of styles, from creative to business, and are all highly customizable and easy to edit. Download as a PowerPoint template or use them as Google Slides themes. This slide showcases the impact of new B2B sales strategy on key performance metrics. It includes KPIs such as conversion rate, customer acquisition cost, sales growth rate, average deal size, sales pipeline velocity, customer lifetime value, win rate.
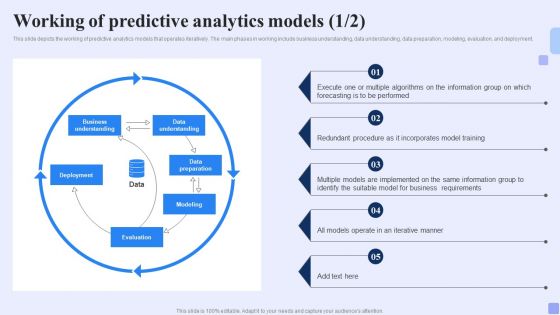
Working Of Predictive Analytics Models Forward Looking Analysis IT Elements PDF
This slide depicts the working of predictive analytics models that operates iteratively. The main phases in working include business understanding, data understanding, data preparation, modeling, evaluation, and deployment.Slidegeeks is here to make your presentations a breeze with Working Of Predictive Analytics Models Forward Looking Analysis IT Elements PDF With our easy-to-use and customizable templates, you can focus on delivering your ideas rather than worrying about formatting. With a variety of designs to choose from, you are sure to find one that suits your needs. And with animations and unique photos, illustrations, and fonts, you can make your presentation pop. So whether you are giving a sales pitch or presenting to the board, make sure to check out Slidegeeks first.
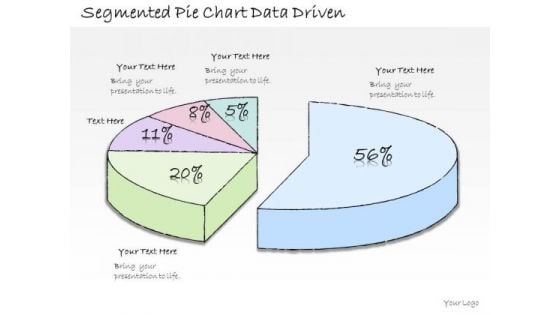
Ppt Slide Segmented Pie Chart Data Driven Business Diagrams
Dribble Away With Our PPT Slide segmented pie chart data driven business diagrams Powerpoint Templates. Score A Goal With Your Ideas. Drill It In With Our Business Plan Powerpoint Templates. Embed Your Message Into The Minds Of Your Audience.
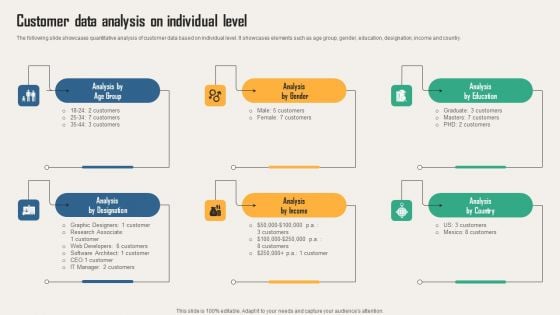
Creating Customer Personas For Customizing Customer Data Analysis On Individual Level Themes PDF
The following slide showcases quantitative analysis of customer data based on individual level. It showcases elements such as age group, gender, education, designation, income and country. From laying roadmaps to briefing everything in detail, our templates are perfect for you. You can set the stage with your presentation slides. All you have to do is download these easy-to-edit and customizable templates. Creating Customer Personas For Customizing Customer Data Analysis On Individual Level Themes PDF will help you deliver an outstanding performance that everyone would remember and praise you for. Do download this presentation today.
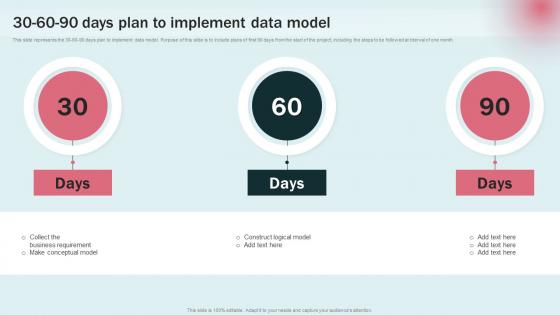
30 60 90 Days Plan To Implement Data Modeling Approaches For Modern Analytics Guidelines Pdf
This slide represents the 30 60 90 days plan to implement data model. Purpose of this slide is to include plans of first 90 days from the start of the project, including the steps to be followed at interval of one month. Find a pre designed and impeccable 30 60 90 Days Plan To Implement Data Modeling Approaches For Modern Analytics Guidelines Pdf. The templates can ace your presentation without additional effort. You can download these easy to edit presentation templates to make your presentation stand out from others. So, what are you waiting for Download the template from Slidegeeks today and give a unique touch to your presentation. This slide represents the 30 60 90 days plan to implement data model. Purpose of this slide is to include plans of first 90 days from the start of the project, including the steps to be followed at interval of one month.
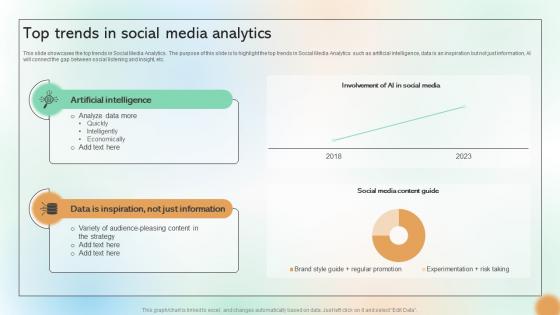
Top Trends In Social Media Analytics Cracking The Code Of Social Media
This slide showcases the top trends in Social Media Analytics. The purpose of this slide is to highlight the top trends in Social Media Analytics such as artificial intelligence, data is an inspiration but not just information, AI will connect the gap between social listening and insight, etc. Present like a pro with Top Trends In Social Media Analytics Cracking The Code Of Social Media. Create beautiful presentations together with your team, using our easy-to-use presentation slides. Share your ideas in real-time and make changes on the fly by downloading our templates. So whether you are in the office, on the go, or in a remote location, you can stay in sync with your team and present your ideas with This slide showcases the top trends in Social Media Analytics. The purpose of this slide is to highlight the top trends in Social Media Analytics such as artificial intelligence, data is an inspiration but not just information, AI will connect the gap between social listening and insight, etc.
8 Stages Concentric Data Flow Diagram Ppt Business Plan PowerPoint Templates
We present our 8 stages concentric data flow diagram ppt business plan PowerPoint templates.Present our Business PowerPoint Templates because Watching this your Audience will Grab their eyeballs, they wont even blink. Download and present our Circle Charts PowerPoint Templates because You have a driving passion to excel in your field. Our PowerPoint Templates and Slides will prove ideal vehicles for your ideas. Download our Signs PowerPoint Templates because You should Kick up a storm with our PowerPoint Templates and Slides. The heads of your listeners will swirl with your ideas. Download and present our Shapes PowerPoint Templates because Our PowerPoint Templates and Slides are aesthetically designed to attract attention. We gaurantee that they will grab all the eyeballs you need. Download our Metaphors-Visual Concepts PowerPoint Templates because Our PowerPoint Templates and Slides help you meet the demand of the Market. Just browse and pick the slides that appeal to your intuitive senses.Use these PowerPoint slides for presentations relating to radial, concentric, shine, pipe, line, environmental, circle, rendered, plastic, striped, shape, abstract, object, shiny, reflective, capsule, stripe, background, border, ecological, repetition. The prominent colors used in the PowerPoint template are Blue, Black, Gray. Get them all gung-ho with our 8 Stages Concentric Data Flow Diagram Ppt Business Plan PowerPoint Templates. Crank up their enthusiasm with with your words.
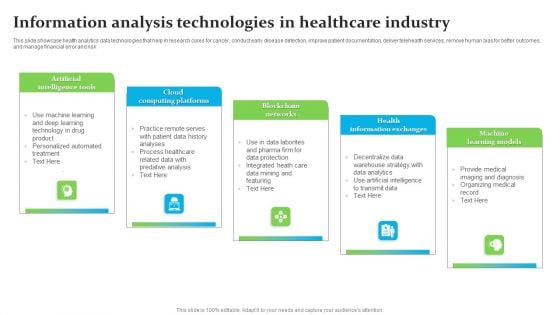
Information Analysis Technologies In Healthcare Industry Ppt Inspiration Gridlines PDF
This slide showcase health analytics data technologies that help in research cures for cancer, conduct early disease detection, improve patient documentation, deliver telehealth services, remove human bias for better outcomes, and manage financial error and risk. Presenting Information Analysis Technologies In Healthcare Industry Ppt Inspiration Gridlines PDF to dispense important information. This template comprises five stages. It also presents valuable insights into the topics including Artificial Intelligence Tools, Cloud Computing Platforms, Blockchain Networks. This is a completely customizable PowerPoint theme that can be put to use immediately. So, download it and address the topic impactfully.
Data Analysis Process Diagram 9 Stages Help With Business Plan PowerPoint Slides
We present our data analysis process diagram 9 stages help with business plan PowerPoint Slides.Use our Computer PowerPoint Templates because Our PowerPoint Templates and Slides will let you Leave a lasting impression to your audiences. They possess an inherent longstanding recall factor. Use our Communication PowerPoint Templates because you can Break through with our PowerPoint Templates and Slides. Bring down the mental barriers of your audience. Use our Semicircles PowerPoint Templates because Our PowerPoint Templates and Slides will let your words and thoughts hit bullseye everytime. Present our Shapes PowerPoint Templates because Our PowerPoint Templates and Slides will let you meet your Deadlines. Use our Business PowerPoint Templates because Our PowerPoint Templates and Slides have the Brilliant backdrops. Guaranteed to illuminate the minds of your audience.Use these PowerPoint slides for presentations relating to Catalogue, chart, checking, choice, circle, swatch, computer, design, equipment, fan, gamma, guide, mix, object, paint, palette, pantone, paper, press, print, printout, process, profile, publishing, rainbow, round, scale, select, selection, semicircle, spectrum, system, template, typographic, typography, variation. The prominent colors used in the PowerPoint template are Blue, Gray, Black. Identify targets with our Data Analysis Process Diagram 9 Stages Help With Business Plan PowerPoint Slides. Download without worries with our money back guaranteee.

Data Processing Maturity Model With Supporting It Capabilities Themes PDF
Presenting data processing maturity model with supporting it capabilities themes pdf to dispense important information. This template comprises four stages. It also presents valuable insights into the topics including information, management, technological development. This is a completely customizable PowerPoint theme that can be put to use immediately. So, download it and address the topic impactfully.
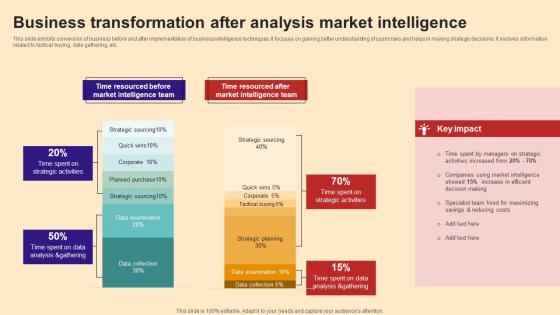
Business Transformation After Analysis Market Intelligence Demonstration Pdf
This slide exhibits conversion of business before and after implementation of business intelligence techniques. It focuses on gaining better understanding of customers and helps in making strategic decisions. It involves information related to tactical buying, data gathering, etc.Pitch your topic with ease and precision using this Business Transformation After Analysis Market Intelligence Demonstration Pdf This layout presents information on Decision Making, Managers Strategic, Activities Increased It is also available for immediate download and adjustment. So, changes can be made in the color, design, graphics or any other component to create a unique layout. This slide exhibits conversion of business before and after implementation of business intelligence techniques. It focuses on gaining better understanding of customers and helps in making strategic decisions. It involves information related to tactical buying, data gathering, etc.
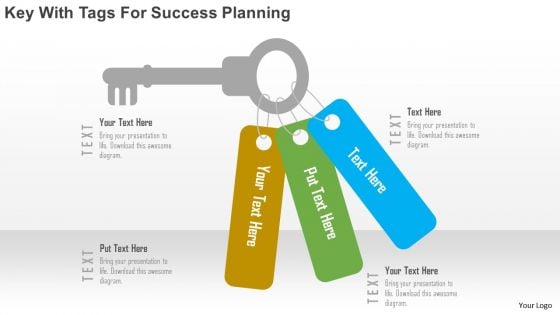
Business Diagram Key With Tags For Success Planning Presentation Template
This business diagram slide has been designed with graphics of key with tags. You may use this slide to depict success planning. Download this diagram slide to make impressive presentations.
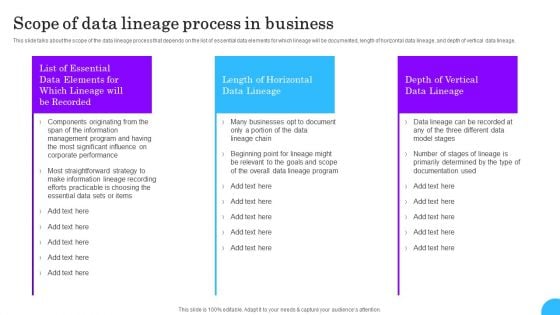
Comprehensive Analysis Of Different Data Lineage Classification Scope Of Data Lineage Process Business Ideas PDF
This slide talks about the scope of the data lineage process that depends on the list of essential data elements for which lineage will be documented, length of horizontal data lineage, and depth of vertical data lineage. Whether you have daily or monthly meetings, a brilliant presentation is necessary. Comprehensive Analysis Of Different Data Lineage Classification Scope Of Data Lineage Process Business Ideas PDF can be your best option for delivering a presentation. Represent everything in detail using Comprehensive Analysis Of Different Data Lineage Classification Scope Of Data Lineage Process Business Ideas PDF and make yourself stand out in meetings. The template is versatile and follows a structure that will cater to your requirements. All the templates prepared by Slidegeeks are easy to download and edit. Our research experts have taken care of the corporate themes as well. So, give it a try and see the results.
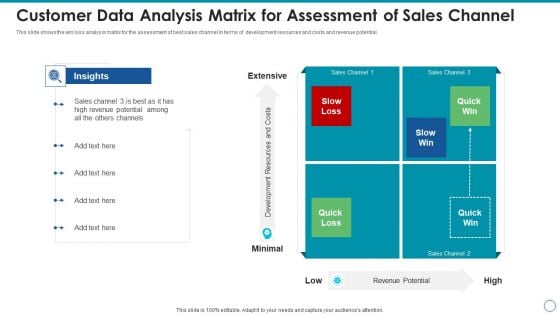
Customer Data Analysis Matrix For Assessment Of Sales Channel Template PDF
This slide shows the win loss analysis matrix for the assessment of best sales channel in terms of development resources and costs and revenue potential. Presenting customer data analysis matrix for assessment of sales channel template pdf to dispense important information. This template comprises four stages. It also presents valuable insights into the topics including customer data analysis matrix for assessment of sales channel. This is a completely customizable PowerPoint theme that can be put to use immediately. So, download it and address the topic impactfully.
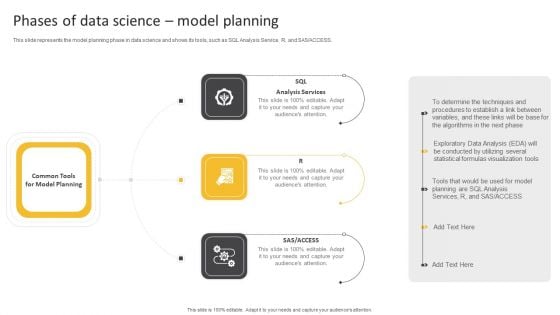
Information Science Phases Of Data Science Model Planning Ppt PowerPoint Presentation Styles Display PDF
This slide represents the model planning phase in data science and shows its tools, such as SQL Analysis Service, R, and SAS or ACCESS.This is a Information Science Phases Of Data Science Model Planning Ppt PowerPoint Presentation Styles Display PDF template with various stages. Focus and dispense information on three stages using this creative set, that comes with editable features. It contains large content boxes to add your information on topics like Determine Techniques, Procedures Establish, Statistical Formulas. You can also showcase facts, figures, and other relevant content using this PPT layout. Grab it now.
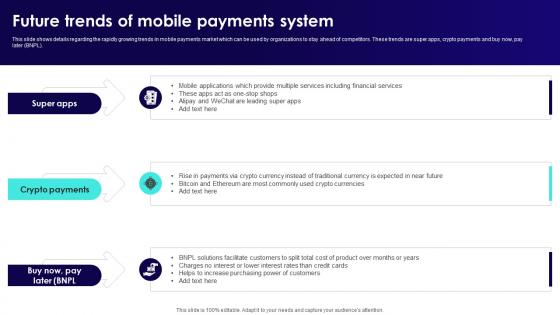
Wireless Banking To Improve Future Trends Of Mobile Payments System Fin SS V
This slide shows details regarding the rapidly growing trends in mobile payments market which can be used by organizations to stay ahead of competitors. These trends are super apps, crypto payments and buy now, pay later BNPL. Retrieve professionally designed Wireless Banking To Improve Future Trends Of Mobile Payments System Fin SS V to effectively convey your message and captivate your listeners. Save time by selecting pre-made slideshows that are appropriate for various topics, from business to educational purposes. These themes come in many different styles, from creative to corporate, and all of them are easily adjustable and can be edited quickly. Access them as PowerPoint templates or as Google Slides themes. You do not have to go on a hunt for the perfect presentation because Slidegeeks got you covered from everywhere. This slide shows details regarding the rapidly growing trends in mobile payments market which can be used by organizations to stay ahead of competitors. These trends are super apps, crypto payments and buy now, pay later BNPL.
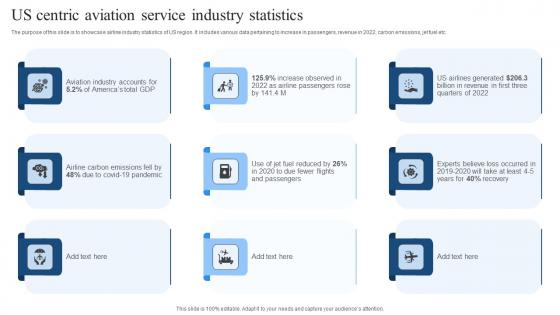
Us Centric Aviation Service Industry Statistics Diagrams Pdf
The purpose of this slide is to showcase airline industry statistics of US region. It includes various data pertaining to increase in passengers, revenue in 2022, carbon emissions, jet fuel etc. Pitch your topic with ease and precision using this Us Centric Aviation Service Industry Statistics Diagrams Pdf. This layout presents information on Carbon Emissions, Airline Passengers. It is also available for immediate download and adjustment. So, changes can be made in the color, design, graphics or any other component to create a unique layout. The purpose of this slide is to showcase airline industry statistics of US region. It includes various data pertaining to increase in passengers, revenue in 2022, carbon emissions, jet fuel etc.

Evaluating Projected Vs Actual Sales Performance Diagrams PDF
The following slide depicts the evaluation of existing sales performance to set future standards and determine opportunities for improvement. It mainly includes key performance indicators KPIs such as pipeline, forecast, attainment, gap etc. There are so many reasons you need a Evaluating Projected Vs Actual Sales Performance Diagrams PDF. The first reason is you can not spend time making everything from scratch, Thus, Slidegeeks has made presentation templates for you too. You can easily download these templates from our website easily.
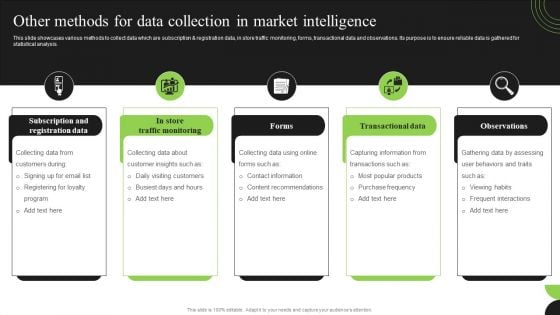
Guidebook For Executing Business Market Intelligence Other Methods For Data Collection Demonstration PDF
This slide showcases various methods to collect data which are subscription and registration data, in store traffic monitoring, forms, transactional data and observations. Its purpose is to ensure reliable data is gathered for statistical analysis. Are you searching for a Guidebook For Executing Business Market Intelligence Other Methods For Data Collection Demonstration PDF that is uncluttered, straightforward, and original Its easy to edit, and you can change the colors to suit your personal or business branding. For a presentation that expresses how much effort you have put in, this template is ideal With all of its features, including tables, diagrams, statistics, and lists, its perfect for a business plan presentation. Make your ideas more appealing with these professional slides. Download Guidebook For Executing Business Market Intelligence Other Methods For Data Collection Demonstration PDF from Slidegeeks today.
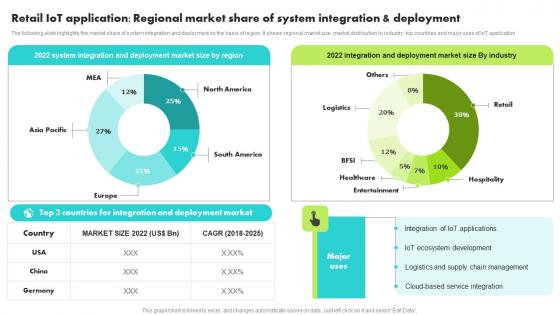
Retail IoT Application Regional Market Share System Guide For Retail IoT Solutions Analysis Pictures Pdf
The following slide highlights the market share of system integration and deployment on the basis of region. It shows regional market size, market distribution by industry, top countries and major uses of IoT application The Retail IoT Application Regional Market Share System Guide For Retail IoT Solutions Analysis Pictures Pdf is a compilation of the most recent design trends as a series of slides. It is suitable for any subject or industry presentation, containing attractive visuals and photo spots for businesses to clearly express their messages. This template contains a variety of slides for the user to input data, such as structures to contrast two elements, bullet points, and slides for written information. Slidegeeks is prepared to create an impression. The following slide highlights the market share of system integration and deployment on the basis of region. It shows regional market size, market distribution by industry, top countries and major uses of IoT application
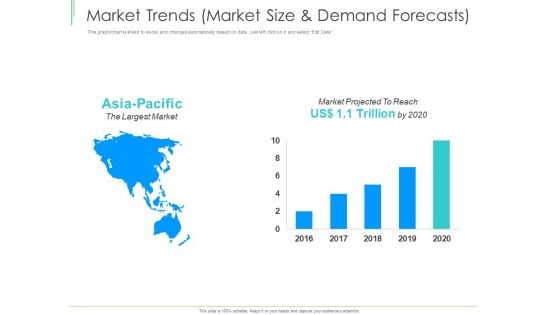
Marketing Plan Implementation Market Trends Market Size And Demand Forecasts Topics PDF
This graph or chart is linked to excel, and changes automatically based on data. Just left click on it and select Edit Data. Deliver an awe-inspiring pitch with this creative marketing plan implementation market trends market size and demand forecasts topics pdf bundle. Topics like market trends, market size and demand forecasts can be discussed with this completely editable template. It is available for immediate download depending on the needs and requirements of the user.
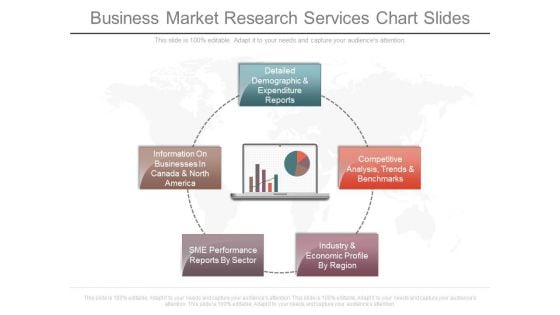
Business Market Research Services Chart Slides
This is a business market research services chart slides. This is a five stage process. The stages in this process are detailed demographic and expenditure reports, competitive analysis trends and benchmarks, industry and economic profile by region, sme performance reports by sector, information on businesses in canada and north america.
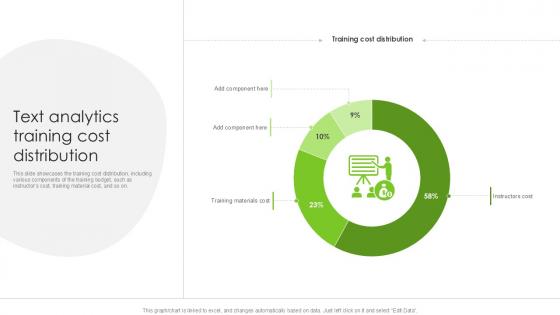
Text Analytics Training Cost Distribution PPT Sample SS
This slide showcases the training cost distribution, including various components of the training budget, such as instructors cost, training material cost, and so on. The Text Analytics Training Cost Distribution PPT Sample SS is a compilation of the most recent design trends as a series of slides. It is suitable for any subject or industry presentation, containing attractive visuals and photo spots for businesses to clearly express their messages. This template contains a variety of slides for the user to input data, such as structures to contrast two elements, bullet points, and slides for written information. Slidegeeks is prepared to create an impression. This slide showcases the training cost distribution, including various components of the training budget, such as instructors cost, training material cost, and so on.
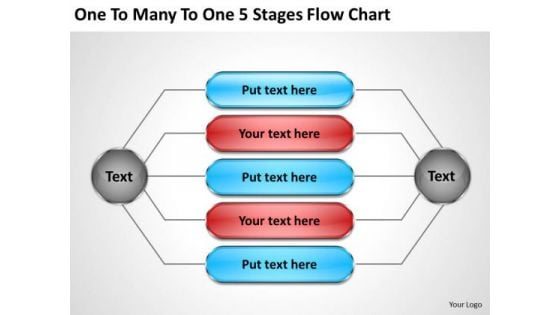
Business Entity Diagram One To Many 5 Stages Flow Chart PowerPoint Slides
We present our business entity diagram one to many 5 stages flow chart PowerPoint Slides.Download our Arrows PowerPoint Templates because You can Be the star of the show with our PowerPoint Templates and Slides. Rock the stage with your ideas. Download and present our Network Diagrams PowerPoint Templates because You can Channelise the thoughts of your team with our PowerPoint Templates and Slides. Urge them to focus on the goals you have set. Download and present our Marketing PowerPoint Templates because Our PowerPoint Templates and Slides are the chords of your song. String them along and provide the lilt to your views. Download our Business PowerPoint Templates because Our PowerPoint Templates and Slides will let you Leave a lasting impression to your audiences. They possess an inherent longstanding recall factor. Use our Shapes PowerPoint Templates because It will let you Set new benchmarks with our PowerPoint Templates and Slides. They will keep your prospects well above par.Use these PowerPoint slides for presentations relating to Arrow, Blue, Box, Brochure, Business, Button, Catalog, Chart, Circle, Company, Cross, Data, Design, Diagram, Direction, Document, Financial, Glossy, Goals, Graph, Green, Junction, Management, Market, Marketing, Model, Multicolored, Multiple, Navigation, Network, Options, Orange, Pie, Plan, Presentation, Process, Purple, Red, Results, Shiny, Six, Sphere, Statistics, Stock, Structure, Template, Vector. The prominent colors used in the PowerPoint template are Red, Blue, Gray. Finalise plans with our Business Entity Diagram One To Many 5 Stages Flow Chart PowerPoint Slides. Give the final touch to your thoughts.
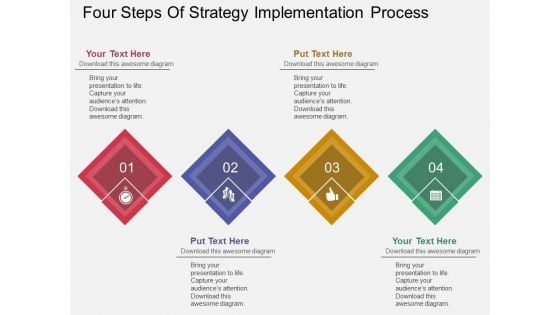
Four Steps Of Strategy Implementation Process Powerpoint Template
Our above business slide contains colorful infographic diagram. Download this template to display four steps of strategy implementation. This diagram provides an effective way of displaying information you can edit text, color, shade and style as per you need.
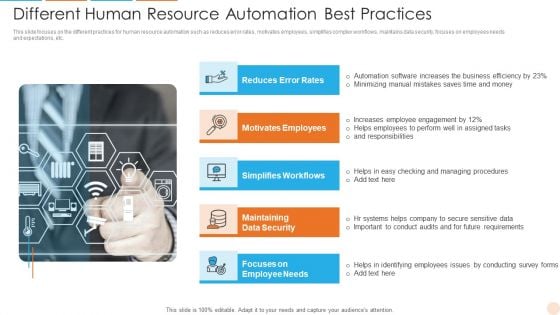
Different Human Resource Automation Best Practices Themes PDF
This slide focuses on the different practices for human resource automation such as reduces error rates, motivates employees, simplifies complex workflows, maintains data security, focuses on employees needs and expectations, etc. Persuade your audience using this Different Human Resource Automation Best Practices Themes PDF. This PPT design covers four stages, thus making it a great tool to use. It also caters to a variety of topics including Reduces Error Rates, Motivates Employees, Maintaining Data Security. Download this PPT design now to present a convincing pitch that not only emphasizes the topic but also showcases your presentation skills.
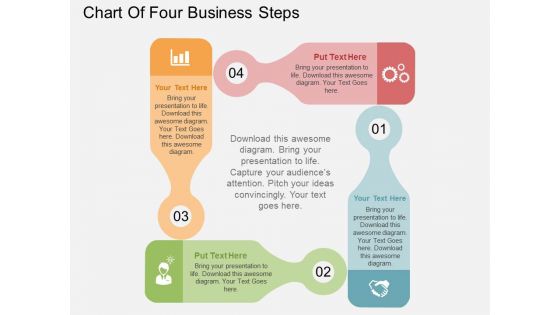
Chart Of Four Business Steps Powerpoint Templates
This business diagram displays flow of four business steps. This editable slide is suitable to present growth management. Use this diagram for business and finance related topics and display complete data analysis in your presentation.
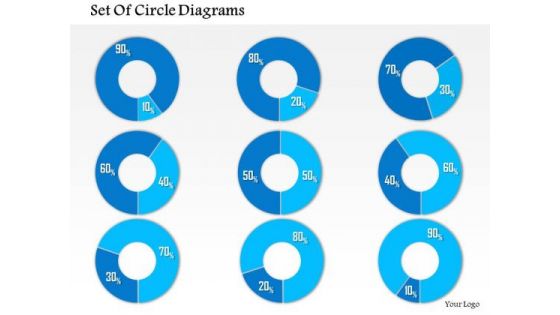
Business Framework 10 Percent To 90 Percent PowerPoint Presentation
This business diagram has been designed with graphic of multiple pie graphs. This diagram slide contains the concept of result analysis with percentage values. Use this diagram to present and compare data in an impressive manner
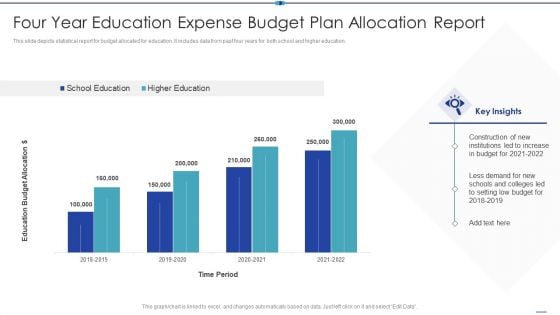
Four Year Education Expense Budget Plan Allocation Report Sample PDF
This slide depicts statistical report for budget allocated for education. It includes data from past four years for both school and higher education.Pitch your topic with ease and precision using this Four Year Education Expense Budget Plan Allocation Report Sample PDF This layout presents information on Institutions Increase, Less Demand, Education Budget It is also available for immediate download and adjustment. So, changes can be made in the color, design, graphics or any other component to create a unique layout.
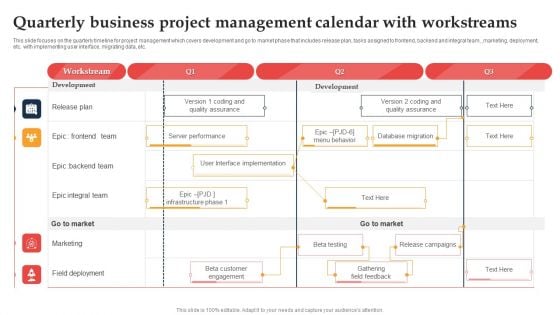
Quarterly Business Project Management Calendar With Workstreams Ppt Ideas Influencers PDF
This slide focuses on the quarterly timeline for project management which covers development and go to market phase that includes release plan, tasks assigned to frontend, backend and integral team, ,marketing, deployment, etc. with implementing user interface, migrating data, etc. Pitch your topic with ease and precision using this Quarterly Business Project Management Calendar With Workstreams Ppt Ideas Influencers PDF. This layout presents information on Release Plan, Workstream, Development. It is also available for immediate download and adjustment. So, changes can be made in the color, design, graphics or any other component to create a unique layout.
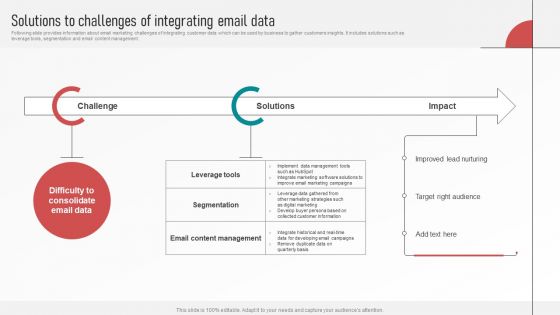
Customer Retention With Email Advertising Campaign Plan Solutions To Challenges Of Integrating Email Data Clipart PDF
Following slide provides information about email marketing challenges of integrating customer data which can be used by business to gather customers insights. It includes solutions such as leverage tools, segmentation and email content management. Are you searching for a Customer Retention With Email Advertising Campaign Plan Solutions To Challenges Of Integrating Email Data Clipart PDF that is uncluttered, straightforward, and original Its easy to edit, and you can change the colors to suit your personal or business branding. For a presentation that expresses how much effort you have put in, this template is ideal. With all of its features, including tables, diagrams, statistics, and lists, its perfect for a business plan presentation. Make your ideas more appealing with these professional slides. Download Customer Retention With Email Advertising Campaign Plan Solutions To Challenges Of Integrating Email Data Clipart PDF from Slidegeeks today.
Tabs For Tracking Mortgage Application Status In Progress Themes PDF
The following slide highlights loan status in progress tracking utilizing tabs facilitating managers to monitor application. It includes tabs such as application snapshot, loan information, declared income and expenses, documents and activities etc. Presenting Tabs For Tracking Mortgage Application Status In Progress Themes PDF to dispense important information. This template comprises five stages. It also presents valuable insights into the topics including Application Snapshot, Loan Information, Declared Income Expenses . This is a completely customizable PowerPoint theme that can be put to use immediately. So, download it and address the topic impactfully.
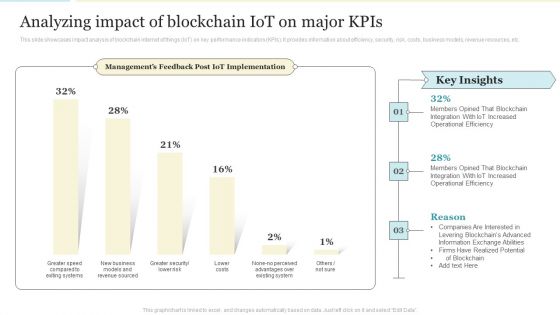
Analyzing Impact Of Blockchain Iot On Major Kpis Formats PDF
This slide showcases impact analysis of blockchain internet of things IoT on key performance indicators KPIs. It provides information about efficiency, security, risk, costs, business models, revenue resources, etc. Deliver an awe inspiring pitch with this creative Analyzing Impact Of Blockchain Iot On Major Kpis Formats PDF bundle. Topics like Operational Efficiency, Information, Existing System can be discussed with this completely editable template. It is available for immediate download depending on the needs and requirements of the user.
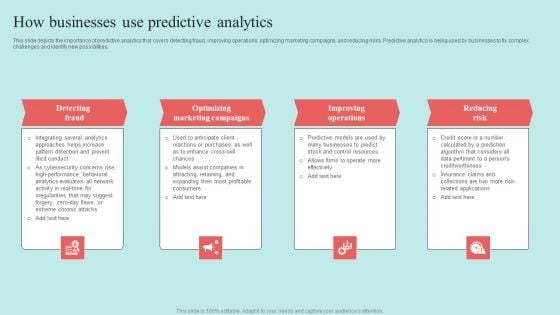
Predictive Data Model How Businesses Use Predictive Analytics Topics PDF
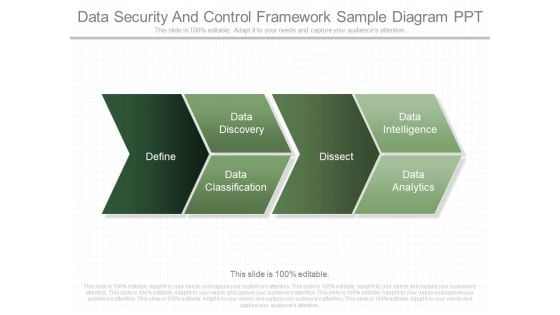
Data Security And Control Framework Sample Diagram Ppt
This is a data security and control framework sample diagram ppt. This is a four stage process. The stages in this process are define, data classification, data discovery, dissect, data intelligence, data analytics.
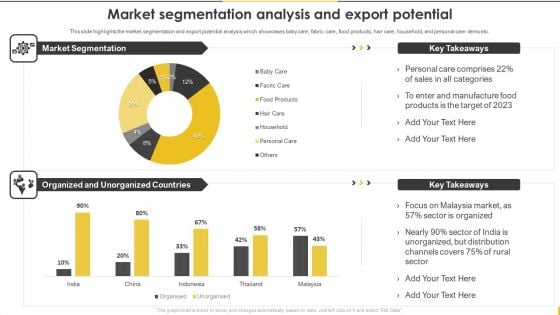
Customer Goods Production Market Segmentation Analysis And Export Potential Download PDF
This slide highlights the market segmentation and export potential analysis which showcases baby care, fabric care, food products, hair care, household, and personal care items etc. The Customer Goods Production Market Segmentation Analysis And Export Potential Download PDF is a compilation of the most recent design trends as a series of slides. It is suitable for any subject or industry presentation, containing attractive visuals and photo spots for businesses to clearly express their messages. This template contains a variety of slides for the user to input data, such as structures to contrast two elements, bullet points, and slides for written information. Slidegeeks is prepared to create an impression.
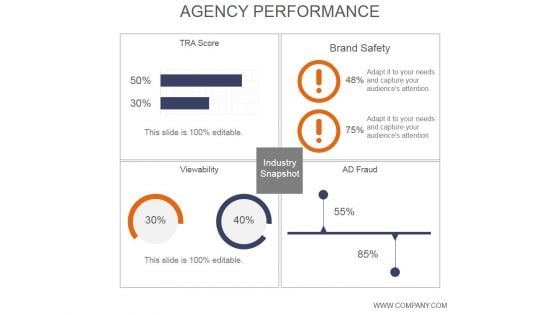
Agency Performance Ppt PowerPoint Presentation Layout
This is a agency performance ppt powerpoint presentation layout. This is a four stage process. The stages in this process are tra score, viewability, industry snapshot, brand safety, ad fraud.
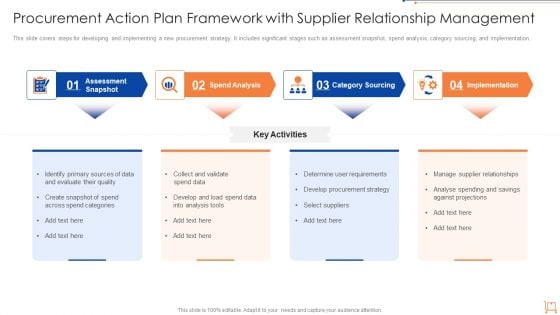
Procurement Action Plan Framework With Supplier Relationship Management Themes PDF
This slide covers steps for developing and implementing a new procurement strategy. It includes significant stages such as assessment snapshot, spend analysis, category sourcing, and implementation. Persuade your audience using this procurement action plan framework with supplier relationship management themes pdf. This PPT design covers four stages, thus making it a great tool to use. It also caters to a variety of topics including assessment snapshot, spend analysis, category sourcing, implementation. Download this PPT design now to present a convincing pitch that not only emphasizes the topic but also showcases your presentation skills.
Presentation Of BPO Data Through Chart Ppt Pictures Design Inspiration PDF
Pitch your topic with ease and precision using this presentation of bpo data through chart ppt pictures design inspiration pdf. This layout presents information on presentation of bpo data through chart. It is also available for immediate download and adjustment. So, changes can be made in the color, design, graphics or any other component to create a unique layout.
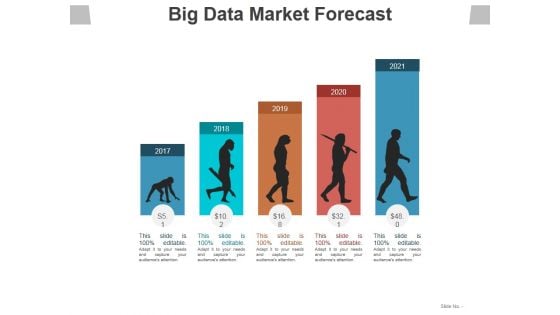
Big Data Market Forecast Ppt PowerPoint Presentation Ideas Information
This is a big data market forecast ppt powerpoint presentation ideas information. This is a five stage process. The stages in this process are years, planning, growth, business, marketing.
New Business Trends Diagram Presentation Diagrams
This is a new business trends diagram presentation diagrams. This is a four stage process. The stages in this process are problem, passion, learn, measure.
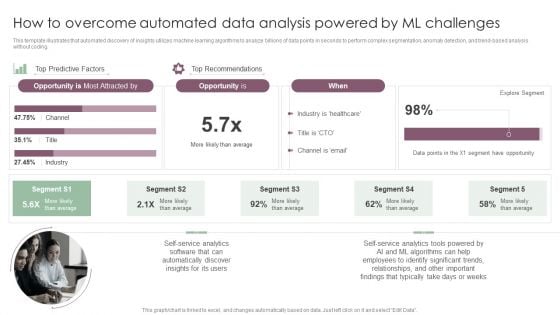
Information Analysis And BI Playbook How To Overcome Automated Data Analysis Powered By Ml Challenges Clipart PDF
This template illustrates that automated discovery of insights utilizes machine learning algorithms to analyze billions of data points in seconds to perform complex segmentation, anomaly detection, and trend-based analysis without coding. Make sure to capture your audiences attention in your business displays with our gratis customizable Information Analysis And BI Playbook How To Overcome Automated Data Analysis Powered By Ml Challenges Clipart PDF. These are great for business strategies, office conferences, capital raising or task suggestions. If you desire to acquire more customers for your tech business and ensure they stay satisfied, create your own sales presentation with these plain slides.
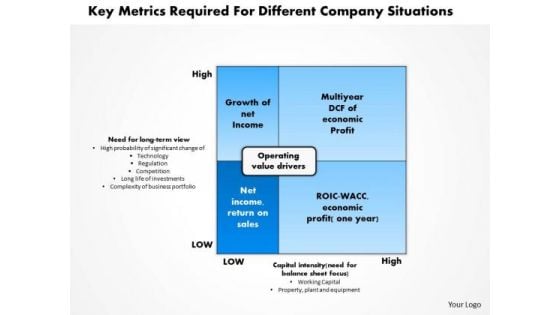
Business Diagram Key Metrics Required For Different Company Situations PowerPoint Ppt Presentation
Get The Domestics Right With Our Business Diagram Key Metrics Required For Different Company Situations PowerPoint PPT Presentation PowerPoint Templates. Create The Base For Thoughts To Grow. Do Away With Dogmatic Approaches. Establish The Value Of Reason With Our Business PowerPoint Templates.
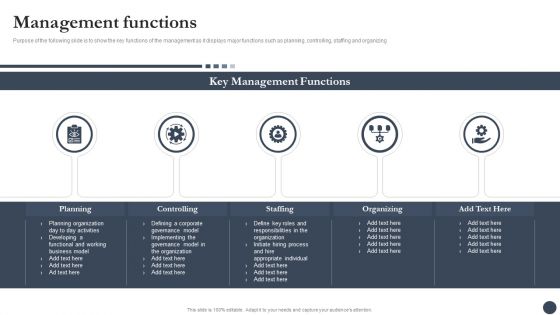
Strategic Playbook For Enterprise Administration Management Functions Themes PDF
This is a Strategic Playbook For Enterprise Administration Management Functions Themes PDF template with various stages. Focus and dispense information on three stages using this creative set, that comes with editable features. It contains large content boxes to add your information on topics like Magnifying Glass. You can also showcase facts, figures, and other relevant content using this PPT layout. Grab it now.
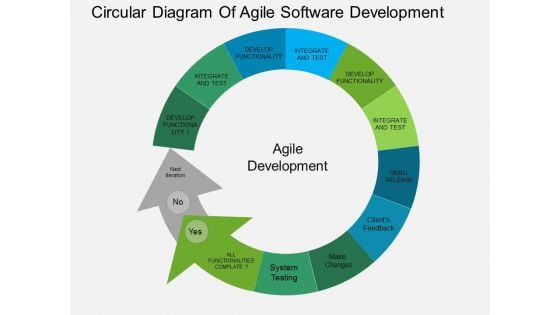
Circular Diagram Of Agile Software Development Powerpoint Templates
This PowerPoint template has been designed with circular diagram This diagram is a data visualization tool that gives you a simple way to present statistical information. This slide helps your audience examine and interpret the data you present.
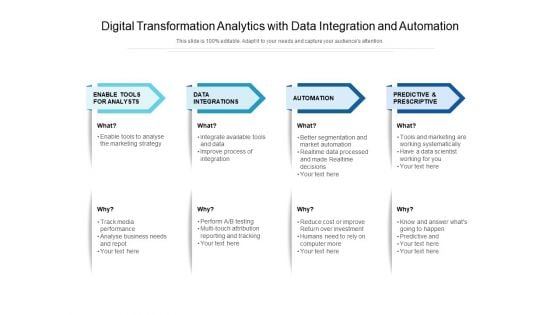
Digital Transformation Analytics With Data Integration And Automation Ppt PowerPoint Presentation File Diagrams PDF
Presenting this set of slides with name digital transformation analytics with data integration and automation ppt powerpoint presentation file diagrams pdf. This is a four stage process. The stages in this process are integrations, automation, prescriptive. This is a completely editable PowerPoint presentation and is available for immediate download. Download now and impress your audience.
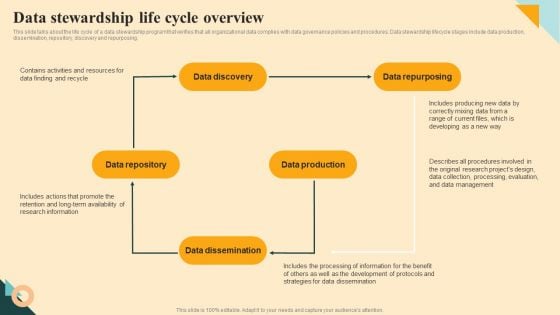
Data Stewardship Life Cycle Overview Demonstration PDF
This slide talks about the life cycle of a data stewardship program that verifies that all organizational data complies with data governance policies and procedures. Data stewardship lifecycle stages include data production, dissemination, repository, discovery and repurposing. If you are looking for a format to display your unique thoughts, then the professionally designed Data Stewardship Life Cycle Overview Demonstration PDF is the one for you. You can use it as a Google Slides template or a PowerPoint template. Incorporate impressive visuals, symbols, images, and other charts. Modify or reorganize the text boxes as you desire. Experiment with shade schemes and font pairings. Alter, share or cooperate with other people on your work. Download Data Stewardship Life Cycle Overview Demonstration PDF and find out how to give a successful presentation. Present a perfect display to your team and make your presentation unforgettable.
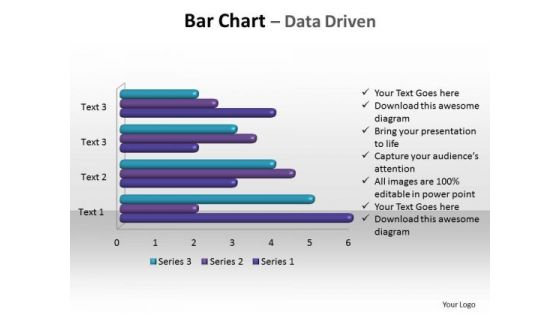
Business Sales PowerPoint Templates Business Bar Chart Data Driven Ppt Slides
Business Sales PowerPoint Templates Business bar chart data driven PPT Slides-This PowerPoint d Editable Data-Driven Chart is for visualizing your figures and data. Business Sales PowerPoint Templates Business bar chart data driven PPT Slides-This ppt can be used for concepts relating to-Chat, Illustration, data driven, figures, charts and Graphs. Set the audience alight with our Business Sales PowerPoint Templates Business Bar Chart Data Driven Ppt Slides. You will come up with a cracker of an idea.
Booting Brand Image By Tracking KPI Metrics Diagrams PDF
This slide consists of key performance indicators to be used by mangers to track the brand awareness . Key metrices covered are content reach, brand mention, blog shares, search volume data, repeat purchase and organic traffic. Showcasing this set of slides titled Booting Brand Image By Tracking KPI Metrics Diagrams PDF. The topics addressed in these templates are Content Reach, Brand Mentions, Blog Shares. All the content presented in this PPT design is completely editable. Download it and make adjustments in color, background, font etc. as per your unique business setting.

Employer Branding Equity Structure Key Phases Formats PDF
The following slide showcases employer branding framework with key phases that are audit and analysis, EVP strategy development, testing and approval, alignment, communication and management and metrics. Persuade your audience using this Employer Branding Equity Structure Key Phases Formats PDF. This PPT design covers five stages, thus making it a great tool to use. It also caters to a variety of topics including Audit And Analysis, Alignment And Communication, Management And Metrics. Download this PPT design now to present a convincing pitch that not only emphasizes the topic but also showcases your presentation skills.
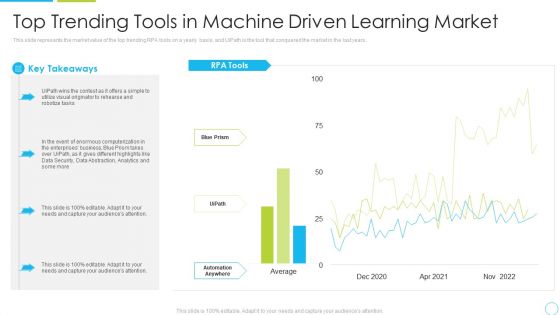
Top Trending Tools In Machine Driven Learning Market Ppt Pictures Example PDF
This slide represents the market value of the top trending RPA tools on a yearly basis, and UiPath is the tool that conquered the market in the last years. Deliver an awe inspiring pitch with this creative top trending tools in machine driven learning market ppt pictures example pdf bundle. Topics like analytics, enterprises, data security can be discussed with this completely editable template. It is available for immediate download depending on the needs and requirements of the user.
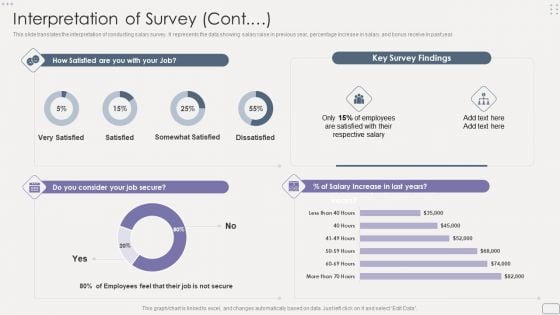
Income Assessment Report Interpretation Of Survey Contd Portrait PDF
This slide translates the interpretation of conducting salary survey. It represents the data showing salary raise in previous year, percentage increase in salary, and bonus receive in past year.Deliver and pitch your topic in the best possible manner with this Income Assessment Report Interpretation Of Survey Contd Portrait PDF. Use them to share invaluable insights on Increment Criteria, Projected Increment, Middle Management and impress your audience. This template can be altered and modified as per your expectations. So, grab it now.
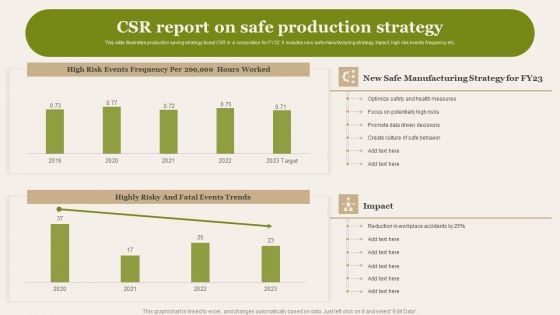
CSR Report On Safe Production Strategy Demonstration PDF
This slide illustrates production saving strategy boost CSR in a corporation for FY22. It includes new safe manufacturing strategy, impact, high risk events frequency etc. Showcasing this set of slides titled CSR Report On Safe Production Strategy Demonstration PDF. The topics addressed in these templates are Optimize Safety, Potentially High Risks, Promote Data Driven Decisions. All the content presented in this PPT design is completely editable. Download it and make adjustments in color, background, font etc. as per your unique business setting.
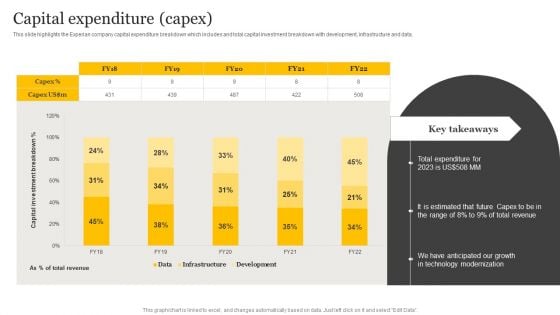
Customer Credit Reporting Company Outline Capital Expenditure Capex Designs PDF
This slide highlights the Experian company capital expenditure breakdown which includes and total capital investment breakdown with development, infrastructure and data. There are so many reasons you need a Customer Credit Reporting Company Outline Capital Expenditure Capex Designs PDF. The first reason is you cannot spend time making everything from scratch, Thus, Slidegeeks has made presentation templates for you too. You can easily download these templates from our website easily.
Product Repositioning KPI Monitoring And Tracking Ppt PowerPoint Presentation File Infographic Template PDF
This slide highlights the key performance indicator of product repositioning which includes product sales, product demand in the market, position in the market and social media channels growth rate. If you are looking for a format to display your unique thoughts, then the professionally designed Product Repositioning KPI Monitoring And Tracking Ppt PowerPoint Presentation File Infographic Template PDF is the one for you. You can use it as a Google Slides template or a PowerPoint template. Incorporate impressive visuals, symbols, images, and other charts. Modify or reorganize the text boxes as you desire. Experiment with shade schemes and font pairings. Alter, share or cooperate with other people on your work. Download Product Repositioning KPI Monitoring And Tracking Ppt PowerPoint Presentation File Infographic Template PDF and find out how to give a successful presentation. Present a perfect display to your team and make your presentation unforgettable.
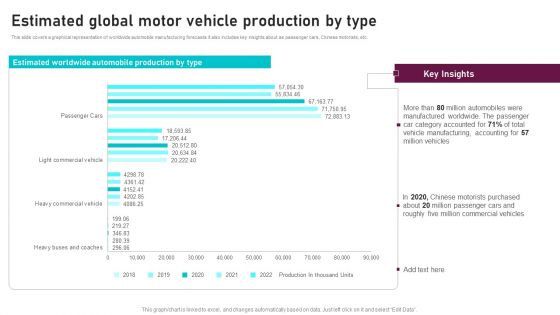
Estimated Global Motor Vehicle Production By Type Global Automotive Manufacturing Market Analysis Information PDF
This slide covers a graphical representation of worldwide automobile manufacturing forecasts. It also includes key insights about as passenger cars, Chinese motorists, etc. The Estimated Global Motor Vehicle Production By Type Global Automotive Manufacturing Market Analysis Information PDF is a compilation of the most recent design trends as a series of slides. It is suitable for any subject or industry presentation, containing attractive visuals and photo spots for businesses to clearly express their messages. This template contains a variety of slides for the user to input data, such as structures to contrast two elements, bullet points, and slides for written information. Slidegeeks is prepared to create an impression.
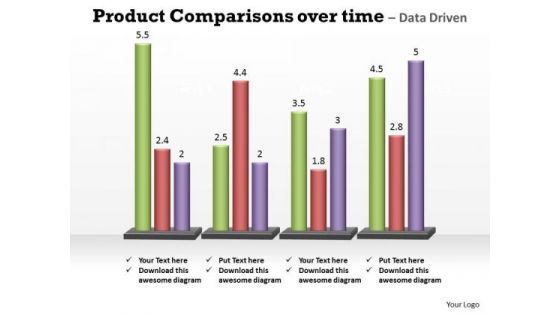
Business Marketing PowerPoint Templates Business Product Comparisons Over Time Ppt Slides
Business Marketing PowerPoint Templates Business product comparisons over time PPT Slides--This chart is useful for showing data changes over a period of time or for illustrating comparisons among items. -Business Marketing PowerPoint Templates Business product comparison over time PPT Slides-This ppt can be used for concepts relating to-chart,, graph, growth, investment, , market, percentage, , presentation report, results, statistics, stock, success and business. Continue growing with our Business Marketing PowerPoint Templates Business Product Comparisons Over Time Ppt Slides. Download without worries with our money back guaranteee.
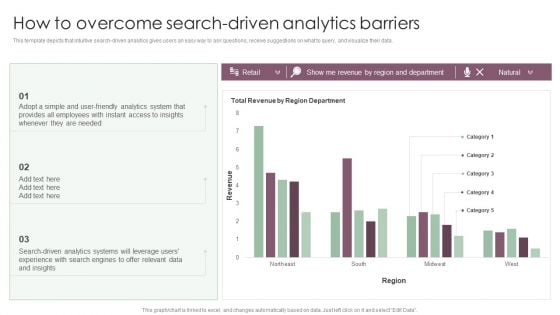
Information Analysis And BI Playbook How To Overcome Search Driven Analytics Barriers Formats PDF
This template depicts that intuitive search driven analytics gives users an easy way to ask questions, receive suggestions on what to query, and visualize their data. Coming up with a presentation necessitates that the majority of the effort goes into the content and the message you intend to convey. The visuals of a PowerPoint presentation can only be effective if it supplements and supports the story that is being told. Keeping this in mind our experts created Information Analysis And BI Playbook How To Overcome Search Driven Analytics Barriers Formats PDF to reduce the time that goes into designing the presentation. This way, you can concentrate on the message while our designers take care of providing you with the right template for the situation.
Data Analysis Planning Circle Ppt PowerPoint Presentation Complete Deck
Share a great deal of information on the topic by deploying this data analysis planning circle ppt powerpoint presentation complete deck. Support your ideas and thought process with this prefabricated set. It includes a set of sixteen slides, all fully modifiable and editable. Each slide can be restructured and induced with the information and content of your choice. You can add or remove large content boxes as well, to make this PPT slideshow more personalized. Its high-quality graphics and visuals help in presenting a well-coordinated pitch. This PPT template is also a resourceful tool to take visual cues from and implement the best ideas to help your business grow and expand. The main attraction of this well-formulated deck is that everything is editable, giving you the freedom to adjust it to your liking and choice. Changes can be made in the background and theme as well to deliver an outstanding pitch. Therefore, click on the download button now to gain full access to this multifunctional set.
Data Analysis Plan Business Circles Ppt PowerPoint Presentation Complete Deck
Share a great deal of information on the topic by deploying this data analysis plan business circles ppt powerpoint presentation complete deck. Support your ideas and thought process with this prefabricated set. It includes a set of twelve slides, all fully modifiable and editable. Each slide can be restructured and induced with the information and content of your choice. You can add or remove large content boxes as well, to make this PPT slideshow more personalized. Its high-quality graphics and visuals help in presenting a well-coordinated pitch. This PPT template is also a resourceful tool to take visual cues from and implement the best ideas to help your business grow and expand. The main attraction of this well-formulated deck is that everything is editable, giving you the freedom to adjust it to your liking and choice. Changes can be made in the background and theme as well to deliver an outstanding pitch. Therefore, click on the download button now to gain full access to this multifunctional set.
Inward And Outward Data Analysis Ppt PowerPoint Presentation Complete Deck
Share a great deal of information on the topic by deploying this inward and outward data analysis ppt powerpoint presentation complete deck. Support your ideas and thought process with this prefabricated set. It includes a set of twelve slides, all fully modifiable and editable. Each slide can be restructured and induced with the information and content of your choice. You can add or remove large content boxes as well, to make this PPT slideshow more personalized. Its high-quality graphics and visuals help in presenting a well-coordinated pitch. This PPT template is also a resourceful tool to take visual cues from and implement the best ideas to help your business grow and expand. The main attraction of this well-formulated deck is that everything is editable, giving you the freedom to adjust it to your liking and choice. Changes can be made in the background and theme as well to deliver an outstanding pitch. Therefore, click on the download button now to gain full access to this multifunctional set.
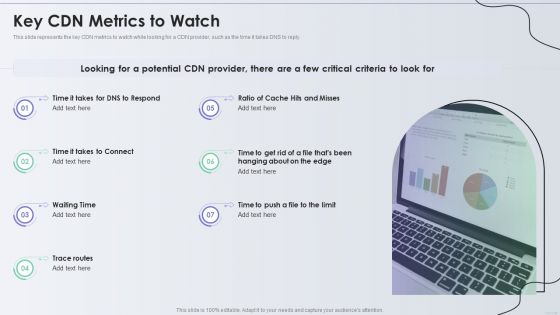
Distribution Network Key CDN Metrics To Watch Themes PDF
This slide represents the key CDN metrics to watch while looking for a CDN provider, such as the time it takes DNS to reply. Presenting Distribution Network Key CDN Metrics To Watch Themes PDF to provide visual cues and insights. Share and navigate important information on seven stages that need your due attention. This template can be used to pitch topics like Key Cdn Metrics, Potential. In addtion, this PPT design contains high resolution images, graphics, etc, that are easily editable and available for immediate download.
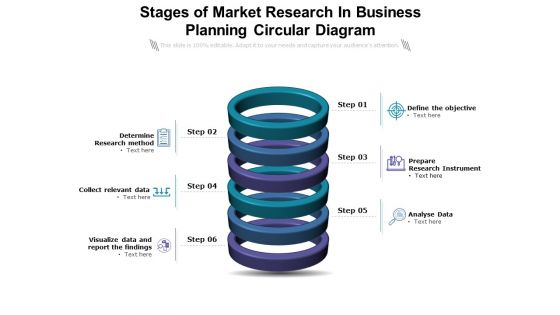
Stages Of Market Research In Business Planning Circular Diagram Ppt PowerPoint Presentation Styles Gridlines PDF
Presenting this set of slides with name stages of market research in business planning circular diagram ppt powerpoint presentation styles gridlines pdf. This is a six stage process. The stages in this process are determine research method, collect relevant data, visualize data and report the findings, define the objective, prepare research instrument, analyse data. This is a completely editable PowerPoint presentation and is available for immediate download. Download now and impress your audience.
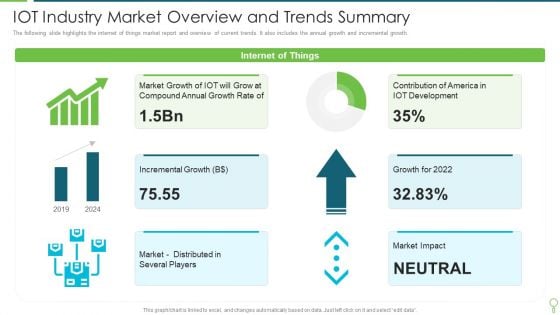
IOT Industry Market Overview And Trends Summary Brochure PDF
The following slide highlights the internet of things market report and overview of current trends. It also includes the annual growth and incremental growth. Showcasing this set of slides titled IOT Industry Market Overview And Trends Summary Brochure PDF. The topics addressed in these templates are Growth, Market, Development. All the content presented in this PPT design is completely editable. Download it and make adjustments in color, background, font etc. as per your unique business setting.
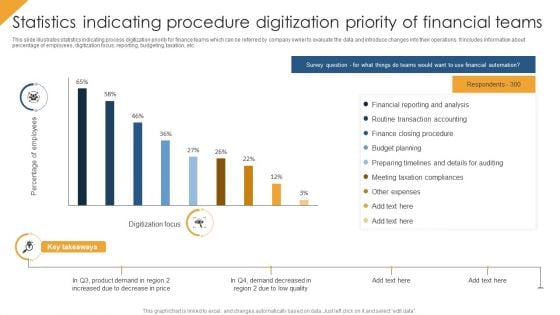
Statistics Indicating Procedure Digitization Priority Of Financial Teams Themes PDF
This slide illustrates statistics indicating process digitization priority for finance teams which can be referred by company owner to evaluate the data and introduce changes into their operations. It includes information about percentage of employees, digitization focus, reporting, budgeting, taxation, etc. Showcasing this set of slides titled Statistics Indicating Procedure Digitization Priority Of Financial Teams Themes PDF. The topics addressed in these templates are Budget Planning, Financial Reporting And Analysis, Other Expenses. All the content presented in this PPT design is completely editable. Download it and make adjustments in color, background, font etc. as per your unique business setting.
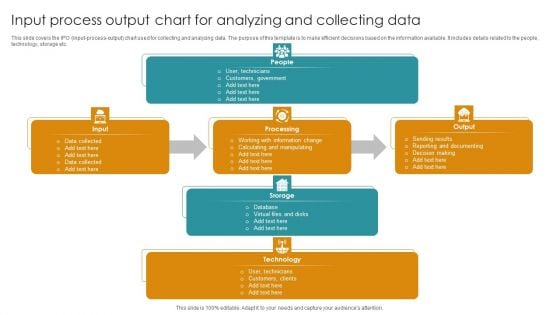
Input Process Output Chart For Analyzing And Collecting Data Download PDF
This slide covers the IPO input-process-output chart used for collecting and analyzing data. The purpose of this template is to make efficient decisions based on the information available. It includes details related to the people, technology, storage etc. Showcasing this set of slides titled Input Process Output Chart For Analyzing And Collecting Data Download PDF. The topics addressed in these templates are People, Storage, Technology. All the content presented in this PPT design is completely editable. Download it and make adjustments in color, background, font etc. as per your unique business setting.
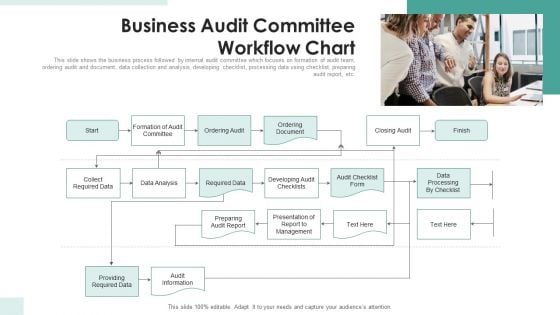
Business Audit Committee Workflow Chart Ppt PowerPoint Presentation Gallery Graphics Example PDF
This slide shows the business process followed by internal audit committee which focuses on formation of audit team, ordering audit and document, data collection and analysis, developing checklist, processing data using checklist, preparing audit report, etc. Persuade your audience using this business audit committee workflow chart ppt powerpoint presentation gallery graphics example pdf. This PPT design covers one stages, thus making it a great tool to use. It also caters to a variety of topics including data analysis, management, data processing. Download this PPT design now to present a convincing pitch that not only emphasizes the topic but also showcases your presentation skills.

Scorecard Table With Kpi PowerPoint Presentation Template
Brace Yourself, Arm Your Thoughts. Prepare For The Hustle With Our Scorecard Table With KPI PowerPoint Presentation Template Powerpoint Templates. Generate Ecstasy With Our Marketing Plan Powerpoint Templates. Your Thoughts Will Delight Your Audience.
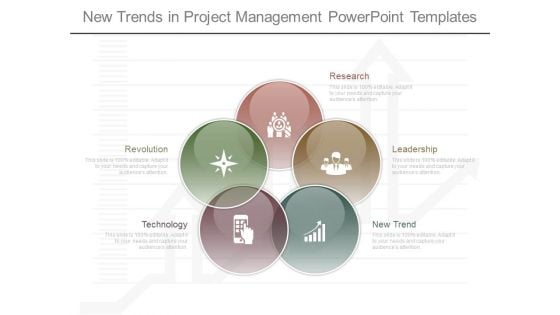
New Trends In Project Management Powerpoint Templates
This is a new trends in project management powerpoint templates. This is a five stage process. The stages in this process are research, leadership, new trend, technology, revolution.
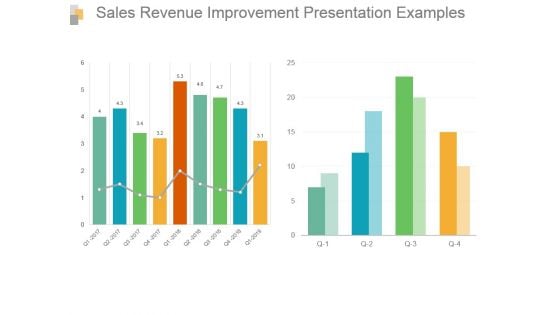
Sales Revenue Improvement Presentation Examples
This is a sales revenue improvement presentation examples. This is a two stage process. The stages in this process are bar graph, growth, sales, data, analysis.
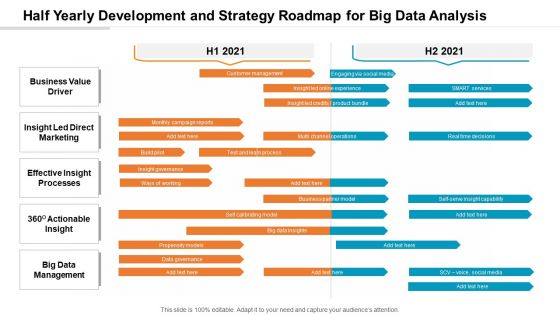
Half Yearly Development And Strategy Roadmap For Big Data Analysis Ideas
Presenting our innovatively-structured half yearly development and strategy roadmap for big data analysis ideas Template. Showcase your roadmap process in different formats like PDF, PNG, and JPG by clicking the download button below. This PPT design is available in both Standard Screen and Widescreen aspect ratios. It can also be easily personalized and presented with modified font size, font type, color, and shapes to measure your progress in a clear way.
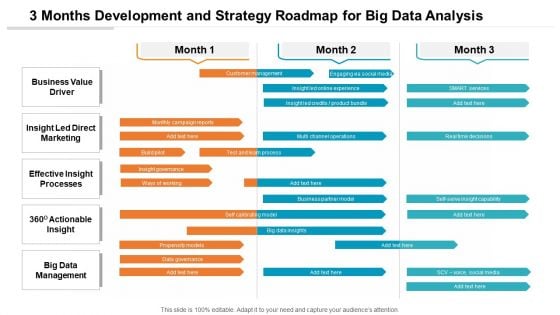
3 Months Development And Strategy Roadmap For Big Data Analysis Background
Presenting our innovatively-structured 3 months development and strategy roadmap for big data analysis background Template. Showcase your roadmap process in different formats like PDF, PNG, and JPG by clicking the download button below. This PPT design is available in both Standard Screen and Widescreen aspect ratios. It can also be easily personalized and presented with modified font size, font type, color, and shapes to measure your progress in a clear way.
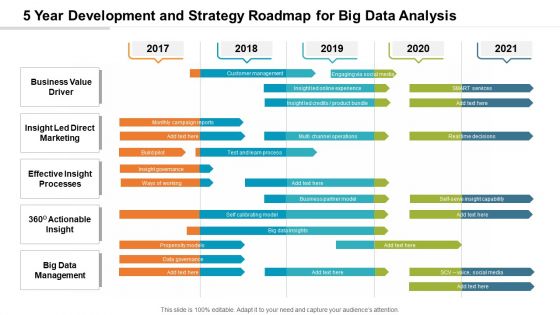
5 Year Development And Strategy Roadmap For Big Data Analysis Elements
Presenting our innovatively-structured 5 year development and strategy roadmap for big data analysis elements Template. Showcase your roadmap process in different formats like PDF, PNG, and JPG by clicking the download button below. This PPT design is available in both Standard Screen and Widescreen aspect ratios. It can also be easily personalized and presented with modified font size, font type, color, and shapes to measure your progress in a clear way.
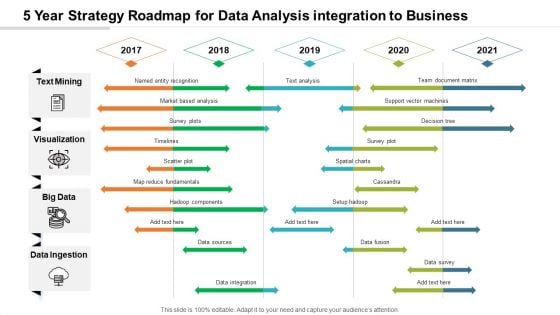
5 Year Strategy Roadmap For Data Analysis Integration To Business Pictures
Introducing our 5 year strategy roadmap for data analysis integration to business pictures. This PPT presentation is Google Slides compatible, therefore, you can share it easily with the collaborators for measuring the progress. Also, the presentation is available in both standard screen and widescreen aspect ratios. So edit the template design by modifying the font size, font type, color, and shapes as per your requirements. As this PPT design is fully editable it can be presented in PDF, JPG and PNG formats.
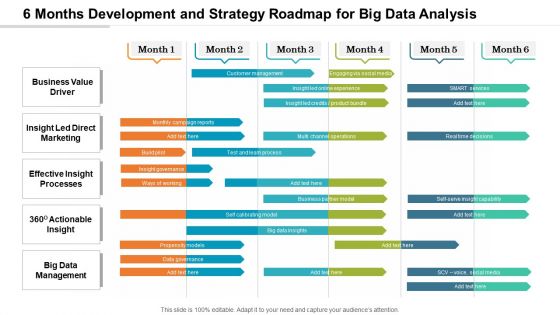
6 Months Development And Strategy Roadmap For Big Data Analysis Graphics
Presenting our innovatively-structured 6 months development and strategy roadmap for big data analysis graphics Template. Showcase your roadmap process in different formats like PDF, PNG, and JPG by clicking the download button below. This PPT design is available in both Standard Screen and Widescreen aspect ratios. It can also be easily personalized and presented with modified font size, font type, color, and shapes to measure your progress in a clear way.
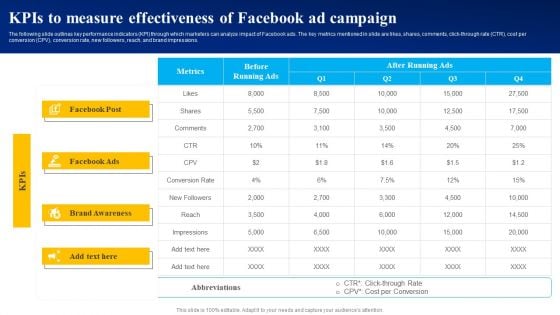
Kpis To Measure Effectiveness Of Facebook Ad Campaign Ppt PowerPoint Presentation File Diagrams PDF
The following slide outlines key performance indicators KPI through which marketers can analyze impact of Facebook ads. The key metrics mentioned in slide are likes, shares, comments, click-through rate CTR, cost per conversion CPV, conversion rate, new followers, reach, and brand impressions. Do you have to make sure that everyone on your team knows about any specific topic I yes, then you should give Kpis To Measure Effectiveness Of Facebook Ad Campaign Ppt PowerPoint Presentation File Diagrams PDF a try. Our experts have put a lot of knowledge and effort into creating this impeccable Kpis To Measure Effectiveness Of Facebook Ad Campaign Ppt PowerPoint Presentation File Diagrams PDF. You can use this template for your upcoming presentations, as the slides are perfect to represent even the tiniest detail. You can download these templates from the Slidegeeks website and these are easy to edit. So grab these today.
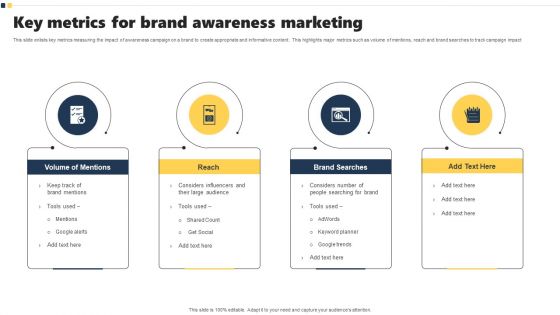
Key Metrics For Brand Awareness Marketing Diagrams PDF
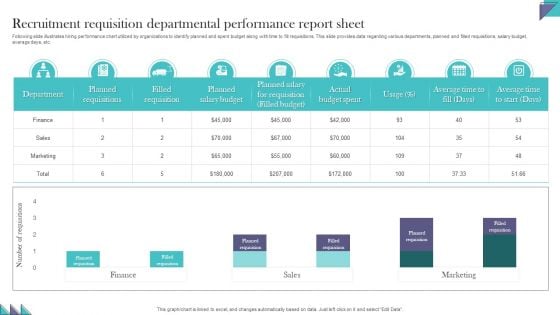
Recruitment Requisition Departmental Performance Report Sheet Demonstration PDF
Following slide illustrates hiring performance chart utilized by organizations to identify planned and spent budget along with time to fill requisitions. This slide provides data regarding various departments, planned and filled requisitions, salary budget, average days, etc. Pitch your topic with ease and precision using this Recruitment Requisition Departmental Performance Report Sheet Demonstration PDF. This layout presents information on Recruitment Requisition, Departmental Performance, Report Sheet. It is also available for immediate download and adjustment. So, changes can be made in the color, design, graphics or any other component to create a unique layout.
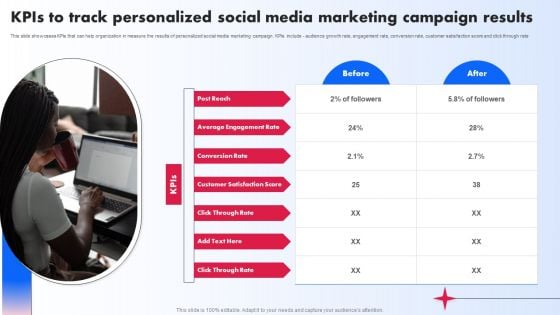
Kpis To Track Personalized Social Media Marketing Campaign Results Ppt PowerPoint Presentation Diagram Images PDF
This slide showcases KPIs that can help organization in measure the results of personalized social media marketing campaign. KPIs include audience growth rate, engagement rate, conversion rate, customer satisfaction score and click through rate. The Kpis To Track Personalized Social Media Marketing Campaign Results Ppt PowerPoint Presentation Diagram Images PDF is a compilation of the most recent design trends as a series of slides. It is suitable for any subject or industry presentation, containing attractive visuals and photo spots for businesses to clearly express their messages. This template contains a variety of slides for the user to input data, such as structures to contrast two elements, bullet points, and slides for written information. Slidegeeks is prepared to create an impression.
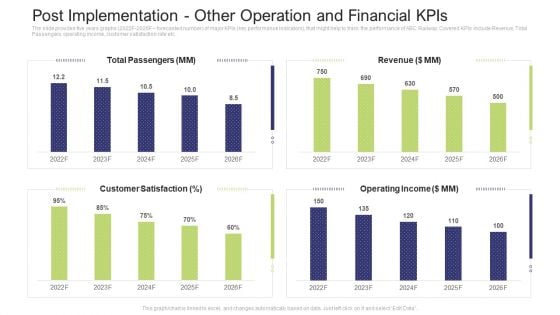
Post Implementation Other Operation And Financial Kpis Summary PDF
The slide provides five years graphs 2022F to 2026F forecasted number of major KPIs key performance indicators, that might help to track the performance of ABC Railway. Covered KPIs include Revenue, Total Passengers, operating income, customer satisfaction rate etc.Deliver and pitch your topic in the best possible manner with this post implementation other operation and financial KPIs summary pdf. Use them to share invaluable insights on total passengers, operating income, revenue, 2022 to 2026 and impress your audience. This template can be altered and modified as per your expectations. So, grab it now.
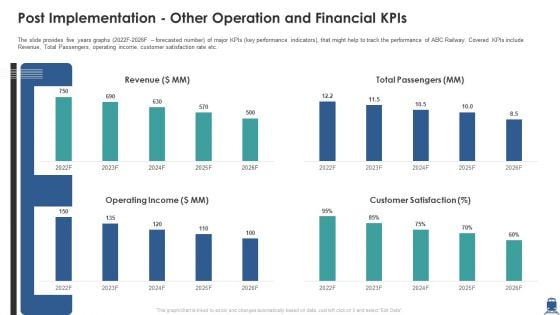
Post Implementation Other Operation And Financial Kpis Inspiration PDF
The slide provides five years graphs 2022F-2026F forecasted number of major KPIs key performance indicators, that might help to track the performance of ABC Railway. Covered KPIs include Revenue, Total Passengers, operating income, customer satisfaction rate etc. Deliver and pitch your topic in the best possible manner with this post implementation other operation and financial kpis inspiration pdf. Use them to share invaluable insights on revenue, operating income, customer satisfaction and impress your audience. This template can be altered and modified as per your expectations. So, grab it now.
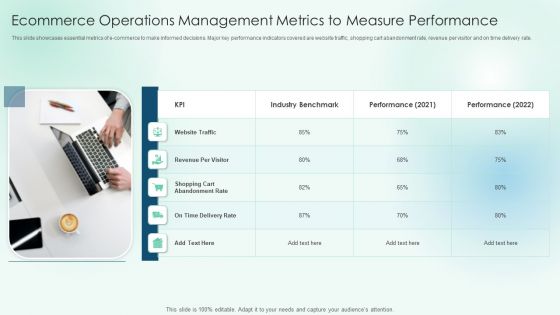
Ecommerce Operations Management Metrics To Measure Performance Professional PDF
This slide showcases essential metrics of e-commerce to make informed decisions. Major key performance indicators covered are website traffic, shopping cart abandonment rate, revenue per visitor and on time delivery rate. Presenting Ecommerce Operations Management Metrics To Measure Performance Professional PDF to dispense important information. This template comprises one stage. It also presents valuable insights into the topics including Abandonment Rate, Industry Benchmark, Performance. This is a completely customizable PowerPoint theme that can be put to use immediately. So, download it and address the topic impactfully.
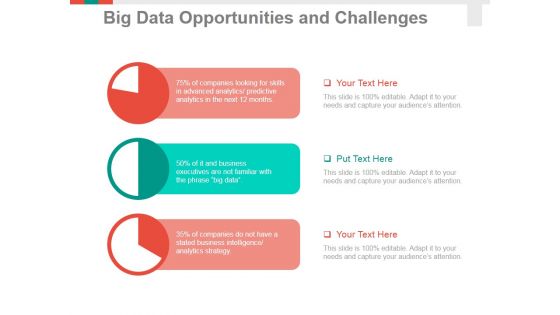
Big Data Opportunities And Challenges Template 1 Ppt PowerPoint Presentation Infographic Template Summary
This is a big data opportunities and challenges template 1 ppt powerpoint presentation infographic template summary. This is a three stage process. The stages in this process are business, pie chart, finance, marketing, analysis, strategy.
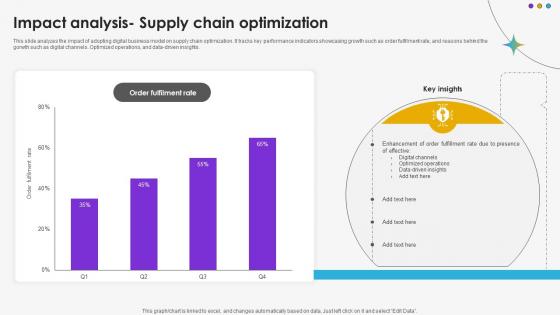
Impact Analysis Supply Chain Optimization DT SS V
This slide analyzes the impact of adopting digital business model on supply chain optimization. It tracks key performance indicators showcasing growth such as order fulfilment rate, and reasons behind the gorwth such as digital channels. Optimized operations, and data-driven insights.Whether you have daily or monthly meetings, a brilliant presentation is necessary. Impact Analysis Supply Chain Optimization DT SS V can be your best option for delivering a presentation. Represent everything in detail using Impact Analysis Supply Chain Optimization DT SS V and make yourself stand out in meetings. The template is versatile and follows a structure that will cater to your requirements. All the templates prepared by Slidegeeks are easy to download and edit. Our research experts have taken care of the corporate themes as well. So, give it a try and see the results. This slide analyzes the impact of adopting digital business model on supply chain optimization. It tracks key performance indicators showcasing growth such as order fulfilment rate, and reasons behind the gorwth such as digital channels. Optimized operations, and data-driven insights.
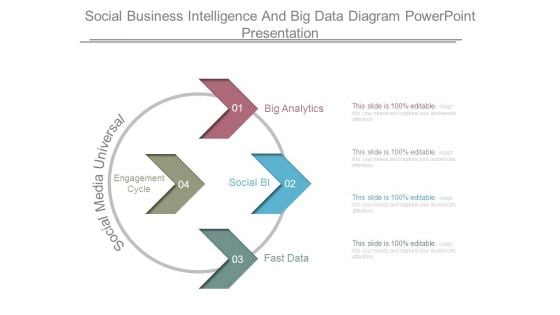
Social Business Intelligence And Big Data Diagram Powerpoint Presentation
This is a social business intelligence and big data diagram powerpoint presentation. This is a four stage process. The stages in this process are big analytics, social bi, fast data, social media universal, engagement cycle.

 Home
Home