Dashboard Icon
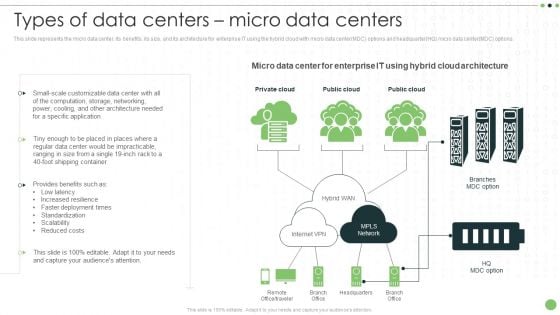
Different Categories Of Data Centers Types Of Data Centers Micro Data Centers Inspiration PDF
This slide represents the micro data center, its benefits, its size, and its architecture for enterprise IT using the hybrid cloud with micro data center MDC options and headquarter HQ micro data center MDC options. Are you searching for a Different Categories Of Data Centers Types Of Data Centers Micro Data Centers Inspiration PDF that is uncluttered, straightforward, and original Its easy to edit, and you can change the colors to suit your personal or business branding. For a presentation that expresses how much effort youve put in, this template is ideal With all of its features, including tables, diagrams, statistics, and lists, its perfect for a business plan presentation. Make your ideas more appealing with these professional slides. Download Different Categories Of Data Centers Types Of Data Centers Micro Data Centers Inspiration PDF from Slidegeeks today.
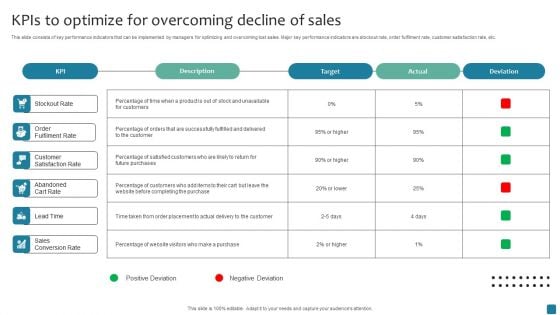
Kpis To Optimize For Overcoming Decline Of Sales Mockup PDF
This slide consists of key performance indicators that can be implemented by managers for optimizing and overcoming lost sales. Major key performance indicators are stockout rate, order fulfilment rate, customer satisfaction rate, etc. Showcasing this set of slides titled Kpis To Optimize For Overcoming Decline Of Sales Mockup PDF. The topics addressed in these templates are Target, Actual, Deviation. All the content presented in this PPT design is completely editable. Download it and make adjustments in color, background, font etc. as per your unique business setting.
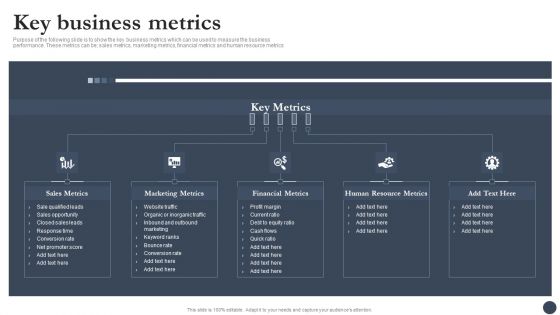
Strategic Playbook For Enterprise Administration Key Business Metrics Diagrams PDF
Purpose of the following slide is to show the key business metrics which can be used to measure the business performance. These metrics can be sales metrics, marketing metrics, financial metrics and human resource metrics. This is a Strategic Playbook For Enterprise Administration Key Business Metrics Diagrams PDF template with various stages. Focus and dispense information on five stages using this creative set, that comes with editable features. It contains large content boxes to add your information on topics like Marketing Metrics, Financial Metrics, Human Resource Metrics. You can also showcase facts, figures, and other relevant content using this PPT layout. Grab it now.
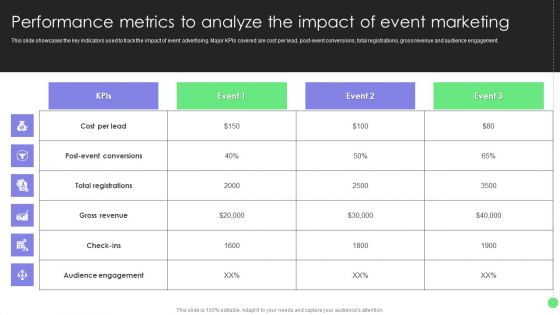
Comprehensive Guide For Launch Performance Metrics To Analyze The Impact Of Event Diagrams PDF
This slide showcases the key indicators used to track the impact of event advertising. Major KPIs covered are cost per lead, post-event conversions, total registrations, gross revenue and audience engagement. Welcome to our selection of the Comprehensive Guide For Launch Performance Metrics To Analyze The Impact Of Event Diagrams PDF. These are designed to help you showcase your creativity and bring your sphere to life. Planning and Innovation are essential for any business that is just starting out. This collection contains the designs that you need for your everyday presentations. All of our PowerPoints are 100 percent editable, so you can customize them to suit your needs. This multi-purpose template can be used in various situations. Grab these presentation templates today.
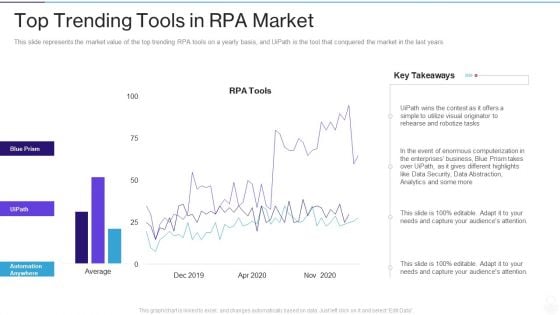
RPA IT Top Trending Tools In RPA Market Ppt Slides Show PDF
This slide represents the market value of the top trending RPA tools on a yearly basis, and UiPath is the tool that conquered the market in the last years. Deliver an awe inspiring pitch with this creative rpa it top trending tools in rpa market ppt slides show pdf bundle. Topics like data security, analytics, business, data abstraction, utilize visual can be discussed with this completely editable template. It is available for immediate download depending on the needs and requirements of the user.

Impact Of Marketing On Patient Conversion Rate Implementation Of Online Ppt Sample
This slide illustrates the positive impact of marketing strategies on the hospitals conversion rate. It includes a conversion report for 5 years 2019 2023 highlighting the increase in the rate The Impact Of Marketing On Patient Conversion Rate Implementation Of Online Ppt Sample is a compilation of the most recent design trends as a series of slides. It is suitable for any subject or industry presentation, containing attractive visuals and photo spots for businesses to clearly express their messages. This template contains a variety of slides for the user to input data, such as structures to contrast two elements, bullet points, and slides for written information. Slidegeeks is prepared to create an impression. This slide illustrates the positive impact of marketing strategies on the hospitals conversion rate. It includes a conversion report for 5 years 2019 2023 highlighting the increase in the rate
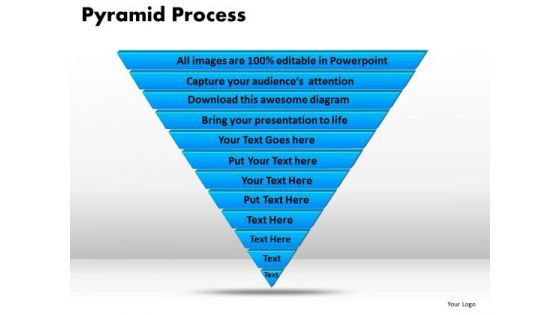
PowerPoint Slides Pyramid Process Chart Ppt Theme
PowerPoint Slides pyramid Process Chart PPT Theme-This Pyramid Diagram may be defined as representation of data in the form of a triangle separated by horizontal lines. The widest section may contain the general topic while the narrowest section may contain a much more specific topic-business, chart, color, concept, conceptual, construction, corporate, creating, data, design, diagram, direction, focus, graph, group, growth, hierarchy, illustration, information, isolated, layer, layered, level, manage, management, model, object, organization, performance, population, presentation, principal, process, progress, pyramid, rank, resource, shape, stage, structure, support, symbol, top, triangle, vector-PowerPoint Slides pyramid Process Chart PPT Theme Our PowerPoint Slides Pyramid Process Chart Ppt Theme have a enabling effect. They allow youto act as per your choice.
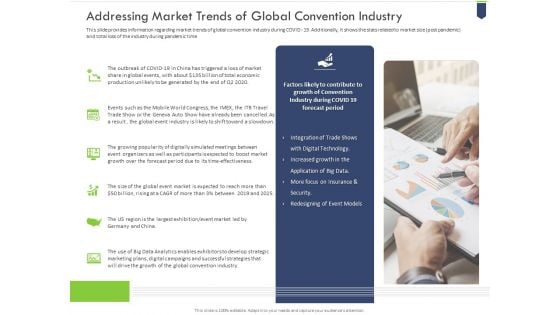
Addressing Market Trends Of Global Convention Industry Themes PDF
This slide provides information regarding market trends of global convention industry during COVID - 19. Additionally, it shows the stats related to market size post pandemie and total loss of the industry during pandemic time Presenting addressing market trends of global convention industry themes pdf to provide visual cues and insights. Share and navigate important information on six stages that need your due attention. This template can be used to pitch topics like redesigning of event models, application of big data, integration of trade shows. In addtion, this PPT design contains high resolution images, graphics, etc, that are easily editable and available for immediate download.
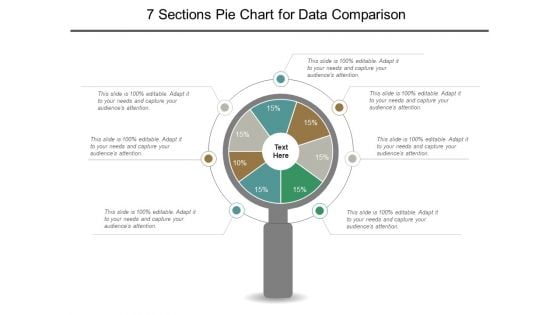
7 Sections Pie Chart For Data Comparison Ppt PowerPoint Presentation File Graphics Template
This is a 7 sections pie chart for data comparison ppt powerpoint presentation file graphics template. This is a seven stage process. The stages in this process are 6 piece pie chart, 6 segment pie chart, 6 parts pie chart.
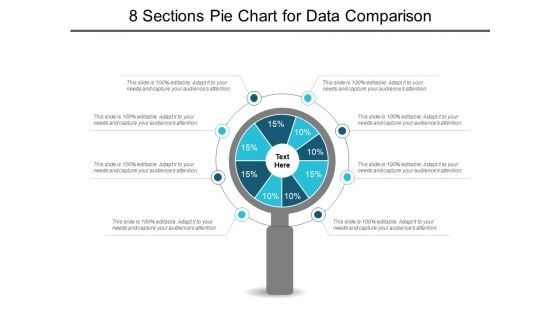
8 Sections Pie Chart For Data Comparison Ppt PowerPoint Presentation Show Slideshow
This is a 8 sections pie chart for data comparison ppt powerpoint presentation show slideshow. This is a eight stage process. The stages in this process are 6 piece pie chart, 6 segment pie chart, 6 parts pie chart.
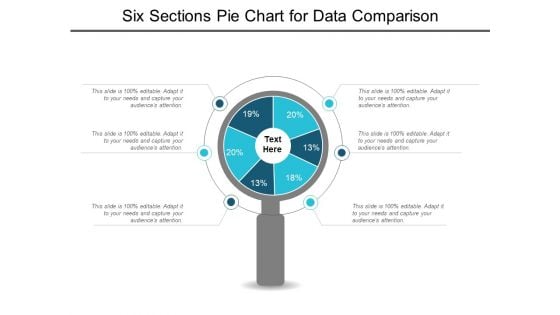
Six Sections Pie Chart For Data Comparison Ppt PowerPoint Presentation Styles Graphics Example
This is a six sections pie chart for data comparison ppt powerpoint presentation styles graphics example. This is a six stage process. The stages in this process are 6 piece pie chart, 6 segment pie chart, 6 parts pie chart.
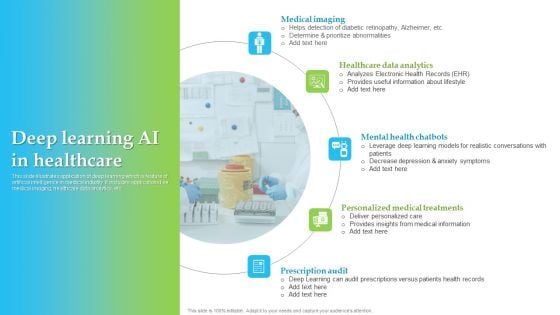
Deep Learning AI In Healthcare Themes PDF
This slide illustrates application of deep learning which is feature of artificial intelligence in medical industry. It includes applications like medical imaging, healthcare data analytics, etc. Pitch your topic with ease and precision using this Deep Learning AI In Healthcare Themes PDF. This layout presents information on Medical Imaging, Healthcare Data Analytics, Mental Health Chatbots. It is also available for immediate download and adjustment. So, changes can be made in the color, design, graphics or any other component to create a unique layout.
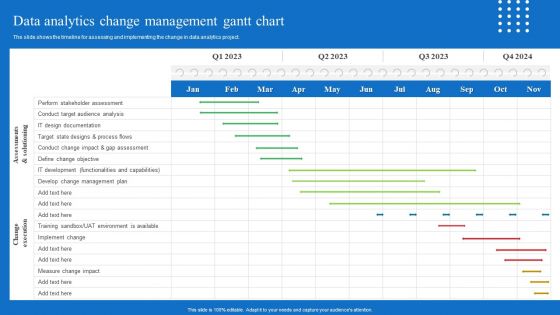
Toolkit For Data Science And Analytics Transition Data Analytics Change Management Gantt Chart Portrait PDF
The slide shows the timeline for assessing and implementing the change in data analytics project. Get a simple yet stunning designed Toolkit For Data Science And Analytics Transition Data Analytics Change Management Gantt Chart Portrait PDF It is the best one to establish the tone in your meetings. It is an excellent way to make your presentations highly effective. So, download this PPT today from Slidegeeks and see the positive impacts. Our easy to edit Toolkit For Data Science And Analytics Transition Data Analytics Change Management Gantt Chart Portrait PDF can be your go to option for all upcoming conferences and meetings. So, what are you waiting for Grab this template today.
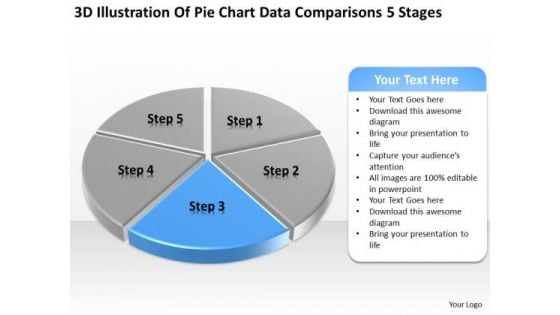
Pie Chart Data Comparisons 5 Stages Business Plan Templates PowerPoint Slides
We present our pie chart data comparisons 5 stages business plan templates PowerPoint Slides.Present our Marketing PowerPoint Templates because Our PowerPoint Templates and Slides are Clear and concise. Use them and dispel any doubts your team may have. Present our Finance PowerPoint Templates because You can Create a matrix with our PowerPoint Templates and Slides. Feel the strength of your ideas click into place. Download our Business PowerPoint Templates because You can Inspire your team with our PowerPoint Templates and Slides. Let the force of your ideas flow into their minds. Present our Sales PowerPoint Templates because Our PowerPoint Templates and Slides are aesthetically designed to attract attention. We gaurantee that they will grab all the eyeballs you need. Present our Success PowerPoint Templates because Our PowerPoint Templates and Slides are specially created by a professional team with vast experience. They diligently strive to come up with the right vehicle for your brilliant Ideas. Use these PowerPoint slides for presentations relating to Analysis, Analyzing, Brands, Business, Chart, Colorful, Commerce, Compare, Comparison, Data, Economical, Finance, Financial, Grow, Growth, Market, Market Share, Marketing, Measure, Pen, Pie, Pie Chart, Presentation, Profit, Revenue, Sales, Sales Chat, Sales Increase, Share, Statistical, Success, Successful. The prominent colors used in the PowerPoint template are Blue, Gray, White. Start a company with our Pie Chart Data Comparisons 5 Stages Business Plan Templates PowerPoint Slides. Just download, type and present.
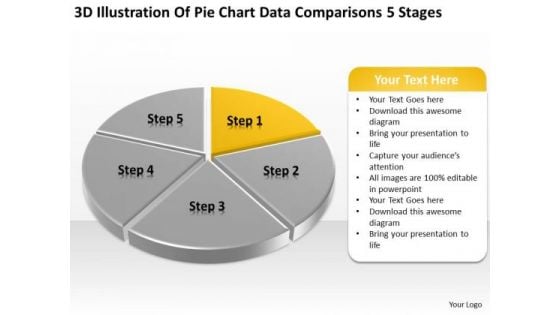
Pie Chart Data Comparisons 5 Stages Examples Small Business Plans PowerPoint Slides
We present our pie chart data comparisons 5 stages examples small business plans PowerPoint Slides.Download our Marketing PowerPoint Templates because you can Set pulses racing with our PowerPoint Templates and Slides. They will raise the expectations of your team. Present our Finance PowerPoint Templates because Our PowerPoint Templates and Slides are the chords of your song. String them along and provide the lilt to your views. Download and present our Business PowerPoint Templates because It will Raise the bar of your Thoughts. They are programmed to take you to the next level. Download our Sales PowerPoint Templates because Our PowerPoint Templates and Slides will fulfill your every need. Use them and effectively satisfy the desires of your audience. Present our Success PowerPoint Templates because You can Be the puppeteer with our PowerPoint Templates and Slides as your strings. Lead your team through the steps of your script.Use these PowerPoint slides for presentations relating to Analysis, Analyzing, Brands, Business, Chart, Colorful, Commerce, Compare, Comparison, Data, Economical, Finance, Financial, Grow, Growth, Market, Market Share, Marketing, Measure, Pen, Pie, Pie Chart, Presentation, Profit, Revenue, Sales, Sales Chat, Sales Increase, Share, Statistical, Success, Successful. The prominent colors used in the PowerPoint template are Yellow, Gray, White. Ambiguity can be exasperating. Give definite answers with our Pie Chart Data Comparisons 5 Stages Examples Small Business Plans PowerPoint Slides.
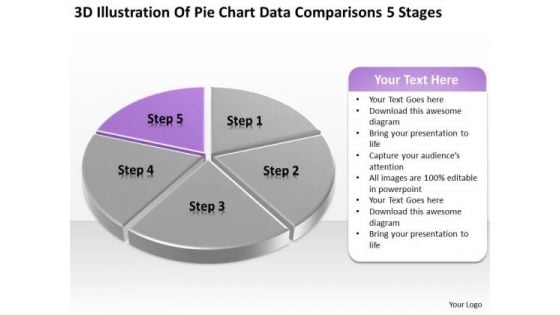
Pie Chart Data Comparisons 5 Stages Ppt Designing Business Plan PowerPoint Templates
We present our pie chart data comparisons 5 stages ppt designing business plan PowerPoint templates.Use our Marketing PowerPoint Templates because Our PowerPoint Templates and Slides are innately eco-friendly. Their high recall value negate the need for paper handouts. Download our Finance PowerPoint Templates because Our PowerPoint Templates and Slides are truly out of this world. Even the MIB duo has been keeping tabs on our team. Use our Business PowerPoint Templates because You should Bet on your luck with our PowerPoint Templates and Slides. Be assured that you will hit the jackpot. Present our Sales PowerPoint Templates because Our PowerPoint Templates and Slides are created with admirable insight. Use them and give your group a sense of your logical mind. Present our Success PowerPoint Templates because Our PowerPoint Templates and Slides are focused like a searchlight beam. They highlight your ideas for your target audience.Use these PowerPoint slides for presentations relating to Analysis, Analyzing, Brands, Business, Chart, Colorful, Commerce, Compare, Comparison, Data, Economical, Finance, Financial, Grow, Growth, Market, Market Share, Marketing, Measure, Pen, Pie, Pie Chart, Presentation, Profit, Revenue, Sales, Sales Chat, Sales Increase, Share, Statistical, Success, Successful. The prominent colors used in the PowerPoint template are Purple, Gray, White. Make instructive presentations with our Pie Chart Data Comparisons 5 Stages Ppt Designing Business Plan PowerPoint Templates. Dont waste time struggling with PowerPoint. Let us do it for you.

Market Trends Selling Template Powerpoint Themes
This is a market trends selling template powerpoint themes. This is a five stage process. The stages in this process are customer acquisition, customer win back, customer development, fix it improve it make changes, sell the improved product.
Data Reference Diagram Ppt PowerPoint Presentation Complete Deck With Slides
Boost your confidence and team morale with this well structured Data Reference Diagram Ppt PowerPoint Presentation Complete Deck With Slides. This prefabricated set gives a voice to your presentation because of its well researched content and graphics. Our experts have added all the components very carefully, thus helping you deliver great presentations with a single click. Not only that, it contains a set of Twelve slides that are designed using the right visuals, graphics, etc. Various topics can be discussed, and effective brainstorming sessions can be conducted using the wide variety of slides added in this complete deck. Apart from this, our PPT design contains clear instructions to help you restructure your presentations and create multiple variations. The color, format, design anything can be modified as deemed fit by the user. Not only this, it is available for immediate download. So, grab it now.

Global Cubesat Market Analysis Report IoT In Orbit Unleashing The Power IoT SS V
This slide showcases information about the global market size of miniature satellites also known as CubeSat. It showcases global market size, types of CubeSat market share by size, and the largest growing geographic area. From laying roadmaps to briefing everything in detail, our templates are perfect for you. You can set the stage with your presentation slides. All you have to do is download these easy-to-edit and customizable templates. Global Cubesat Market Analysis Report IoT In Orbit Unleashing The Power IoT SS V will help you deliver an outstanding performance that everyone would remember and praise you for. Do download this presentation today. This slide showcases information about the global market size of miniature satellites also known as CubeSat. It showcases global market size, types of CubeSat market share by size, and the largest growing geographic area.
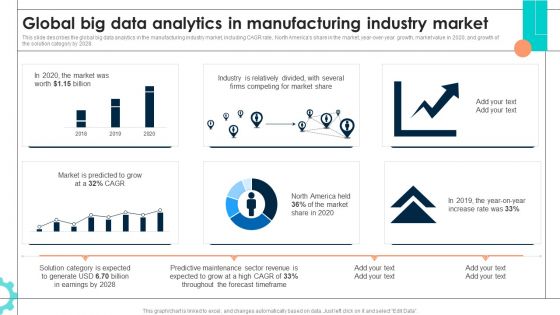
Intelligent Manufacturing Global Big Data Analytics In Manufacturing Industry Market Structure PDF
This slide describes the global big data analytics in the manufacturing industry market, including CAGR rate, North Americas share in the market, year-over-year growth, market value in 2020, and growth of the solution category by 2028. Formulating a presentation can take up a lot of effort and time, so the content and message should always be the primary focus. The visuals of the PowerPoint can enhance the presenters message, so our Intelligent Manufacturing Global Big Data Analytics In Manufacturing Industry Market Structure PDF was created to help save time. Instead of worrying about the design, the presenter can concentrate on the message while our designers work on creating the ideal templates for whatever situation is needed. Slidegeeks has experts for everything from amazing designs to valuable content, we have put everything into Intelligent Manufacturing Global Big Data Analytics In Manufacturing Industry Market Structure PDF
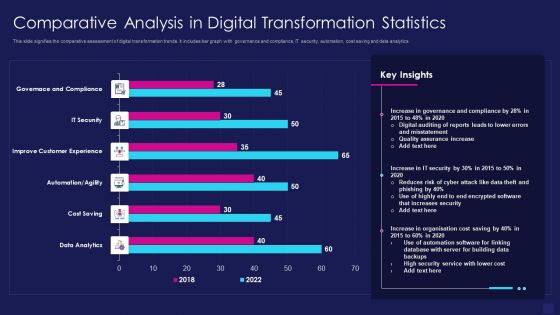
Comparative Analysis In Digital Transformation Statistics Graphics PDF
This slide signifies the comparative assessment of digital transformation trends. It includes bar graph with governance and compliance, IT security, automation, cost saving and data analytics. Showcasing this set of slides titled comparative analysis in digital transformation statistics graphics pdf. The topics addressed in these templates are data analytics, cost saving, improve customer experience. All the content presented in this PPT design is completely editable. Download it and make adjustments in color, background, font etc. as per your unique business setting.
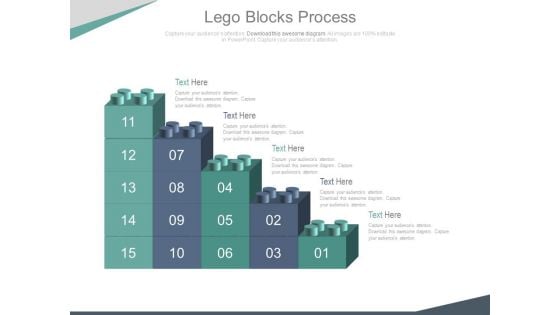
Bar Graph Of Lego Blocks For Data Analysis Powerpoint Slides
This PowerPoint template contains bar graph made of Lego blocks. You may use this slide to display growth process. This diagram provides an effective way of displaying information you can edit text, color, shade and style as per you need.
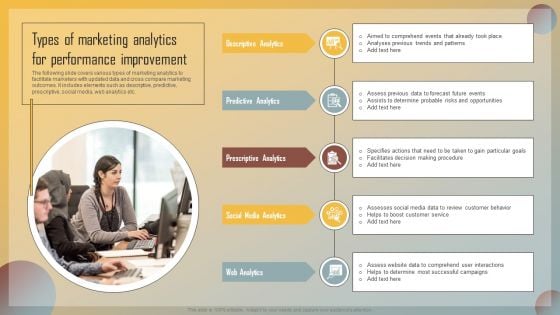
Guide For Marketing Analytics To Improve Decisions Types Of Marketing Analytics For Performance Improvement Demonstration PDF
The following slide covers various types of marketing analytics to facilitate marketers with updated data and cross compare marketing outcomes. It includes elements such as descriptive, predictive, prescriptive, social media, web analytics etc. Retrieve professionally designed Guide For Marketing Analytics To Improve Decisions Types Of Marketing Analytics For Performance Improvement Demonstration PDF to effectively convey your message and captivate your listeners. Save time by selecting pre made slideshows that are appropriate for various topics, from business to educational purposes. These themes come in many different styles, from creative to corporate, and all of them are easily adjustable and can be edited quickly. Access them as PowerPoint templates or as Google Slides themes. You do not have to go on a hunt for the perfect presentation because Slidegeeks got you covered from everywhere.
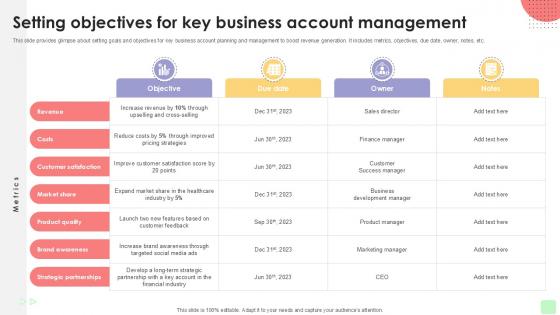
Setting Objectives For Key Business Detailed Business Account PPT Presentation Strategy SS V
This slide provides glimpse about setting goals and objectives for key business account planning and management to boost revenue generation. It includes metrics, objectives, due date, owner, notes, etc. Dont compromise on a template that erodes your messages impact. Introducing our engaging Setting Objectives For Key Business Detailed Business Account PPT Presentation Strategy SS V complete deck, thoughtfully crafted to grab your audiences attention instantly. With this deck, effortlessly download and adjust elements, streamlining the customization process. Whether youre using Microsoft versions or Google Slides, it fits seamlessly into your workflow. Furthermore, its accessible in JPG, JPEG, PNG, and PDF formats, facilitating easy sharing and editing. Not only that you also play with the color theme of your slides making it suitable as per your audiences preference. This slide provides glimpse about setting goals and objectives for key business account planning and management to boost revenue generation. It includes metrics, objectives, due date, owner, notes, etc.

Cost Breakdown For Conducting Marketing Research Formats PDF
This slide covers cost breakdown for conducting market research more efficiently. It involves key elements such as reporting, project initiation, research design, field work and data analysis. If your project calls for a presentation, then Slidegeeks is your go-to partner because we have professionally designed, easy-to-edit templates that are perfect for any presentation. After downloading, you can easily edit Cost Breakdown For Conducting Marketing Research Formats PDF and make the changes accordingly. You can rearrange slides or fill them with different images. Check out all the handy templates
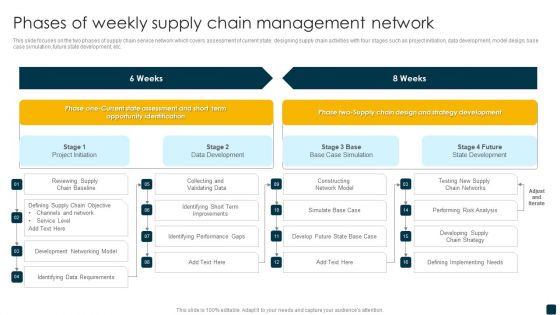
Phases Of Weekly Supply Chain Management Network Template PDF
This slide focuses on the two phases of supply chain service network which covers assessment of current state, designing supply chain activities with four stages such as project initiation, data development, model design, base case simulation, future state development, etc. Pitch your topic with ease and precision using this Phases Of Weekly Supply Chain Management Network Template PDF. This layout presents information on Supply Chain, Development Networking Model, Collecting And Validating Data. It is also available for immediate download and adjustment. So, changes can be made in the color, design, graphics or any other component to create a unique layout.
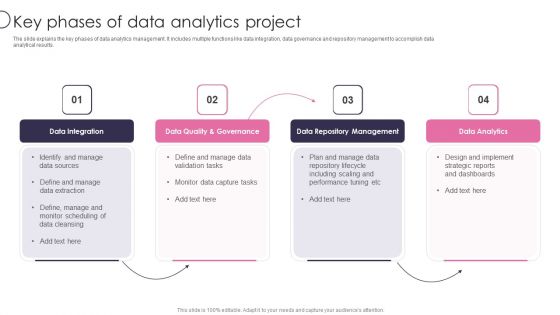
Information Transformation Process Toolkit Key Phases Of Data Analytics Project Summary PDF
The slide explains the key phases of data analytics management. It includes multiple functions like data integration, data governance and repository management to accomplish data analytical results. This is a Information Transformation Process Toolkit Key Phases Of Data Analytics Project Summary PDF template with various stages. Focus and dispense information on four stages using this creative set, that comes with editable features. It contains large content boxes to add your information on topics like Data Integration, Data Repository Management, Data Analytics. You can also showcase facts, figures, and other relevant content using this PPT layout. Grab it now.
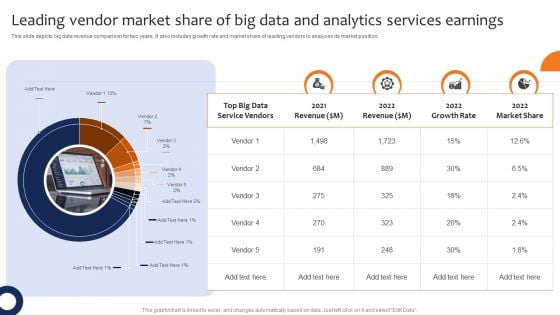
Leading Vendor Market Share Of Big Data And Analytics Services Earnings Professional PDF
This slide depicts big data revenue comparison for two years. It also includes growth rate and market share of leading vendors to analyses its market position. Pitch your topic with ease and precision using this Leading Vendor Market Share Of Big Data And Analytics Services Earnings Professional PDF. This layout presents information on Revenue, Growth Rate, Market Share. It is also available for immediate download and adjustment. So, changes can be made in the color, design, graphics or any other component to create a unique layout.

Telecom Cost Management Reporting Categories Mockup PDF
This slide shows telecom expense reporting that helps to compile and organize data. It includes three types of reporting portal, application programming interface API , key performance indictor reporting. Presenting Telecom Cost Management Reporting Categories Mockup PDF to dispense important information. This template comprises three stages. It also presents valuable insights into the topics including API Reporting, KPI Reporting, Portal Reporting. This is a completely customizable PowerPoint theme that can be put to use immediately. So, download it and address the topic impactfully.
Developing Dual Branding Campaign For Brand Marketing SWOT Analysis Themes PDF
This slide showcases process that can help organization to launch dual branding campaign. Its key steps are goal definition, screening partners and negotiating the contract. The Developing Dual Branding Campaign For Brand Marketing SWOT Analysis Themes PDF is a compilation of the most recent design trends as a series of slides. It is suitable for any subject or industry presentation, containing attractive visuals and photo spots for businesses to clearly express their messages. This template contains a variety of slides for the user to input data, such as structures to contrast two elements, bullet points, and slides for written information. Slidegeeks is prepared to create an impression.
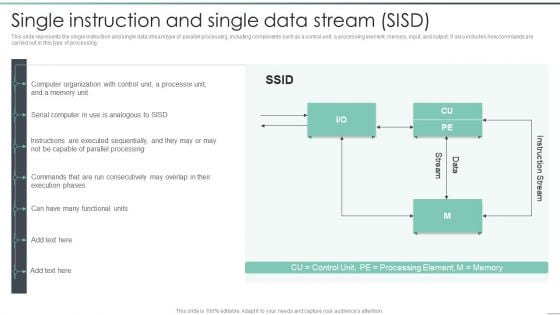
Parallel Computing Processing Single Instruction And Single Data Stream SISD Diagrams PDF
This slide represents the single instruction and single data stream type of parallel processing, including components such as a control unit, a processing element, memory, input, and output. It also includes how commands are carried out in this type of processing. Deliver and pitch your topic in the best possible manner with this Parallel Computing Processing Single Instruction And Single Data Stream SISD Diagrams PDF. Use them to share invaluable insights on Parallel Processing, Execution Phases, Processor Unit and impress your audience. This template can be altered and modified as per your expectations. So, grab it now.
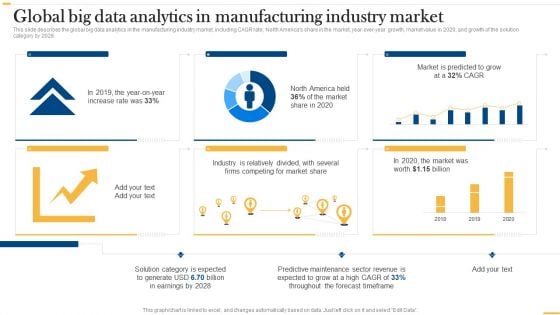
Deploying AI To Enhance Global Big Data Analytics In Manufacturing Industry Market Professional PDF
This slide describes the global big data analytics in the manufacturing industry market, including CAGR rate, North Americas share in the market, year-over-year growth, market value in 2020, and growth of the solution category by 2028. Coming up with a presentation necessitates that the majority of the effort goes into the content and the message you intend to convey. The visuals of a PowerPoint presentation can only be effective if it supplements and supports the story that is being told. Keeping this in mind our experts created Deploying AI To Enhance Global Big Data Analytics In Manufacturing Industry Market Professional PDF to reduce the time that goes into designing the presentation. This way, you can concentrate on the message while our designers take care of providing you with the right template for the situation.
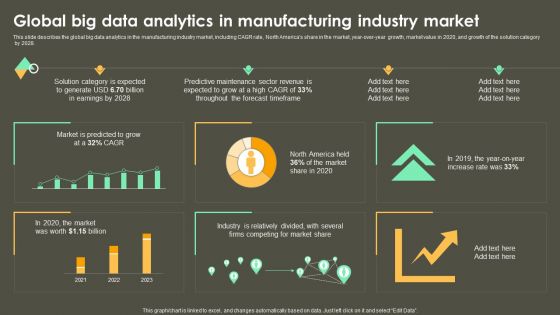
Iot Integration In Manufacturing Global Big Data Analytics In Manufacturing Industry Market Infographics PDF
This slide describes the global big data analytics in the manufacturing industry market, including CAGR rate, North Americas share in the market, year-over-year growth, market value in 2020, and growth of the solution category by 2028. Coming up with a presentation necessitates that the majority of the effort goes into the content and the message you intend to convey. The visuals of a PowerPoint presentation can only be effective if it supplements and supports the story that is being told. Keeping this in mind our experts created Iot Integration In Manufacturing Global Big Data Analytics In Manufacturing Industry Market Infographics PDF to reduce the time that goes into designing the presentation. This way, you can concentrate on the message while our designers take care of providing you with the right template for the situation.

Pie Chart With Increasing Percentage Values Powerpoint Slides
This PowerPoint template has been designed with diagram of pie chart with increasing percentage values. This PPT slide can be used to prepare presentations for profit growth report and also for financial data analysis. You can download finance PowerPoint template to prepare awesome presentations.
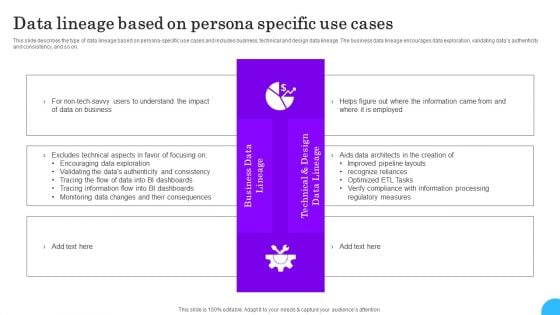
Comprehensive Analysis Of Different Data Lineage Classification Data Lineage Based On Persona Specific Sample PDF
This slide describes the type of data lineage based on persona specific use cases and includes business, technical and design data lineage. The business data lineage encourages data exploration, validating datas authenticity and consistency, and so on. Whether you have daily or monthly meetings, a brilliant presentation is necessary. Comprehensive Analysis Of Different Data Lineage Classification Data Lineage Based On Persona Specific Sample PDF can be your best option for delivering a presentation. Represent everything in detail using Comprehensive Analysis Of Different Data Lineage Classification Data Lineage Based On Persona Specific Sample PDF and make yourself stand out in meetings. The template is versatile and follows a structure that will cater to your requirements. All the templates prepared by Slidegeeks are easy to download and edit. Our research experts have taken care of the corporate themes as well. So, give it a try and see the results.
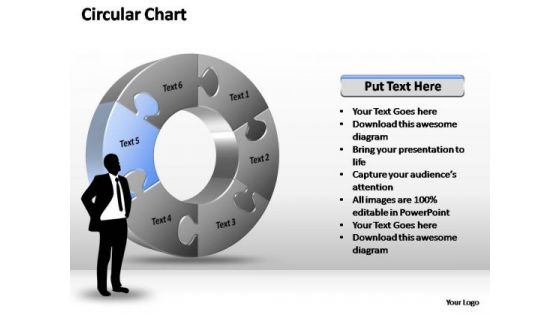
PowerPoint Templates Process Circular Chart Ppt Themes
PowerPoint Templates Process Circular Chart PPT Themes-Represent any circular process, business concept or idea easily with this 3D Business circular Chart.\n-PowerPoint Templates Process Circular Chart PPT Themes Figure out the market with our PowerPoint Templates Process Circular Chart Ppt Themes. Analyse the data accurately for the audience.
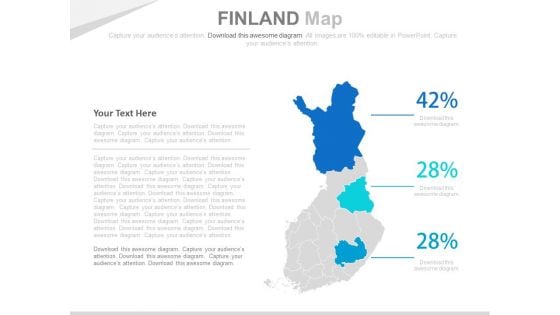
Finland Map With Economic Data Analysis Powerpoint Slides
This PowerPoint template has been designed with Finland Map and areas highlighted. You may use this slide to display financial strategy analysis. This diagram provides an effective way of displaying information you can edit text, color, shade and style as per you need.
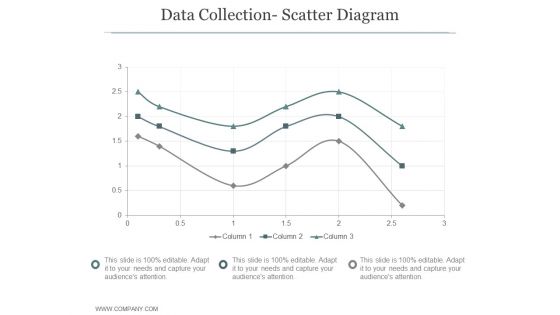
Data Collection Scatter Diagram Ppt PowerPoint Presentation Shapes
This is a data collection scatter diagram ppt powerpoint presentation shapes. This is a three stage process. The stages in this process are business, strategy, growth strategy, marketing, histogram, finance.
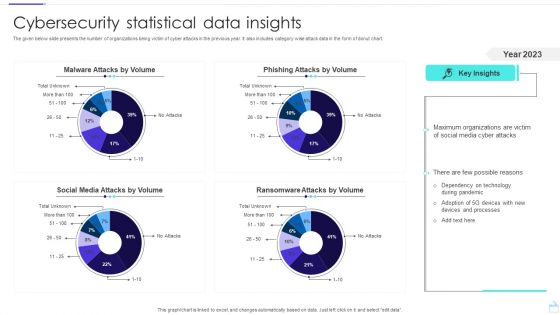
Cybersecurity Statistical Data Insights Sample PDF
The given below slide presents the number of organizations being victim of cyber attacks in the previous year. It also includes category wise attack data in the form of donut chart. Pitch your topic with ease and precision using this Cybersecurity Statistical Data Insights Sample PDF. This layout presents information on Social Media Attacks, Malware Attacks, Phishing Attacks. It is also available for immediate download and adjustment. So, changes can be made in the color, design, graphics or any other component to create a unique layout.
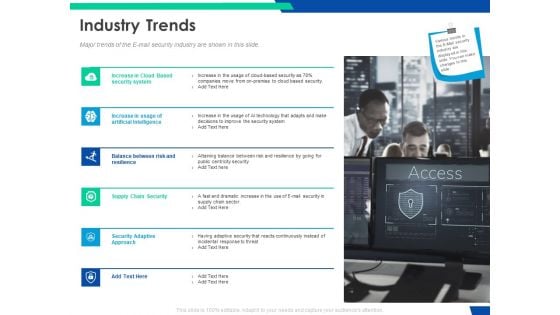
Cloud Based Email Security Market Report Industry Trends Ppt Styles Diagrams PDF
Major trends of the E mail security industry are shown in this slide. This is a cloud based email security market report industry trends ppt styles diagrams pdf template with various stages. Focus and dispense information on six stages using this creative set, that comes with editable features. It contains large content boxes to add your information on topics like security system, artificial intelligence, supply chain security, security adaptive approach. You can also showcase facts, figures, and other relevant content using this PPT layout. Grab it now.
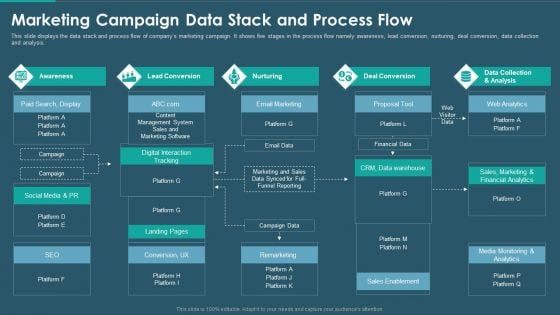
Sales And Promotion Playbook Marketing Campaign Data Stack And Process Flow Diagrams PDF
This slide displays the data stack and process flow of companys marketing campaign. It shows five stages in the process flow namely awareness, lead conversion, nurturing, deal conversion, data collection and analysis. Deliver and pitch your topic in the best possible manner with this sales and promotion playbook marketing campaign data stack and process flow diagrams pdf. Use them to share invaluable insights on deal conversion, data collection, lead conversion, awareness and impress your audience. This template can be altered and modified as per your expectations. So, grab it now.
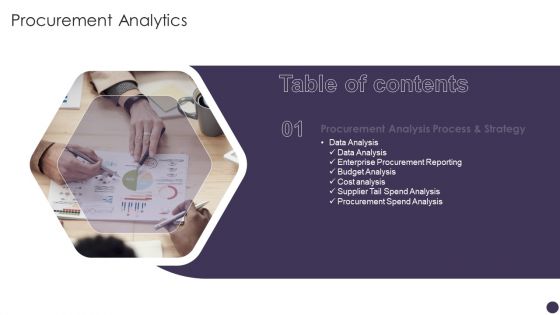
Table Of Contents Procurement Analytics Slide Diagrams PDF
Presenting Table Of Contents Procurement Analytics Slide Diagrams PDF to provide visual cues and insights. Share and navigate important information on one stage that need your due attention. This template can be used to pitch topics like Data Analysis, Enterprise Procurement, Budget Analysis. In addtion, this PPT design contains high resolution images, graphics, etc, that are easily editable and available for immediate download.
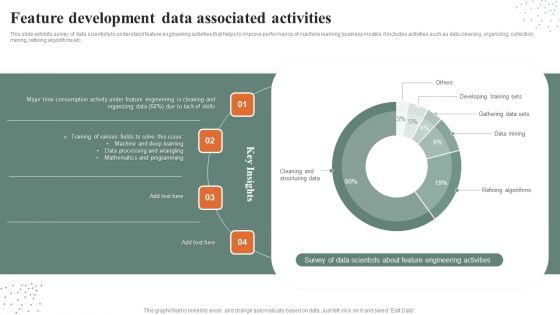
Feature Development Data Associated Activities Guidelines PDF
This slide exhibits survey of data scientists to understand feature engineering activities that helps to improve performance of machine learning business models. It includes activities such as data cleaning, organizing, collection, mining, refining algorithms etc. Pitch your topic with ease and precision using this Feature Development Data Associated Activities Guidelines PDF. This layout presents information on Programming, Developing Training Sets, Gathering Data Sets. It is also available for immediate download and adjustment. So, changes can be made in the color, design, graphics or any other component to create a unique layout.
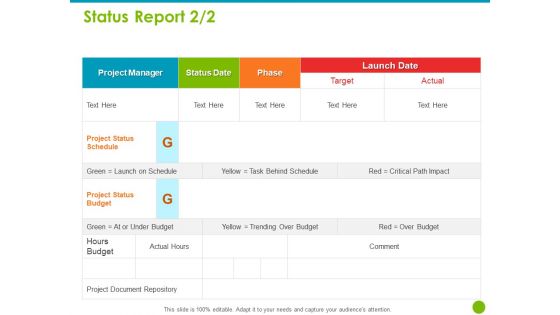
Project Capabilities Status Report Phase Ppt Ideas Inspiration PDF
Presenting this set of slides with name project capabilities status report phase ppt ideas inspiration pdf. The topics discussed in these slides are project manager, status date, phase, launch date. This is a completely editable PowerPoint presentation and is available for immediate download. Download now and impress your audience.
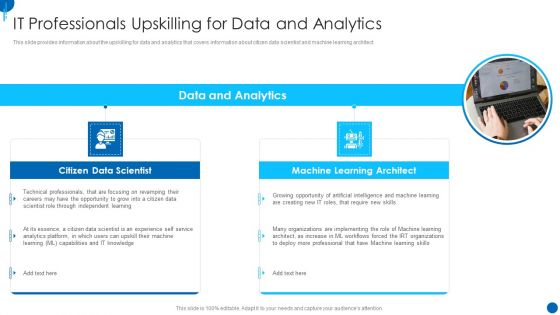
Information Technology Strategy IT Professionals Upskilling For Data And Analytics Diagrams PDF
This slide provides information about the upskilling for data and analytics that covers information about citizen data scientist and machine learning architect. This is a information technology strategy it professionals upskilling for data and analytics diagrams pdf template with various stages. Focus and dispense information on two stages using this creative set, that comes with editable features. It contains large content boxes to add your information on topics like data and analytics, citizen data scientist, machine learning architect. You can also showcase facts, figures, and other relevant content using this PPT layout. Grab it now.
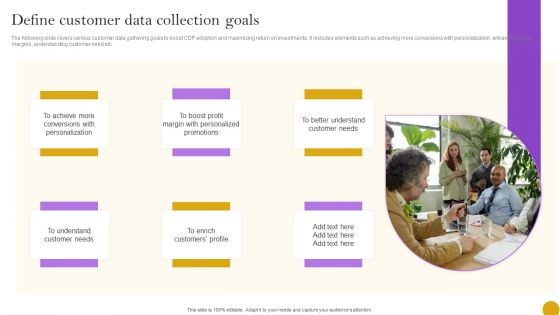
Comprehensive Customer Data Platform Guide Optimizing Promotional Initiatives Define Customer Data Collection Goals Diagrams PDF
The following slide covers various customer data gathering goals to boost CDP adoption and maximizing return on investments. It includes elements such as achieving more conversions with personalization, enhancing profit margins, understanding customer need etc. Retrieve professionally designed Comprehensive Customer Data Platform Guide Optimizing Promotional Initiatives Define Customer Data Collection Goals Diagrams PDF to effectively convey your message and captivate your listeners. Save time by selecting pre made slideshows that are appropriate for various topics, from business to educational purposes. These themes come in many different styles, from creative to corporate, and all of them are easily adjustable and can be edited quickly. Access them as PowerPoint templates or as Google Slides themes. You do not have to go on a hunt for the perfect presentation because Slidegeeks got you covered from everywhere.
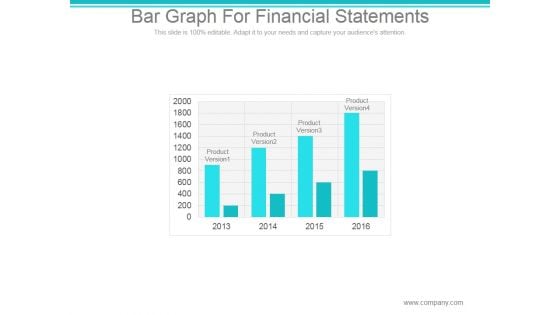
Bar Graph For Financial Statements Ppt PowerPoint Presentation Example
This is a bar graph for financial statements ppt powerpoint presentation example. This is a four stage process. The stages in this process are product version, finance, year.
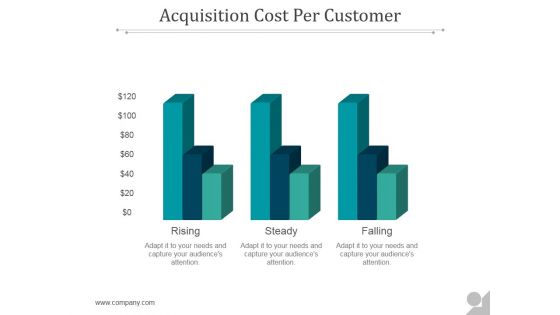
Acquisition Cost Per Customer Ppt PowerPoint Presentation Example 2015
This is a acquisition cost per customer ppt powerpoint presentation example 2015. This is a three stage process. The stages in this process are rising, steady, falling.
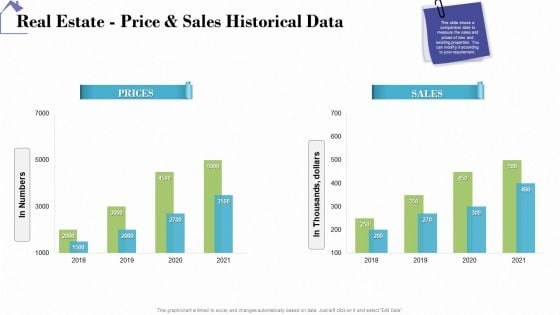
Industry Analysis Of Real Estate And Construction Sector Real Estate Price And Sales Historical Data Diagrams PDF
Deliver and pitch your topic in the best possible manner with this industry analysis of real estate and construction sector real estate price and sales historical data diagrams pdf. Use them to share invaluable insights on prices, sales and impress your audience. This template can be altered and modified as per your expectations. So, grab it now.
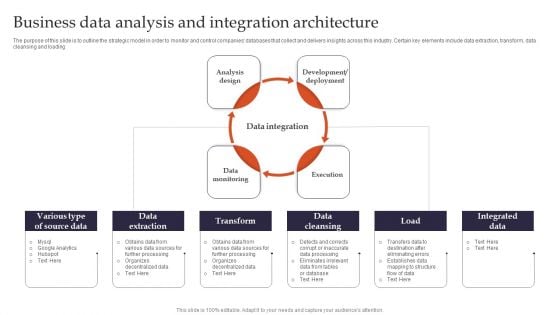
Business Data Analysis And Integration Architecture Brochure PDF
The purpose of this slide is to outline the strategic model in order to monitor and control companies databases that collect and delivers insights across this industry. Certain key elements include data extraction, transform, data cleansing and loading. Presenting Business Data Analysis And Integration Architecture Brochure PDF to dispense important information. This template comprises four stages. It also presents valuable insights into the topics including Analysis Design, Development Or Deployment, Data Monitoring. This is a completely customizable PowerPoint theme that can be put to use immediately. So, download it and address the topic impactfully.
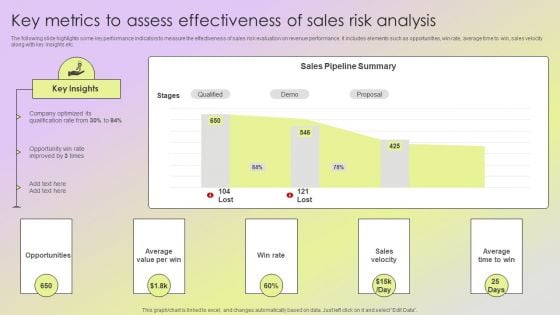
Mitigating Sales Risks With Strategic Action Planning Key Metrics To Assess Effectiveness Of Sales Risk Analysis Rules PDF
The following slide highlights some key performance indicators to measure the effectiveness of sales risk evaluation on revenue performance. It includes elements such as opportunities, win rate, average time to win, sales velocity along with key insights etc. Create an editable Mitigating Sales Risks With Strategic Action Planning Key Metrics To Assess Effectiveness Of Sales Risk Analysis Rules PDF that communicates your idea and engages your audience. Whether youre presenting a business or an educational presentation, pre designed presentation templates help save time. Mitigating Sales Risks With Strategic Action Planning Key Metrics To Assess Effectiveness Of Sales Risk Analysis Rules PDF is highly customizable and very easy to edit, covering many different styles from creative to business presentations. Slidegeeks has creative team members who have crafted amazing templates. So, go and get them without any delay.

Concept Of Mystery Using 5 Puzzles Quote Process Flow Chart PowerPoint Slides
We present our concept of mystery using 5 puzzles quote process flow chart PowerPoint Slides.Use our Puzzles or Jigsaws PowerPoint Templates because,This one depicts the popular chart. Use our Business PowerPoint Templates because, You have had a great year or so business wise. It is time to celebrate the efforts of your team Use our Shapes PowerPoint Templates because,You know the path so show the way. Use our Process and Flows PowerPoint Templates because, This will helps you to explore the minutest detail of each concept and follow the trail to its conclusion. Use our Abstract PowerPoint Templates because,Different personalities, different abilities but formidable together.Use these PowerPoint slides for presentations relating to Abstract, Action, Attach, Box, Business, Center, Chain, Chart, Color, Communication, Concept, Connection, Cube, Cycle, Data, Diagram, Flow, Globe, Horizontal, Idea, Illustration, Information, Interaction, Jigsaw, Join, Link, Pieces, Process, Puzzle, Relation, Relationship, Shape, Success. The prominent colors used in the PowerPoint template are Yellow, Gray, Black Walk your team through your plans using our Concept Of Mystery Using 5 Puzzles Quote Process Flow Chart PowerPoint Slides. See them getting energized.
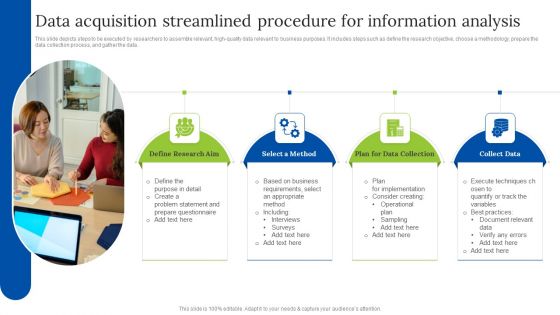
Data Acquisition Streamlined Procedure For Information Analysis Clipart PDF
This slide depicts steps to be executed by researchers to assemble relevant, high-quality data relevant to business purposes. It includes steps such as define the research objective, choose a methodology, prepare the data collection process, and gather the data.Presenting Data Acquisition Streamlined Procedure For Information Analysis Clipart PDF to dispense important information. This template comprises four stages. It also presents valuable insights into the topics including Define Research, Data Collection, Execute Techniques . This is a completely customizable PowerPoint theme that can be put to use immediately. So, download it and address the topic impactfully.
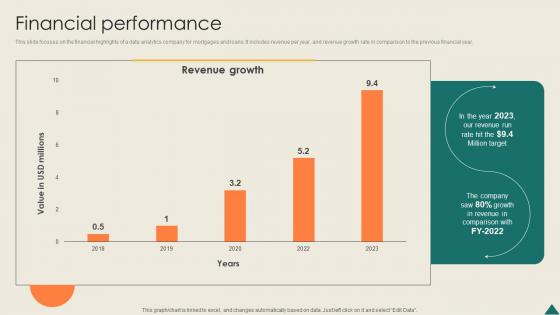
Financial Performance Financial Analytics Platform Investor Elevator Pitch Deck
This slide focuses on the financial highlights of a data analytics company for mortgages and loans. It includes revenue per year, and revenue growth rate in comparison to the previous financial year. Find a pre-designed and impeccable Financial Performance Financial Analytics Platform Investor Elevator Pitch Deck. The templates can ace your presentation without additional effort. You can download these easy-to-edit presentation templates to make your presentation stand out from others. So, what are you waiting for Download the template from Slidegeeks today and give a unique touch to your presentation. This slide focuses on the financial highlights of a data analytics company for mortgages and loans. It includes revenue per year, and revenue growth rate in comparison to the previous financial year.
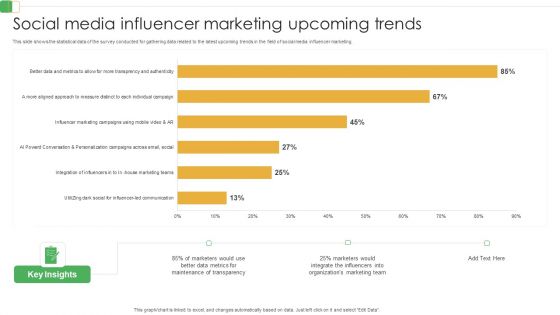
Social Media Influencer Marketing Upcoming Trends Ppt PowerPoint Presentation Diagram Templates PDF
This slide shows the statistical data of the survey conducted for gathering data related to the latest upcoming trends in the field of social media influencer marketing.Showcasing this set of slides titled Social Media Influencer Marketing Upcoming Trends Ppt PowerPoint Presentation Diagram Templates PDF. The topics addressed in these templates are Maintenance Transparency, Better Data Metrics, Integrate Influencers. All the content presented in this PPT design is completely editable. Download it and make adjustments in color, background, font etc. as per your unique business setting.
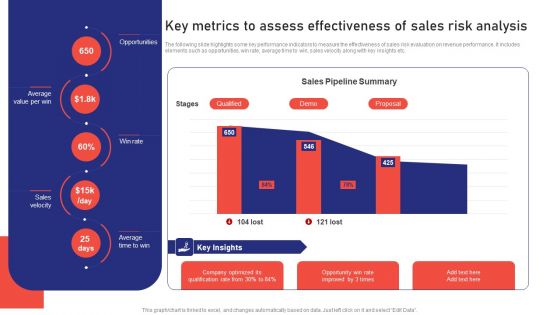
Sales Risk Assessment For Profit Maximization Key Metrics To Assess Effectiveness Of Sales Risk Analysis Ideas PDF
The following slide highlights some key performance indicators to measure the effectiveness of sales risk evaluation on revenue performance. It includes elements such as opportunities, win rate, average time to win, sales velocity along with key insights etc. Get a simple yet stunning designed Sales Risk Assessment For Profit Maximization Key Metrics To Assess Effectiveness Of Sales Risk Analysis Ideas PDF. It is the best one to establish the tone in your meetings. It is an excellent way to make your presentations highly effective. So, download this PPT today from Slidegeeks and see the positive impacts. Our easy to edit Sales Risk Assessment For Profit Maximization Key Metrics To Assess Effectiveness Of Sales Risk Analysis Ideas PDF can be your go to option for all upcoming conferences and meetings. So, what are you waiting for Grab this template today.
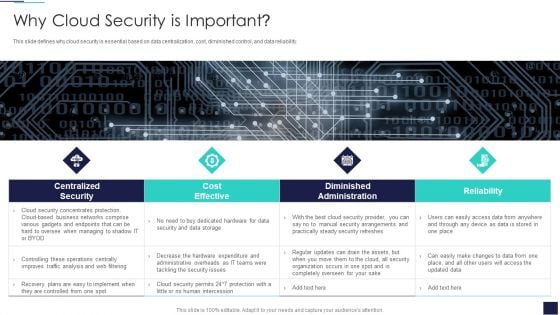
Cloud Information Security Why Cloud Security Is Important Ppt Diagrams PDF
This slide defines why cloud security is essential based on data centralization, cost, diminished control, and data reliability. This is a Cloud Information Security Why Cloud Security Is Important Ppt Diagrams PDF template with various stages. Focus and dispense information on four stages using this creative set, that comes with editable features. It contains large content boxes to add your information on topics like Cost Effective, Diminished Administration, Centralized Security. You can also showcase facts, figures, and other relevant content using this PPT layout. Grab it now.
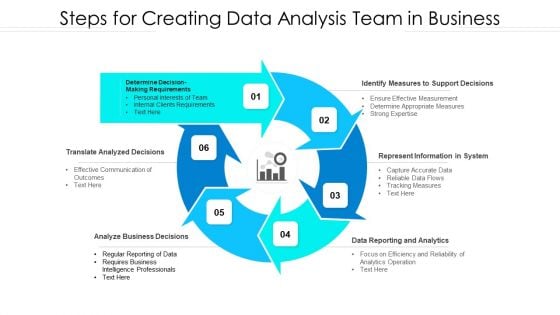
Steps For Creating Data Analysis Team In Business Information PDF
Presenting steps for creating data analysis team in business information pdf. to dispense important information. This template comprises six stages. It also presents valuable insights into the topics including translate analyzed decisions analyze, business decisions, identify measures to support decisions, represent information in system. This is a completely customizable PowerPoint theme that can be put to use immediately. So, download it and address the topic impactfully.
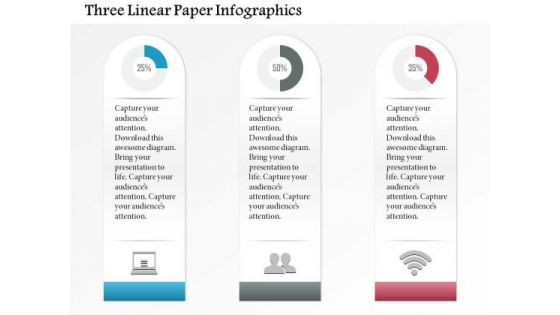
Business Diagram Three Linear Paper Infographics Presentation Template
Three linear paper info graphics has been used to design this power point template slide. This PPT slide contains the concept of data analysis and business data flow. Use this PPT slide for your business and marketing related presentations.
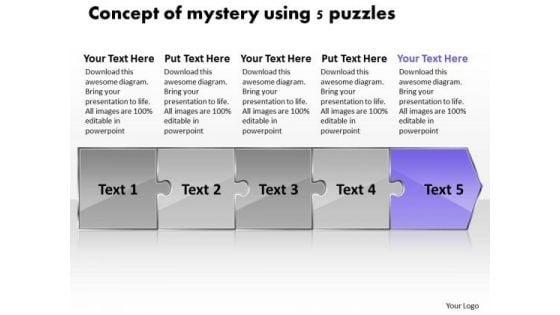
Concept Of Mystery Using 5 Puzzles Tech Support Flow Chart PowerPoint Slides
We present our concept of mystery using 5 puzzles tech support flow chart PowerPoint Slides.Use our Puzzles or Jigsaws PowerPoint Templates because,You have the process in your head, our template design showing will illuminate your thoughts. Use our Business PowerPoint Templates because, A brainwave has occurred to you after review. You know just how to push the graph skyward Use our Shapes PowerPoint Templates because, You have the entire picture in mind. Use our Process and Flows PowerPoint Templates because, The lessons have been analyzed, studied and conclusions drawn. Use our Abstract PowerPoint Templates because,Honesty is the best policy has an ardent follower in you.Use these PowerPoint slides for presentations relating to Abstract, Action, Attach, Box, Business, Center, Chain, Chart, Color, Communication, Concept, Connection, Cube, Cycle, Data, Diagram, Flow, Globe, Horizontal, Idea, Illustration, Information, Interaction, Jigsaw, Join, Link, Pieces, Process, Puzzle, Relation, Relationship, Shape, Success. The prominent colors used in the PowerPoint template are Purple, Gray, Black Let your ideas explode on the scene. Trigger the fuse with our Concept Of Mystery Using 5 Puzzles Tech Support Flow Chart PowerPoint Slides.

 Home
Home