Dashboard Icon
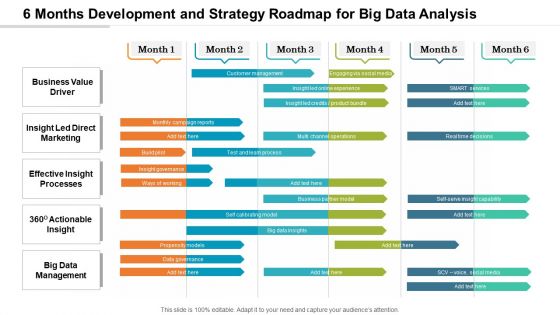
6 Months Development And Strategy Roadmap For Big Data Analysis Graphics
Presenting our innovatively-structured 6 months development and strategy roadmap for big data analysis graphics Template. Showcase your roadmap process in different formats like PDF, PNG, and JPG by clicking the download button below. This PPT design is available in both Standard Screen and Widescreen aspect ratios. It can also be easily personalized and presented with modified font size, font type, color, and shapes to measure your progress in a clear way.
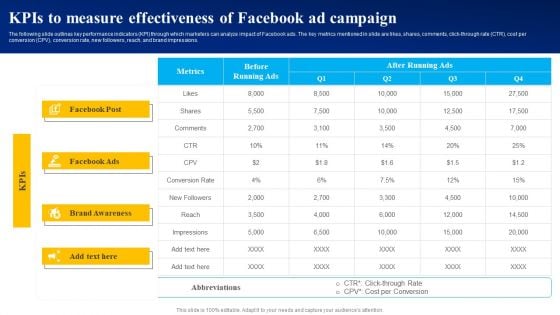
Kpis To Measure Effectiveness Of Facebook Ad Campaign Ppt PowerPoint Presentation File Diagrams PDF
The following slide outlines key performance indicators KPI through which marketers can analyze impact of Facebook ads. The key metrics mentioned in slide are likes, shares, comments, click-through rate CTR, cost per conversion CPV, conversion rate, new followers, reach, and brand impressions. Do you have to make sure that everyone on your team knows about any specific topic I yes, then you should give Kpis To Measure Effectiveness Of Facebook Ad Campaign Ppt PowerPoint Presentation File Diagrams PDF a try. Our experts have put a lot of knowledge and effort into creating this impeccable Kpis To Measure Effectiveness Of Facebook Ad Campaign Ppt PowerPoint Presentation File Diagrams PDF. You can use this template for your upcoming presentations, as the slides are perfect to represent even the tiniest detail. You can download these templates from the Slidegeeks website and these are easy to edit. So grab these today.
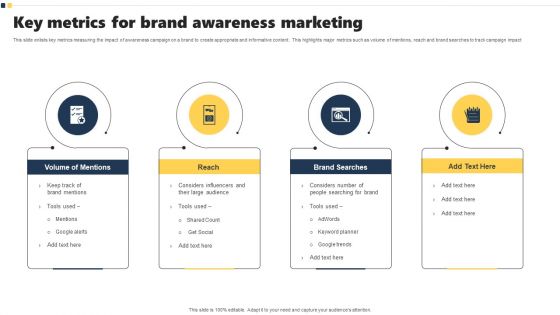
Key Metrics For Brand Awareness Marketing Diagrams PDF
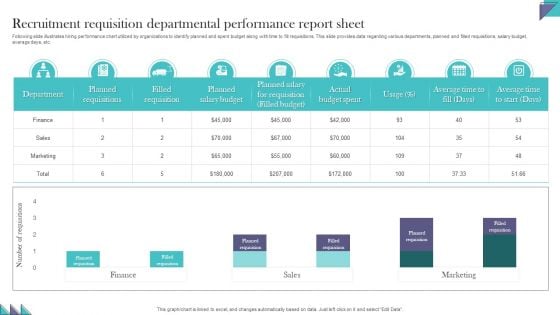
Recruitment Requisition Departmental Performance Report Sheet Demonstration PDF
Following slide illustrates hiring performance chart utilized by organizations to identify planned and spent budget along with time to fill requisitions. This slide provides data regarding various departments, planned and filled requisitions, salary budget, average days, etc. Pitch your topic with ease and precision using this Recruitment Requisition Departmental Performance Report Sheet Demonstration PDF. This layout presents information on Recruitment Requisition, Departmental Performance, Report Sheet. It is also available for immediate download and adjustment. So, changes can be made in the color, design, graphics or any other component to create a unique layout.
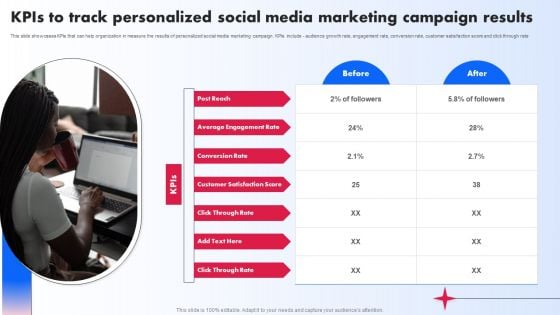
Kpis To Track Personalized Social Media Marketing Campaign Results Ppt PowerPoint Presentation Diagram Images PDF
This slide showcases KPIs that can help organization in measure the results of personalized social media marketing campaign. KPIs include audience growth rate, engagement rate, conversion rate, customer satisfaction score and click through rate. The Kpis To Track Personalized Social Media Marketing Campaign Results Ppt PowerPoint Presentation Diagram Images PDF is a compilation of the most recent design trends as a series of slides. It is suitable for any subject or industry presentation, containing attractive visuals and photo spots for businesses to clearly express their messages. This template contains a variety of slides for the user to input data, such as structures to contrast two elements, bullet points, and slides for written information. Slidegeeks is prepared to create an impression.
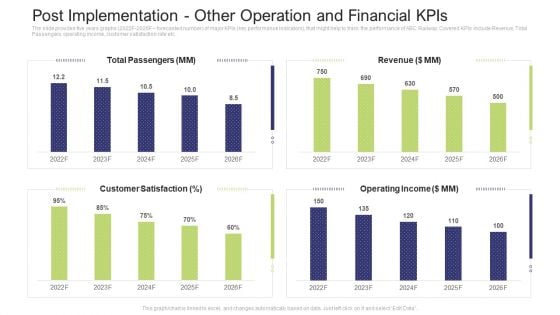
Post Implementation Other Operation And Financial Kpis Summary PDF
The slide provides five years graphs 2022F to 2026F forecasted number of major KPIs key performance indicators, that might help to track the performance of ABC Railway. Covered KPIs include Revenue, Total Passengers, operating income, customer satisfaction rate etc.Deliver and pitch your topic in the best possible manner with this post implementation other operation and financial KPIs summary pdf. Use them to share invaluable insights on total passengers, operating income, revenue, 2022 to 2026 and impress your audience. This template can be altered and modified as per your expectations. So, grab it now.
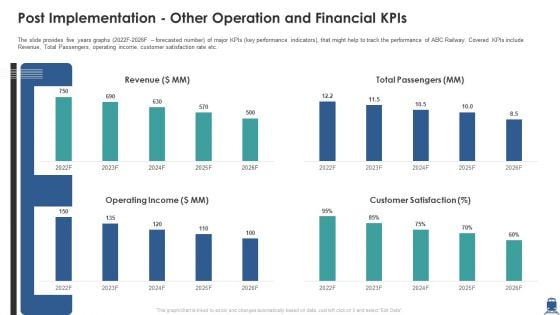
Post Implementation Other Operation And Financial Kpis Inspiration PDF
The slide provides five years graphs 2022F-2026F forecasted number of major KPIs key performance indicators, that might help to track the performance of ABC Railway. Covered KPIs include Revenue, Total Passengers, operating income, customer satisfaction rate etc. Deliver and pitch your topic in the best possible manner with this post implementation other operation and financial kpis inspiration pdf. Use them to share invaluable insights on revenue, operating income, customer satisfaction and impress your audience. This template can be altered and modified as per your expectations. So, grab it now.
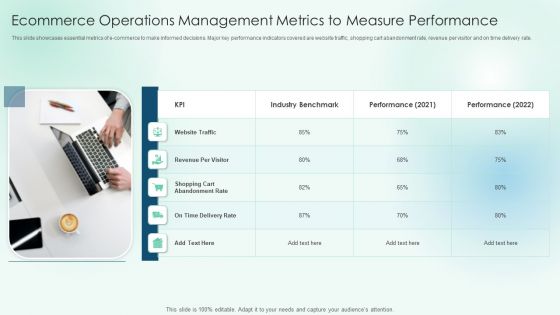
Ecommerce Operations Management Metrics To Measure Performance Professional PDF
This slide showcases essential metrics of e-commerce to make informed decisions. Major key performance indicators covered are website traffic, shopping cart abandonment rate, revenue per visitor and on time delivery rate. Presenting Ecommerce Operations Management Metrics To Measure Performance Professional PDF to dispense important information. This template comprises one stage. It also presents valuable insights into the topics including Abandonment Rate, Industry Benchmark, Performance. This is a completely customizable PowerPoint theme that can be put to use immediately. So, download it and address the topic impactfully.
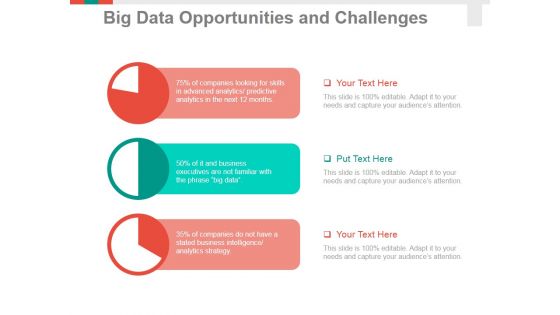
Big Data Opportunities And Challenges Template 1 Ppt PowerPoint Presentation Infographic Template Summary
This is a big data opportunities and challenges template 1 ppt powerpoint presentation infographic template summary. This is a three stage process. The stages in this process are business, pie chart, finance, marketing, analysis, strategy.
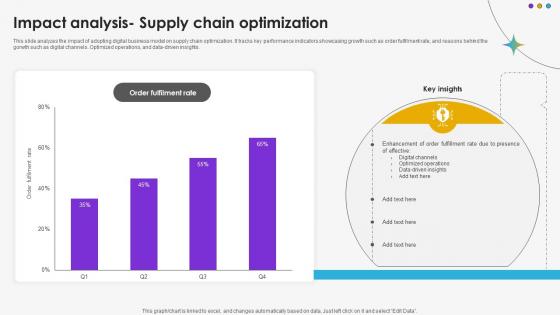
Impact Analysis Supply Chain Optimization DT SS V
This slide analyzes the impact of adopting digital business model on supply chain optimization. It tracks key performance indicators showcasing growth such as order fulfilment rate, and reasons behind the gorwth such as digital channels. Optimized operations, and data-driven insights.Whether you have daily or monthly meetings, a brilliant presentation is necessary. Impact Analysis Supply Chain Optimization DT SS V can be your best option for delivering a presentation. Represent everything in detail using Impact Analysis Supply Chain Optimization DT SS V and make yourself stand out in meetings. The template is versatile and follows a structure that will cater to your requirements. All the templates prepared by Slidegeeks are easy to download and edit. Our research experts have taken care of the corporate themes as well. So, give it a try and see the results. This slide analyzes the impact of adopting digital business model on supply chain optimization. It tracks key performance indicators showcasing growth such as order fulfilment rate, and reasons behind the gorwth such as digital channels. Optimized operations, and data-driven insights.
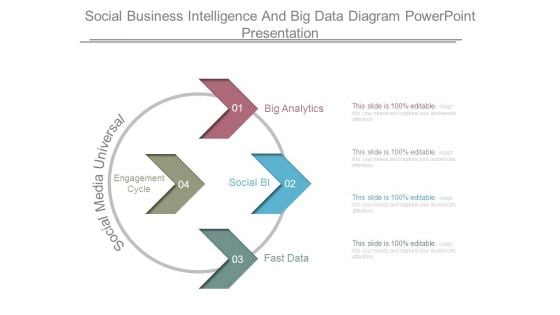
Social Business Intelligence And Big Data Diagram Powerpoint Presentation
This is a social business intelligence and big data diagram powerpoint presentation. This is a four stage process. The stages in this process are big analytics, social bi, fast data, social media universal, engagement cycle.
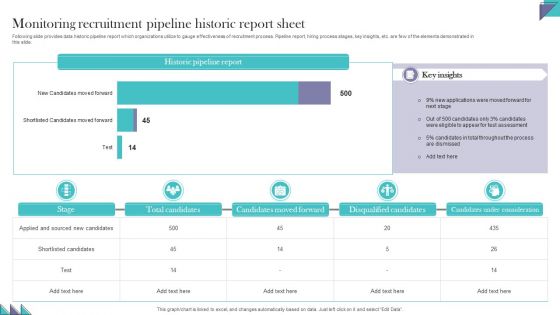
Monitoring Recruitment Pipeline Historic Report Sheet Pictures PDF
Following slide provides data historic pipeline report which organizations utilize to gauge effectiveness of recruitment process. Pipeline report, hiring process stages, key insights, etc. are few of the elements demonstrated in this slide. Pitch your topic with ease and precision using this Monitoring Recruitment Pipeline Historic Report Sheet Pictures PDF. This layout presents information on Candidates Moved Forward, Disqualified Candidates, Candidates Under Consideration. It is also available for immediate download and adjustment. So, changes can be made in the color, design, graphics or any other component to create a unique layout
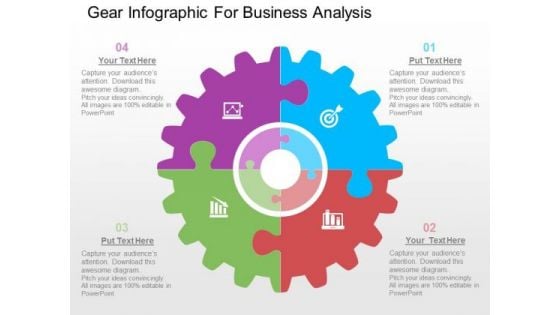
Gear Infographic For Business Analysis PowerPoint Templates
Our above slide contains diagram of gear infographic. This gear infographic slide helps to exhibit business analysis. Use this diagram to impart more clarity to data and to create more sound impact on viewers.

Business Diagram Seven Staged Circular Ribbon Text Box Diagram Presentation Template
This Power Point template slide has been used to display the concept of business data analysis. This PPT slide contains the graphic of seven staged circular ribbon style text boxes. Use this PPT slide for your business presentations.
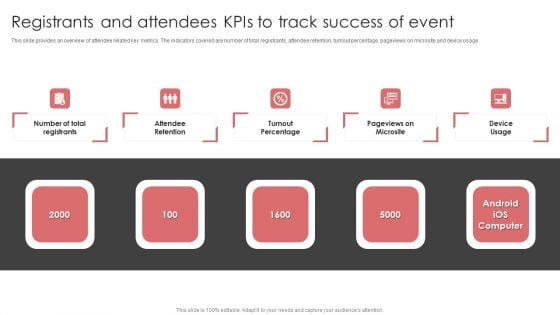
New Product Launch Event Management Activities Registrants And Attendees Kpis To Track Themes PDF
This slide provides an overview of attendee related key metrics. The indicators covered are number of total registrants, attendee retention, turnout percentage, pageviews on microsite and device usage.This New Product Launch Event Management Activities Registrants And Attendees Kpis To Track Themes PDF from Slidegeeks makes it easy to present information on your topic with precision. It provides customization options, so you can make changes to the colors, design, graphics, or any other component to create a unique layout. It is also available for immediate download, so you can begin using it right away. Slidegeeks has done good research to ensure that you have everything you need to make your presentation stand out. Make a name out there for a brilliant performance.
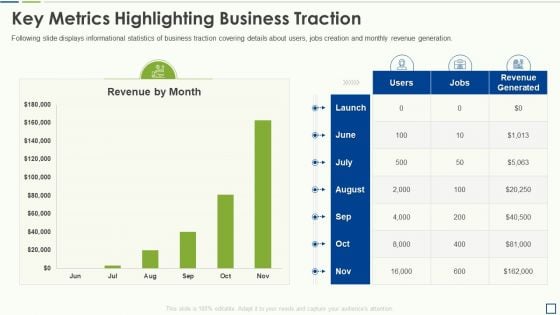
Accounting Pitch Deck Key Metrics Highlighting Business Traction Pictures PDF
Following slide displays informational statistics of business traction covering details about users, jobs creation and monthly revenue generation.Deliver and pitch your topic in the best possible manner with this accounting pitch deck key metrics highlighting business traction pictures pdf Use them to share invaluable insights on key metrics highlighting business traction and impress your audience. This template can be altered and modified as per your expectations. So, grab it now.
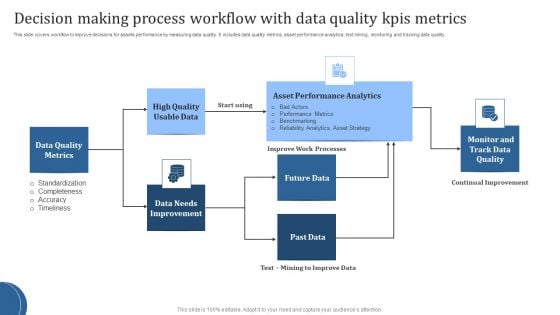
Decision Making Process Workflow With Data Quality Kpis Metrics Download PDF
This slide covers workflow to improve decisions for assets performance by measuring data quality. It includes data quality metrics, asset performance analytics, text mining, monitoring and tracking data quality. Presenting Decision Making Process Workflow With Data Quality Kpis Metrics Download PDF to dispense important information. This template comprises Seven stages. It also presents valuable insights into the topics including Data Quality Metrics, Data Needs Improvement. This is a completely customizable PowerPoint theme that can be put to use immediately. So, download it and address the topic impactfully.
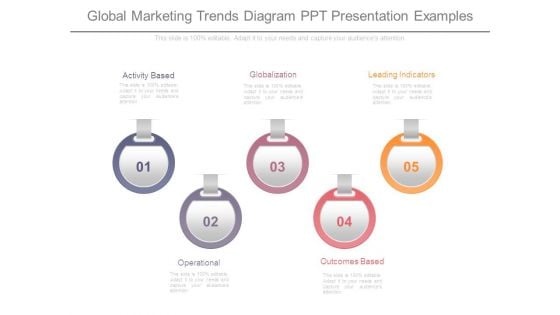
Global Marketing Trends Diagram Ppt Presentation Examples
This is a global marketing trends diagram ppt presentation examples. This is a five stage process. The stages in this process are activity based, globalization, leading indicators, outcomes based, operational.
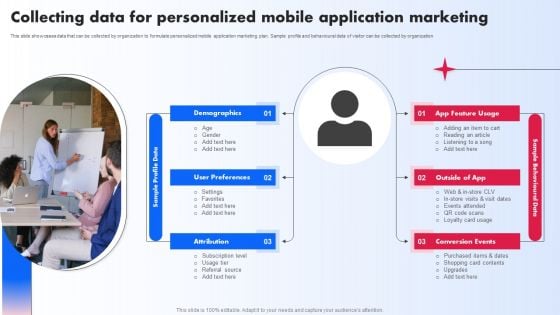
Collecting Data For Personalized Mobile Application Marketing Ppt PowerPoint Presentation File Infographics PDF
This slide showcases data that can be collected by organization to formulate personalized mobile application marketing plan. Sample profile and behavioural data of visitor can be collected by organization Whether you have daily or monthly meetings, a brilliant presentation is necessary. Collecting Data For Personalized Mobile Application Marketing Ppt PowerPoint Presentation File Infographics PDF can be your best option for delivering a presentation. Represent everything in detail using Collecting Data For Personalized Mobile Application Marketing Ppt PowerPoint Presentation File Infographics PDF and make yourself stand out in meetings. The template is versatile and follows a structure that will cater to your requirements. All the templates prepared by Slidegeeks are easy to download and edit. Our research experts have taken care of the corporate themes as well. So, give it a try and see the results.
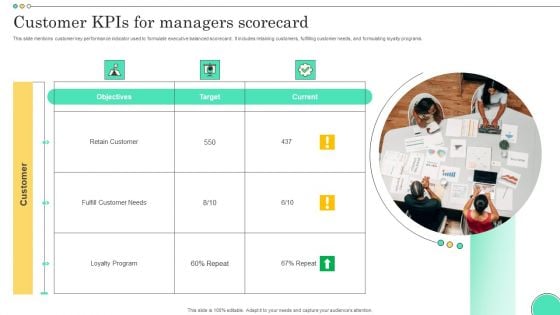
Customer Kpis For Managers Scorecard Template PDF
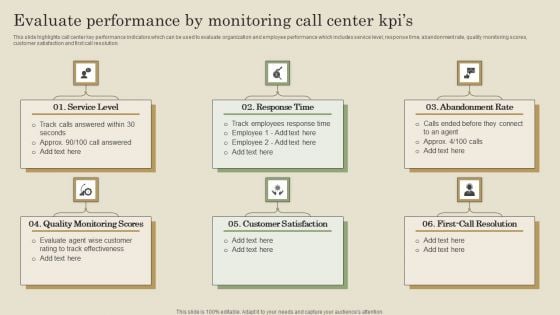
Evaluate Performance By Monitoring Call Center Kpis Ppt PowerPoint Presentation File Diagrams PDF
This slide highlights call center key performance indicators which can be used to evaluate organization and employee performance which includes service level, response time, abandonment rate, quality monitoring scores, customer satisfaction and first call resolution. Present like a pro with Evaluate Performance By Monitoring Call Center Kpis Ppt PowerPoint Presentation File Diagrams PDF Create beautiful presentations together with your team, using our easy to use presentation slides. Share your ideas in real time and make changes on the fly by downloading our templates. So whether you are in the office, on the go, or in a remote location, you can stay in sync with your team and present your ideas with confidence. With Slidegeeks presentation got a whole lot easier. Grab these presentations today.
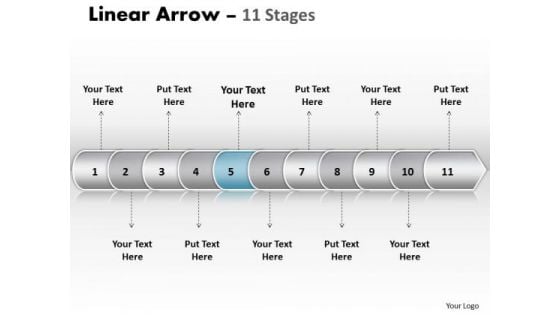
Usa Ppt Template Linear Arrow 11 Phase Diagram Time Management PowerPoint 6 Design
USA PPT template linear arrow 11 phase diagram time management powerpoint 6 design-This linear arrow chart makes information accessible throughout the organization with a collective, visible view of critical data from different perspectives and providing the tools to upcoming business scenarios and plan for change.-USA PPT template linear arrow 11 phase diagram time management powerpoint 6 design-Arrow, Background, Collection, Completed, Concept, Confirmation, Design, Flow, Graph, Graphic, Illustration, Indication, Indicator, Information, Instruction, Interface, Internet, Layout, Measurement, Order, Phase, Pointer, Process, Progress, Reflection, Scale, Shape, Sign Integrate teams with our Usa Ppt Template Linear Arrow 11 Phase Diagram Time Management PowerPoint 6 Design. Download without worries with our money back guaranteee.
3d Two Stages Of Process Analysis Flow Charting PowerPoint Slides
We present our 3d two stages of process analysis flow charting PowerPoint Slides.Download our Business PowerPoint Templates because like the famed William Tell, they put aside all emotions and concentrate on the target. Use our Competition PowerPoint Templates because it has inspired a whole new world of medical endeavour. Present our Marketing PowerPoint Templates because networking is an imperative in todays world. You need to access the views of others. Similarly you need to give access to them of your abilities. Present our Design PowerPoint Templates because Our Template designs are State of the Art. Download our Metaphor PowerPoint Templates because you can asked to strive to give true form to your great dream.Use these PowerPoint slides for presentations relating to analysis, analyze, background, business, chart, competition, conceptual, corporation, create, data, decision, design, direction, economic, enterprise, future, graph, idea, illustration, information, innovate, layout, management, marketing, paper, plan, process, product, project, science, social, . The prominent colors used in the PowerPoint template are Blue, Gray, Black. Professionals tell us our 3d two stages of process analysis flow charting PowerPoint Slides are designed by professionals The feedback we get is that our create PowerPoint templates and PPT Slides are Elegant. We assure you our 3d two stages of process analysis flow charting PowerPoint Slides are Dazzling. Customers tell us our corporation PowerPoint templates and PPT Slides provide you with a vast range of viable options. Select the appropriate ones and just fill in your text. Presenters tell us our 3d two stages of process analysis flow charting PowerPoint Slides will impress their bosses and teams. People tell us our corporation PowerPoint templates and PPT Slides are Attractive. Examine data with our 3d Two Stages Of Process Analysis Flow Charting PowerPoint Slides. You will come out on top.
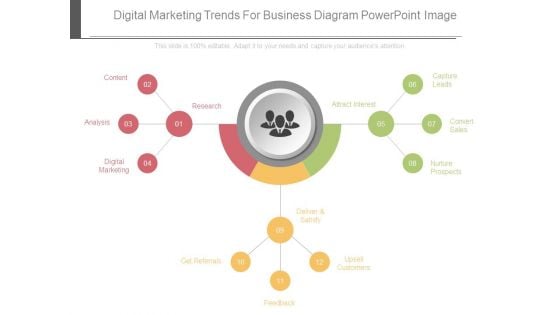
Digital Marketing Trends For Business Diagram Powerpoint Image
This is a digital marketing trends for business diagram powerpoint image. This is a twelve stage process. The stages in this process are content, analysis, digital marketing, research, attract interest, capture leads, convert sales, nurture prospects, deliver and satisfy, upsell customers, get referrals.

Three Text Tags Compare Chart Powerpoint Slides
This PowerPoint template has been designed with text tags and percentage data. You may download this PPT slide to display data comparison and analysis. Add this slide to your presentation and impress your superiors.
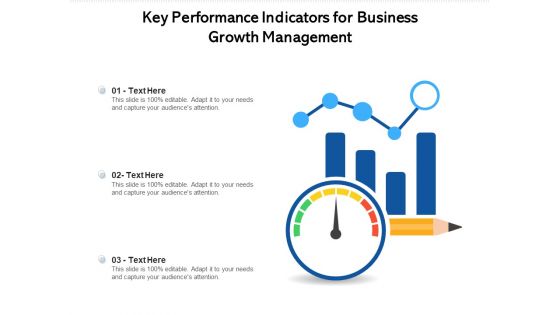
Key Performance Indicators For Business Growth Management Ppt PowerPoint Presentation Outline Layout PDF
Presenting key performance indicators for business growth management ppt powerpoint presentation outline layout pdf to dispense important information. This template comprises three stages. It also presents valuable insights into the topics including key performance indicators for business growth management. This is a completely customizable PowerPoint theme that can be put to use immediately. So, download it and address the topic impactfully.
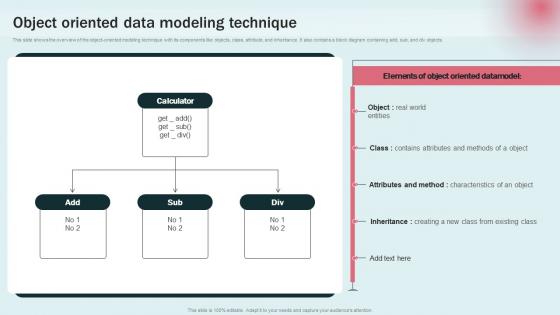
Object Oriented Data Modeling Data Modeling Approaches For Modern Analytics Infographics Pdf
This slide shows the overview of the object oriented modeling technique with its components like objects, class, attribute, and inheritance. It also contains a block diagram containing add, sub, and div objects. This modern and well arranged Object Oriented Data Modeling Data Modeling Approaches For Modern Analytics Infographics Pdf provides lots of creative possibilities. It is very simple to customize and edit with the Powerpoint Software. Just drag and drop your pictures into the shapes. All facets of this template can be edited with Powerpoint, no extra software is necessary. Add your own material, put your images in the places assigned for them, adjust the colors, and then you can show your slides to the world, with an animated slide included. This slide shows the overview of the object oriented modeling technique with its components like objects, class, attribute, and inheritance. It also contains a block diagram containing add, sub, and div objects.
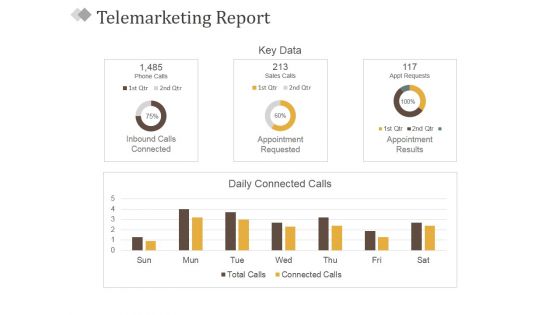
Telemarketing Report Template 1 Ppt PowerPoint Presentation Show Structure
This is a telemarketing report template 1 ppt powerpoint presentation show structure. This is a four stage process. The stages in this process are inbound calls connected, appointment requested, appointment results, key data, daily connected calls.
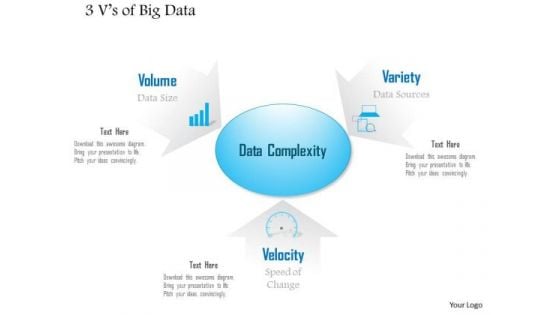
Business Diagram 3 Vs Of Big Data Showing Challenges And Complexity Of Analysis Ppt Slide
Explain the complexity and analysis with this unique PowerPoint template. This technology diagram contains the graphic of three V's to display data complexity. Use this diagram to make professional presentations.
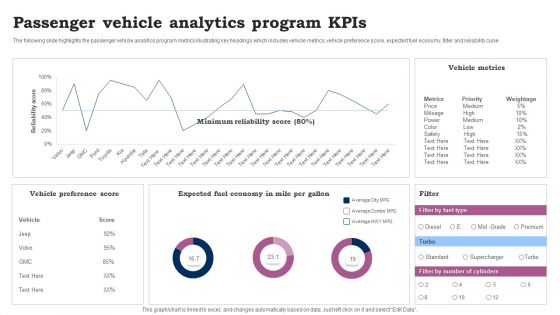
Passenger Vehicle Analytics Program Kpis Ppt Pictures Demonstration PDF
The following slide highlights the passenger vehicle analytics program metrics illustrating key headings which includes vehicle metrics, vehicle preference score, expected fuel economy, filter and reliability curve. Showcasing this set of slides titled Passenger Vehicle Analytics Program Kpis Ppt Pictures Demonstration PDF. The topics addressed in these templates are Vehicle Preference Score, Vehicle Metrics, Expected Fuel Economy. All the content presented in this PPT design is completely editable. Download it and make adjustments in color, background, font etc. as per your unique business setting.
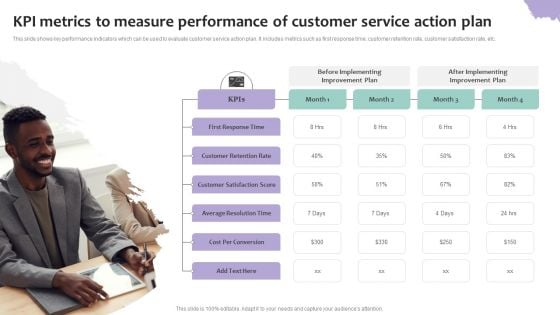
KPI Metrics To Measure Performance Of Customer Service Action Plan Diagrams PDF
This slide shows key performance indicators which can be used to evaluate customer service action plan. It includes metrics such as first response time, customer retention rate, customer satisfaction rate, etc. Persuade your audience using this KPI Metrics To Measure Performance Of Customer Service Action Plan Diagrams PDF. This PPT design covers four stages, thus making it a great tool to use. It also caters to a variety of topics including Before Implementing, Improvement Plan, After Implementing, First Response Time . Download this PPT design now to present a convincing pitch that not only emphasizes the topic but also showcases your presentation skills.
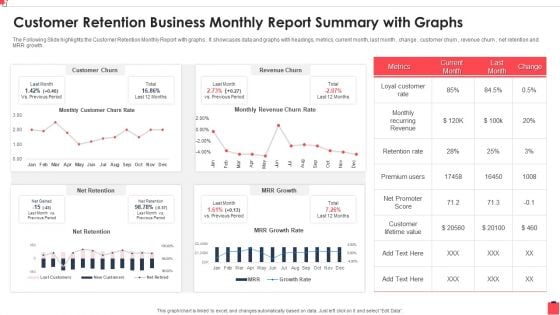
Customer Retention Business Monthly Report Summary With Graphs Guidelines PDF
The Following Slide highlights the Customer Retention Monthly Report with graphs . It showcases data and graphs with headings, metrics, current month, last month , change , customer churn , revenue churn , net retention and MRR growth. Showcasing this set of slides titled Customer Retention Business Monthly Report Summary With Graphs Guidelines PDF The topics addressed in these templates are Recurring Revenue, Customer Churn, Promoter Score All the content presented in this PPT design is completely editable. Download it and make adjustments in color, background, font etc. as per your unique business setting.
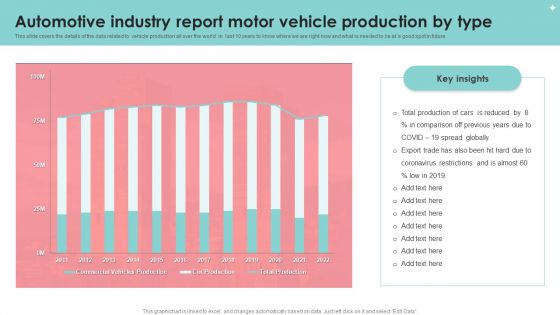
Automotive Industry Report Motor Vehicle Production By Type Portrait PDF
This slide covers the details of the data related to vehicle production all over the world in last 10 years to know where we are right now and what is needed to be at a good spot in future. Pitch your topic with ease and precision using this Automotive Industry Report Motor Vehicle Production By Type Portrait PDF. This layout presents information on Automotive Industry Report, Motor Vehicle Production. It is also available for immediate download and adjustment. So, changes can be made in the color, design, graphics or any other component to create a unique layout.
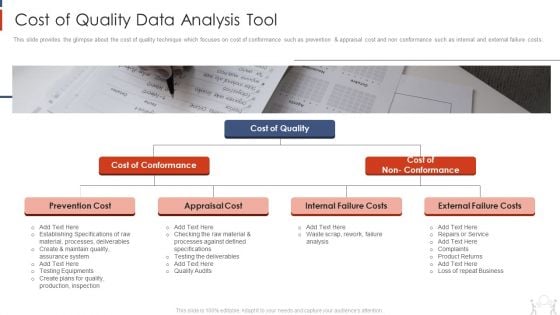
Project Management Modelling Techniques IT Cost Of Quality Data Analysis Tool Diagrams PDF
This slide provides the glimpse about the cost of quality technique which focuses on cost of conformance such as prevention and appraisal cost and non conformance such as internal and external failure costs. This is a project management modelling techniques it cost of quality data analysis tool diagrams pdf template with various stages. Focus and dispense information on one stages using this creative set, that comes with editable features. It contains large content boxes to add your information on topics like prevention cost, appraisal cost, internal failure costs, external failure costs. You can also showcase facts, figures, and other relevant content using this PPT layout. Grab it now.
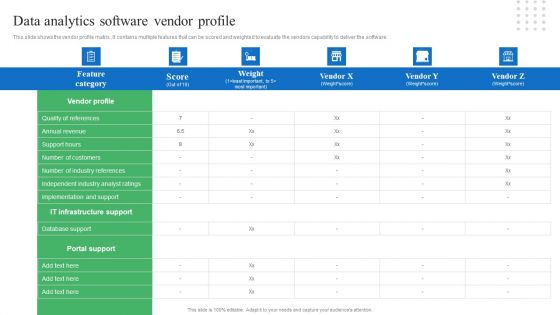
Toolkit For Data Science And Analytics Transition Data Analytics Software Vendor Profile Themes PDF
This slide shows the vendor profile matrix. It contains multiple features that can be scored and weighted to evaluate the vendors capability to deliver the software. Slidegeeks is here to make your presentations a breeze with Toolkit For Data Science And Analytics Transition Data Analytics Software Vendor Profile Themes PDF With our easy to use and customizable templates, you can focus on delivering your ideas rather than worrying about formatting. With a variety of designs to choose from, you are sure to find one that suits your needs. And with animations and unique photos, illustrations, and fonts, you can make your presentation pop. So whether you are giving a sales pitch or presenting to the board, make sure to check out Slidegeeks first.
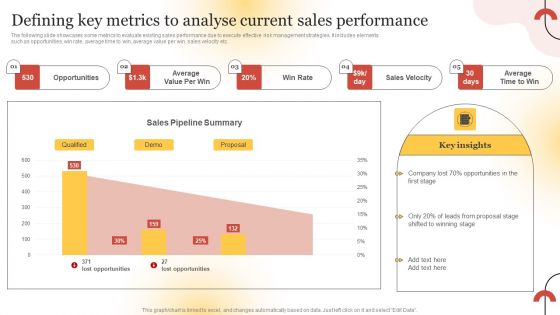
Executing Sales Risk Reduction Plan Defining Key Metrics To Analyse Current Sales Performance Diagrams PDF
The following slide showcases some metrics to evaluate existing sales performance due to execute effective risk management strategies. It includes elements such as opportunities, win rate, average time to win, average value per win, sales velocity etc. Do you know about Slidesgeeks Executing Sales Risk Reduction Plan Defining Key Metrics To Analyse Current Sales Performance Diagrams PDF These are perfect for delivering any kind od presentation. Using it, create PowerPoint presentations that communicate your ideas and engage audiences. Save time and effort by using our pre designed presentation templates that are perfect for a wide range of topic. Our vast selection of designs covers a range of styles, from creative to business, and are all highly customizable and easy to edit. Download as a PowerPoint template or use them as Google Slides themes.
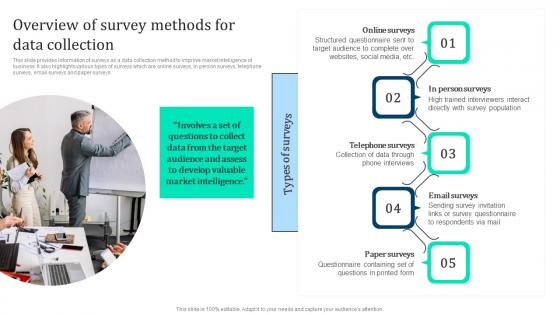
Overview Survey Methods Data Marketing Intelligence Guide Data Gathering Diagrams Pdf
This slide provides information of surveys as a data collection method to improve market intelligence of business. It also highlights various types of surveys which are online surveys, in person surveys, telephone surveys, email surveys and paper surveys. Boost your pitch with our creative Overview Survey Methods Data Marketing Intelligence Guide Data Gathering Diagrams Pdf. Deliver an awe inspiring pitch that will mesmerize everyone. Using these presentation templates you will surely catch everyones attention. You can browse the ppts collection on our website. We have researchers who are experts at creating the right content for the templates. So you do not have to invest time in any additional work. Just grab the template now and use them. This slide provides information of surveys as a data collection method to improve market intelligence of business. It also highlights various types of surveys which are online surveys, in person surveys, telephone surveys, email surveys and paper surveys.
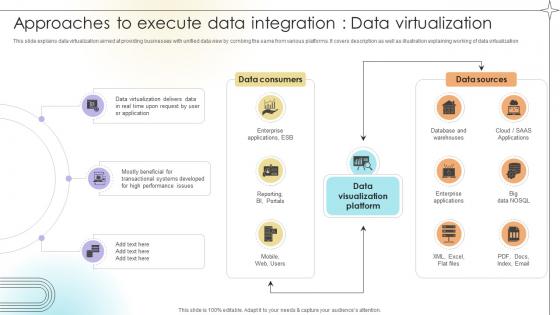
Approaches To Execute Data Integration Data Virtualization Data Analytics SS V
This slide explains data virtualization aimed at providing businesses with unified data view by combing the same from various platforms. It covers description as well as illustration explaining working of data virtualization.If you are looking for a format to display your unique thoughts, then the professionally designed Approaches To Execute Data Integration Data Virtualization Data Analytics SS V is the one for you. You can use it as a Google Slides template or a PowerPoint template. Incorporate impressive visuals, symbols, images, and other charts. Modify or reorganize the text boxes as you desire. Experiment with shade schemes and font pairings. Alter, share or cooperate with other people on your work. Download Approaches To Execute Data Integration Data Virtualization Data Analytics SS V and find out how to give a successful presentation. Present a perfect display to your team and make your presentation unforgettable. This slide explains data virtualization aimed at providing businesses with unified data view by combing the same from various platforms. It covers description as well as illustration explaining working of data virtualization.
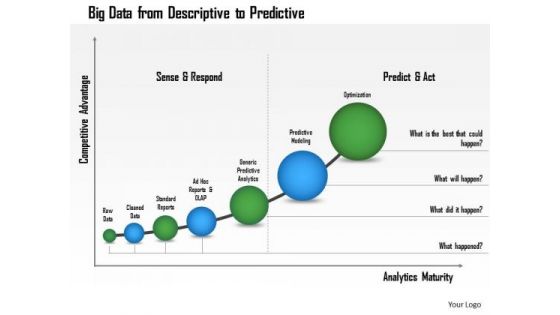
Business Framework Big Data From Descriptive To Predictive PowerPoint Presentation
Two funnel diagrams with text boxes are used to design this Power point template slide. This PPT slide contains the concept of AIDA marketing. Use this PPT for marketing and business presentations.
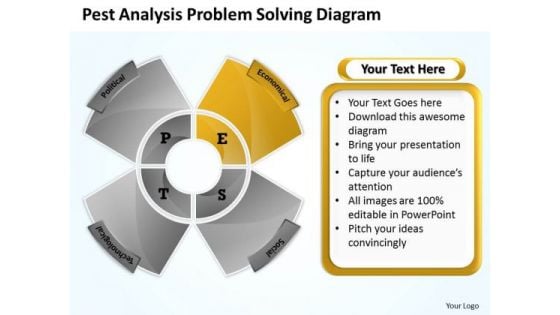
Sample Business PowerPoint Presentations Analysis Problem Solving Diagram Slides
We present our sample business powerpoint presentations analysis problem solving diagram Slides.Download and present our Process and flows PowerPoint Templates because Our PowerPoint Templates and Slides will provide you the cutting edge. Slice through the doubts in the minds of your listeners. Download our Flow Charts PowerPoint Templates because It will mark the footprints of your journey. Illustrate how they will lead you to your desired destination. Present our Business PowerPoint Templates because Our PowerPoint Templates and Slides are effectively colour coded to prioritise your plans They automatically highlight the sequence of events you desire. Present our Circle Charts PowerPoint Templates because It will Strengthen your hand with your thoughts. They have all the aces you need to win the day. Use our Shapes PowerPoint Templates because You can safely bank on our PowerPoint Templates and Slides. They will provide a growth factor to your valuable thoughts.Use these PowerPoint slides for presentations relating to Circle, company, cross, data, design, diagram, direction, document, financial, four, glossy, goals, graph, green, junction, management, market, marketing, model, multicolored, multiple, navigation, network, options, orange, pie, plan, presentation, process, red, results, shiny, sphere. The prominent colors used in the PowerPoint template are Yellow, Gray, Black. Professionals tell us our sample business powerpoint presentations analysis problem solving diagram Slides provide you with a vast range of viable options. Select the appropriate ones and just fill in your text. Presenters tell us our cross PowerPoint templates and PPT Slides help you meet deadlines which are an element of today's workplace. Just browse and pick the slides that appeal to your intuitive senses. The feedback we get is that our sample business powerpoint presentations analysis problem solving diagram Slides will help you be quick off the draw. Just enter your specific text and see your points hit home. Use our cross PowerPoint templates and PPT Slides are effectively colour coded to prioritise your plans They automatically highlight the sequence of events you desire. You can be sure our sample business powerpoint presentations analysis problem solving diagram Slides look good visually. Customers tell us our document PowerPoint templates and PPT Slides are the best it can get when it comes to presenting. Brake for no one with our Sample Business PowerPoint Presentations Analysis Problem Solving Diagram Slides. You will come out on top.
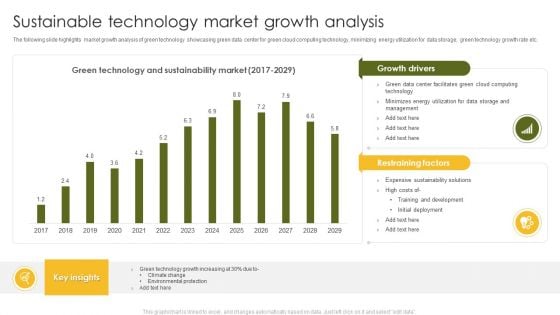
Sustainable Technology Market Growth Analysis Ppt Outline Slide Download PDF
The following slide highlights market growth analysis of green technology showcasing green data center for green cloud computing technology, minimizing energy utilization for data storage, green technology growth rate etc. Showcasing this set of slides titled Sustainable Technology Market Growth Analysis Ppt Outline Slide Download PDF. The topics addressed in these templates are Climate Change, Environmental Protection, Green Technology. All the content presented in this PPT design is completely editable. Download it and make adjustments in color, background, font etc. as per your unique business setting.

Data Center Relocation Process Step 8 Relocation Phase Formats PDF
This slide shows the eighth step that is involved in data center relocation process which is to be implemented for minimizing data center costs and improving scalability i.e. relocation phase. Do you know about Slidesgeeks Data Center Relocation Process Step 8 Relocation Phase Formats PDF. These are perfect for delivering any kind od presentation. Using it, create PowerPoint presentations that communicate your ideas and engage audiences. Save time and effort by using our pre designed presentation templates that are perfect for a wide range of topic. Our vast selection of designs covers a range of styles, from creative to business, and are all highly customizable and easy to edit. Download as a PowerPoint template or use them as Google Slides themes.
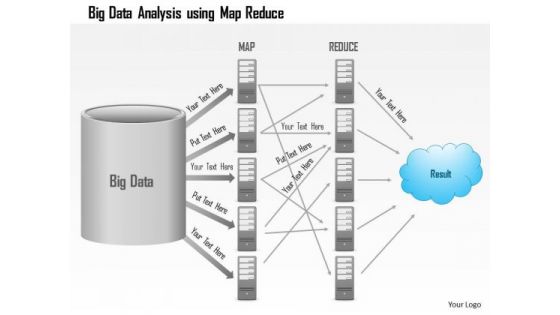
Business Diagram Big Data Analysis Using Map Reduce Batch Processing Ppt Slide
This PowerPoint template has been designed with graphic of server and data transfer network. This slide contains the steps of big data, map, reduce and result. Use this editable diagram for data technology related presentations.
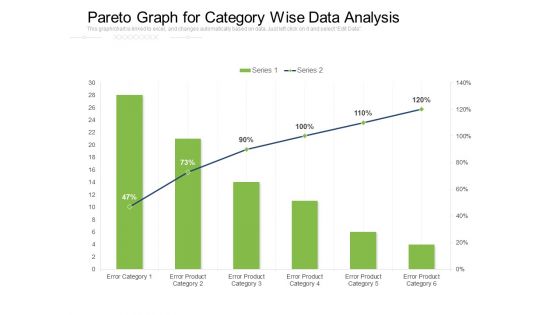
Pareto Graph For Category Wise Data Analysis Ppt PowerPoint Presentation File Example File PDF
Presenting this set of slides with name pareto graph for category wise data analysis ppt powerpoint presentation file example file pdf. The topics discussed in these slide is pareto graph for category wise data analysis. This is a completely editable PowerPoint presentation and is available for immediate download. Download now and impress your audience.
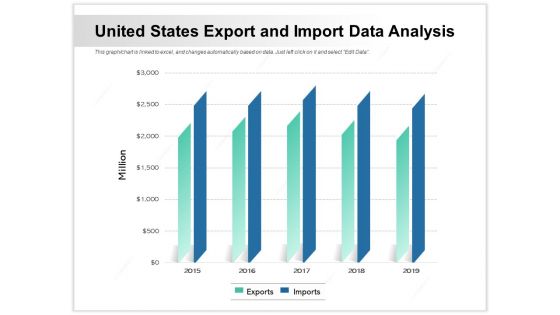
United States Export And Import Data Analysis Ppt PowerPoint Presentation Pictures Clipart Images PDF
Showcasing this set of slides titled united states export and import data analysis ppt powerpoint presentation pictures clipart images pdf. The topics addressed in these templates are united states export and import data analysis. All the content presented in this PPT design is completely editable. Download it and make adjustments in color, background, font etc. as per your unique business setting.
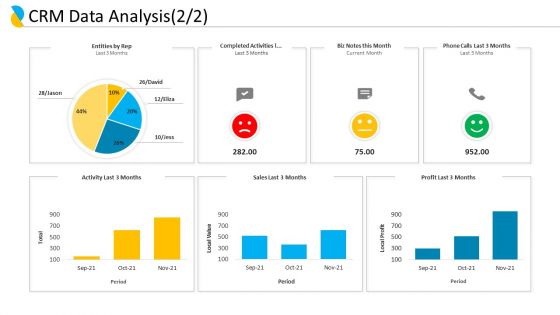
Customer Relationship Management CRM Data Analysis Activities Ppt File Format PDF
Deliver an awe inspiring pitch with this creative customer relationship management CRM data analysis activities ppt file format pdf bundle. Topics like completed activities, local profit, CRM data analysis can be discussed with this completely editable template. It is available for immediate download depending on the needs and requirements of the user.

Customer Relationship Management Action Plan Crm Data Analysis Current Ideas PDF
Deliver an awe inspiring pitch with this creative customer relationship management action plan crm data analysis current ideas pdf bundle. Topics like crm data analysis can be discussed with this completely editable template. It is available for immediate download depending on the needs and requirements of the user.
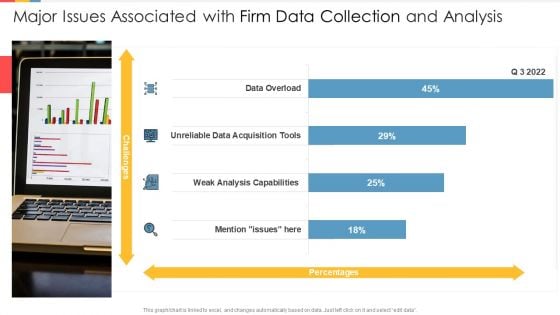
Major Issues Associated With Firm Data Collection And Analysis Demonstration PDF
Showcasing this set of slides titled major issues associated with firm data collection and analysis demonstration pdf. The topics addressed in these templates are major issues associated with firm data collection and analysis. All the content presented in this PPT design is completely editable. Download it and make adjustments in color, background, font etc. as per your unique business setting.

Quarterly Report Depicting Business Growth And Performance Quarterly Report Ppt Template
This slide depicts a report highlighting exceptional client retention, enhanced user engagement across key stages, and strong revenue growth driven by effective marketing strategies. Present like a pro with Quarterly Report Depicting Business Growth And Performance Quarterly Report Ppt Template Create beautiful presentations together with your team, using our easy-to-use presentation slides. Share your ideas in real-time and make changes on the fly by downloading our templates. So whether you are in the office, on the go, or in a remote location, you can stay in sync with your team and present your ideas with confidence. With Slidegeeks presentation got a whole lot easier. Grab these presentations today. This slide depicts a report highlighting exceptional client retention, enhanced user engagement across key stages, and strong revenue growth driven by effective marketing strategies.
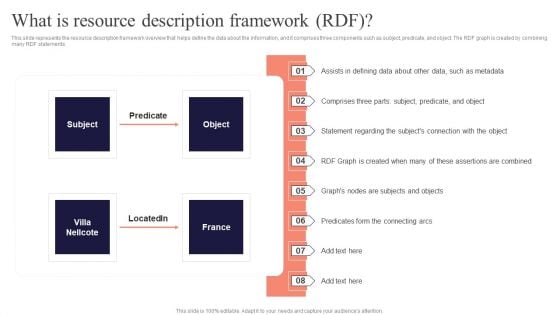
Concept Of Ontology In The Semantic Web What Is Resource Description Framework RDF Diagrams PDF
This slide represents the resource description framework overview that helps define the data about the information, and it comprises three components such as subject, predicate, and object. The RDF graph is created by combining many RDF statements. Do you know about Slidesgeeks Concept Of Ontology In The Semantic Web Steps To Obtain Semantic Searchs Benefits Demonstration PDF These are perfect for delivering any kind od presentation. Using it, create PowerPoint presentations that communicate your ideas and engage audiences. Save time and effort by using our pre designed presentation templates that are perfect for a wide range of topic. Our vast selection of designs covers a range of styles, from creative to business, and are all highly customizable and easy to edit. Download as a PowerPoint template or use them as Google Slides themes.
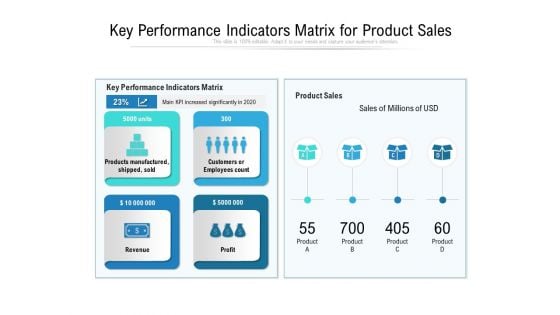
Key Performance Indicators Matrix For Product Sales Ppt PowerPoint Presentation File Clipart PDF
Presenting key performance indicators matrix for product sales ppt powerpoint presentation file clipart pdf to dispense important information. This template comprises four stages. It also presents valuable insights into the topics including manufactured, revenue, performance. This is a completely customizable PowerPoint theme that can be put to use immediately. So, download it and address the topic impactfully.
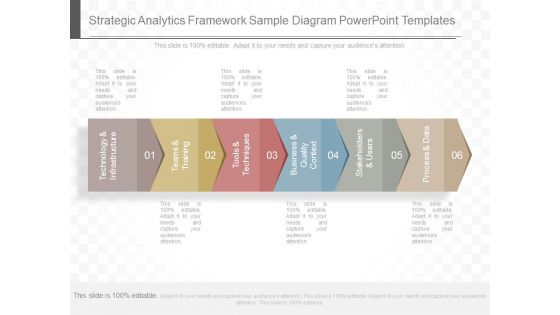
Strategic Analytics Framework Sample Diagram Powerpoint Templates
This is a strategic analytics framework sample diagram powerpoint templates. This is a six stage process. The stages in this process are technology and infrastructure, teams and training, tools and techniques, business and quality context, stakeholders and users, process and data.
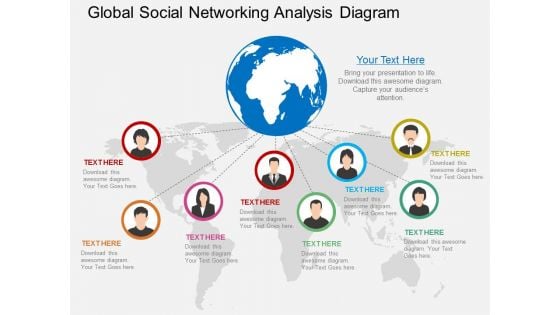
Global Social Networking Analysis Diagram Powerpoint Template
Our above PowerPoint slide contains diagram of globe with people pictures. Download this business slide to illustrate social networking. Use this diagram to impart more clarity to data and to create more sound impact on viewers.
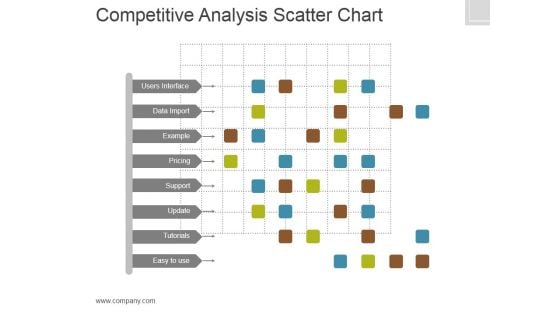
Competitive Analysis Template 6 Scatter Chart Ppt PowerPoint Presentation Slides
This is a competitive analysis template 6 scatter chart ppt powerpoint presentation slides. This is a eight stage process. The stages in this process are users interface, data import, example, pricing, support, update, tutorials, easy to use, table.
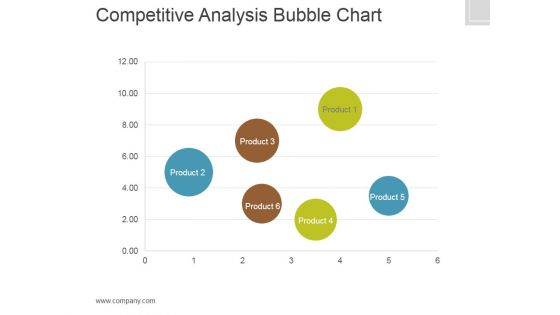
Competitive Analysis Template 7 Bubble Chart Ppt PowerPoint Presentation Deck
This is a competitive analysis template 7 bubble chart ppt powerpoint presentation deck. This is a six stage process. The stages in this process are users interface, data import, example, pricing, support, update, tutorials, easy to use, table.
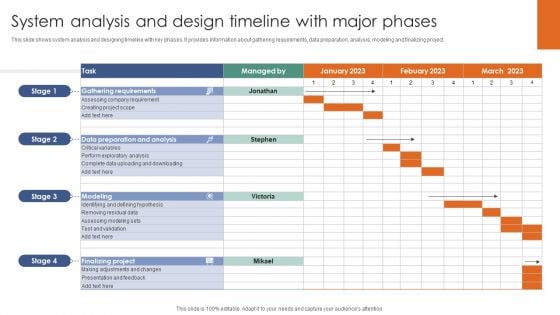
System Analysis And Design Timeline With Major Phases Ppt Pictures Slide Portrait PDF
This slide shows system analysis and designing timeline with key phases. It provides information about gathering requirements, data preparation, analysis, modeling and finalizing project. Showcasing this set of slides titled System Analysis And Design Timeline With Major Phases Ppt Pictures Slide Portrait PDF. The topics addressed in these templates are Modeling, Finalizing Project, Gathering Requirements. All the content presented in this PPT design is completely editable. Download it and make adjustments in color, background, font etc. as per your unique business setting.
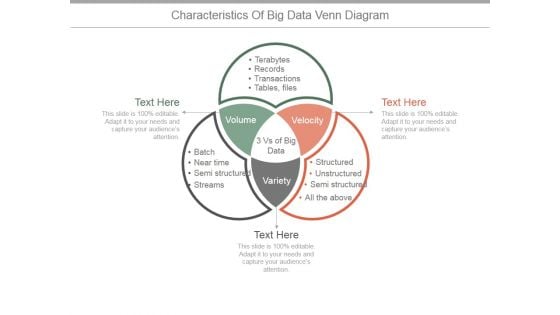
Characteristics Of Big Data Venn Diagram Ppt PowerPoint Presentation Example 2015
This is a characteristics of big data venn diagram ppt powerpoint presentation example 2015. This is a three stage process. The stages in this process are volume, velocity, variety, tables, files, transactions, records, terabytes.
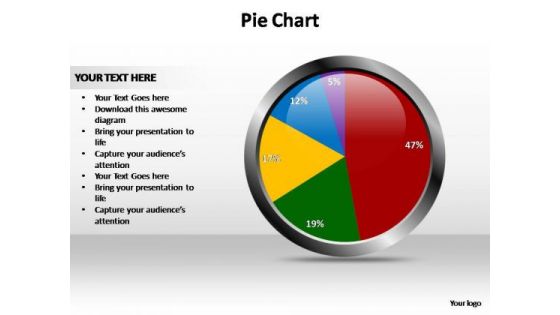
PowerPoint Theme Data Driven Pie Chart Ppt Design Slides
PowerPoint Theme Data Driven Pie Chart PPT Design Slides-The Circle of Life - a concept emmbedded in our minds and hence easy to comprehend. Life and Business is made up of processes comprising stages that flow from one to another. An excellent graphic to attract the attention of and understanding by your audience to improve earnings. Experience fame with our PowerPoint Theme Data Driven Pie Chart Ppt Design Slides. Absorb the adoration that will come your way.
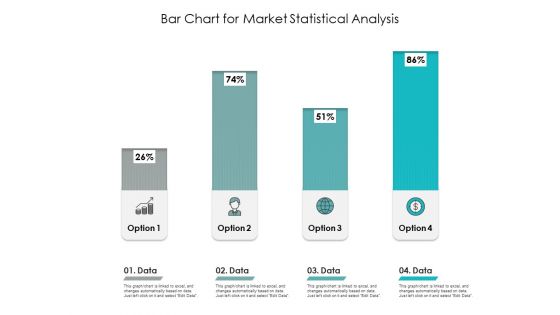
Bar Chart For Market Statistical Analysis Ppt PowerPoint Presentation Slides Good PDF
Presenting this set of slides with name bar chart for market statistical analysis ppt powerpoint presentation slides good pdf. The topics discussed in these slides are data, option, bar chart, market statistical, analysis. This is a completely editable PowerPoint presentation and is available for immediate download. Download now and impress your audience.
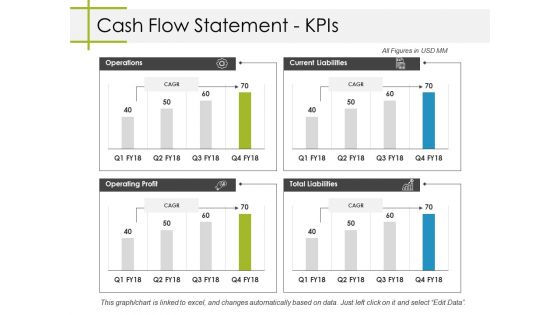
Cash Flow Statement Kpis Ppt PowerPoint Presentation Styles Themes
This is a cash flow statement kpis ppt powerpoint presentation styles themes. This is a four stage process. The stages in this process are business, operations, operating profit, total liabilities, current liabilities.

 Home
Home