Dashboard Icon
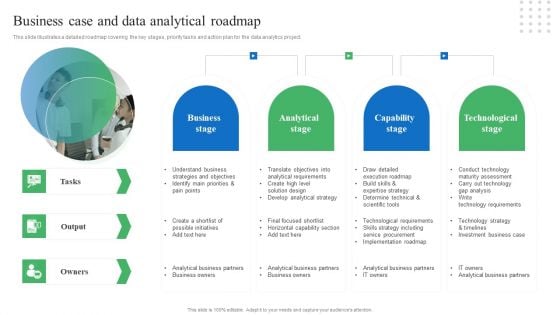
Toolkit For Data Science And Analytics Transition Business Case And Data Analytical Roadmap Professional PDF
This slide illustrates a detailed roadmap covering the key stages, priority tasks and action plan for the data analytics project. Do you know about Slidesgeeks Toolkit For Data Science And Analytics Transition Business Case And Data Analytical Roadmap Professional PDF These are perfect for delivering any kind od presentation. Using it, create PowerPoint presentations that communicate your ideas and engage audiences. Save time and effort by using our pre designed presentation templates that are perfect for a wide range of topic. Our vast selection of designs covers a range of styles, from creative to business, and are all highly customizable and easy to edit. Download as a PowerPoint template or use them as Google Slides themes.
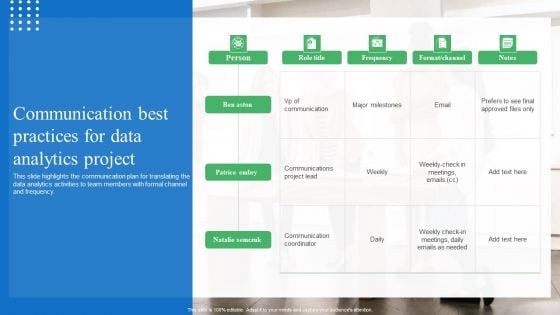
Toolkit For Data Science And Analytics Transition Communication Best Practices For Data Analytics Project Summary PDF
This slide highlights the communication plan for translating the data analytics activities to team members with formal channel and frequency. Do you know about Slidesgeeks Toolkit For Data Science And Analytics Transition Communication Best Practices For Data Analytics Project Summary PDF These are perfect for delivering any kind od presentation. Using it, create PowerPoint presentations that communicate your ideas and engage audiences. Save time and effort by using our pre designed presentation templates that are perfect for a wide range of topic. Our vast selection of designs covers a range of styles, from creative to business, and are all highly customizable and easy to edit. Download as a PowerPoint template or use them as Google Slides themes.
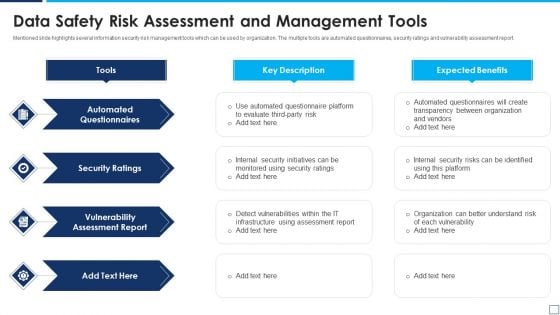
Data Safety Risk Assessment And Management Tools Demonstration PDF
Mentioned slide highlights several information security risk management tools which can be used by organization. The multiple tools are automated questionnaires, security ratings and vulnerability assessment report. Presenting data safety risk assessment and management tools demonstration pdf to dispense important information. This template comprises four stages. It also presents valuable insights into the topics including automated questionnaires, security ratings, vulnerability assessment report. This is a completely customizable PowerPoint theme that can be put to use immediately. So, download it and address the topic impactfully.

Enhance Profit Client Journey Analysis Customer Shopping Behavior Sample PDF
Track shoppers behavior during different days and weeks. If particular days are most profitable weekends for example marketing campaigns should exploit the data to increase revenue for the company. Deliver and pitch your topic in the best possible manner with this enhance profit client journey analysis customer shopping behavior sample pdf. Use them to share invaluable insights on purchase hour of the day value, purchase day of the week value, purchase day of the month value, purchase month of the year value and impress your audience. This template can be altered and modified as per your expectations. So, grab it now.
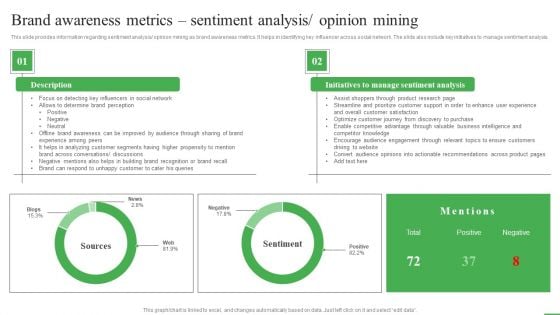
How To Boost Brand Recognition Brand Awareness Metrics Sentiment Analysis Diagrams PDF
This slide provides information regarding sentiment analysis or opinion mining as brand awareness metrics. It helps in identifying key influencer across social network. The slide also include key initiatives to manage sentiment analysis. Presenting this PowerPoint presentation, titled How To Boost Brand Recognition Brand Awareness Metrics Sentiment Analysis Diagrams PDF, with topics curated by our researchers after extensive research. This editable presentation is available for immediate download and provides attractive features when used. Download now and captivate your audience. Presenting this How To Boost Brand Recognition Brand Awareness Metrics Sentiment Analysis Diagrams PDF. Our researchers have carefully researched and created these slides with all aspects taken into consideration. This is a completely customizable How To Boost Brand Recognition Brand Awareness Metrics Sentiment Analysis Diagrams PDF that is available for immediate downloading. Download now and make an impact on your audience. Highlight the attractive features available with our PPTs.
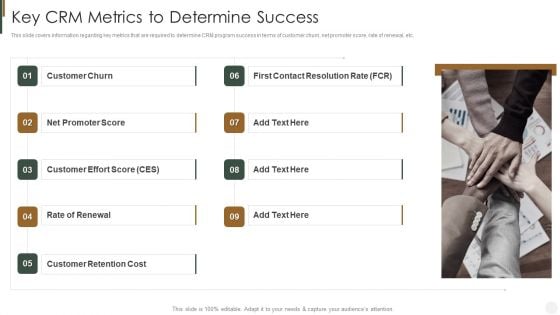
Key CRM Metrics To Determine Success Strategies To Improve Customer Themes PDF
This slide covers information regarding key metrics that are required to determine CRM program success in terms of customer churn, net promoter score, rate of renewal, etc. The best PPT templates are a great way to save time, energy, and resources. Slidegeeks have 100 precent editable powerpoint slides making them incredibly versatile. With these quality presentation templates, you can create a captivating and memorable presentation by combining visually appealing slides and effectively communicating your message. Download Key CRM Metrics To Determine Success Strategies To Improve Customer Themes PDF from Slidegeeks and deliver a wonderful presentation.
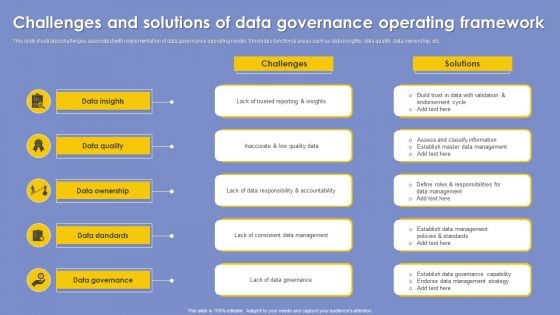
Challenges And Solutions Of Data Governance Operating Framework Rules PDF
This slide illustrates challenges associated with implementation of data governance operating model. It includes functional areas such as data insights, data quality, data ownership, etc. Presenting Challenges And Solutions Of Data Governance Operating Framework Rules PDF to dispense important information. This template comprises five stages. It also presents valuable insights into the topics including Data Insights, Data Quality, Data Ownership. This is a completely customizable PowerPoint theme that can be put to use immediately. So, download it and address the topic impactfully.
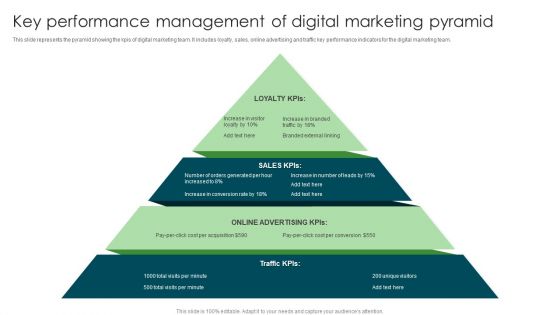
Key Performance Management Of Digital Marketing Pyramid Designs PDF
This slide represents the pyramid showing the kpis of digital marketing team. It includes loyalty, sales, online advertising and traffic key performance indicators for the digital marketing team. Presenting Key Performance Management Of Digital Marketing Pyramid Designs PDF to dispense important information. This template comprises three stages. It also presents valuable insights into the topics including Key Performance Management, Digital Marketing Pyramid. This is a completely customizable PowerPoint theme that can be put to use immediately. So, download it and address the topic impactfully.
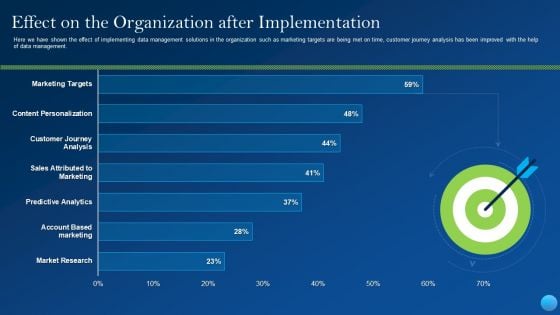
Effect On The Organization After Implementation Portrait PDF
Here we have shown the effect of implementing data management solutions in the organization such as marketing targets are being met on time, customer journey analysis has been improved with the help of data management.Deliver an awe inspiring pitch with this creative effect on the organization after implementation portrait pdf bundle. Topics like market research, account based marketing, predictive analytics can be discussed with this completely editable template. It is available for immediate download depending on the needs and requirements of the user.
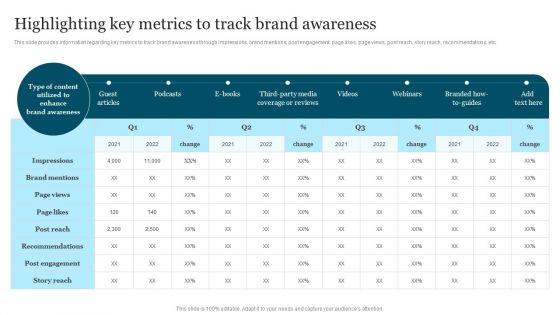
Improving Brand Recognition To Boost Highlighting Key Metrics To Track Brand Themes PDF
This slide provides information regarding key metrics to track brand awareness through impressions, brand mentions, post engagement, page likes, page views, post reach, story reach, recommendations, etc. This modern and well-arranged Improving Brand Recognition To Boost Highlighting Key Metrics To Track Brand Themes PDF provides lots of creative possibilities. It is very simple to customize and edit with the Powerpoint Software. Just drag and drop your pictures into the shapes. All facets of this template can be edited with Powerpoint, no extra software is necessary. Add your own material, put your images in the places assigned for them, adjust the colors, and then you can show your slides to the world, with an animated slide included.
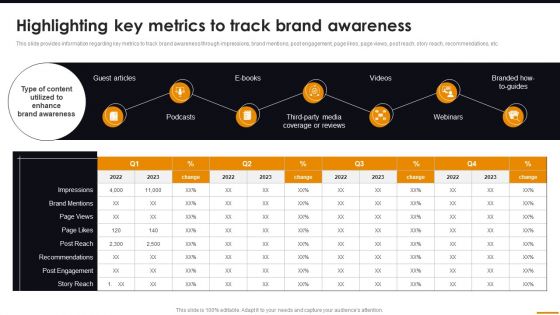
Highlighting Key Metrics To Track Brand Awareness Comprehensive Guide For Brand Recognition Themes PDF
This slide provides information regarding key metrics to track brand awareness through impressions, brand mentions, post engagement, page likes, page views, post reach, story reach, recommendations, etc. This modern and well-arranged Highlighting Key Metrics To Track Brand Awareness Comprehensive Guide For Brand Recognition Themes PDF provides lots of creative possibilities. It is very simple to customize and edit with the Powerpoint Software. Just drag and drop your pictures into the shapes. All facets of this template can be edited with Powerpoint no extra software is necessary. Add your own material, put your images in the places assigned for them, adjust the colors, and then you can show your slides to the world, with an animated slide included.
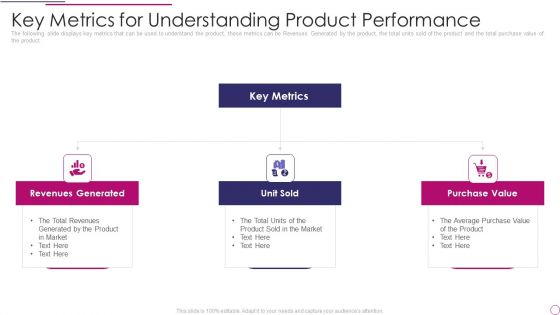
Performance Analysis Of New Product Development Key Metrics For Understanding Product Performance Themes PDF
The following slide displays key metrics that can be used to understand the product, these metrics can be Revenues Generated by the product, the total units sold of the product and the total purchase value of the product. This is a performance analysis of new product development key metrics for understanding product performance themes pdf template with various stages. Focus and dispense information on three stages using this creative set, that comes with editable features. It contains large content boxes to add your information on topics like revenues generated, unit sold, purchase value. You can also showcase facts, figures, and other relevant content using this PPT layout. Grab it now.
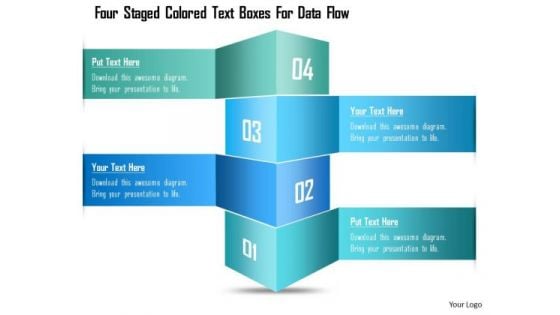
Business Diagram Four Staged Colored Text Boxes For Data Flow Presentation Template
Four staged colored text boxes are used to craft this power point template. This PPT contains the concept of data flow and its techniques. Use this PPT for your data related topics in any presentation.
Growth Stage In Product Lifecycle With Tracking Kpis Diagrams PDF
This slide covers summary of growth stage in PLC to provide insights on KPIs essential for tracking product. It includes tracking KPIs. Want to ace your presentation in front of a live audience Our Growth Stage In Product Lifecycle With Tracking Kpis Diagrams PDF can help you do that by engaging all the users towards you. Slidegeeks experts have put their efforts and expertise into creating these impeccable powerpoint presentations so that you can communicate your ideas clearly. Moreover, all the templates are customizable, and easy to edit and downloadable. Use these for both personal and commercial use.
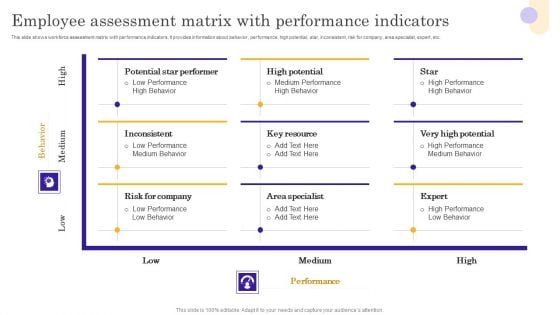
Vendor Performance Assessment Matrix With Scoring Metrics Infographics PDF
This slide shows workforce assessment matrix with performance indicators. It provides information about behavior, performance, high potential, star, inconsistent, risk for company, area specialist, expert, etc. Showcasing this set of slides titled Vendor Performance Assessment Matrix With Scoring Metrics Infographics PDF. The topics addressed in these templates are Potential Star Performer, High Potential, Inconsistent. All the content presented in this PPT design is completely editable. Download it and make adjustments in color, background, font etc. as per your unique business setting.
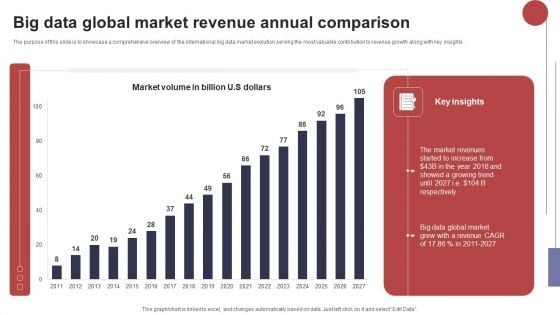
Big Data Global Market Revenue Annual Comparison Structure PDF
The purpose of this slide is to showcase a comprehensive overview of the international big data market evolution serving the most valuable contribution to revenue growth along with key insights. Pitch your topic with ease and precision using this Big Data Global Market Revenue Annual Comparison Structure PDF. This layout presents information on Market Revenues, Global Market, Growing Trend. It is also available for immediate download and adjustment. So, changes can be made in the color, design, graphics or any other component to create a unique layout.
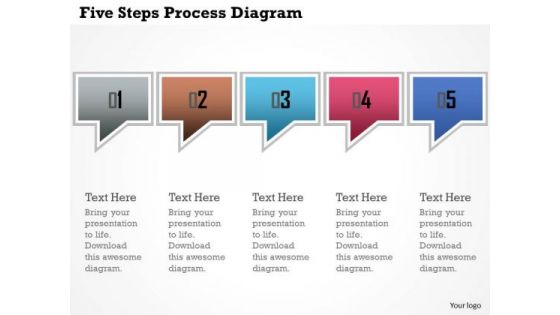
Business Diagram Five Steps Process Diagram Presentation Template
This power point template has been crafted with graphic of five dialogue boxes. This PPT contains the concept of text and data representation. Use this PPT for your business and marketing related presentations.
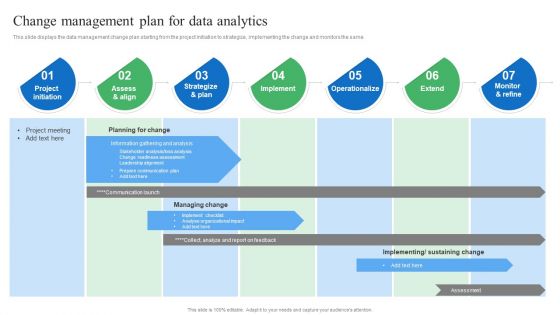
Toolkit For Data Science And Analytics Transition Change Management Plan For Data Analytics Structure PDF
This slide displays the data management change plan starting from the project initiation to strategize, implementing the change and monitors the same. Do you know about Slidesgeeks Toolkit For Data Science And Analytics Transition Change Management Plan For Data Analytics Structure PDF These are perfect for delivering any kind od presentation. Using it, create PowerPoint presentations that communicate your ideas and engage audiences. Save time and effort by using our pre designed presentation templates that are perfect for a wide range of topic. Our vast selection of designs covers a range of styles, from creative to business, and are all highly customizable and easy to edit. Download as a PowerPoint template or use them as Google Slides themes.
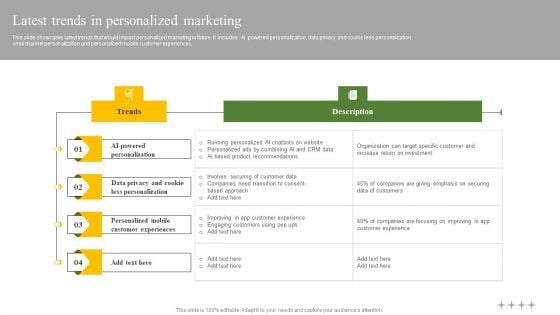
Latest Trends In Personalized Marketing Ppt Layouts Template PDF
This slide showcases latest trends that would impact personalized marketing in future. It includes AI powered personalization, data privacy and cookie less personalization, omnichannel personalization and personalized mobile customer experiences. Whether you have daily or monthly meetings, a brilliant presentation is necessary. Latest Trends In Personalized Marketing Ppt Layouts Template PDF can be your best option for delivering a presentation. Represent everything in detail using Latest Trends In Personalized Marketing Ppt Layouts Template PDF and make yourself stand out in meetings. The template is versatile and follows a structure that will cater to your requirements. All the templates prepared by Slidegeeks are easy to download and edit. Our research experts have taken care of the corporate themes as well. So, give it a try and see the results.
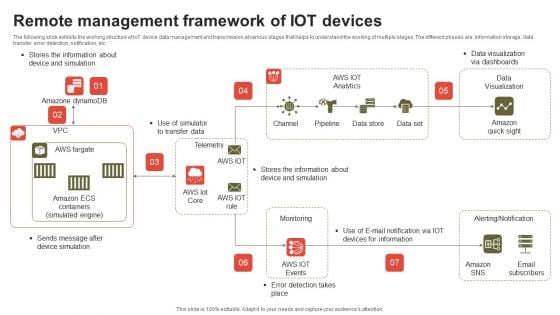
Remote Management Framework Of IOT Devices Rules PDF
The following slide exhibits the working structure of IoT device data management and transmission at various stages that helps to understand the working of multiple stages. The different phases are information storage, data transfer, error detection, notification, etc. Showcasing this set of slides titled Remote Management Framework Of IOT Devices Rules PDF. The topics addressed in these templates are Monitoring, Data Visualization, Aws Lot Analytics. All the content presented in this PPT design is completely editable. Download it and make adjustments in color, background, font etc. as per your unique business setting.
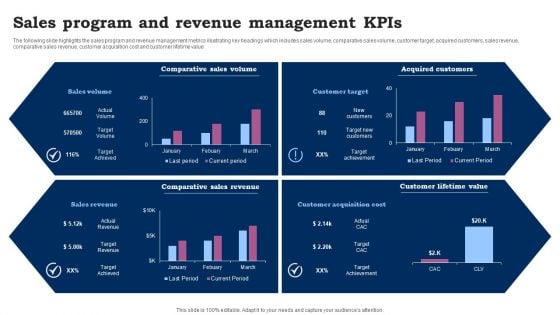
Sales Program And Revenue Management Kpis Ppt Outline Slide Download PDF
The following slide highlights the sales program and revenue management metrics illustrating key headings which includes sales volume, comparative sales volume, customer target, acquired customers, sales revenue, comparative sales revenue, customer acquisition cost and customer lifetime value. Showcasing this set of slides titled Sales Program And Revenue Management Kpis Ppt Outline Slide Download PDF. The topics addressed in these templates are Comparative Sales Volume, Acquired Customers, Comparative Sales Revenue. All the content presented in this PPT design is completely editable. Download it and make adjustments in color, background, font etc. as per your unique business setting.
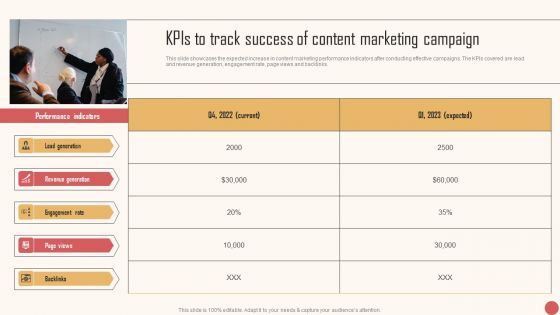
Kpis To Track Success Of Content Marketing Campaign Diagrams PDF
This slide showcases the expected increase in content marketing performance indicators after conducting effective campaigns. The KPIs covered are lead and revenue generation, engagement rate, page views and backlinks. Formulating a presentation can take up a lot of effort and time, so the content and message should always be the primary focus. The visuals of the PowerPoint can enhance the presenters message, so our Kpis To Track Success Of Content Marketing Campaign Diagrams PDF was created to help save time. Instead of worrying about the design, the presenter can concentrate on the message while our designers work on creating the ideal templates for whatever situation is needed. Slidegeeks has experts for everything from amazing designs to valuable content, we have put everything into Kpis To Track Success Of Content Marketing Campaign Diagrams PDF.
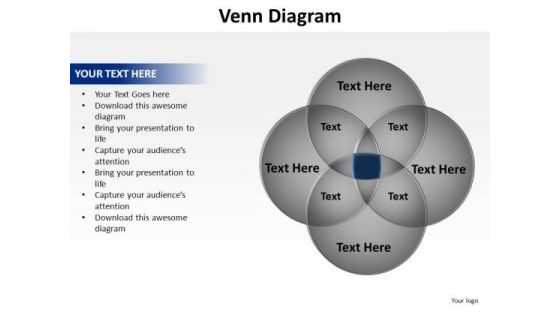
PowerPoint Layout Graphic Venn Diagram Ppt Template
PowerPoint Layout Graphic Venn Diagram PPT Template Business Power Points-The Venn graphic comprising interlinking circles geometrically demonstrate how various functions operating independently, to a large extent, are essentially interdependent. Amplify on this basic corporate concept and forefront the benefits of overlapping processes to arrive at common goals.-These amazing PowerPoint pre-designed slides and PowerPoint templates have been carefully created by our team of experts to help you impress your audience. Our stunning collection of Powerpoint slides are 100% editable and can easily fit in any PowerPoint presentations. By using these animations and graphics in PowerPoint and you can easily make professional presentations. Any text can be entered at any point in the PowerPoint template or slide. Just DOWNLOAD our awesome PowerPoint templates and you are ready to go. Put up the facts and figures on our PowerPoint Layout Graphic Venn Diagram Ppt Template. Display the data for everyone's consumption.
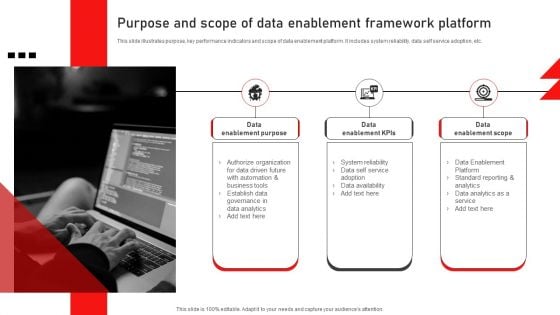
Purpose And Scope Of Data Enablement Framework Platform Demonstration PDF
This slide illustrates purpose, key performance indicators and scope of data enablement platform. It includes system reliability, data self service adoption, etc. Presenting Purpose And Scope Of Data Enablement Framework Platform Demonstration PDF to dispense important information. This template comprises three stages. It also presents valuable insights into the topics including Data Enablement Purpose, Data Enablement Kpis, Data Enablement Scope. This is a completely customizable PowerPoint theme that can be put to use immediately. So, download it and address the topic impactfully.
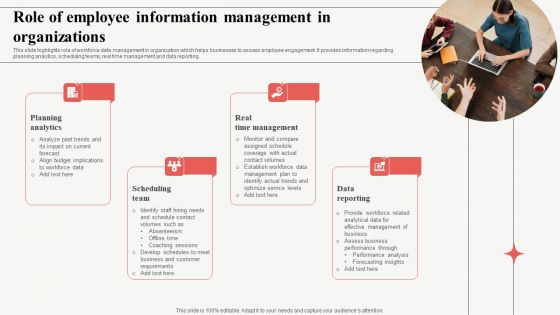
Role Of Employee Information Management In Organizations Themes PDF
This slide highlights role of workforce data management in organization which helps businesses to assess employee engagement. It provides information regarding planning analytics, scheduling teams, real time management and data reporting. Persuade your audience using this Role Of Employee Information Management In Organizations Themes PDF. This PPT design covers four stages, thus making it a great tool to use. It also caters to a variety of topics including Planning Analytics, Scheduling Team, Real Time Management. Download this PPT design now to present a convincing pitch that not only emphasizes the topic but also showcases your presentation skills.
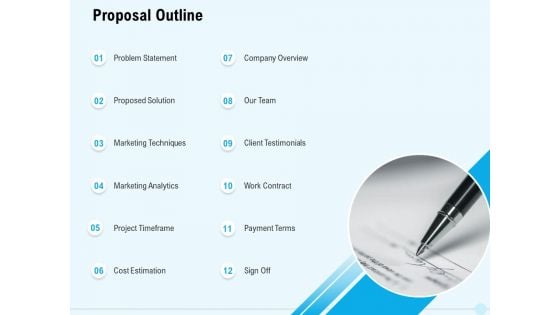
Business Commodity Market KPIS Proposal Proposal Outline Terms Diagrams PDF
Presenting this set of slides with name business commodity market kpis proposal proposal outline terms diagrams pdf. This is a twelve stage process. The stages in this process are problem statement, proposed solution, marketing techniques, marketing analytics, project timeframe. This is a completely editable PowerPoint presentation and is available for immediate download. Download now and impress your audience.
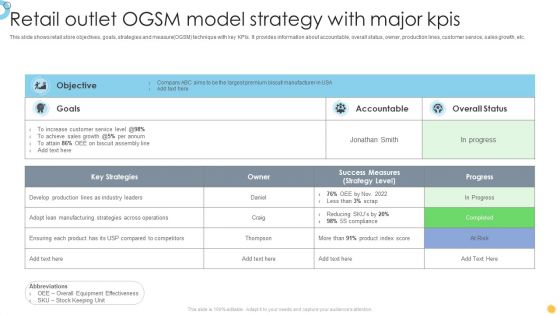
Retail Outlet OGSM Model Strategy With Major Kpis Diagrams PDF
Showcasing this set of slides titled Retail Outlet OGSM Model Strategy With Major Kpis Diagrams PDF. The topics addressed in these templates are Develop Production, Lines As Industry, Leaders. All the content presented in this PPT design is completely editable. Download it and make adjustments in color, background, font etc. as per your unique business setting.
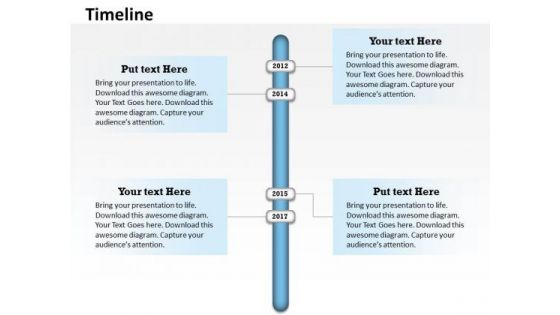
Business Diagram Annual Data On Timeline Roadmap Diagram Marketing Diagram
Analyze Ailments On Our Business Diagram Annual Data On Timeline Roadmap Diagram Marketing Diagram Powerpoint Templates. Bring Out The Thinking Doctor In You. Dock Your Thoughts With Our Business Diagram Annual Data On Timeline Roadmap Diagram Marketing Diagram Powerpoint Templates. They Will Launch Them Into Orbit.
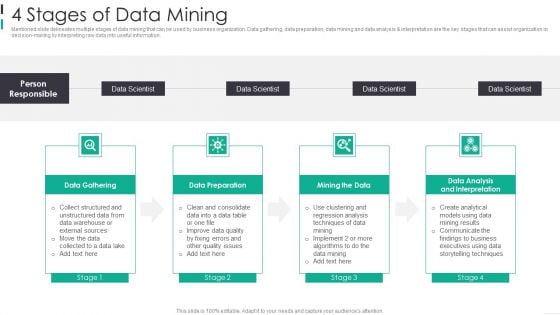
4 Stages Of Data Mining Infographics PDF
Mentioned slide delineates multiple stages of data mining that can be used by business organization. Data gathering, data preparation, data mining and data analysis and interpretation are the key stages that can assist organization in decision-making by interpreting raw data into useful information. Presenting 4 Stages Of Data Mining Infographics PDF to dispense important information. This template comprises four stages. It also presents valuable insights into the topics including Data Gathering, Data Preparation, Mining The Data This is a completely customizable PowerPoint theme that can be put to use immediately. So, download it and address the topic impactfully.
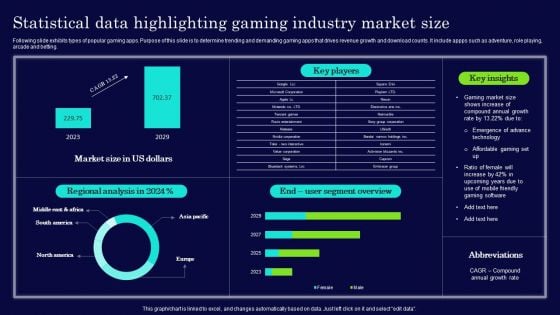
Statistical Data Highlighting Gaming Industry Market Size Ideas PDF
Following slide exhibits types of popular gaming apps. Purpose of this slide is to determine trending and demanding gaming apps that drives revenue growth and download counts. It include appps such as adventure, role playing, arcade and betting. Showcasing this set of slides titled Statistical Data Highlighting Gaming Industry Market Size Ideas PDF. The topics addressed in these templates are Statistical Data Highlighting, Gaming Industry Market Size. All the content presented in this PPT design is completely editable. Download it and make adjustments in color, background, font etc. as per your unique business setting.
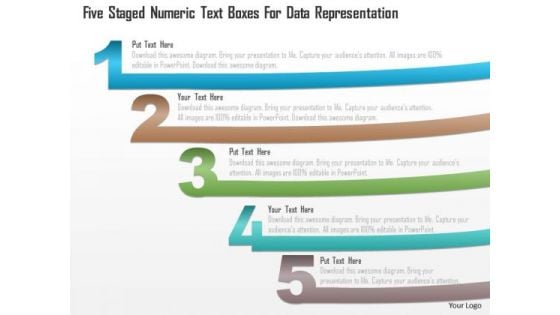
Business Diagram Five Staged Numeric Text Boxes For Data Representation PowerPoint Template
Five staged numeric text boxes diagram has been used to design this power point template. This diagram template contains the concept of data representation. Use this PPT for your business and marketing related presentations.
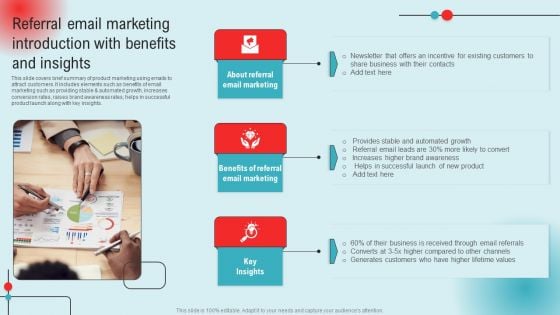
Referral Email Marketing Introduction With Benefits And Insights Ppt PowerPoint Presentation Diagram Images PDF
This slide covers brief summary of product marketing using emails to attract customers. It includes elements such as benefits of email marketing such as providing stable and automated growth, increases conversion rates, raises brand awareness rates, helps in successful product launch along with key insights. The Referral Email Marketing Introduction With Benefits And Insights Ppt PowerPoint Presentation Diagram Images PDF is a compilation of the most recent design trends as a series of slides. It is suitable for any subject or industry presentation, containing attractive visuals and photo spots for businesses to clearly express their messages. This template contains a variety of slides for the user to input data, such as structures to contrast two elements, bullet points, and slides for written information. Slidegeeks is prepared to create an impression.
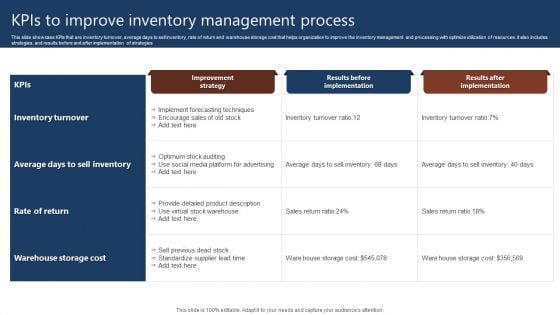
Kpis To Improve Inventory Management Process Diagrams PDF
This slide showcase KPIs that are inventory turnover, average days to sell inventory, rate of return and warehouse storage cost that helps organization to improve the inventory management and processing with optimize utilization of resources. It also includes strategies, and results before and after implementation of strategies. Showcasing this set of slides titled Kpis To Improve Inventory Management Process Diagrams PDF. The topics addressed in these templates are Inventory Turnover, Results Before Implementation, Improvement Strategy. All the content presented in this PPT design is completely editable. Download it and make adjustments in color, background, font etc. as per your unique business setting.
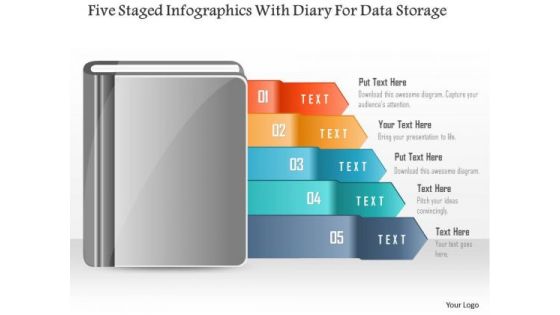
Five Staged Infographics With Diary For Data Storage PowerPoint Template
Five staged info graphic with diary has been used to design this power point template. This PPT contains the concept of data flow. Use this PPT diagram to represent the marketing and business data in any presentation.
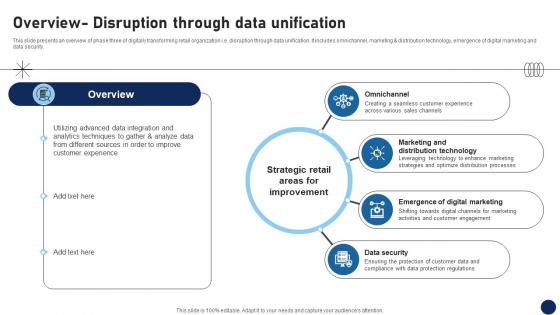
Overview Disruption Through Data Unification DT SS V
This slide presents an overview of phase three of digitally transforming retail organization i.e. disruption through data unification. It includes omnichannel, marketing and distribution technology, emergence of digital marketing and data security.If you are looking for a format to display your unique thoughts, then the professionally designed Overview Disruption Through Data Unification DT SS V is the one for you. You can use it as a Google Slides template or a PowerPoint template. Incorporate impressive visuals, symbols, images, and other charts. Modify or reorganize the text boxes as you desire. Experiment with shade schemes and font pairings. Alter, share or cooperate with other people on your work. Download Overview Disruption Through Data Unification DT SS V and find out how to give a successful presentation. Present a perfect display to your team and make your presentation unforgettable. This slide presents an overview of phase three of digitally transforming retail organization i.e. disruption through data unification. It includes omnichannel, marketing and distribution technology, emergence of digital marketing and data security.

Data Governance Steps Review Tools Setup Ppt PowerPoint Presentation Visual Aids Diagrams
This is a data governance steps review tools setup ppt powerpoint presentation visual aids diagrams. This is a five stage process. The stages in this process are data analysis, data review, data evaluation.
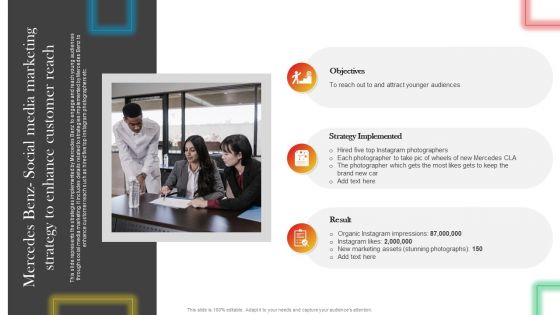
Mercedes Benz Social Media Marketing Strategy To Enhance Customer Reach Diagrams PDF
This slide represents the strategies implemented by Mercedes Benz to engage and reach young audiences through social media marketing. It includes details related to strategies implemented by Mercedes Benz to enhance customer reach such as hired five top Instagram photographers etc. The Mercedes Benz Social Media Marketing Strategy To Enhance Customer Reach Diagrams PDF is a compilation of the most recent design trends as a series of slides. It is suitable for any subject or industry presentation, containing attractive visuals and photo spots for businesses to clearly express their messages. This template contains a variety of slides for the user to input data, such as structures to contrast two elements, bullet points, and slides for written information. Slidegeeks is prepared to create an impression.
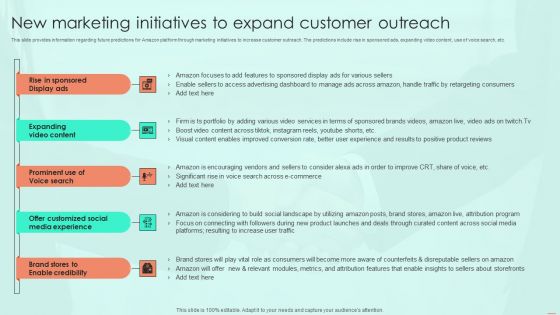
New Marketing Initiatives To Expand Customer Outreach Ppt PowerPoint Presentation File Diagrams PDF
This slide provides information regarding future predictions for Amazon platform through marketing initiatives to increase customer outreach. The predictions include rise in sponsored ads, expanding video content, use of voice search, etc. The New Marketing Initiatives To Expand Customer Outreach Ppt PowerPoint Presentation File Diagrams PDF is a compilation of the most recent design trends as a series of slides. It is suitable for any subject or industry presentation, containing attractive visuals and photo spots for businesses to clearly express their messages. This template contains a variety of slides for the user to input data, such as structures to contrast two elements, bullet points, and slides for written information. Slidegeeks is prepared to create an impression.

Business Diagram Film Roll Design Displaying Five Steps Presentation Template
Graphic of five staged film roll diagram has been used to craft this power point template diagram. This PPT contains the concept of data representation. Use this PPT for business and marketing data related presentations.

Five Years Data Analytics Career Roadmap For Chief Scientist Microsoft
We present our five years data analytics career roadmap for chief scientist microsoft. This PowerPoint layout is easy-to-edit so you can change the font size, font type, color, and shape conveniently. In addition to this, the PowerPoint layout is Google Slides compatible, so you can share it with your audience and give them access to edit it. Therefore, download and save this well-researched five years data analytics career roadmap for chief scientist microsoft in different formats like PDF, PNG, and JPG to smoothly execute your business plan.
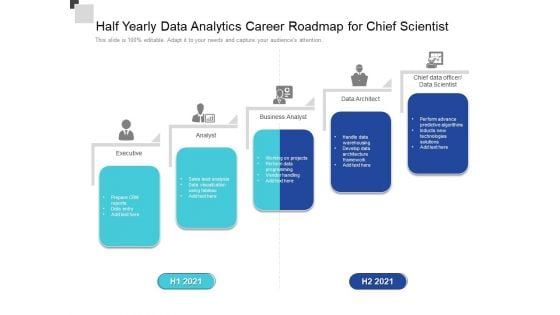
Half Yearly Data Analytics Career Roadmap For Chief Scientist Download
We present our half yearly data analytics career roadmap for chief scientist download. This PowerPoint layout is easy-to-edit so you can change the font size, font type, color, and shape conveniently. In addition to this, the PowerPoint layout is Google Slides compatible, so you can share it with your audience and give them access to edit it. Therefore, download and save this well-researched half yearly data analytics career roadmap for chief scientist download in different formats like PDF, PNG, and JPG to smoothly execute your business plan.
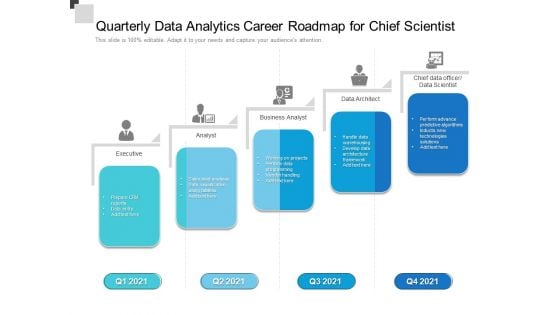
Quarterly Data Analytics Career Roadmap For Chief Scientist Infographics
We present our quarterly data analytics career roadmap for chief scientist infographics. This PowerPoint layout is easy-to-edit so you can change the font size, font type, color, and shape conveniently. In addition to this, the PowerPoint layout is Google Slides compatible, so you can share it with your audience and give them access to edit it. Therefore, download and save this well-researched quarterly data analytics career roadmap for chief scientist infographics in different formats like PDF, PNG, and JPG to smoothly execute your business plan.
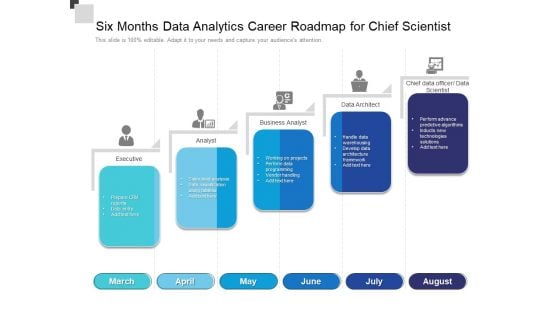
Six Months Data Analytics Career Roadmap For Chief Scientist Portrait
We present our six months data analytics career roadmap for chief scientist portrait. This PowerPoint layout is easy-to-edit so you can change the font size, font type, color, and shape conveniently. In addition to this, the PowerPoint layout is Google Slides compatible, so you can share it with your audience and give them access to edit it. Therefore, download and save this well-researched six months data analytics career roadmap for chief scientist portrait in different formats like PDF, PNG, and JPG to smoothly execute your business plan.
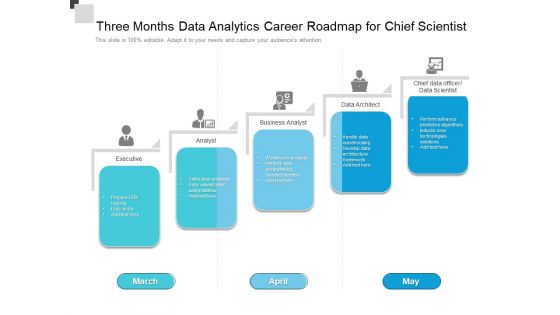
Three Months Data Analytics Career Roadmap For Chief Scientist Graphics
We present our three months data analytics career roadmap for chief scientist graphics. This PowerPoint layout is easy-to-edit so you can change the font size, font type, color, and shape conveniently. In addition to this, the PowerPoint layout is Google Slides compatible, so you can share it with your audience and give them access to edit it. Therefore, download and save this well-researched three months data analytics career roadmap for chief scientist graphics in different formats like PDF, PNG, and JPG to smoothly execute your business plan.
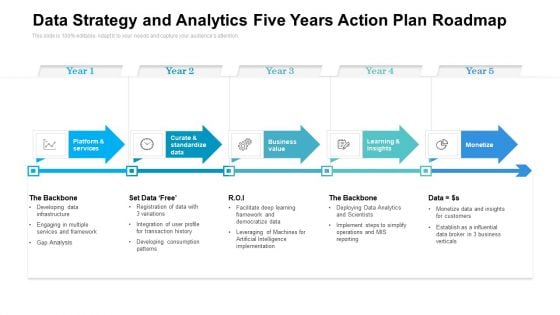
Data Strategy And Analytics Five Years Action Plan Roadmap Graphics
We present our data strategy and analytics five years action plan roadmap graphics. This PowerPoint layout is easy to edit so you can change the font size, font type, color, and shape conveniently. In addition to this, the PowerPoint layout is Google Slides compatible, so you can share it with your audience and give them access to edit it. Therefore, download and save this well researched data strategy and analytics five years action plan roadmap graphics in different formats like PDF, PNG, and JPG to smoothly execute your business plan.
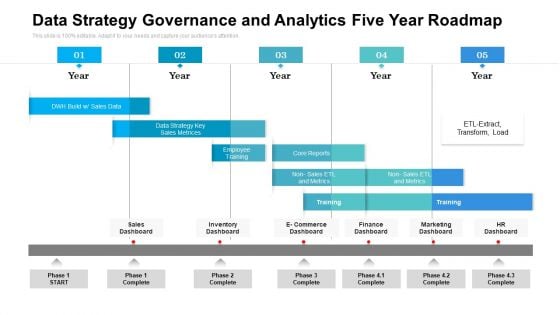
Data Strategy Governance And Analytics Five Year Roadmap Portrait
We present our data strategy governance and analytics five year roadmap portrait. This PowerPoint layout is easy to edit so you can change the font size, font type, color, and shape conveniently. In addition to this, the PowerPoint layout is Google Slides compatible, so you can share it with your audience and give them access to edit it. Therefore, download and save this well researched data strategy governance and analytics five year roadmap portrait in different formats like PDF, PNG, and JPG to smoothly execute your business plan.

Multistep Strategy Data Analytics Five Year Roadmap Demonstration
We present our multistep strategy data analytics five year roadmap demonstration. This PowerPoint layout is easy to edit so you can change the font size, font type, color, and shape conveniently. In addition to this, the PowerPoint layout is Google Slides compatible, so you can share it with your audience and give them access to edit it. Therefore, download and save this well researched multistep strategy data analytics five year roadmap demonstration in different formats like PDF, PNG, and JPG to smoothly execute your business plan.
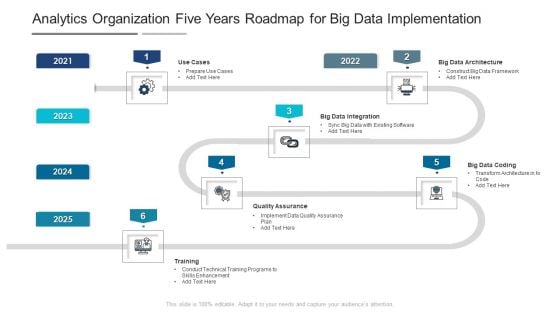
Analytics Organization Five Years Roadmap For Big Data Implementation Portrait
We present our analytics organization five years roadmap for big data implementation portrait. This PowerPoint layout is easy to edit so you can change the font size, font type, color, and shape conveniently. In addition to this, the PowerPoint layout is Google Slides compatible, so you can share it with your audience and give them access to edit it. Therefore, download and save this well researched analytics organization five years roadmap for big data implementation portrait in different formats like PDF, PNG, and JPG to smoothly execute your business plan.
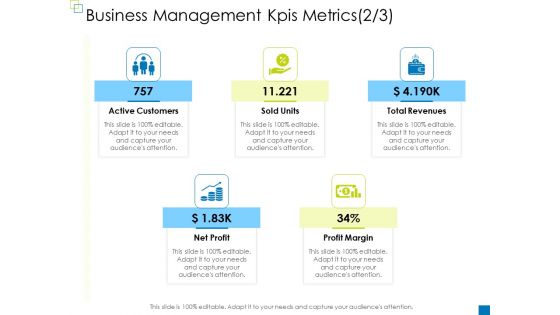
Enterprise Management Business Management Kpis Metrics Net Diagrams PDF
Presenting enterprise management business management kpis metrics net diagrams pdf to provide visual cues and insights. Share and navigate important information on five stages that need your due attention. This template can be used to pitch topics like active customers, total revenues, net profit, profit margin, sold units. In addition, this PPT design contains high-resolution images, graphics, etc, that are easily editable and available for immediate download.
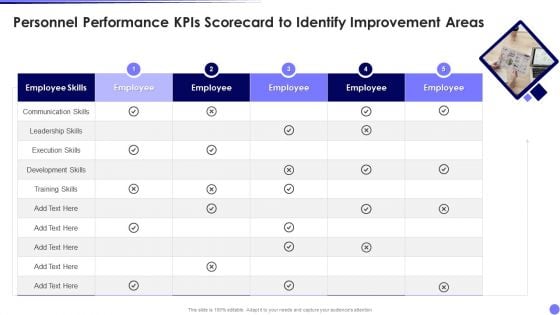
Personnel Performance Kpis Scorecard To Identify Improvement Areas Diagrams PDF
Persuade your audience using this Personnel Performance Kpis Scorecard To Identify Improvement Areas Diagrams PDF. This PPT design covers five stages, thus making it a great tool to use. It also caters to a variety of topics including Employee Skills, Communication Skills, Leadership Skills. Download this PPT design now to present a convincing pitch that not only emphasizes the topic but also showcases your presentation skills.
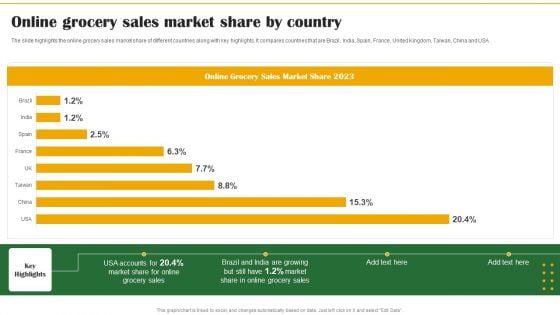
Food Organization Financial Trends Online Grocery Sales Market Share By Country Mockup PDF
The slide highlights the online grocery sales market share of different countries along with key highlights. It compares countries that are Brazil, India, Spain, France, United Kingdom, Taiwan, China and USA. The Food Organization Financial Trends Online Grocery Sales Market Share By Country Mockup PDF is a compilation of the most recent design trends as a series of slides. It is suitable for any subject or industry presentation, containing attractive visuals and photo spots for businesses to clearly express their messages. This template contains a variety of slides for the user to input data, such as structures to contrast two elements, bullet points, and slides for written information. Slidegeeks is prepared to create an impression.
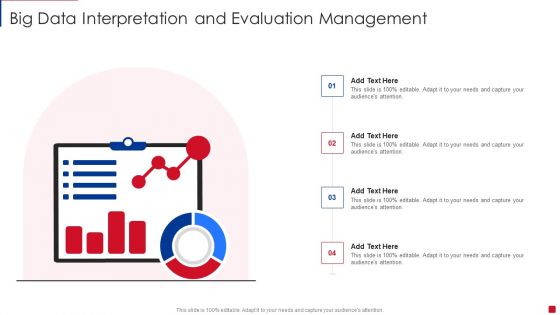
Big Data Interpretation And Evaluation Management Demonstration PDF
Presenting Big Data Interpretation And Evaluation Management Demonstration PDF to dispense important information. This template comprises four stages. It also presents valuable insights into the topics including Evaluation Management, Big Data Interpretation. This is a completely customizable PowerPoint theme that can be put to use immediately. So, download it and address the topic impactfully.

Directors Creating Strategies With Enterprise Financial Data Slides PDF
Presenting Directors Creating Strategies With Enterprise Financial Data Slides PDF to dispense important information. This template comprises Three stages. It also presents valuable insights into the topics including Directors Creating Strategies, Enterprise Financial Data. This is a completely customizable PowerPoint theme that can be put to use immediately. So, download it and address the topic impactfully.
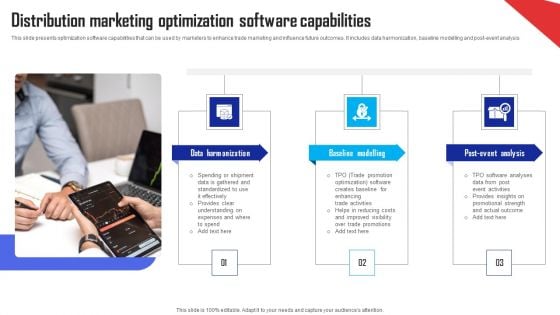
Distribution Marketing Optimization Software Capabilities Ppt Diagrams
This slide presents optimization software capabilities that can be used by marketers to enhance trade marketing and influence future outcomes. It includes data harmonization, baseline modelling and post event analysis Persuade your audience using this Distribution Marketing Optimization Software Capabilities Ppt Diagrams. This PPT design covers three stages, thus making it a great tool to use. It also caters to a variety of topics including Data Harmonization, Baseline Modelling, Post Event Analysis. Download this PPT design now to present a convincing pitch that not only emphasizes the topic but also showcases your presentation skills.
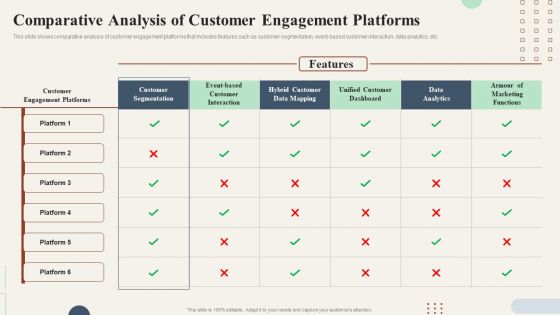
Action Plan To Enhance Comparative Analysis Of Customer Engagement Platforms Themes PDF
This slide shows comparative analysis of customer engagement platforms that includes features such as customer segmentation, event-based customer interaction, data analytics, etc. Do you have to make sure that everyone on your team knows about any specific topic I yes, then you should give Action Plan To Enhance Comparative Analysis Of Customer Engagement Platforms Themes PDF a try. Our experts have put a lot of knowledge and effort into creating this impeccable Action Plan To Enhance Comparative Analysis Of Customer Engagement Platforms Themes PDF. You can use this template for your upcoming presentations, as the slides are perfect to represent even the tiniest detail. You can download these templates from the Slidegeeks website and these are easy to edit. So grab these today
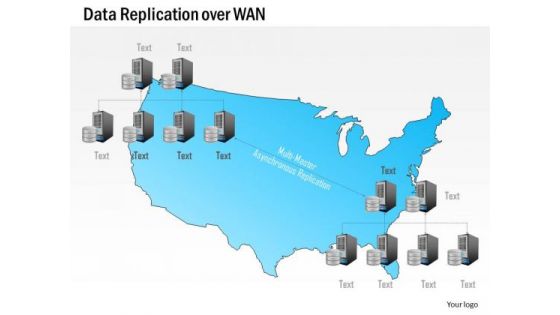
Business Diagram Data Replication Over Wan Wide Area Network Geographic Locations Ppt Slide
This technology diagram has been designed with graphic of map and wide area network. This professional slide helps to depict the concept of data replication over the wide area network. This diagram slide can be used for data networking related topics.
Business Diagram Human Hand With Credit Card Text Boxes For Data Representation Ppt Template
This power point template has been crafted with graphic of human hand and credit card style text boxes. his PPT diagram contains the concept of data representation. This PPT is suitable for your business and marketing presentations.
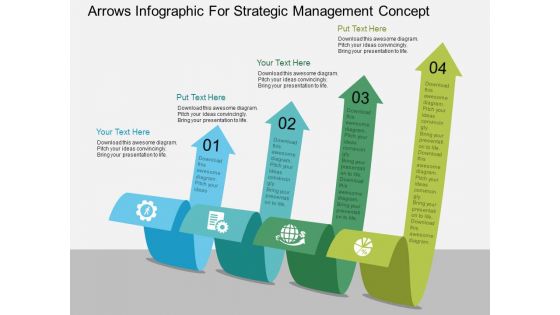
Arrows Infographic For Strategic Management Concept Powerpoint Template
Our above PPT slide contains four curved arrows infographic design. This business diagram helps to depict business information for strategic management. Use this diagram to impart more clarity to data and to create more sound impact on viewers.
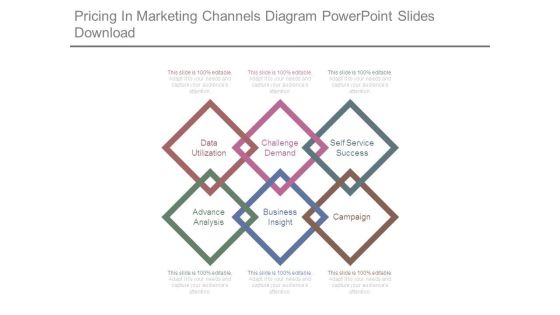
Pricing In Marketing Channels Diagram Powerpoint Slides Download
This is a pricing in marketing channels diagram powerpoint slides download. This is a six stage process. The stages in this process are data utilization, challenge demand, self service success, advance analysis, business insight, campaign.

Financial Report Business PowerPoint Themes And PowerPoint Slides 0511
Microsoft PowerPoint Slide and Theme with arrow pointing to the higher financial chart bar Our content has been profitable for millions. Join the party with our Financial Report Business PowerPoint Themes And PowerPoint Slides 0511. You'll always stay ahead of the game.

 Home
Home